Influence of Elemental Carbon (EC) Coating Covering nc-(Ti,Mo)C Particles on the Microstructure and Properties of Titanium Matrix Composites Prepared by Reactive Spark Plasma Sintering

 ,
,  , , , ,
  , , and
Abstract
:1. Introduction
2. Materials and Methods
2.1. Preparation of Titanium Composites
2.2. Structural Characterization
2.3. Mechanical and Corrosion Tests
3. Results and Discussion
4. Conclusions
Author Contributions
Funding
Institutional Review Board Statement
Informed Consent Statement
Data Availability Statement
Conflicts of Interest
References
- Zhang, E.; Zeng, G.; Zeng, S. Effect of in situ TiB short fibre on oxidation behavior of Ti-6Al-1.2B alloy. J. Scr. Mater. 2002, 46, 811–816. [Google Scholar] [CrossRef]
- Zhang, E.; Zeng, G.; Zeng, S. Oxidation behavior of in situ TiB short fibre reinforced Ti-6Al-1.2B alloy in air. J. Mater. Sci. 2002, 37, 4063–4071. [Google Scholar] [CrossRef]
- Qin, Y.; Lu, W.; Zhang, D.; Qin, J.; Ji, B. Oxidation of in situ synthesized TiC particle-reinforced titanium matrix composites. Mater. Sci. Eng. A 2005, 404, 42–48. [Google Scholar] [CrossRef]
- Qin, Y.; Zhang, D.; Lu, W.; Pan, W. A new high-temperature, oxidation-resistant in situ TiB and TiC reinforced Ti6242 alloy. J. Alloys Compd. 2008, 455, 369–375. [Google Scholar] [CrossRef]
- Ranganath, S. A Review on Particulate-Reinforced Titanium Matrix Composites. J. Mater. Sci. 1997, 32, 1–16. [Google Scholar]
- Takahashi, N.; Sato, T.; Nakatsuka, S.; Fujiwara, K.; Yokozekii, K. Titanium Metal Matrix Composite Development for Commercial Aircraft Landing Gear Structure. In Proceedings of the 28th International Congress of the Aeronautical Sciences 2012, Brisbane, QLD, Australia, 23–28 September 2012; Available online: http://www.icas.org/ICAS_ARCHIVE/ICAS2012/PAPERS/037.PDF (accessed on 2 September 2020).
- Lino Alves, F.J.; Baptista, A.M.; Marques, A.T. Metal and ceramic matrix composites in aerospace engineering. In Advanced Composite Materials for Aerospace Engineering: Processing, Properties and Applications; Rana, S., Fangueiro, R., Eds.; Elsevier: Duxford, UK, 2016; pp. 59–99. [Google Scholar] [CrossRef]
- Ma, F.; Shi, Z.; Liua, P.; Li, W.; Liu, X.; Chen, X.; He, D.; Zhang, K.; Pan, D.; Zhang, D. Strengthening effect of in situ TiC particles in Ti matrix composite at temperature range for hot working. Mater. Charact. 2016, 120, 304–310. [Google Scholar] [CrossRef]
- Ma, F.; Zhou, J.; Liu, P.; Li, W.; Liu, X.; Pan, D.; Lu, W.; Zhang, D.; Wu, L.; Wie, X. Strengthening effects of TiC particles and microstructure refinement in in situ TiC-reinforced Ti matrix composites. Mater. Charact. 2017, 127, 27–34. [Google Scholar] [CrossRef]
- Yu, H.L.; Zhang, W.; Wang, H.M.; Ji, X.C.; Song, Z.Y.; Li, X.Y.; Xu, B.S. In-situ synthesis of TiC/Ti composite coating by high frequency induction cladding. J. Alloys Compd. 2017, 701, 244–255. [Google Scholar] [CrossRef] [Green Version]
- Cruz, S.; Rey, P.; Cabeza, M.; Lieblich, M.; Merino, P. Effect of the TiC particle size on the extrusion of 7075 aluminium matrix composite. In Proceedings of the 16th European Conference on Composite Materials, Seville, Spain, 22–26 June 2014. [Google Scholar]
- Gu, D.D.; Hagedorn, Y.C.; Meiners, W.; Wissenbach, K.; Poprawe, R. Nanocrystalline TiC reinforced Ti matrix bulk-form nanocomposites by Selective Laser Melting (SLM): Densification, growth mechanism and wear behavior. Compos. Sci. Technol. 2011, 71, 1612–1620. [Google Scholar] [CrossRef]
- Gu, D.; Meng, G.; Li, C.; Meiners, W.; Poprawe, R. Selective laser melting of TiC/Ti bulk nanocomposites: Influence of nanoscale reinforcement. Scr. Mater. 2012, 67, 185–188. [Google Scholar] [CrossRef]
- Tjong, S.C. Novel nanoparticle-reinforced metal matrix composites with enhanced mechanical properties. Adv. Eng. Mater. 2007, 9, 639–652. [Google Scholar] [CrossRef]
- Vreeling, J.A.; Ocelík, V.; de Hosson, J.T.M. Ti–6Al–4V strengthened by laser melt injection of WCp particles. Acta Mater. 2002, 50, 4913–4924. [Google Scholar] [CrossRef]
- Shi, J.M.; Zhang, L.X.; Chang, Q.; Sun, Z.; Feng, J.C.; Ma, N. Improving the strength of the ZrC-SiC and TC4 brazed joint through fabricating graded double-layered composite structure on TC4 surface. Metall. Mater. Trans. B 2018, 49, 902–911. [Google Scholar] [CrossRef]
- Fellah, M.; Hezil, N.; Samad, M.A.; Djellabi, R.; Montagne, A.; Mejias, A.; Kossman, S.; Iost, A.; Purnama, A.; Obrosov, A.; et al. Effect of Molybdenum content on structural, mechanical, and tribological properties of hot isostatically pressed β-type titanium alloys for orthopedic applications. J. Mater. Eng. Perform. 2019, 29, 5988–5999. [Google Scholar] [CrossRef]
- Zhang, X.; Liu, N.; Rong, C. Effect of molybdenum content on the microstructure and mechanical properties of ultra-fine Ti(C, N) based cermets. Mater. Charact. 2008, 59, 1690–1696. [Google Scholar] [CrossRef]
- Xu, S.; Zhou, C.; Liu, Y.; Liu, B.; Li, K. Microstructure and mechanical properties of Ti-15Mo-xTiC composites fabricated by in-situ reactive sintering and hot swaging. J. Alloys Compd. 2018, 738, 188–196. [Google Scholar] [CrossRef]
- Li, S.; Yang, Y.; Misra, R.D.K.; Liu, Y.; Ye, D.; Hu, C.; Xiang, M. Interfacial/intragranular reinforcement of titanium-matrix composites produced by a novel process involving core-shell structured powder. Carbon 2020, 164, 378–390. [Google Scholar] [CrossRef]
- Yanbin, L.; Yong, L.; Zhongwei, Z.; Yanhui, C. Effect of addition of metal carbide on the oxidation behaviors of titanium matrix composites. J. Alloys Compd. 2014, 599, 188–194. [Google Scholar] [CrossRef]
- Figiel, P.; Biedunkiewicz, A.; Biedunkiewicz, W.; Grzesiak, D.; Pawlyta, M. Corrosion characteristics of composites of (Mo,Ti)C/Ti and TiC/Ti type manufactured with SLM technique. Arch. Metall. Mater. 2019, 64, 1617–1625. [Google Scholar] [CrossRef]
- Cavaliere, P.; Sadeghi, B.; Shabani, A. Spark Plasma Sintering: Process Fundamentals. In Spark Plasma Sintering of Materials; Cavaliere, P., Ed.; Springer: Cham, Switherlands, 2019. [Google Scholar] [CrossRef]
- Chaudhari, R.; Bauri, R. Microstructure and mechanical properties of titanium processed by Spark Plasma Sintering (SPS). Metallogr. Microstruct. Anal. 2014, 3, 30–35. [Google Scholar] [CrossRef]
- Biedunkiewicz, A. Manufacturing of ceramic nanomaterials in Ti-Si-C-N system by sol-gel method. J. Sol-Gel Sci. Technol. 2011, 59, 448–455. [Google Scholar] [CrossRef]
- CasaXPS: Processing Software for XPS, AES, SIMS and More, Copyright © 2009 Casa Software Ltd. Available online: http://www.casaxps.com (accessed on 3 September 2020).
- Moulder, J.F.; Stickle, W.F.; Sobol, P.E.; Bomben, K.D. Handbook of X-ray Photoelectron Spectroscopy; Chastain, J., Ed.; Perkin-Elmer Corporation: Eden Prairie, MN, USA, 1992; pp. 40–195. [Google Scholar]
- Wagner, C.D.; Naumkin, A.V.; Kraut-Vass, A.; Allison, J.W.; Powell, C.J.; Rumble, J.R., Jr. NIST Standard Reference Database 20, Version 3.4. 2003. Available online: http://srdata.nist.gov/xps (accessed on 3 September 2020).
- Oliver, W.C.; Pharr, G.M. An improved technique for determining hardness and elastic modulus using load and displacement sensing indentation experiments. J. Mater. Res. 1992, 7, 1564–1583. [Google Scholar] [CrossRef]
- Evans, A.G.; Charles, E.A. Fracture toughness determinations by indentation. J. Am. Ceram. Soc. 1976, 59, 371–372. [Google Scholar] [CrossRef]
- Zhang, S.; Sun, D.; Fu, Y.; Du, H. Toughness measurement of thin films: A critical review. Surf. Coat. Technol. 2005, 198, 74–84. [Google Scholar] [CrossRef]
- Shim, J.-H.; Oh, C.-S.; Lee, D.N. A thermodynamic evaluation of the Ti-Mo-C system. Metall. Mater. Trans. B 1996, 27, 955–966. [Google Scholar] [CrossRef]
- Wang, Z.H.; Li, D.; Geng, D.Y.; Ma, S.; Liu, W.; Zhang, Z.D. The characterizations of superconducting MoC/Mo2C nanocomposites embedded in a magnetic graphite matrix. Phys. Status. Solidi A 2008, 205, 2919–2923. [Google Scholar] [CrossRef]
- Sathish, C.I.; Guo, Y.; Wang, X.; Tsujimoto, Y.; Li, J.; Zhang, S.; Matsushita, Y.; Shi, Y.; Tian, H.; Yang, H.; et al. Superconducting and structural properties of δ-MoC0.681 cubic molybdenum carbide phase. J. Solid State Chem. 2012, 196, 579–585. [Google Scholar] [CrossRef]
- Roine, A. HSC Chemistry Software, 5.0; Outokumpu Research Oy: Pori, Finland, 2002. [Google Scholar]
- Kurodab, P.A.B.; Buzalaf, M.A.R.; Grandini, C.R. Effect of molybdenum on structure, microstructure and mechanical properties of biomedical Ti-20Zr-Mo alloys. Mater. Sci. Eng. C 2016, 67, 511–515. [Google Scholar] [CrossRef] [Green Version]
- Davis, R.; Flower, H.M.; West, D.R.F. Martensitic transformations in Ti-Mo alloys. J. Mater. Sci. 1979, 14, 712–722. [Google Scholar] [CrossRef]
- Gabriel, S.B.; Dille, J.; Rezende, M.C.; Mei, P.; Almeida, L.H.; Nunes, C.A. Mechanical characterization of Ti-12Mo-13Nb alloy for biomedical application hot swaged and aged. Mater. Res. 2015, 18, 8–12. [Google Scholar] [CrossRef] [Green Version]
- Leyland, A.; Matthews, A. On the significance of the H/E ratio in wear control: A nanocomposite coating approach to optimised tribological behaviour. Wear 2000, 246, 1–11. [Google Scholar] [CrossRef]
- Musil, J. Hard and Superhard Nanocomposite Coatings. Surf. Coat. Technol. 2000, 125, 322–330. [Google Scholar] [CrossRef]
- Biesinger, M.C.; Lau, L.W.M.; Gerson, A.R.; Smart, R.S.C. Resolving surface chemical states in XPS analysis of first row transition metals, oxides and hydroxides: Sc, Ti, V.; Cu and Zn. Appl. Surf. Sci. 2010, 257, 887–898. [Google Scholar] [CrossRef]
- Li, Y.; Hu, Y.; Shen, J.; Jiang, H.; Min, G.; Qiu, S.; Song, Z.; Sun, Z.; Li, C. Rapid flame synthesis of internal Mo6+ doped TiO2 nanocrystals insitu decorated with highly dispersed MoO3 clusters for lithium ion storage. Nanoscale 2015, 7, 18603–18611. [Google Scholar] [CrossRef]
- Baltrusaitis, J.; Mendoza-Sanchez, B.; Fernandez, V.; Veenstra, R.; Dukstiene, N.; Roberts, A.; Fairley, N. Generalized molybdenum oxide surface chemical state XPS determination via informed amorphous sample model. Appl. Surf. Sci. 2015, 326, 151–161. [Google Scholar] [CrossRef]
- Kumaravel, V.; Rhatigan, S.; Mathew, S.; Michel, M.C.; Bartlett, J.; Nolan, M.; Hinder, S.J.; Gasco, A.; Ruiz-Palomar, C.; Hermosilla, D. Mo doped TiO2: Impact on oxygen vacancies, anatase phase stability and photocatalytic activity. J. Phys. Mater. 2020, 3. [Google Scholar] [CrossRef]
- Song, H.J.; Sung, M.-C.; Yoon, H.; Ju, B.; Kim, D.-W. Ultrafine α-phase molybdenum carbide decorated with platinum nanoparticles for efficient hydrogen production in acidic and alkaline media. Adv. Sci. 2019, 6. [Google Scholar] [CrossRef] [Green Version]
- Bao, Q.Y.; Yang, J.P.; Li, Y.Q.; Tang, J.X. Electronic structures of MoO3-based charge generation layer for tandem organic light-emitting diodes. Appl. Phys. Lett. 2010, 97, 063303. [Google Scholar] [CrossRef]


| # | Composite Type | Phase List | |||
|---|---|---|---|---|---|
| TiC, wt % | α-Ti, wt % | β-Ti, wt % | Mo, wt % | ||
| 1 | Ti + 10 wt % (Ti,Mo)C | 17 | 76 | 3 | 4 |
| 2 | Ti + 10 wt %(Ti,Mo)C/C | 79 | 14 | 3 | 4 |
| 3 | Ti + 20 wt % (Ti,Mo)C | 26 | 59 | 6 | 9 |
| 4 | Ti + 20 wt %(Ti,Mo)C/C | 83 | 1 | 7 | 9 |
| Material | I101/I002 α-Ti | Material | I200/I111 Carbides |
|---|---|---|---|
| cp-Ti | 6.2149 | TiMoC powder | 1.7611 |
| Ti + 10 wt %(Ti,Mo)C | 3.2847 | TiMoC/C powder | 1.5402 |
| Ti + 10 wt %(Ti,Mo)C/C | 2.4456 | Ti + 10 wt %(Ti,Mo)C | 0.8221 |
| Ti + 20 wt %(Ti,Mo)C | 2.8244 | Ti + 10 wt %(Ti,Mo)C/C | 1.0020 |
| Ti + 20 wt %(Ti,Mo)C/C | At the limit of detection in the XRD method | Ti + 20 wt %(Ti,Mo)C | 0.9768 |
| Ti + 20 wt %(Ti,Mo)C/C | 1.0940 |
| Material | Roughness (nm) | Standard Devation (nm) |
|---|---|---|
| cp-Ti | 71.55 | 38.90 |
| Ti-6Al-4V | 23.18 | 17.52 |
| Ti+10wt%(Ti,Mo)C | 45.03 | 32.33 |
| Ti+10wt%(Ti,Mo)C/C | 22.67 | 13.78 |
| Ti + 20 wt %(Ti,Mo)C | 51.45 | 21.29 |
| Ti + 20 wt %(Ti,Mo)C/C | 213.27 | 203.95 |
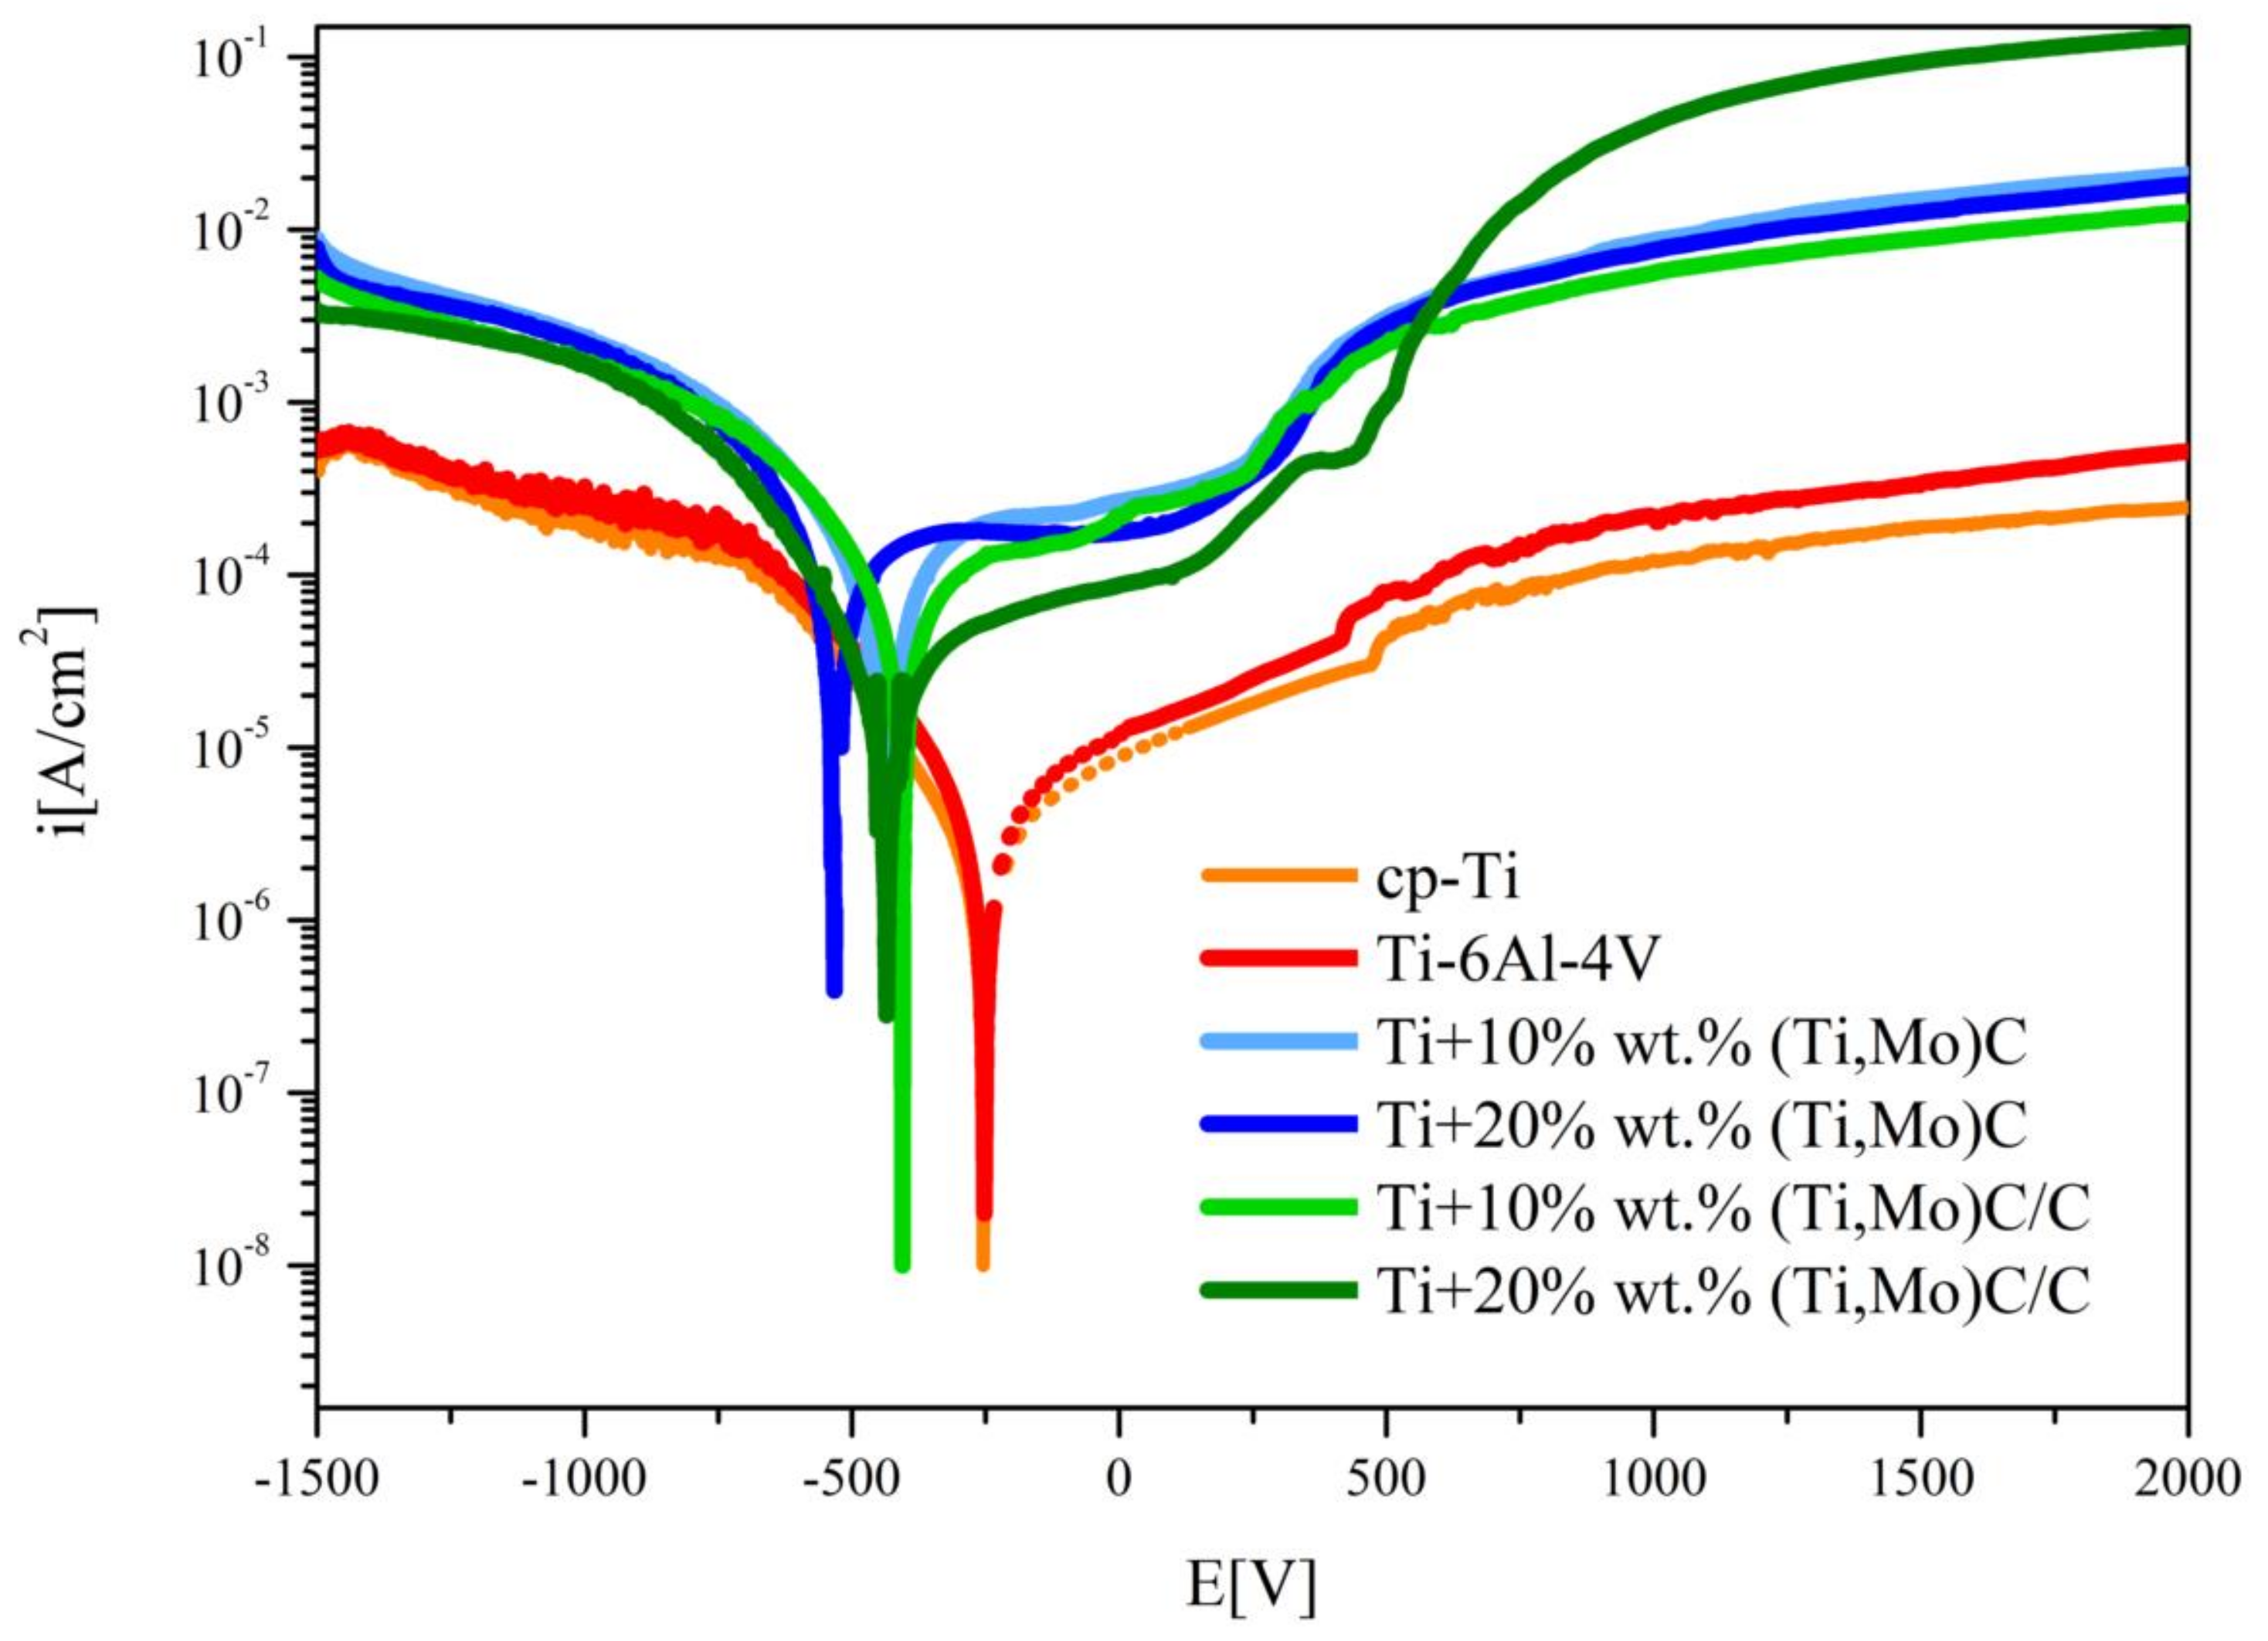
| Material | Ekor, (V) | icor (A/cm2) | Rpol (Ω/cm2) | Ba (V) | Bc (V) |
|---|---|---|---|---|---|
| cp-Ti | −0.254 | 0.40 × 10⁻⁶ | 29.1 × 10³ | 0.047 | 0.054 |
| Ti6Al4V | −0.252 | 0.40 × 10⁻⁶ | 21.6 × 10³ | 0.039 | 0.042 |
| Ti + 10%(Ti,Mo)C | −0.425 | 10.30 × 10⁻⁶ | 0.9 × 10³ | 0.041 | 0.044 |
| Ti + 10%(Ti,Mo)C/C | −0.405 | 6.20 × 10⁻⁶ | 1.2 × 10³ | 0.035 | 0.033 |
| Ti + 20%(Ti,Mo)C | −0.533 | 5.78 × 10⁻⁶ | 0.9 × 10³ | 0.021 | 0.030 |
| Ti + 20%(Ti,Mo)C/C | −0.433 | 2.40 × 10⁻⁶ | 3.3 × 10³ | 0.038 | 0.035 |
| # | Material | Ti (at.%) | Mo (at.%) | C (at.%) | O (at.%) | Mo/Ti | C/Ti | O/Ti |
|---|---|---|---|---|---|---|---|---|
| 1 | Ti + 10%TiMoC | 9.2 | 0.3 | 61.3 | 29.2 | 0.01 | 6.66 | 3.17 |
| 2 | Ti + 10%TiMoC/C | 11.5 | 0.2 | 49.9 | 38.4 | 0.02 | 4.34 | 3.34 |
| 3 | Ti + 20%TiMoC | 14.4 | 0.6 | 46.4 | 38.6 | 0.04 | 3.22 | 2.68 |
| 4 | Ti + 20%TiMoC/C | 13.2 | 0.2 | 49.9 | 36.6 | 0.02 | 3.78 | 2.77 |
Publisher’s Note: MDPI stays neutral with regard to jurisdictional claims in published maps and institutional affiliations. |
© 2021 by the authors. Licensee MDPI, Basel, Switzerland. This article is an open access article distributed under the terms and conditions of the Creative Commons Attribution (CC BY) license (http://creativecommons.org/licenses/by/4.0/).
Share and Cite
Biedunkiewicz, A.; Figiel, P.; Garbiec, D.; Obrosov, A.; Pawlyta, M.; Biedunkiewicz, W.; Pruss, P.; Rokosz, K.; Wróbel, R.; Raaen, S.; et al. Influence of Elemental Carbon (EC) Coating Covering nc-(Ti,Mo)C Particles on the Microstructure and Properties of Titanium Matrix Composites Prepared by Reactive Spark Plasma Sintering. Materials 2021, 14, 231. https://0-doi-org.brum.beds.ac.uk/10.3390/ma14010231
Biedunkiewicz A, Figiel P, Garbiec D, Obrosov A, Pawlyta M, Biedunkiewicz W, Pruss P, Rokosz K, Wróbel R, Raaen S, et al. Influence of Elemental Carbon (EC) Coating Covering nc-(Ti,Mo)C Particles on the Microstructure and Properties of Titanium Matrix Composites Prepared by Reactive Spark Plasma Sintering. Materials. 2021; 14(1):231. https://0-doi-org.brum.beds.ac.uk/10.3390/ma14010231
Chicago/Turabian StyleBiedunkiewicz, Anna, Paweł Figiel, Dariusz Garbiec, Aleksei Obrosov, Mirosława Pawlyta, Witold Biedunkiewicz, Przemysław Pruss, Krzysztof Rokosz, Rafał Wróbel, Steinar Raaen, and et al. 2021. "Influence of Elemental Carbon (EC) Coating Covering nc-(Ti,Mo)C Particles on the Microstructure and Properties of Titanium Matrix Composites Prepared by Reactive Spark Plasma Sintering" Materials 14, no. 1: 231. https://0-doi-org.brum.beds.ac.uk/10.3390/ma14010231