
Effects of Artificial Tooth Brushing and Hydrothermal Aging on the Mechanical Properties and Color Stability of Dental 3D Printed and CAD/CAM Materials


Abstract
:1. Introduction
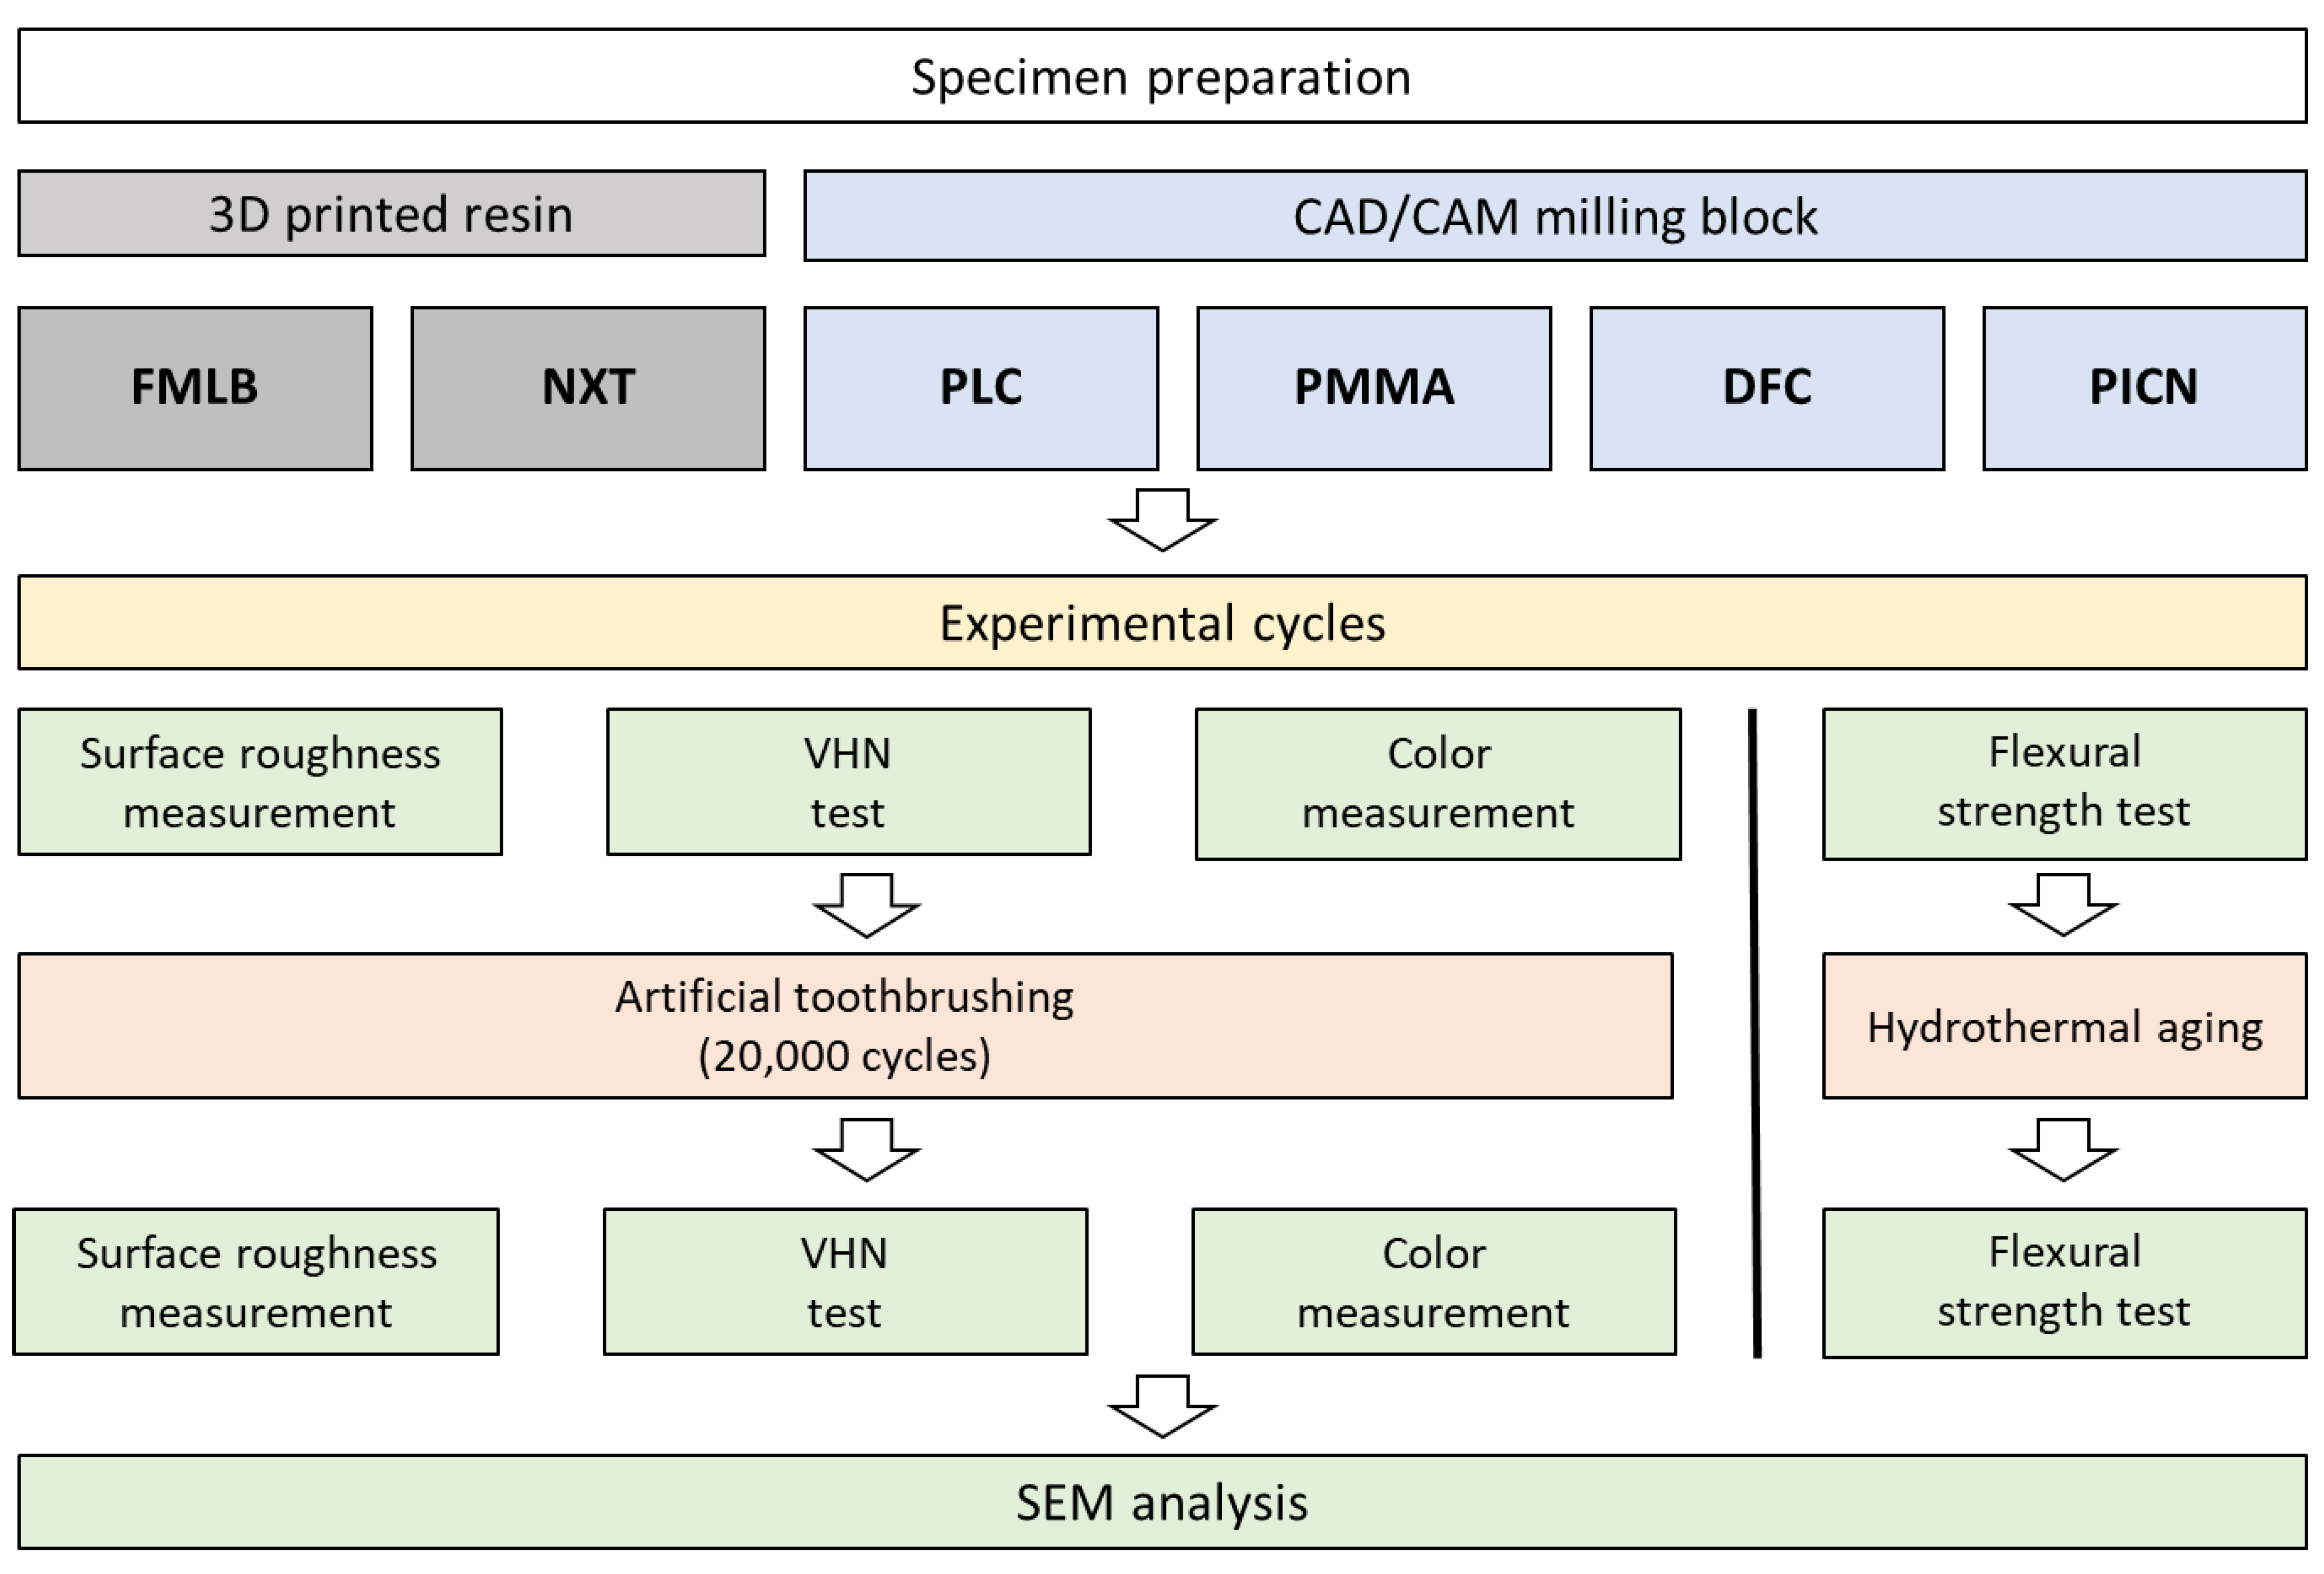
2. Materials and Methods
2.1. Specimen Preparation
2.2. Artificial Toothbrushing
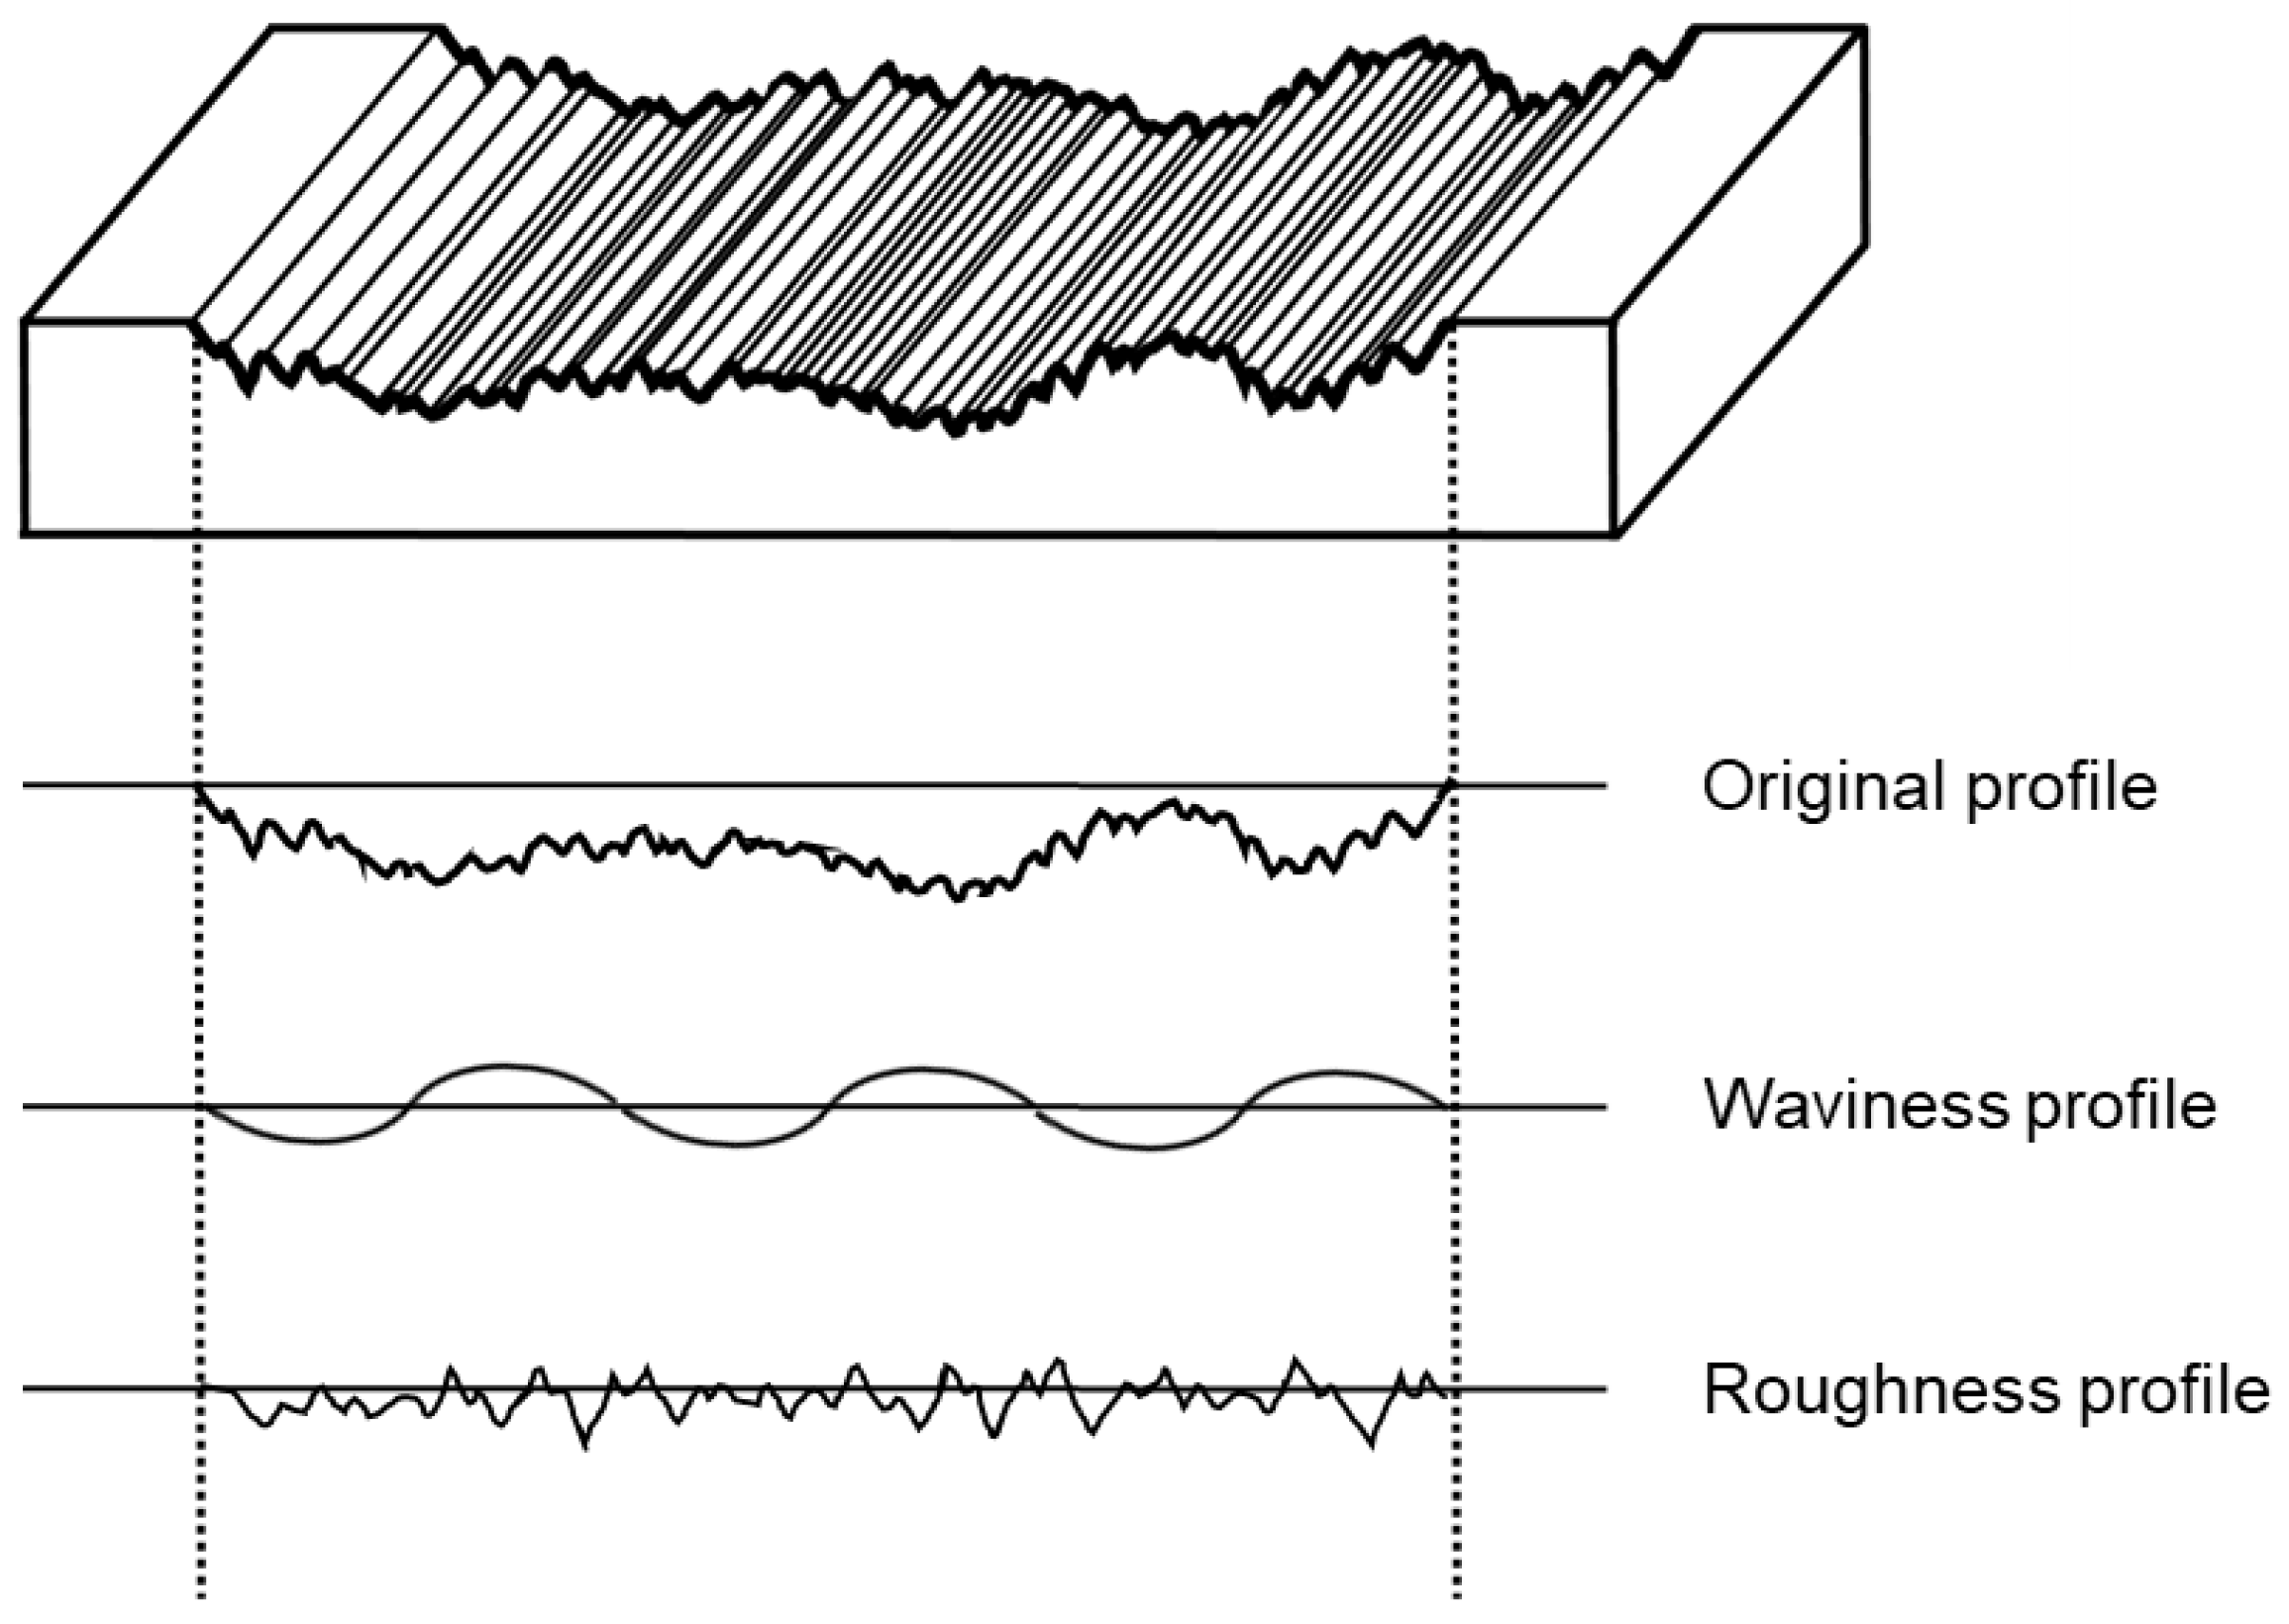
2.3. Surface Roughness and Surface Waviness Measurements
2.4. VHN Test
2.5. Color Measurement
2.6. Flexural Strength Test
2.7. Scanning Electron Microscopy (SEM) Observations
2.8. Statistical Analysis
3. Results
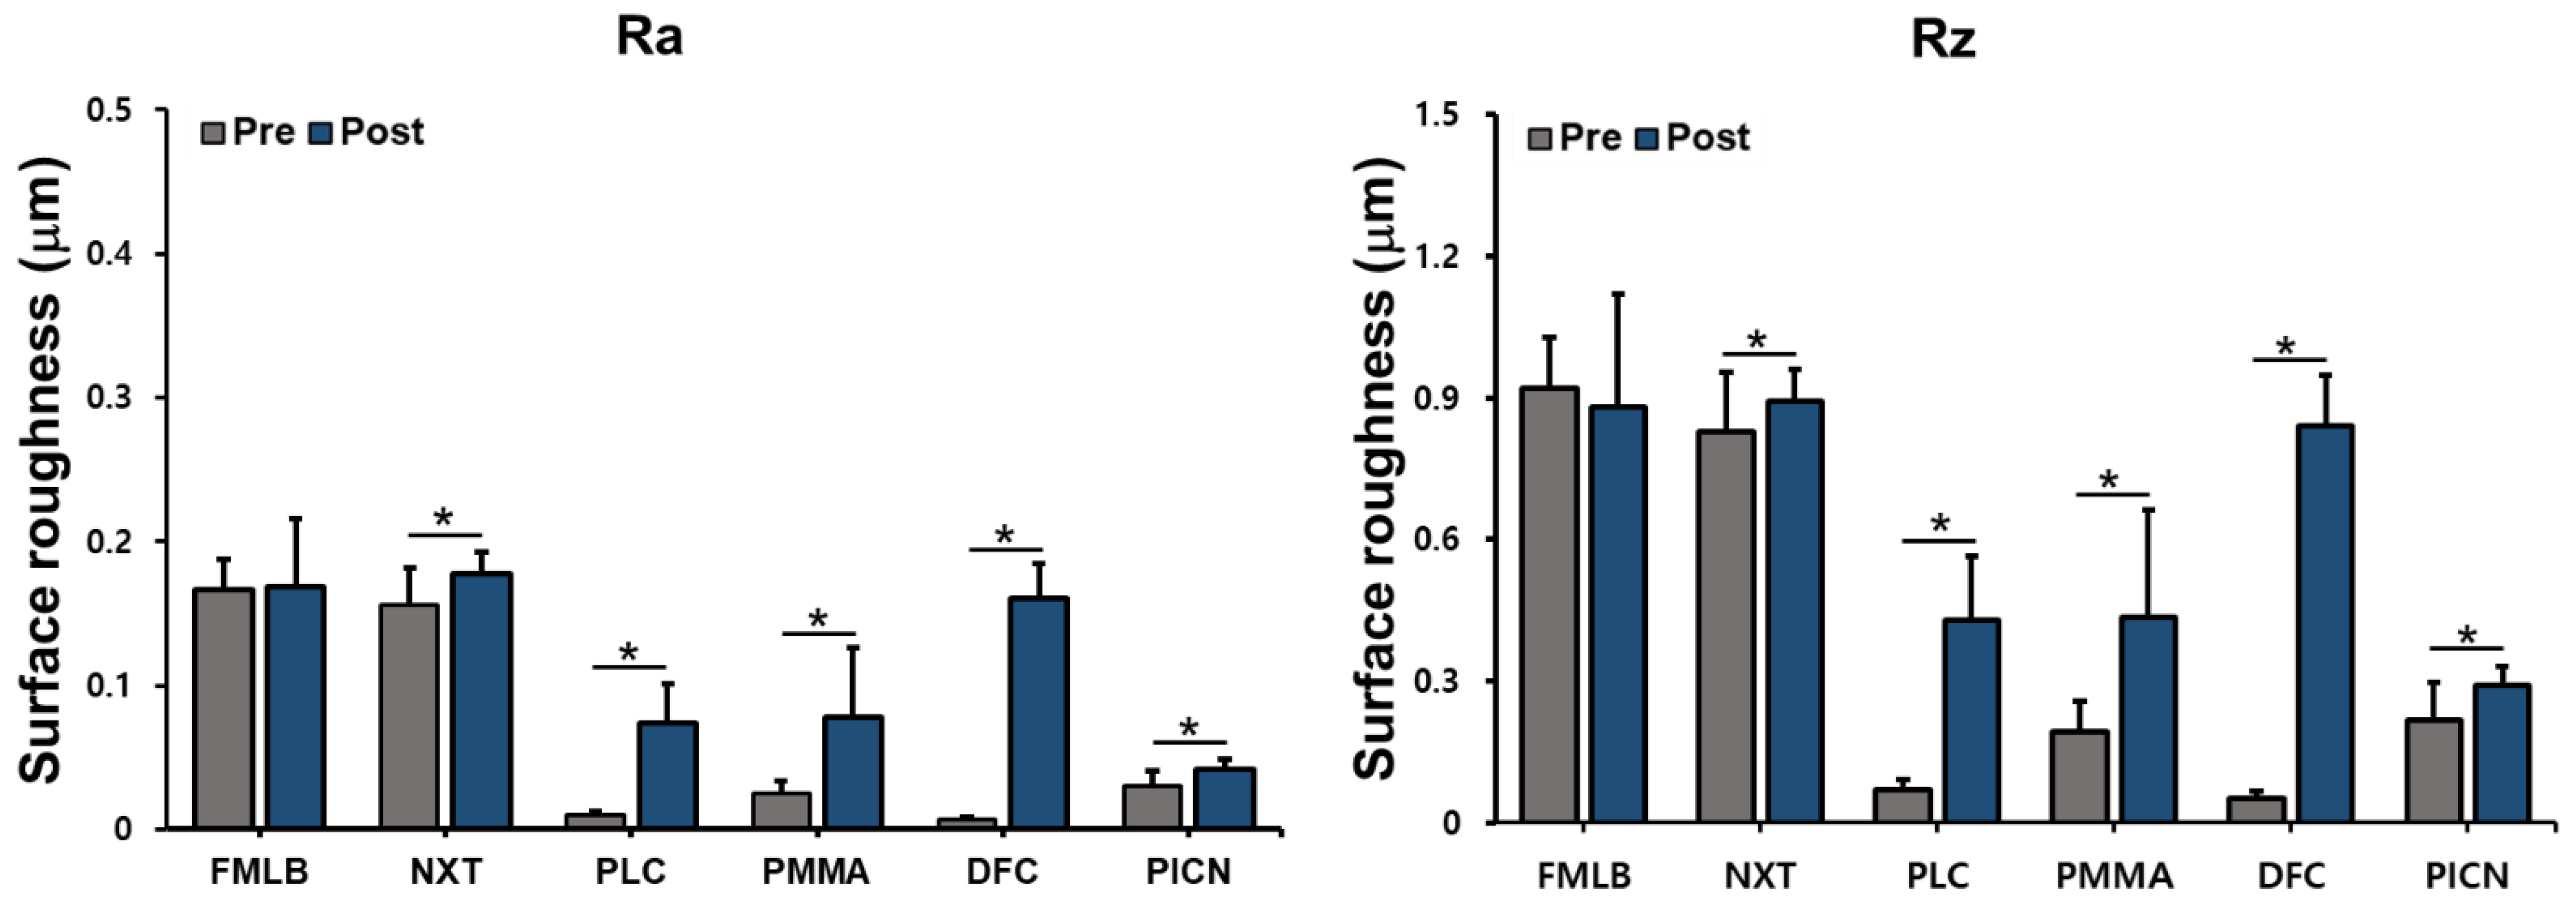
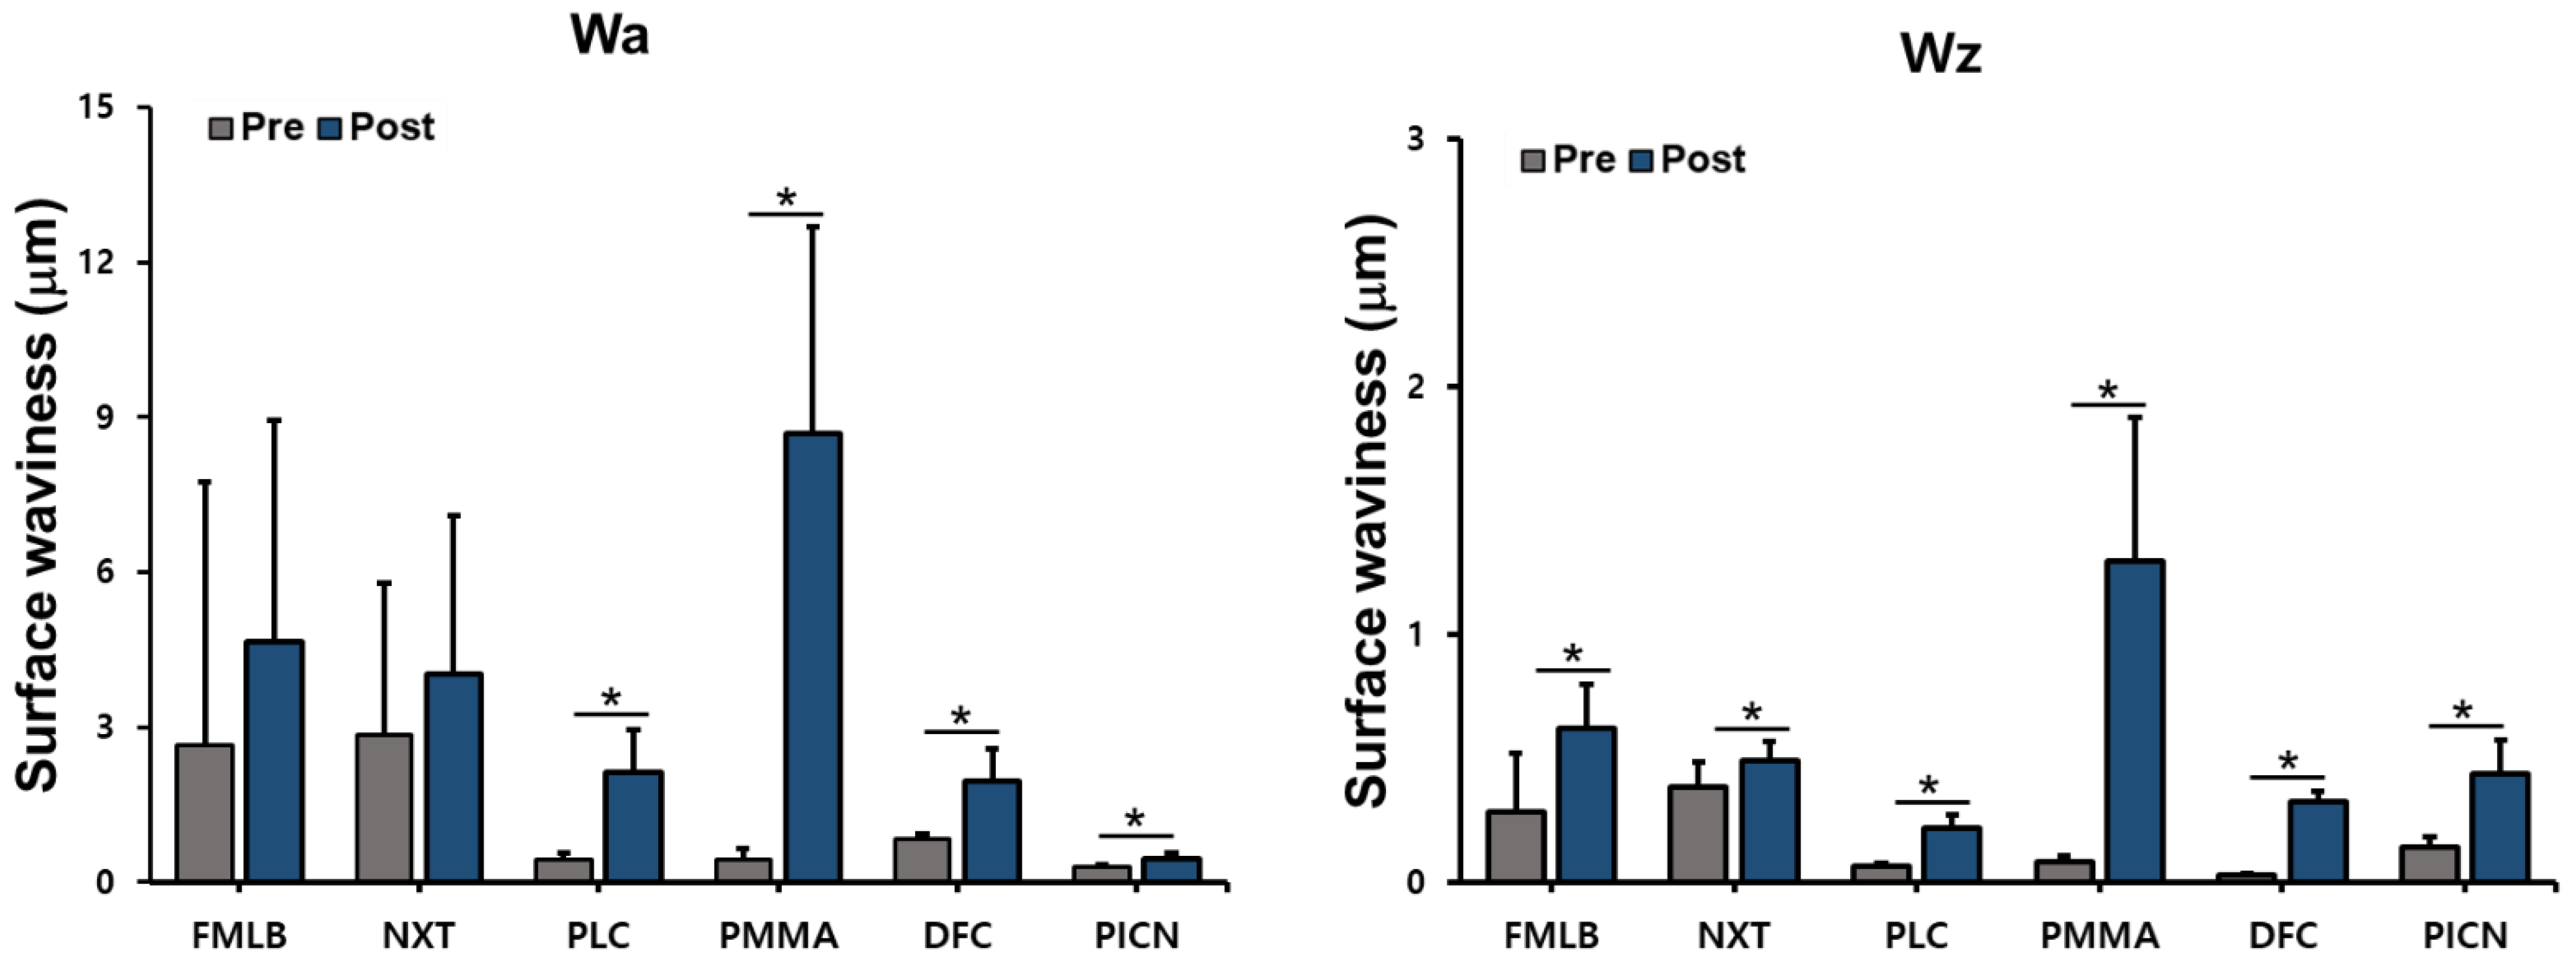
3.1. Surface Roughness and Surface Waviness
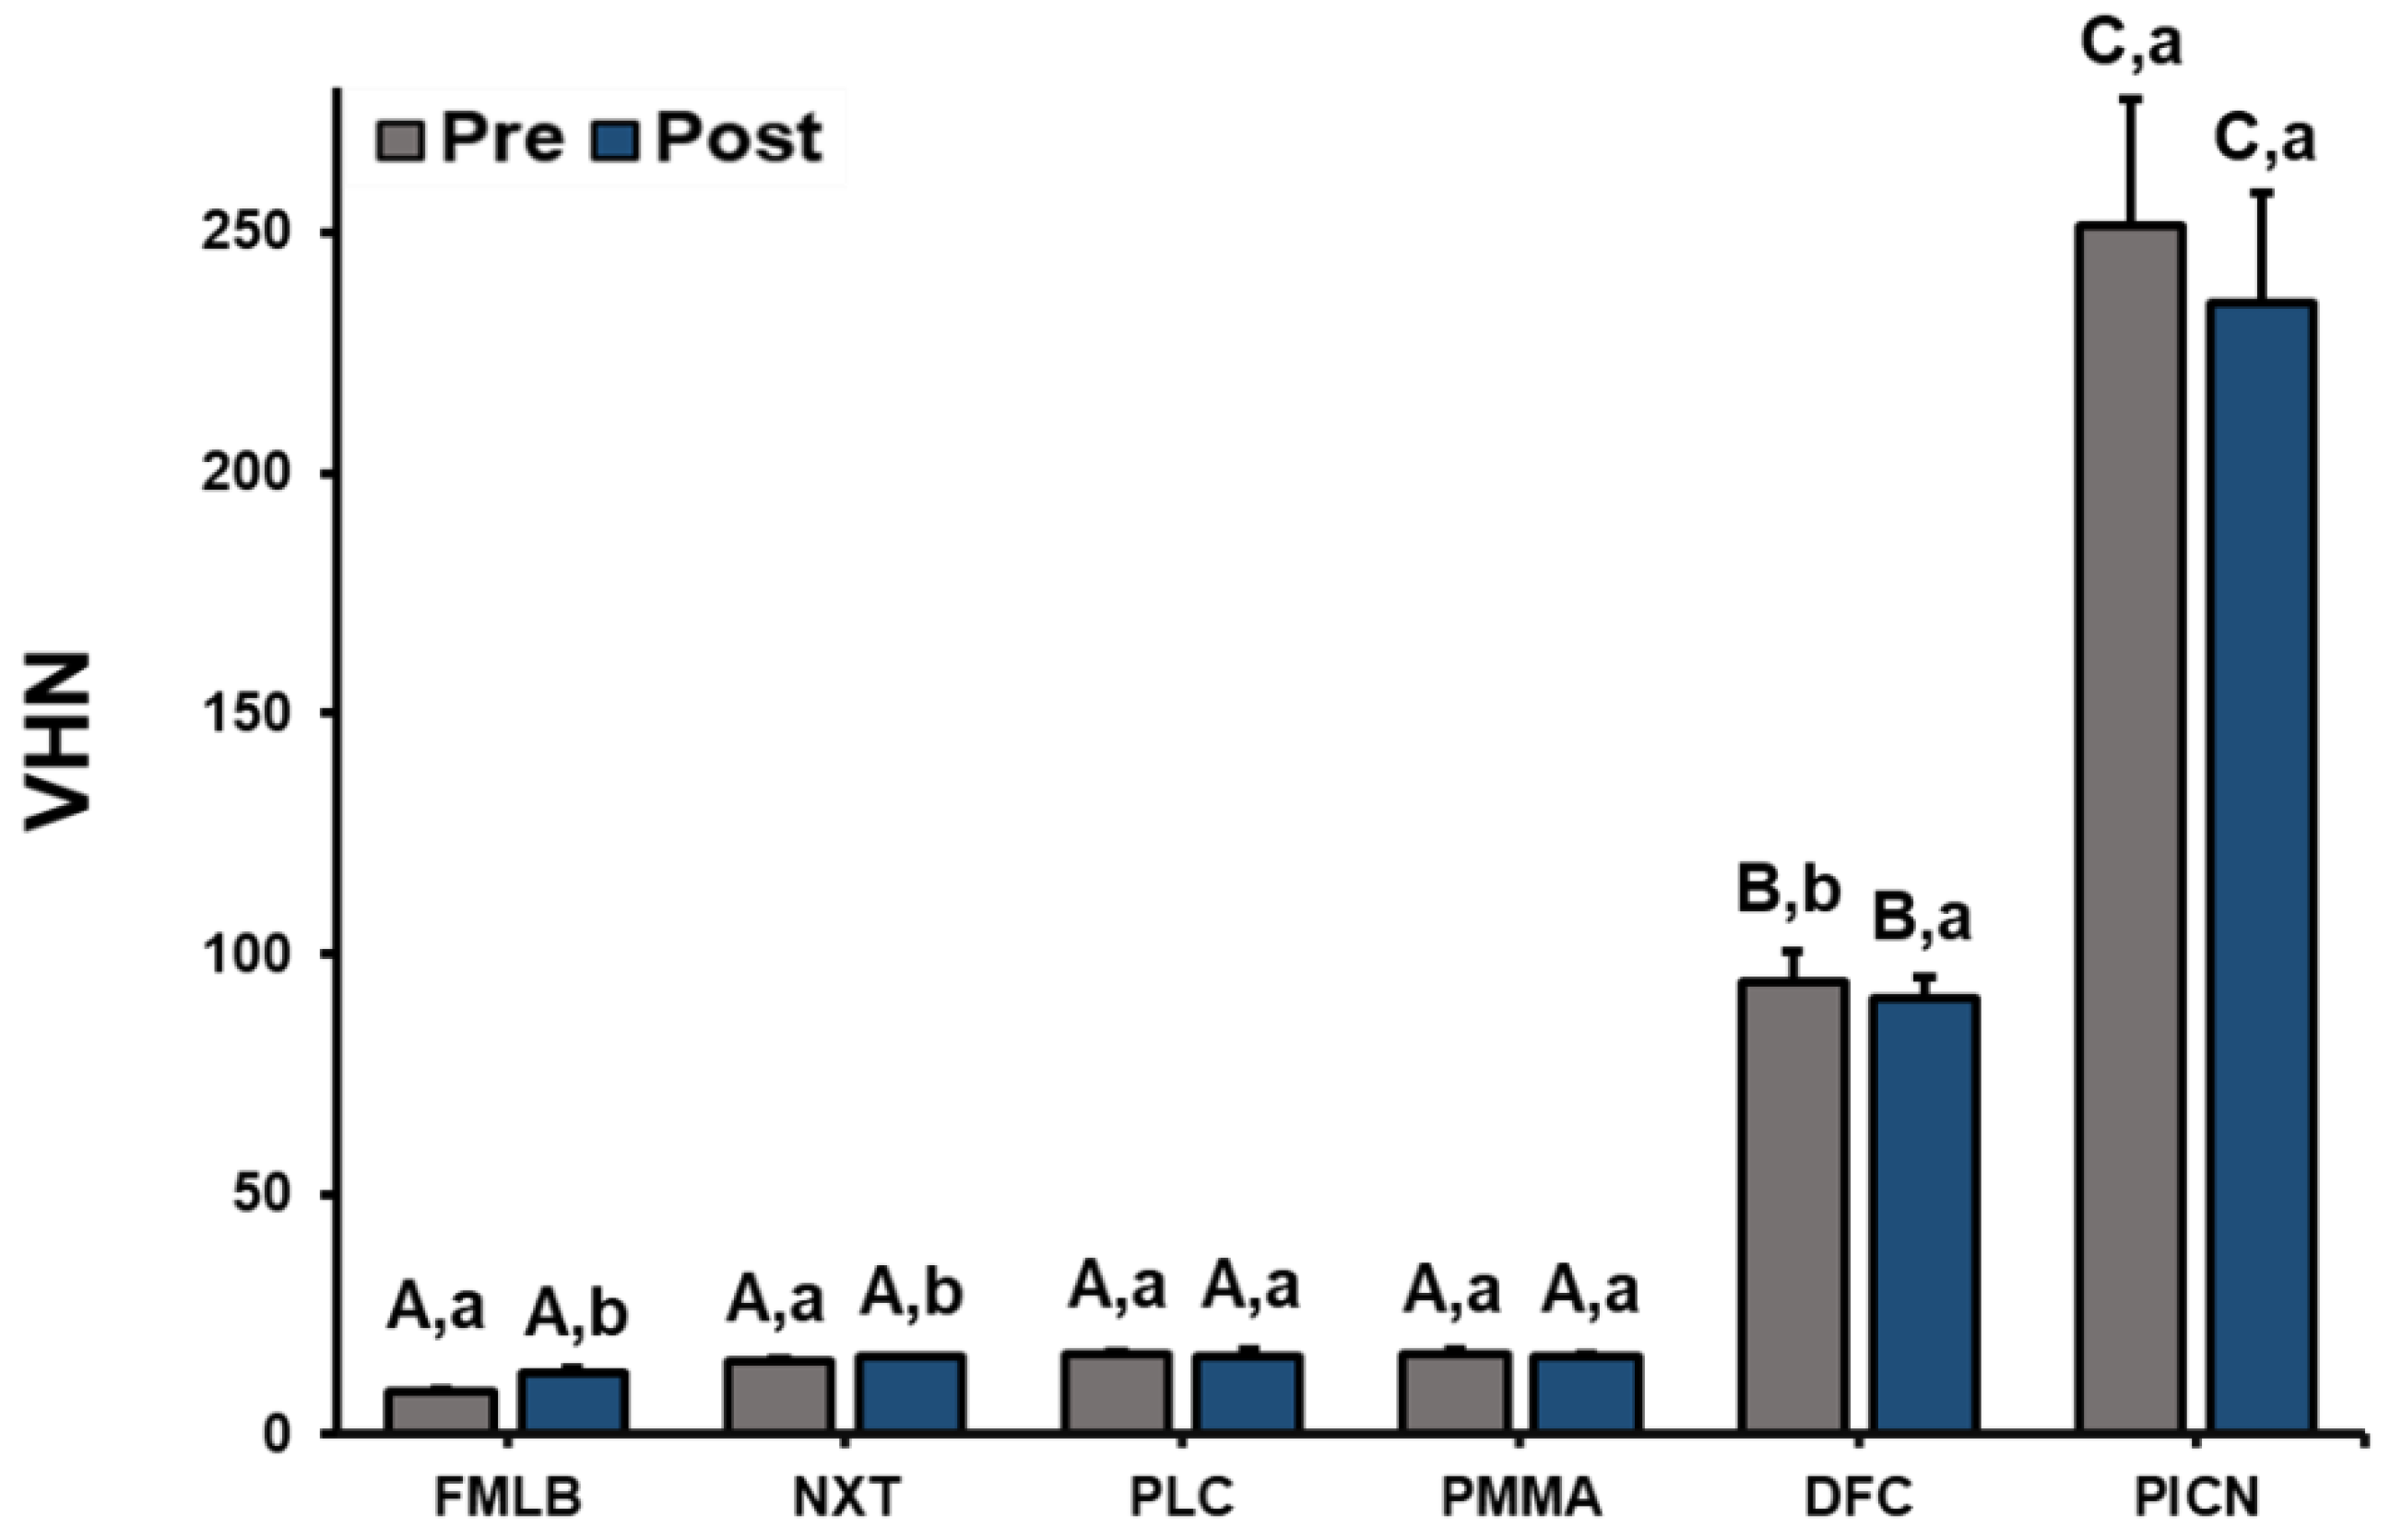
3.2. VHN Test
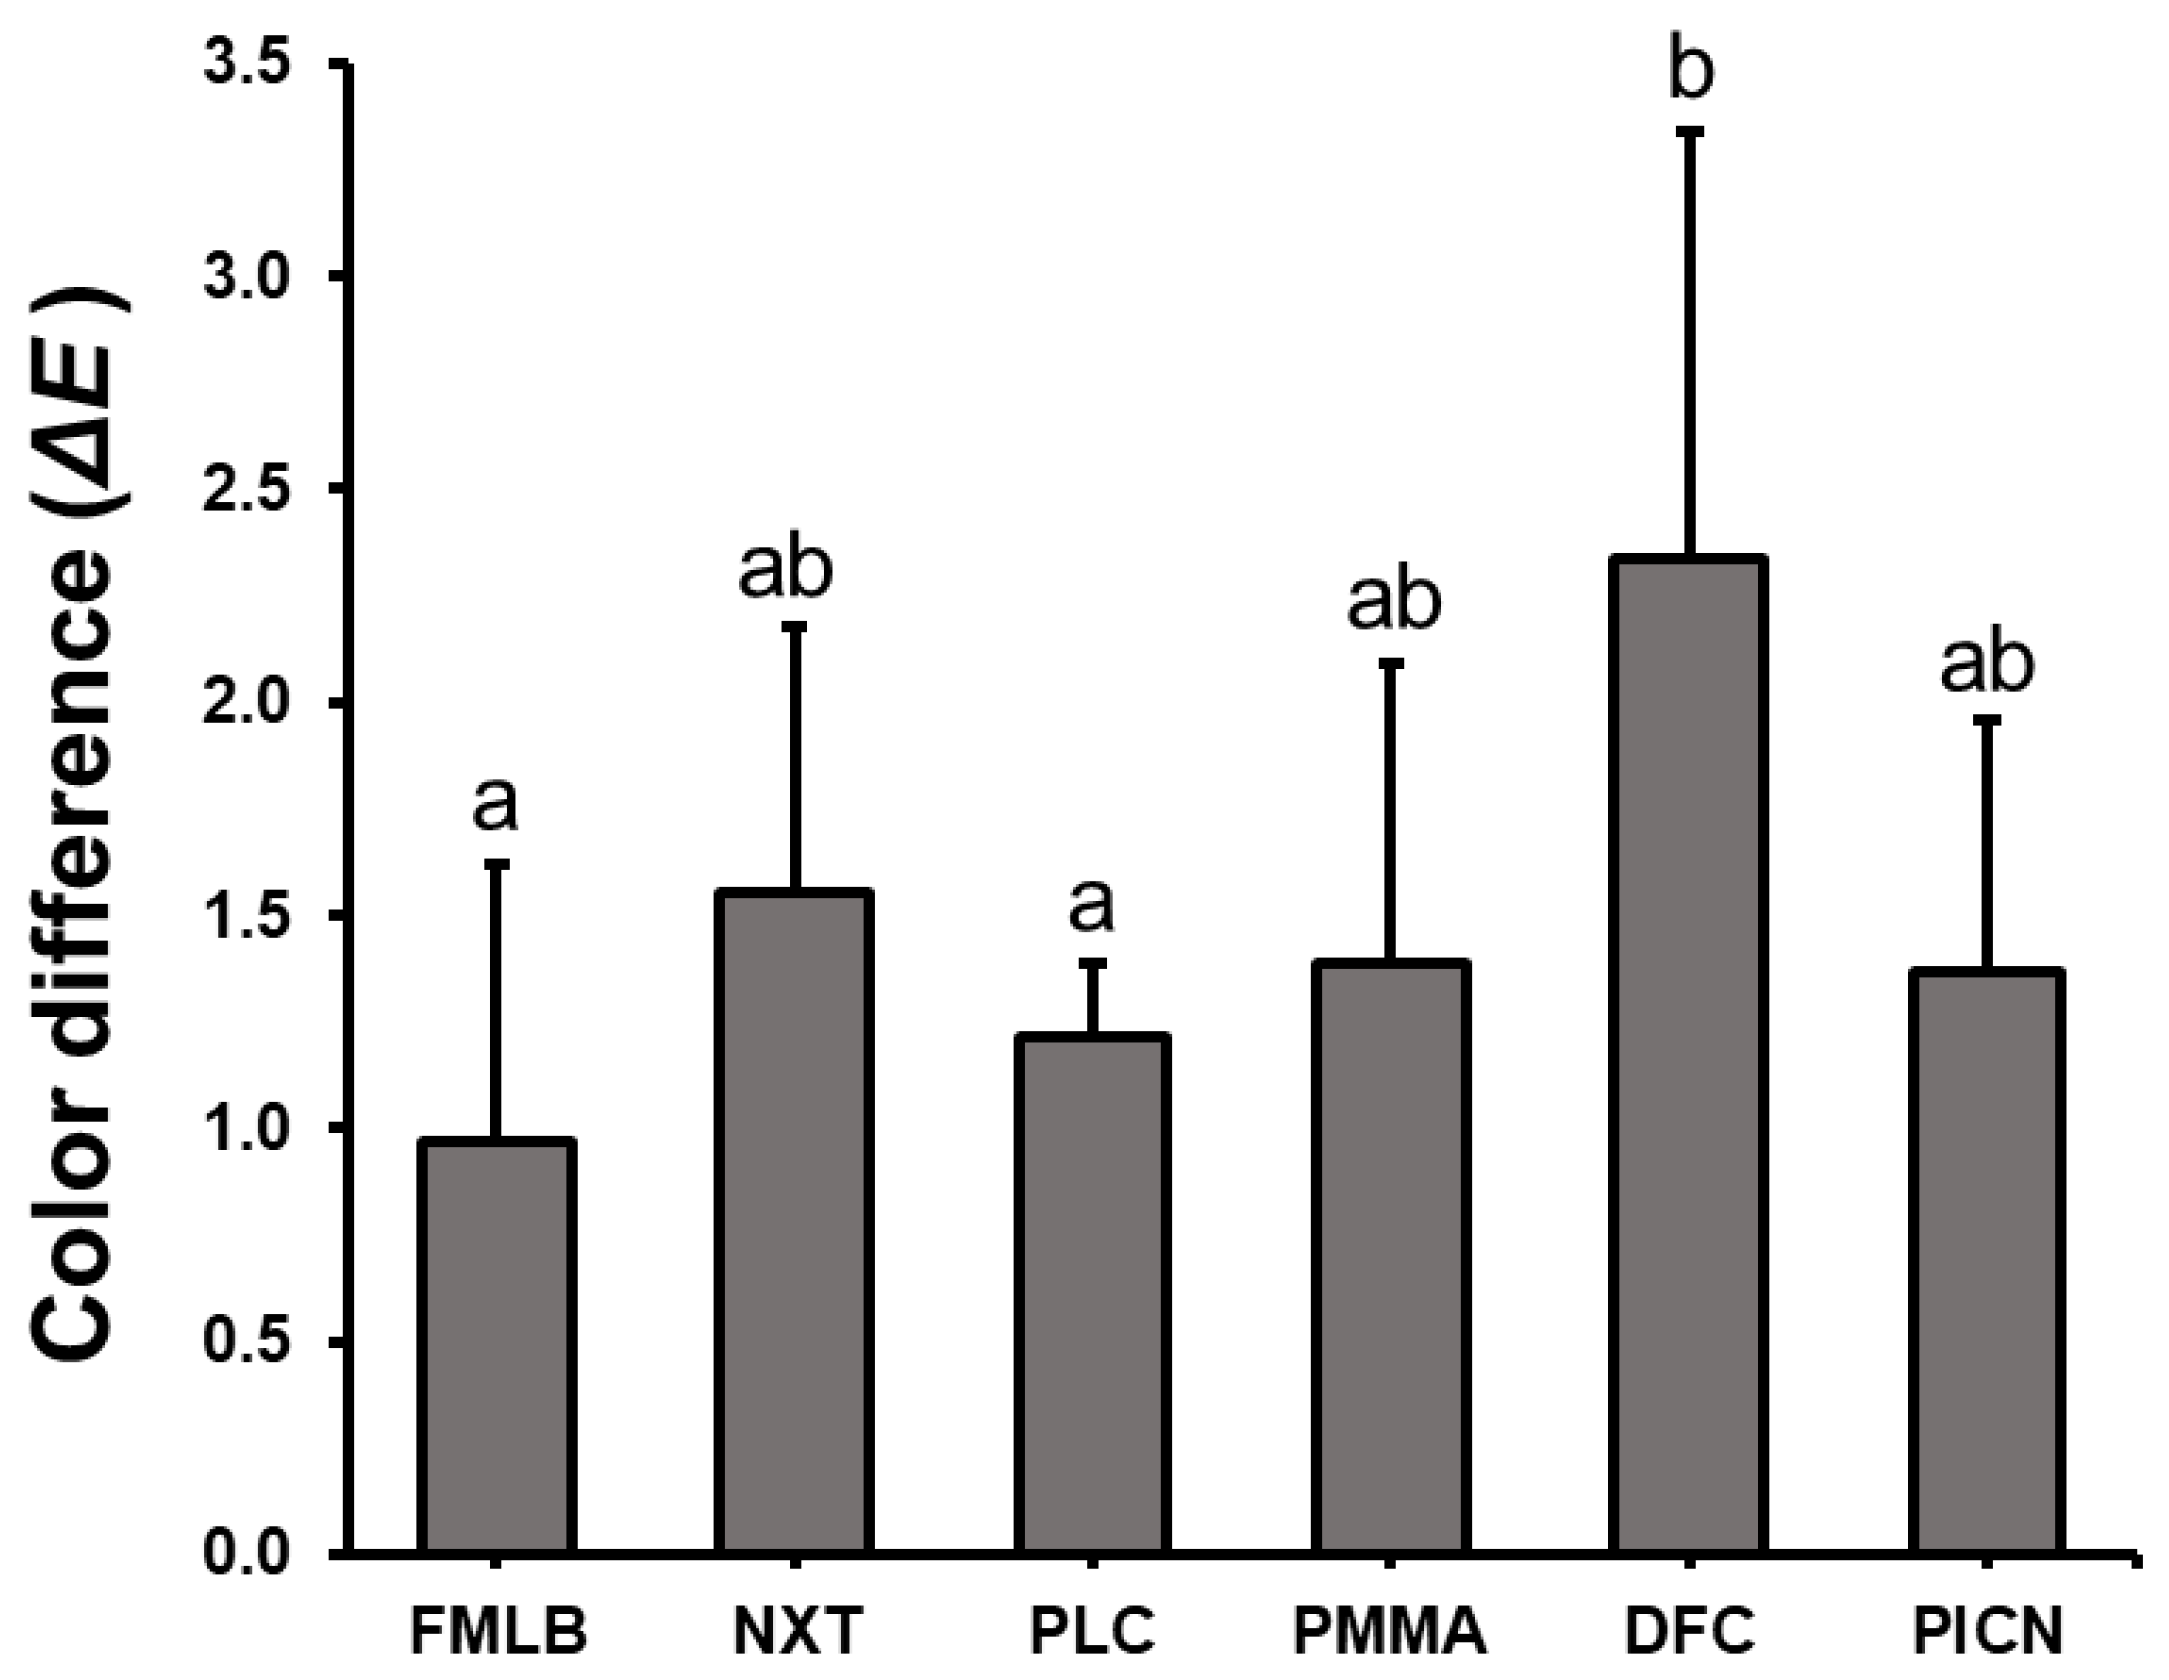
3.3. Color Change
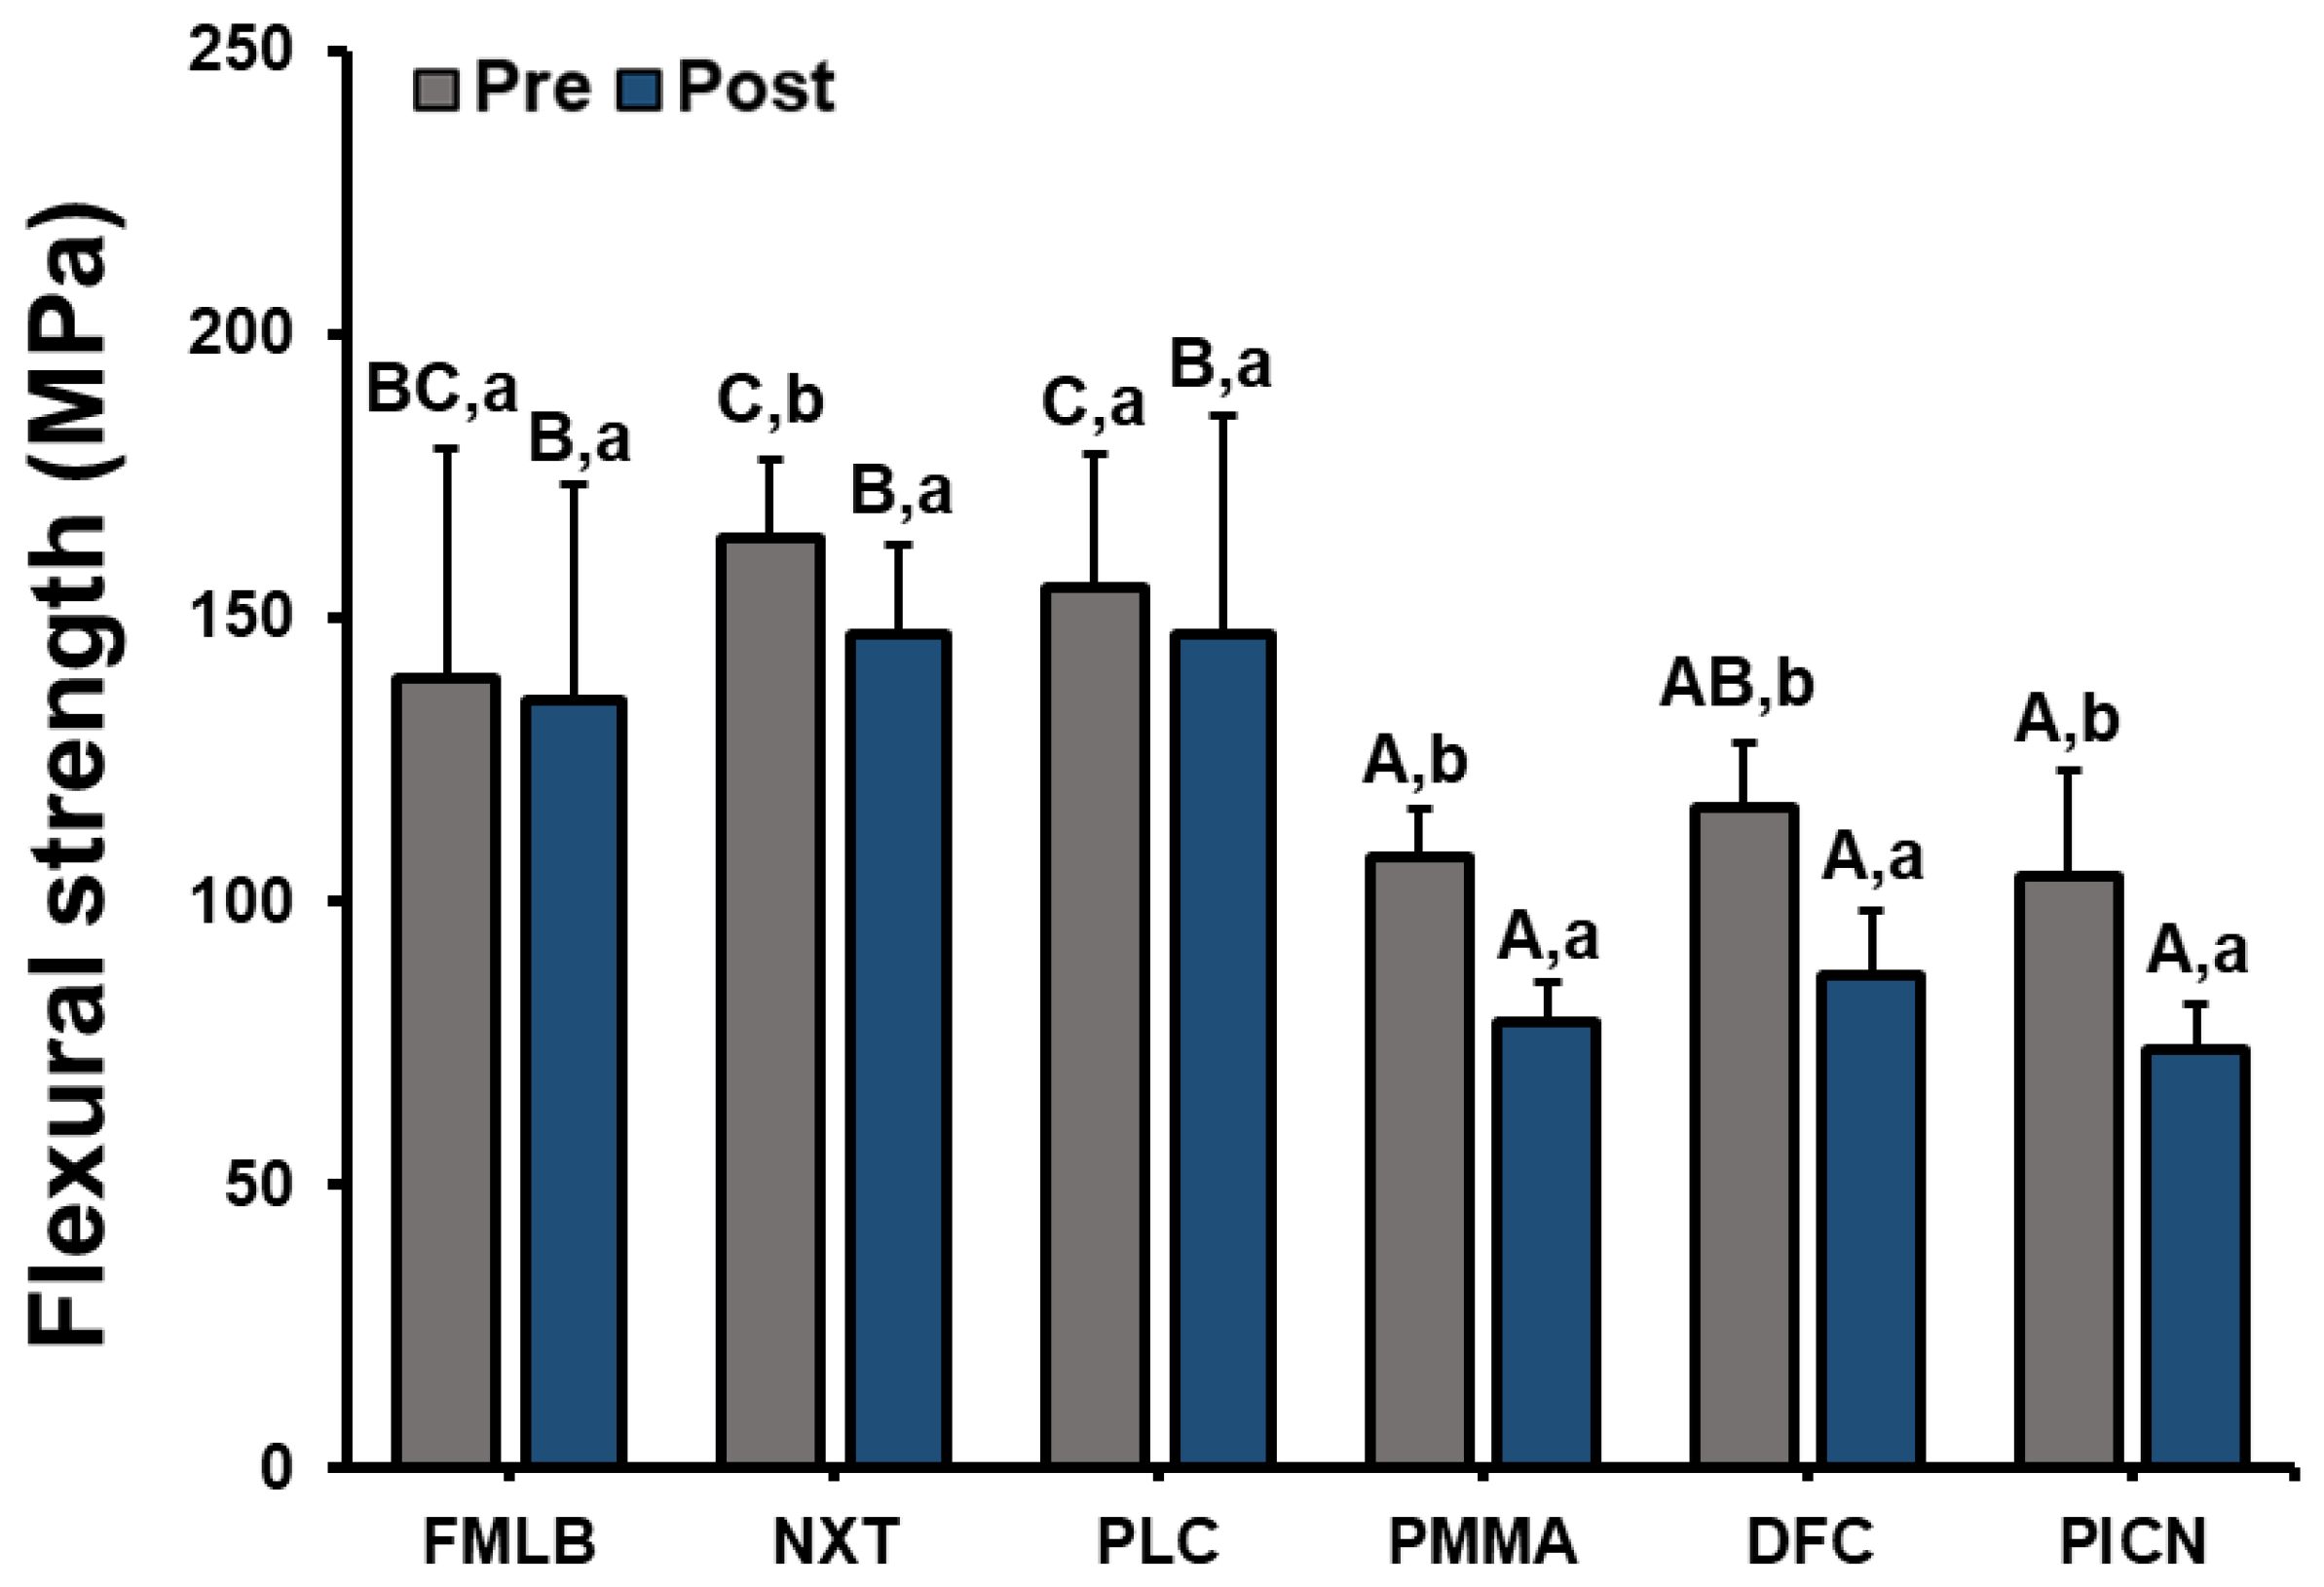
3.4. Flexural Strength
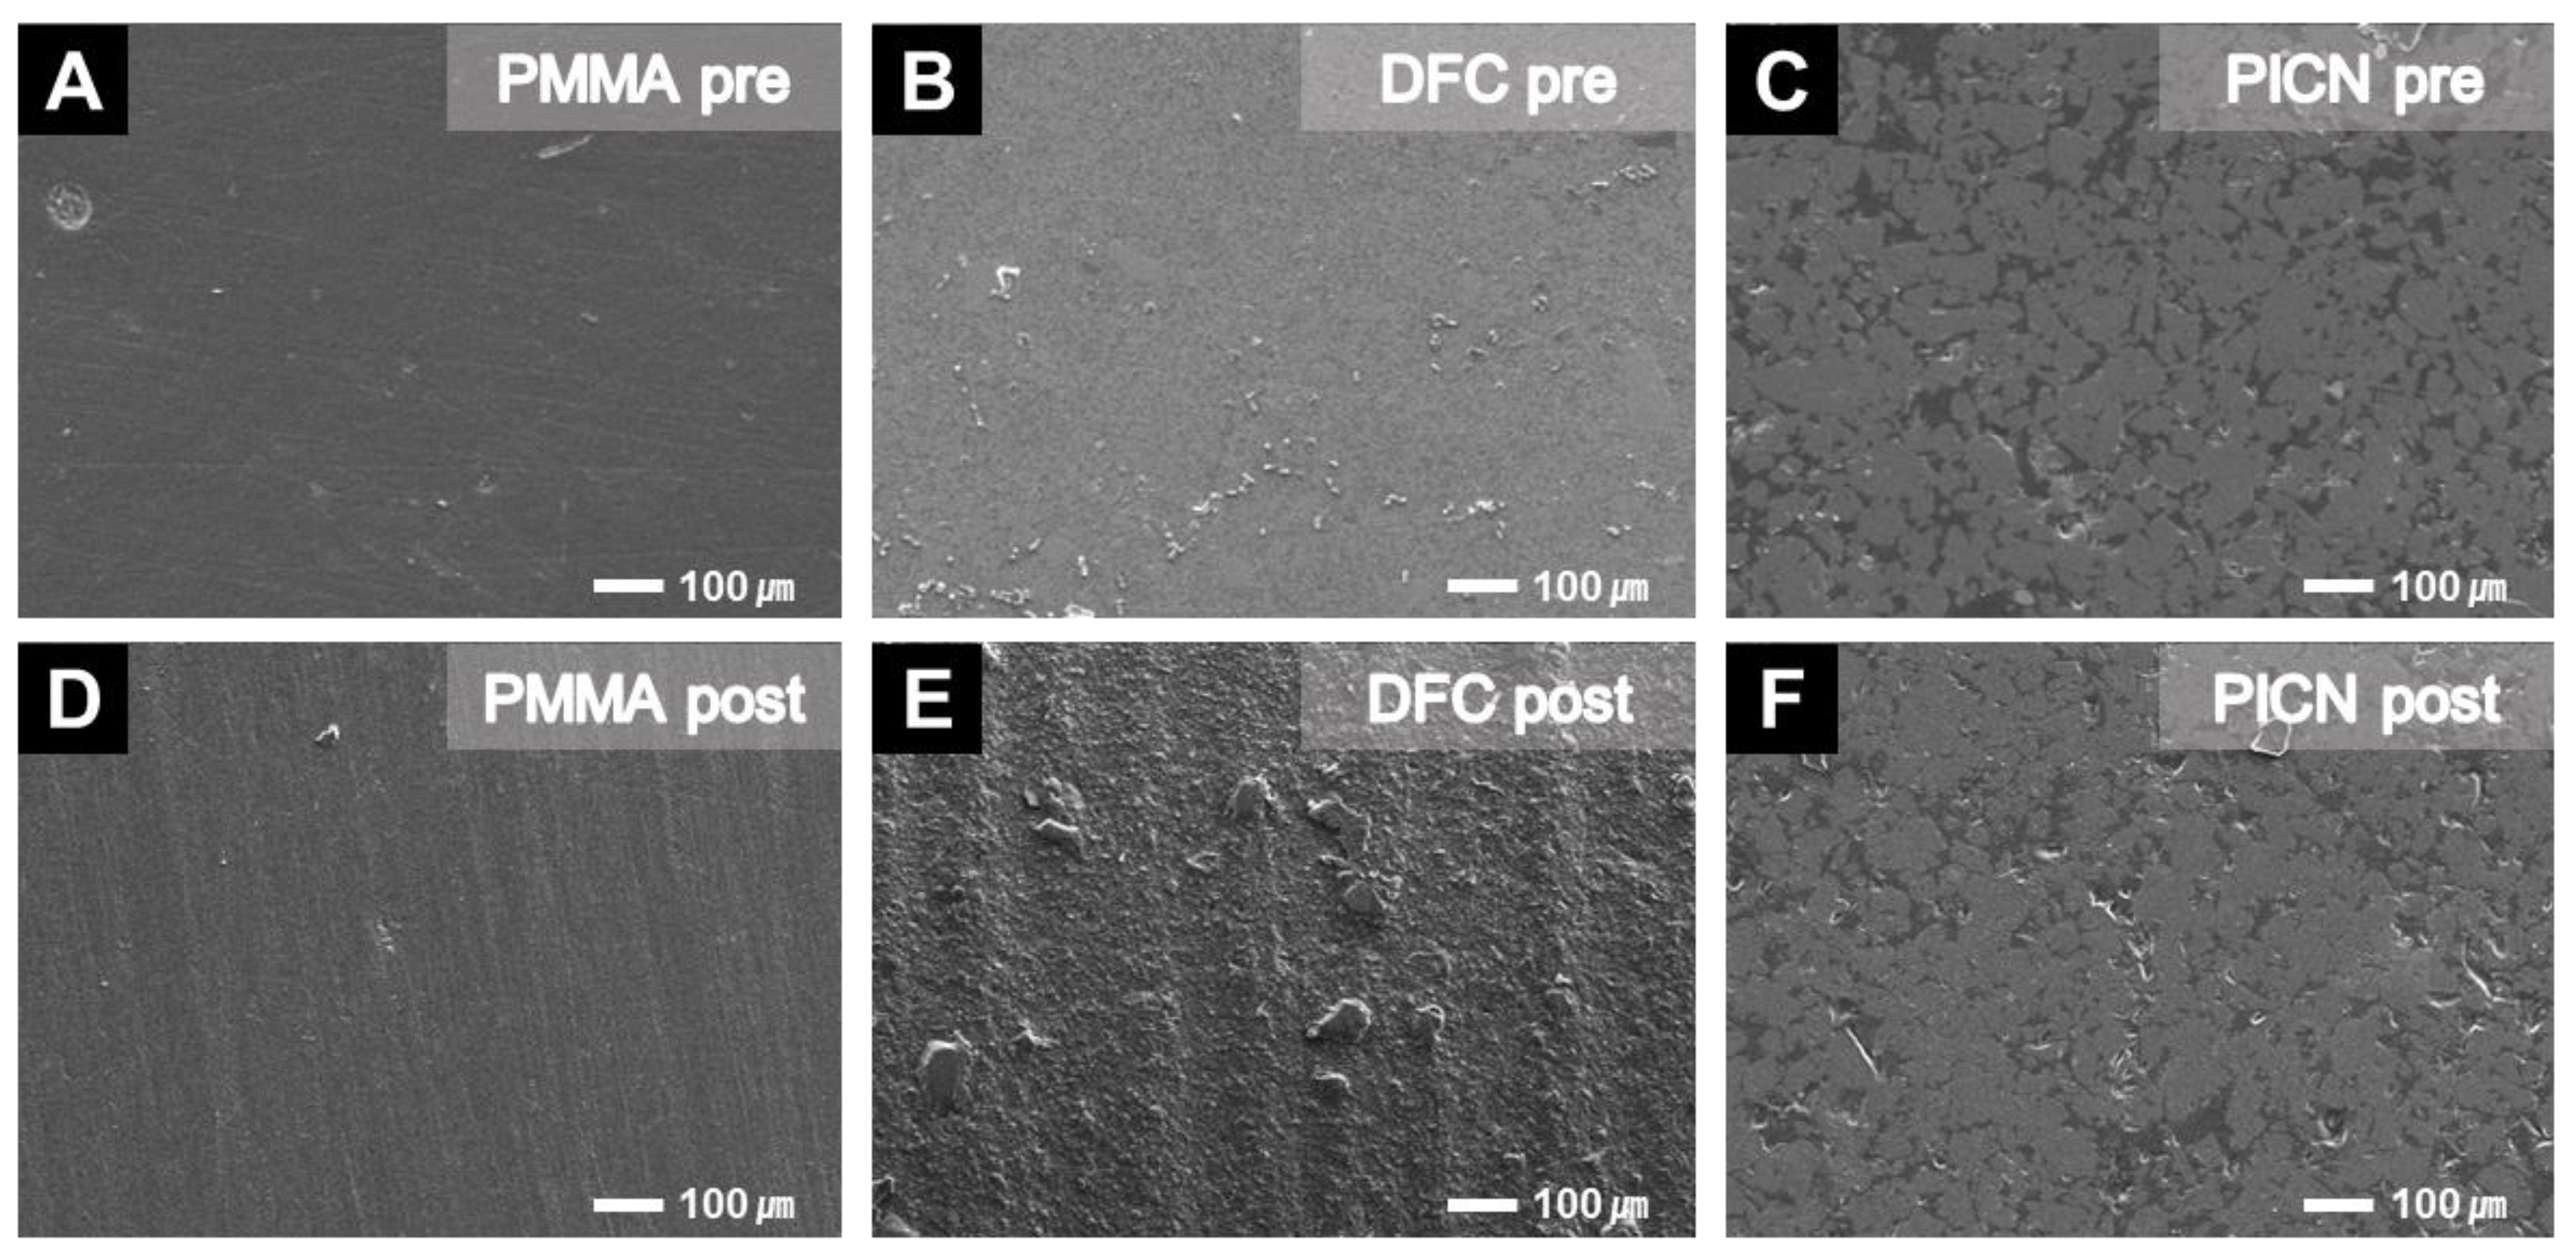
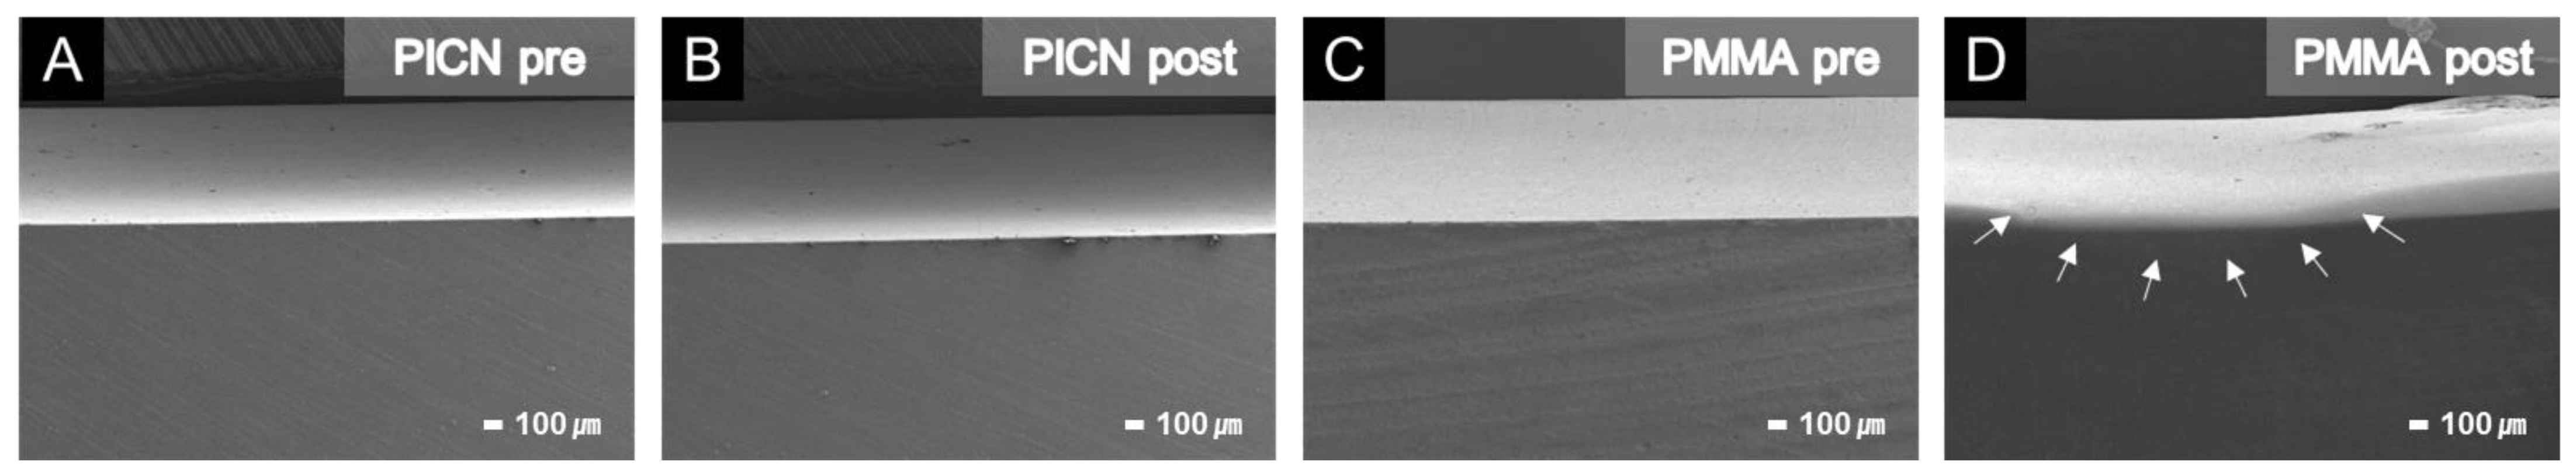
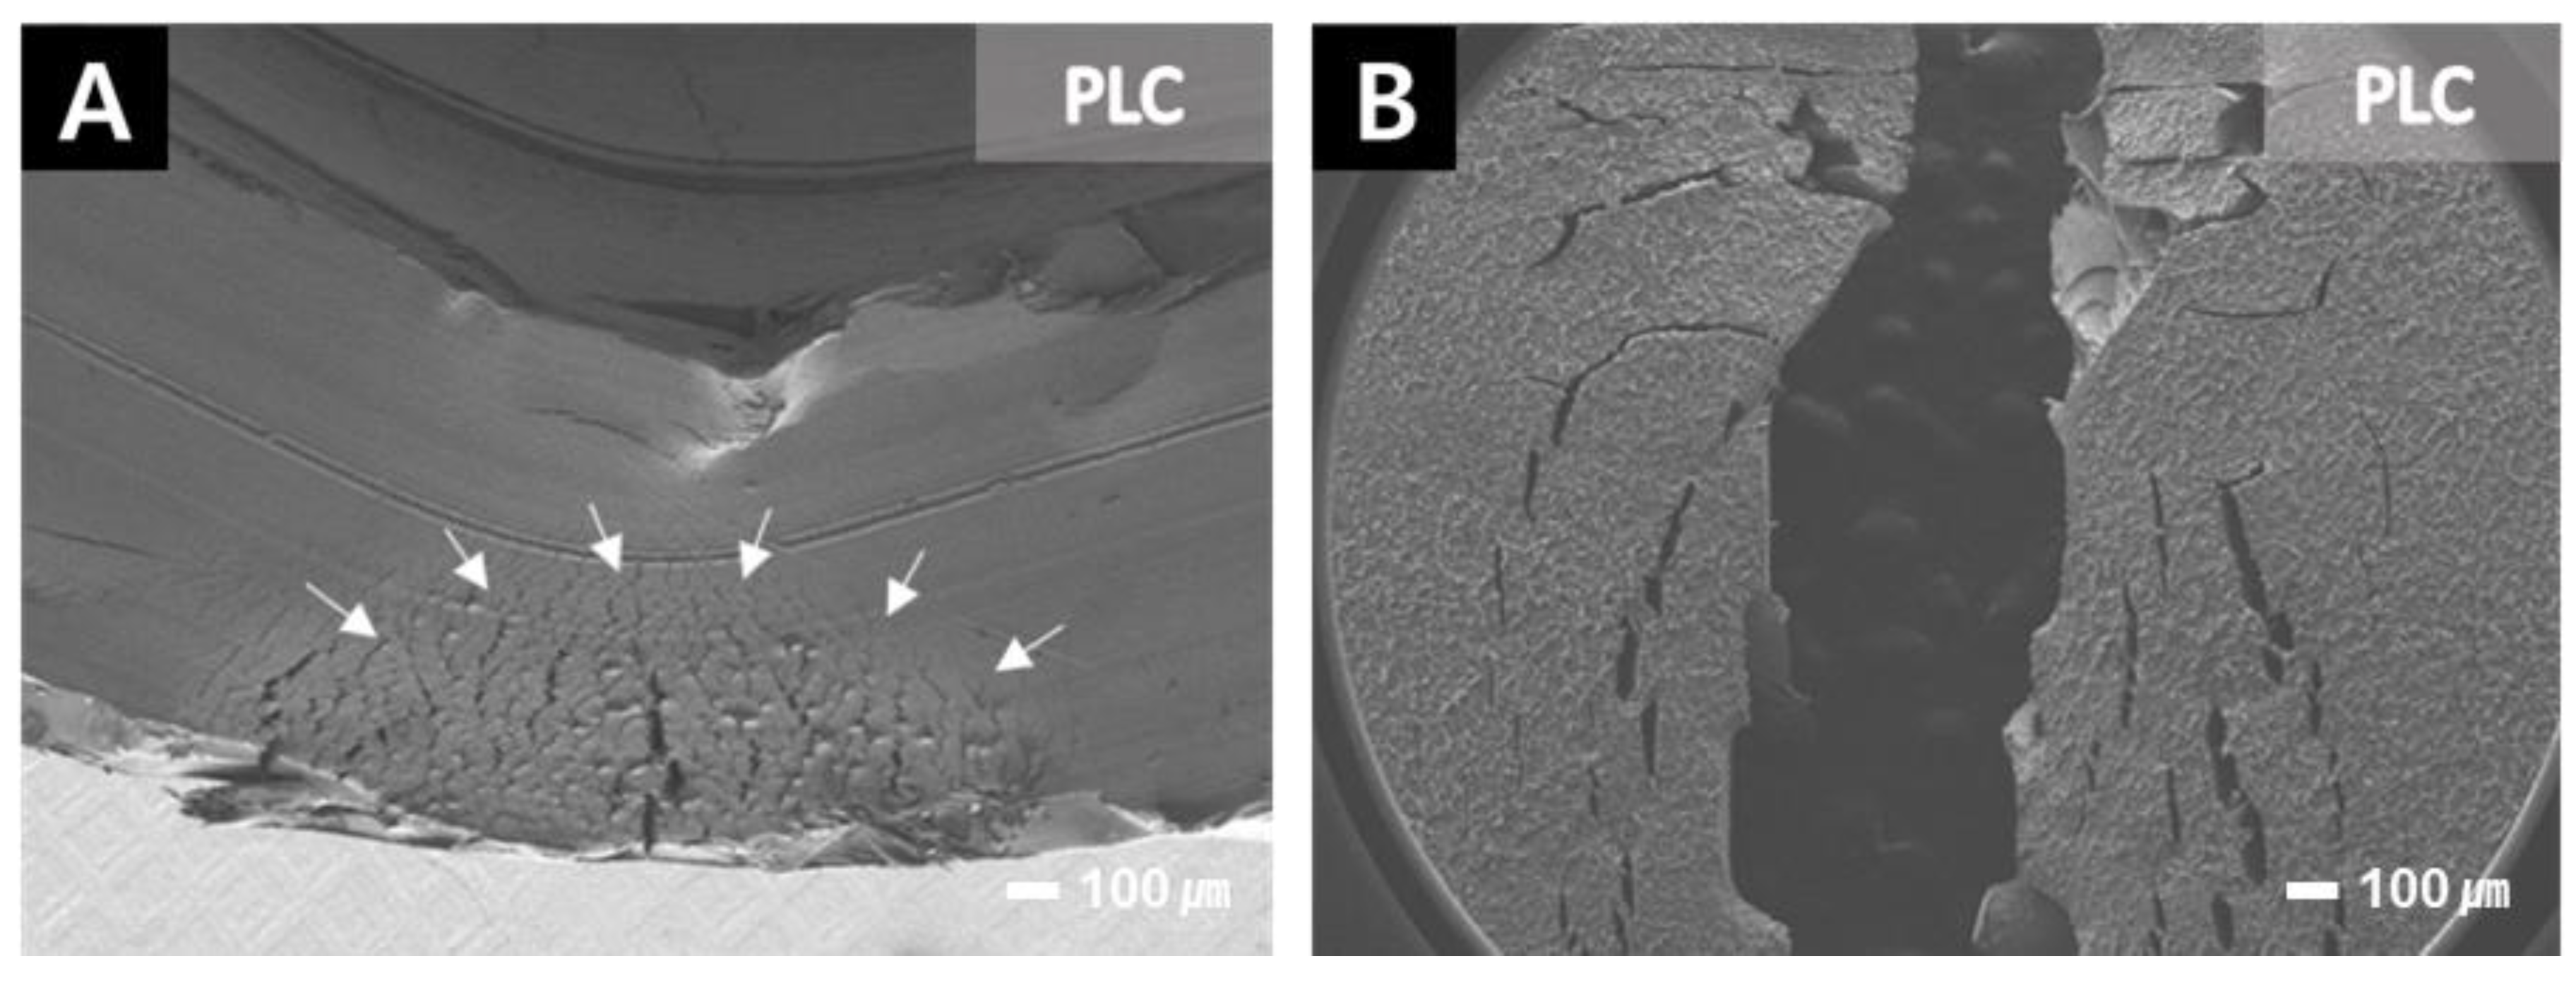
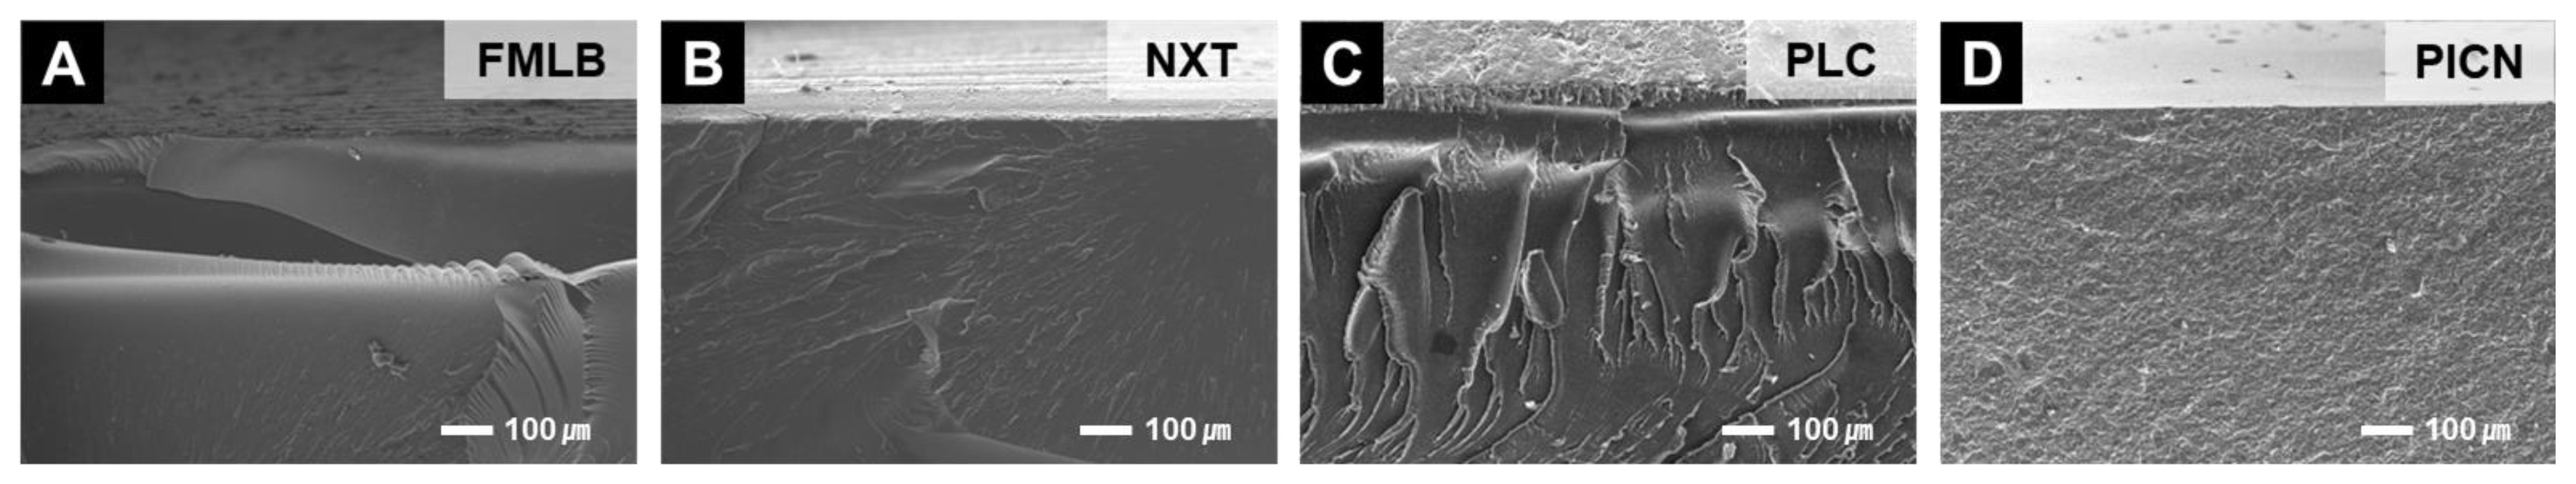
3.5. SEM Observations
4. Discussion
5. Conclusions
Supplementary Materials
Author Contributions
Funding
Institutional Review Board Statement
Informed Consent Statement
Data Availability Statement
Conflicts of Interest
References
- Yuan, J.C.; Barao, V.A.R.; Wee, A.G.; Alfaro, M.F.; Afshari, F.S.; Sukotjo, C. Effect of brushing and thermocycling on the shade and surface roughness of CAD-CAM ceramic restorations. J. Prosthet. Dent. 2018, 119, 1000–1006. [Google Scholar] [CrossRef] [PubMed]
- Mühlemann, S.; Kraus, R.D.; Hämmerle, C.H.; Thoma, D.S. Is the use of digital technologies for the fabrication of implant-supported reconstructions more efficient and/or more effective than conventional techniques: A systematic review. Clin. Oral Implant. Res. 2018, 29, 184–195. [Google Scholar] [CrossRef] [PubMed]
- Ahlholm, P.; Sipilä, K.; Vallittu, P.; Jakonen, M.; Kotiranta, U. Digital versus conventional impressions in fixed prosthodontics: A review. J. Prosthodont. 2018, 27, 35–41. [Google Scholar] [CrossRef] [PubMed] [Green Version]
- Thalji, G.; Bryington, M.; De Kok, I.J.; Cooper, L.F. Prosthodontic management of implant therapy. Dent. Clin. 2014, 58, 207–225. [Google Scholar] [CrossRef]
- van Noort, R. The future of dental devices is digital. Dent. Mater. 2012, 28, 3–12. [Google Scholar] [CrossRef]
- Alghazzawi, T.F. Advancements in CAD/CAM technology: Options for practical implementation. J. Prosthodont. Res. 2016, 60, 72–84. [Google Scholar] [CrossRef]
- Guth, J.F.; Almeida, E.S.J.S.; Beuer, F.F.; Edelhoff, D. Enhancing the predictability of complex rehabilitation with a removable CAD/CAM-fabricated long-term provisional prosthesis: A clinical report. J. Prosthet. Dent. 2012, 107, 1–6. [Google Scholar] [CrossRef]
- Edelhoff, D.; Beuer, F.; Schweiger, J.; Brix, O.; Stimmelmayr, M.; Guth, J.F. CAD/CAM-generated high-density polymer restorations for the pretreatment of complex cases: A case report. Quintessence Int. 2012, 43, 457–467. [Google Scholar]
- Rayyan, M.M.; Aboushelib, M.; Sayed, N.M.; Ibrahim, A.; Jimbo, R. Comparison of interim restorations fabricated by CAD/CAM with those fabricated manually. J. Prosthet. Dent. 2015, 114, 414–419. [Google Scholar] [CrossRef]
- Khaledi, A.-A.; Farzin, M.; Akhlaghian, M.; Pardis, S.; Mir, N. Evaluation of the marginal fit of metal copings fabricated by using 3 different CAD-CAM techniques: Milling, stereolithography, and 3D wax printer. J. Prosthet. Dent. 2020, 124, 81–86. [Google Scholar] [CrossRef]
- Park, J.-M.; Ahn, J.-S.; Cha, H.-S.; Lee, J.-H. Wear Resistance of 3D Printing Resin Material Opposing Zirconia and Metal Antagonists. Materials 2018, 11, 1043. [Google Scholar] [CrossRef] [PubMed] [Green Version]
- Yan, X.; Gu, P. A review of rapid prototyping technologies and systems. Comput. Aided Des. 1996, 28, 307–318. [Google Scholar] [CrossRef]
- Barazanchi, A.; Li, K.C.; Al-Amleh, B.; Lyons, K.; Waddell, J.N. Additive technology: Update on current materials and applications in dentistry. J. Prosthodont. 2017, 26, 156–163. [Google Scholar] [CrossRef]
- Tahayeri, A.; Morgan, M.; Fugolin, A.P.; Bompolaki, D.; Athirasala, A.; Pfeifer, C.S.; Ferracane, J.L.; Bertassoni, L.E. 3D printed versus conventionally cured provisional crown and bridge dental materials. Dent. Mater. 2018, 34, 192–200. [Google Scholar] [CrossRef]
- Sharma, N.; Cao, S.; Msallem, B.; Kunz, C.; Brantner, P.; Honigmann, P.; Thieringer, F.M. Effects of Steam Sterilization on 3D Printed Biocompatible Resin Materials for Surgical Guides—An Accuracy Assessment Study. J. Clin. Med. 2020, 9, 1506. [Google Scholar] [CrossRef]
- Park, J.-Y.; Lee, J.-J.; Bae, S.-Y.; Kim, J.-H.; Kim, W.-C. In vitro assessment of the marginal and internal fits of interim implant restorations fabricated with different methods. J. Prosthet. Dent. 2016, 116, 536–542. [Google Scholar] [CrossRef] [PubMed]
- Pillai, S.; Upadhyay, A.; Khayambashi, P.; Farooq, I.; Sabri, H.; Tarar, M.; Lee, K.T.; Harb, I.; Zhou, S.; Wang, Y.; et al. Dental 3D-Printing: Transferring Art from the Laboratories to the Clinics. Polymers 2021, 13, 157. [Google Scholar] [CrossRef] [PubMed]
- Son, K.; Lee, K.-B. A Novel Method for Precise Guided Hole Fabrication of Dental Implant Surgical Guide Fabricated with 3D Printing Technology. Appl. Sci. 2021, 11, 49. [Google Scholar] [CrossRef]
- Lorenzetti, M.; Lorenzetti, V.; Carossa, M.; Cavagnetto, D.; Mussano, F. Using a Preoperative Scan Digital Impression and a Digital Index to Build Immediate Interim Full-Arch Implant-Supported Prosthesis. A Case Report and Proof of Concept. Appl. Sci. 2021, 11, 996. [Google Scholar] [CrossRef]
- Grau, A.; Stawarczyk, B.; Roos, M.; Theelke, B.; Hampe, R. Reliability of wear measurements of CAD-CAM restorative materials after artificial aging in a mastication simulator. J. Mech. Behav. Biomed. Mater. 2018, 86, 185–190. [Google Scholar] [CrossRef]
- Flury, S.; Diebold, E.; Peutzfeldt, A.; Lussi, A. Effect of artificial toothbrushing and water storage on the surface roughness and micromechanical properties of tooth-colored CAD-CAM materials. J. Prosthet. Dent. 2017, 117, 767–774. [Google Scholar] [CrossRef]
- Bollen, C.; Lambrechts, P.; Quiryen, M. Comparison of surface roughness of oral hard materials to the threshold surface roughness for bacterial plaque retention: A review of the literature. Dent. Mater. 1997, 13, 258–269. [Google Scholar] [CrossRef]
- Aykent, F.; Yondem, I.; Ozyesil, A.G.; Gunal, S.K.; Avunduk, M.C.; Ozkan, S. Effect of different finishing techniques for restorative materials on surface roughness and bacterial adhesion. J. Prosthet. Dent. 2010, 103, 221–227. [Google Scholar] [CrossRef]
- Kawai, K.; Urano, M.; Ebisu, S. Effect of surface roughness of porcelain on adhesion of bacteria and their synthesizing glucans. J. Prosthet. Dent. 2000, 83, 664–667. [Google Scholar] [CrossRef] [PubMed]
- Jones, C.; Billington, R.; Pearson, G. The in vivo perception of roughness of restorations. Br. Dent. J. 2004, 196, 42–45. [Google Scholar] [CrossRef] [Green Version]
- Heintze, S.D.; Forjanic, M.; Ohmiti, K.; Rousson, V. Surface deterioration of dental materials after simulated toothbrushing in relation to brushing time and load. Dent. Mater. 2010, 26, 306–319. [Google Scholar] [CrossRef] [PubMed]
- de Andrade, G.S.; Augusto, M.G.; Simões, B.V.; Pagani, C.; Saavedra, G.d.S.F.A.; Bresciani, E. Impact of simulated toothbrushing on surface properties of chairside CAD-CAM materials: An in vitro study. J. Prosthet. Dent. 2021, 125, 469.e461–469.e466. [Google Scholar] [CrossRef] [PubMed]
- Mörmann, W.H.; Stawarczyk, B.; Ender, A.; Sener, B.; Attin, T.; Mehl, A. Wear characteristics of current aesthetic dental restorative CAD/CAM materials: Two-body wear, gloss retention, roughness and Martens hardness. J. Mech. Behav. Biomed. Mater. 2013, 20, 113–125. [Google Scholar] [CrossRef] [Green Version]
- Rosentritt, M.; Sawaljanow, A.; Behr, M.; Kolbeck, C.; Preis, V. Effect of tooth brush abrasion and thermo-mechanical loading on direct and indirect veneer restorations. Clin. Oral Investig. 2015, 19, 53–60. [Google Scholar] [CrossRef]
- Kamonkhantikul, K.; Arksornnukit, M.; Lauvahutanon, S.; Takahashi, H. Toothbrushing alters the surface roughness and gloss of composite resin CAD/CAM blocks. Dent. Mater. J. 2016, 35, 225–232. [Google Scholar] [CrossRef] [PubMed] [Green Version]
- Koizumi, H.; Saiki, O.; Nogawa, H.; Hiraba, H.; Okazaki, T.; Matsumura, H. Surface roughness and gloss of current CAD/CAM resin composites before and after toothbrush abrasion. Dent. Mater. J. 2015, 34, 881–887. [Google Scholar] [CrossRef] [PubMed] [Green Version]
- ISO/TS 14569-2:2001(en) Dental Materials—Guidance on Testing of Wear—Part 2: Wear by Two-and/or Three Body Contact; Technical Specification; International Organization for Standardization: Geneva, Switzerland, 2001.
- ISO 4287:1997. Geometrical Product Specifications (GPS)—Surface Texture: Profile Method—Terms, Definitions and Surface Texture Parameters; International Organization for Standardization: Geneva, Switzerland, 1997.
- Saxer, U.; Barbakow, J.; Yankell, S. New studies on estimated and actual toothbrushing times and dentifrice use. J. Clin. Dent. 1998, 9, 49–51. [Google Scholar] [PubMed]
- Clarke, D.R. Interpenetrating phase composites. J. Am. Ceram. Soc. 1992, 75, 739–758. [Google Scholar] [CrossRef]
- Harris, J.; Marquis, P. Comparison of the deformation and failure characteristics of morphologically distinct metal-glass interpenetrating phase composites. J. Mater. Sci. 2002, 37, 2801–2810. [Google Scholar] [CrossRef]
- Choi, J.-W.; Song, E.-J.; Shin, J.-H.; Jeong, T.-S.; Huh, J.-B. In Vitro Investigation of Wear of CAD/CAM Polymeric Materials Against Primary Teeth. Materials 2017, 10, 1410. [Google Scholar] [CrossRef] [Green Version]
- Mandikos, M.N.; McGivney, G.P.; Davis, E.; Bush, P.J.; Carter, J.M. A comparison of the wear resistance and hardness of indirect composite resins. J. Prosthet. Dent. 2001, 85, 386–395. [Google Scholar] [CrossRef]
- Murakami, M. Surface properties of an indirect composite polymerized with five laboratory light polymerization systems. J. Oral Sci. 2009, 51, 215–221. [Google Scholar] [CrossRef] [Green Version]
- Dupriez, N.D.; von Koeckritz, A.K.; Kunzelmann, K.H. A comparative study of sliding wear of nonmetallic dental restorative materials with emphasis on micromechanical wear mechanisms. J. Biomed. Mater. Res. Part B Appl. Biomater. 2015, 103, 925–934. [Google Scholar] [CrossRef] [PubMed]
- Prpić, V.; Schauperl, Z.; Ćatić, A.; Dulčić, N.; Čimić, S. Comparison of Mechanical Properties of 3D-Printed, CAD/CAM, and Conventional Denture Base Materials. J. Prosthodont. 2020, 29, 524–528. [Google Scholar] [CrossRef]
- Teixeira, E.C.; Thompson, J.L.; Piascik, J.R.; Thompson, J.Y. In vitro toothbrush-dentifrice abrasion of two restorative composites. J. Esthet. Restor. Dent. 2005, 17, 172–180. [Google Scholar] [CrossRef]
- Alifui-Segbaya, F.; Bowman, J.; White, A.R.; George, R.; Fidan, I. Characterization of the Double Bond Conversion of Acrylic Resins for 3D Printing of Dental Prostheses. Compend. Contin. Educ. Dent. 2019, 40, e7–e11. [Google Scholar] [PubMed]
- Goujat, A.; Abouelleil, H.; Colon, P.; Jeannin, C.; Pradelle, N.; Seux, D.; Grosgogeat, B. Mechanical properties and internal fit of 4 CAD-CAM block materials. J. Prosthet. Dent. 2018, 119, 384–389. [Google Scholar] [CrossRef] [PubMed]
- Kim, D.; Shim, J.-S.; Lee, D.; Shin, S.-H.; Nam, N.-E.; Park, K.-H.; Shim, J.-S.; Kim, J.-E. Effects of Post-Curing Time on the Mechanical and Color Properties of Three-Dimensional Printed Crown and Bridge Materials. Polymers 2020, 12, 2762. [Google Scholar] [CrossRef]
- Studer, K.; Decker, C.; Beck, E.; Schwalm, R. Overcoming oxygen inhibition in UV-curing of acrylate coatings by carbon dioxide inerting, Part I. Prog. Org. Coat. 2003, 48, 92–100. [Google Scholar] [CrossRef]
- Ozarslan, M.M.; Buyukkaplan, U.S.; Barutcigil, C.; Arslan, M.; Turker, N.; Barutcigil, K. Effects of different surface finishing procedures on the change in surface roughness and color of a polymer infiltrated ceramic network material. J. Adv. Prosthodont. 2016, 8, 16–20. [Google Scholar] [CrossRef] [PubMed] [Green Version]
- Ghinea, R.; Pérez, M.M.; Herrera, L.J.; Rivas, M.J.; Yebra, A.; Paravina, R.D. Color difference thresholds in dental ceramics. J. Dent. 2010, 38 (Suppl. 2), e57–e64. [Google Scholar] [CrossRef]
- Mühlemann, S.; Stromeyer, S.; Ioannidis, A.; Attin, T.; Hämmerle, C.H.; Özcan, M. Change in Color and Gloss Parameters of Stained Monolithic Resin-Ceramic CAD/CAM Materials After Simulated Aging: An In Vitro Study. Int. J. Prosthodont. 2021, 34, 79–87. [Google Scholar] [CrossRef]
- Wendt, S.L., Jr. The effect of heat used as secondary cure upon the physical properties of three composite resins. II. Wear, hardness, and color stability. Quintessence Int. 1987, 18, 351–356. [Google Scholar] [PubMed]
- Imirzalioglu, P.; Karacaer, O.; Yilmaz, B.; Ozmen MSc, I. Color stability of denture acrylic resins and a soft lining material against tea, coffee, and nicotine. J. Prosthodont. Implant Esthet. Reconstr. Dent. 2010, 19, 118–124. [Google Scholar] [CrossRef] [PubMed]
- Dietschi, D.; Campanile, G.; Holz, J.; Meyer, J.-M. Comparison of the color stability of ten new-generation composites: An in vitro study. Dent. Mater. 1994, 10, 353–362. [Google Scholar] [CrossRef]
- Haynie, A. Color Stability of 3D-Printed Orthodontic Brackets; The University of Texas School of Dentistry at Houston: Houston, TX, USA, 2020. [Google Scholar]
- Mehrpour, H.; Farjood, E.; Giti, R.; Ghasrdashti, A.B.; Heidari, H. Evaluation of the flexural strength of interim restorative materials in fixed prosthodontics. J. Dent. 2016, 17, 201. [Google Scholar]
- Ayman, A.-D. The residual monomer content and mechanical properties of CAD/CAM resins used in the fabrication of complete dentures as compared to heat cured resins. Electron. Physician 2017, 9, 4766. [Google Scholar] [CrossRef] [Green Version]
- Nguyen, J.-F.; Migonney, V.; Ruse, N.D.; Sadoun, M. Resin composite blocks via high-pressure high-temperature polymerization. Dent. Mater. 2012, 28, 529–534. [Google Scholar] [CrossRef]
- Al-Dwairi, Z.N.; Tahboub, K.Y.; Baba, N.Z.; Goodacre, C.J. A comparison of the flexural and impact strengths and flexural modulus of CAD/CAM and conventional heat-cured polymethyl methacrylate (PMMA). J. Prosthodont. 2020, 29, 341–349. [Google Scholar] [CrossRef]
- Simoneti, D.M.; Pereira-Cenci, T.; dos Santos, M.B.F. Comparison of material properties and biofilm formation in interim single crowns obtained by 3D printing and conventional methods. J. Prosthet. Dent. 2020. [Google Scholar] [CrossRef]
- Ferracane, J.L.; Berge, H.X.; Condon, J.R. In vitro aging of dental composites in water—Effect of degree of conversion, filler volume, and filler/matrix coupling. J. Biomed. Mater. Res. 1998, 42, 465–472. [Google Scholar] [CrossRef]
- Druck, C.C.; Pozzobon, J.L.; Callegari, G.L.; Dorneles, L.S.; Valandro, L.F. Adhesion to Y-TZP ceramic: Study of silica nanofilm coating on the surface of Y-TZP. J. Biomed. Mater. Res. B Appl. Biomater. 2015, 103, 143–150. [Google Scholar] [CrossRef] [PubMed]
- Berli, C.; Thieringer, F.M.; Sharma, N.; Müller, J.A.; Dedem, P.; Fischer, J.; Rohr, N. Comparing the mechanical properties of pressed, milled, and 3D-printed resins for occlusal devices. J. Prosthet. Dent. 2020, 124, 780–786. [Google Scholar] [CrossRef] [PubMed]
- Argyrou, R.; Thompson, G.A.; Cho, S.H.; Berzins, D.W. Edge chipping resistance and flexural strength of polymer infiltrated ceramic network and resin nanoceramic restorative materials. J. Prosthet. Dent. 2016, 116, 397–403. [Google Scholar] [CrossRef] [PubMed] [Green Version]
- Kurtulmus-Yilmaz, S.; Cengiz, E.; Ongun, S.; Karakaya, I. The Effect of Surface Treatments on the Mechanical and Optical Behaviors of CAD/CAM Restorative Materials. J. Prosthodont. 2019, 28, e496–e503. [Google Scholar] [CrossRef] [PubMed]
- Ishida, Y.; Miyasaka, T. Dimensional accuracy of dental casting patterns created by 3D printers. Dent. Mater. J. 2016, 35, 250–256. [Google Scholar] [CrossRef] [PubMed] [Green Version]
- Zhang, B.; Pei, X.; Zhou, C.; Fan, Y.; Jiang, Q.; Ronca, A.; D’Amora, U.; Chen, Y.; Li, H.; Sun, Y. The biomimetic design and 3D printing of customized mechanical properties porous Ti6Al4V scaffold for load-bearing bone reconstruction. Mater. Des. 2018, 152, 30–39. [Google Scholar] [CrossRef]
- Bhargav, A.; Sanjairaj, V.; Rosa, V.; Feng, L.W.; Fuh YH, J. Applications of additive manufacturing in dentistry: A review. J. Biomed. Mater. Res. Part B Appl. Biomater. 2018, 106, 2058–2064. [Google Scholar] [CrossRef] [PubMed]
- Neto, R.; Costa-Ferreira, A.; Leal, N.; Machado, M.; Reis, A. An engineering-based approach for design and fabrication of a customized nasal prosthesis. Prosthet. Orthot. Int. 2015, 39, 422–428. [Google Scholar] [CrossRef]
- Tsai, M.-J.; Wu, C.-T. Study of mandible reconstruction using a fibula flap with application of additive manufacturing technology. Biomed. Eng. Online 2014, 13, 1–15. [Google Scholar] [CrossRef] [Green Version]


| Type | Product | Code | Composition | Manufacturer |
|---|---|---|---|---|
| 3D printed resin | Denture teeth A2; | FMLB | Methacrylate monomer, diurethane dimethacrylate, propylidynetrimethyl trimethacrylate | Formlabs, Sommerville, MA, USA |
| 3D printed resin | NextDent C&B | NXT | >90% Methacrylic oligomers, methacrylate monomer, <3% phosphine oxides, pigment | NextDent, Soesterburg, the Netherlands |
| PLC-based CAD/CAM material | PLC ‡ | PLC | PLC (88 wt%), inorganic filler (2 wt%), nano silica (8 wt%), glass fiber additive (1 wt% alkoxysilane) | Line Dental Lab, Seoul, Korea |
| PMMA-based CAD/CAM material | VIPI BLOCK | PMMA | Highly cross-linked PMMA | Dental VIPI, VIPI, São Paulo, Brazil |
| Resin nano ceramic CAD/CAM material (DFC) | MAZIC Duro | DFC | 20 wt% reinforced matrix, 80 wt% ceramic nanofillers | Vericom, Chuncheon, Korea |
| PICN CAD/CAM material | VITA ENAMIC | PICN | 86 wt% feldspathic-based ceramic network, 14 wt% acrylate polymer network (infiltrated into feldspathic-based ceramic network) | VITA Zahnfabrik, Bad Säckingen, Germany |
Publisher’s Note: MDPI stays neutral with regard to jurisdictional claims in published maps and institutional affiliations. |
© 2021 by the authors. Licensee MDPI, Basel, Switzerland. This article is an open access article distributed under the terms and conditions of the Creative Commons Attribution (CC BY) license (https://creativecommons.org/licenses/by/4.0/).
Share and Cite
Nam, N.-E.; Shin, S.-H.; Lim, J.-H.; Shim, J.-S.; Kim, J.-E. Effects of Artificial Tooth Brushing and Hydrothermal Aging on the Mechanical Properties and Color Stability of Dental 3D Printed and CAD/CAM Materials. Materials 2021, 14, 6207. https://0-doi-org.brum.beds.ac.uk/10.3390/ma14206207
Nam N-E, Shin S-H, Lim J-H, Shim J-S, Kim J-E. Effects of Artificial Tooth Brushing and Hydrothermal Aging on the Mechanical Properties and Color Stability of Dental 3D Printed and CAD/CAM Materials. Materials. 2021; 14(20):6207. https://0-doi-org.brum.beds.ac.uk/10.3390/ma14206207
Chicago/Turabian StyleNam, Na-Eun, Seung-Ho Shin, Jung-Hwa Lim, June-Sung Shim, and Jong-Eun Kim. 2021. "Effects of Artificial Tooth Brushing and Hydrothermal Aging on the Mechanical Properties and Color Stability of Dental 3D Printed and CAD/CAM Materials" Materials 14, no. 20: 6207. https://0-doi-org.brum.beds.ac.uk/10.3390/ma14206207