
Experimental Study on the Characterization of Orientation of Polyester Short Fibers in Rubber Composites by an X-ray Three-Dimensional Microscope


Abstract
:1. Introduction
2. Experimental
2.1. Main Materials
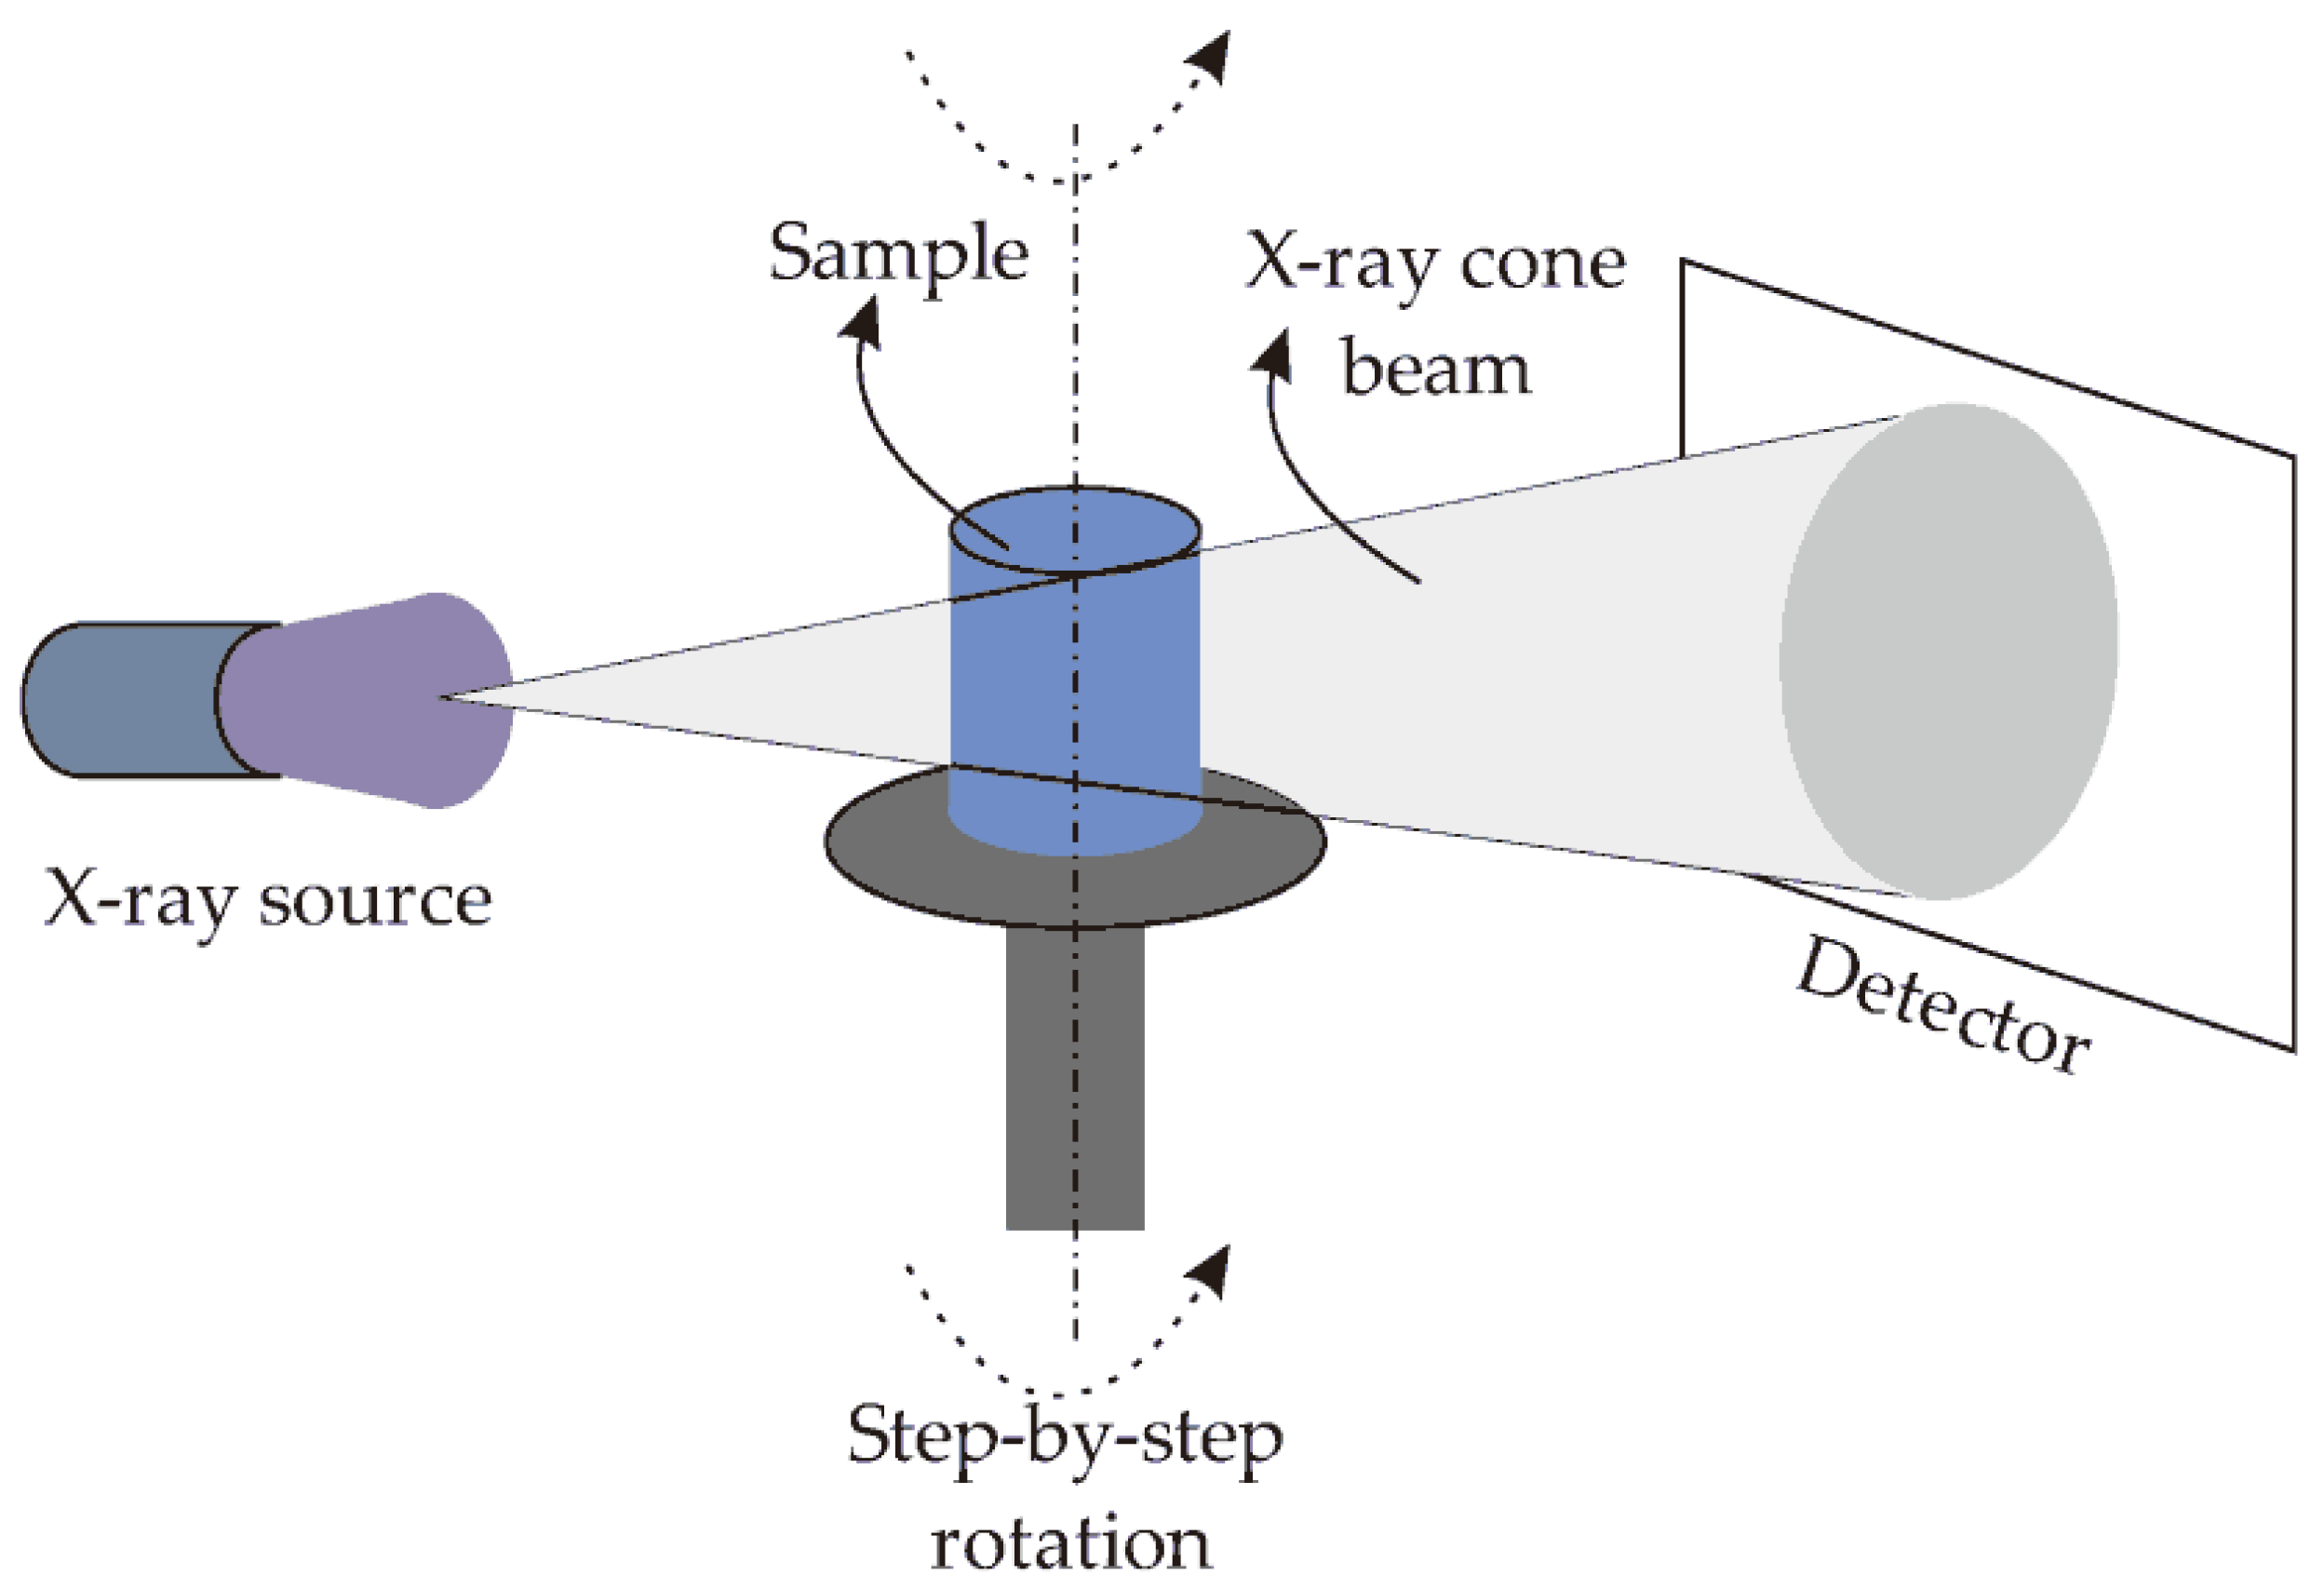
2.2. Test Equipment
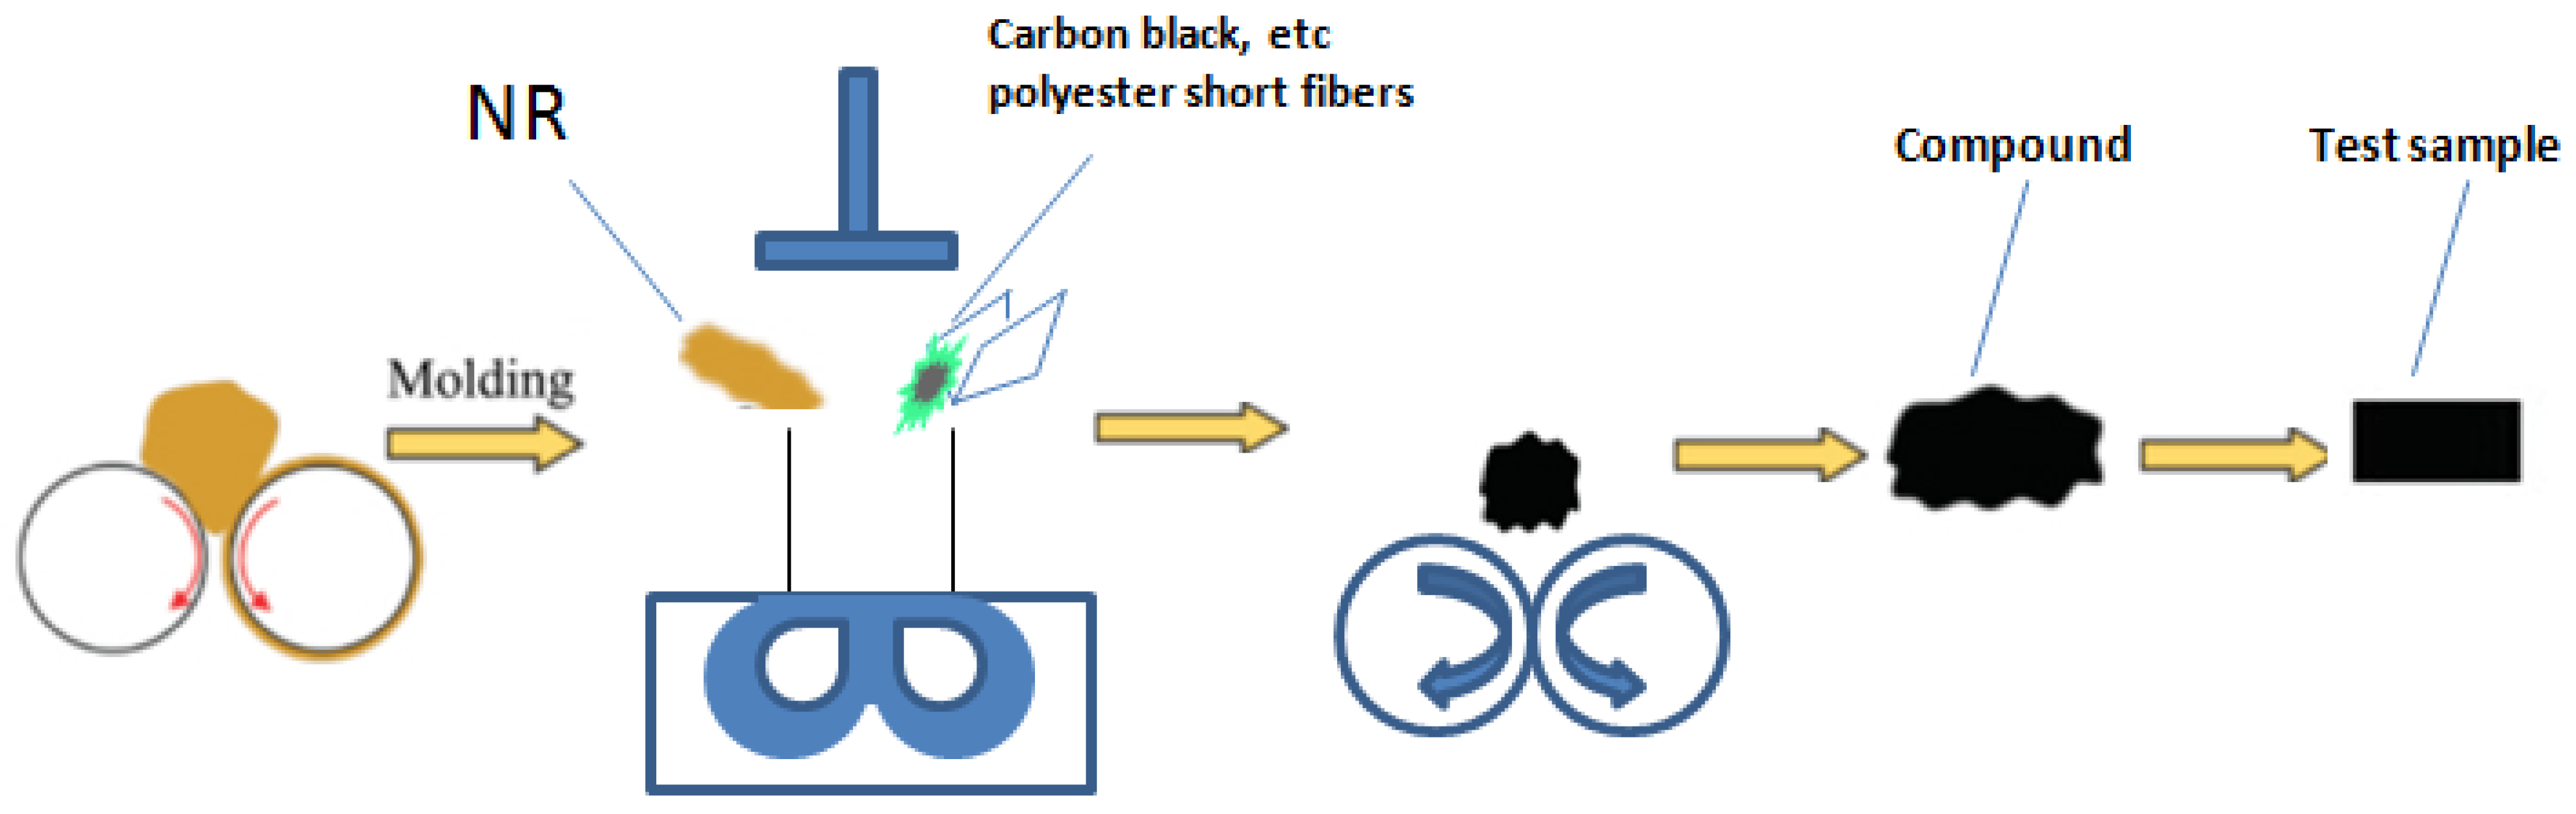
2.3. Preparation of Rubber Compounds
Polyester Short Fiber Compounds
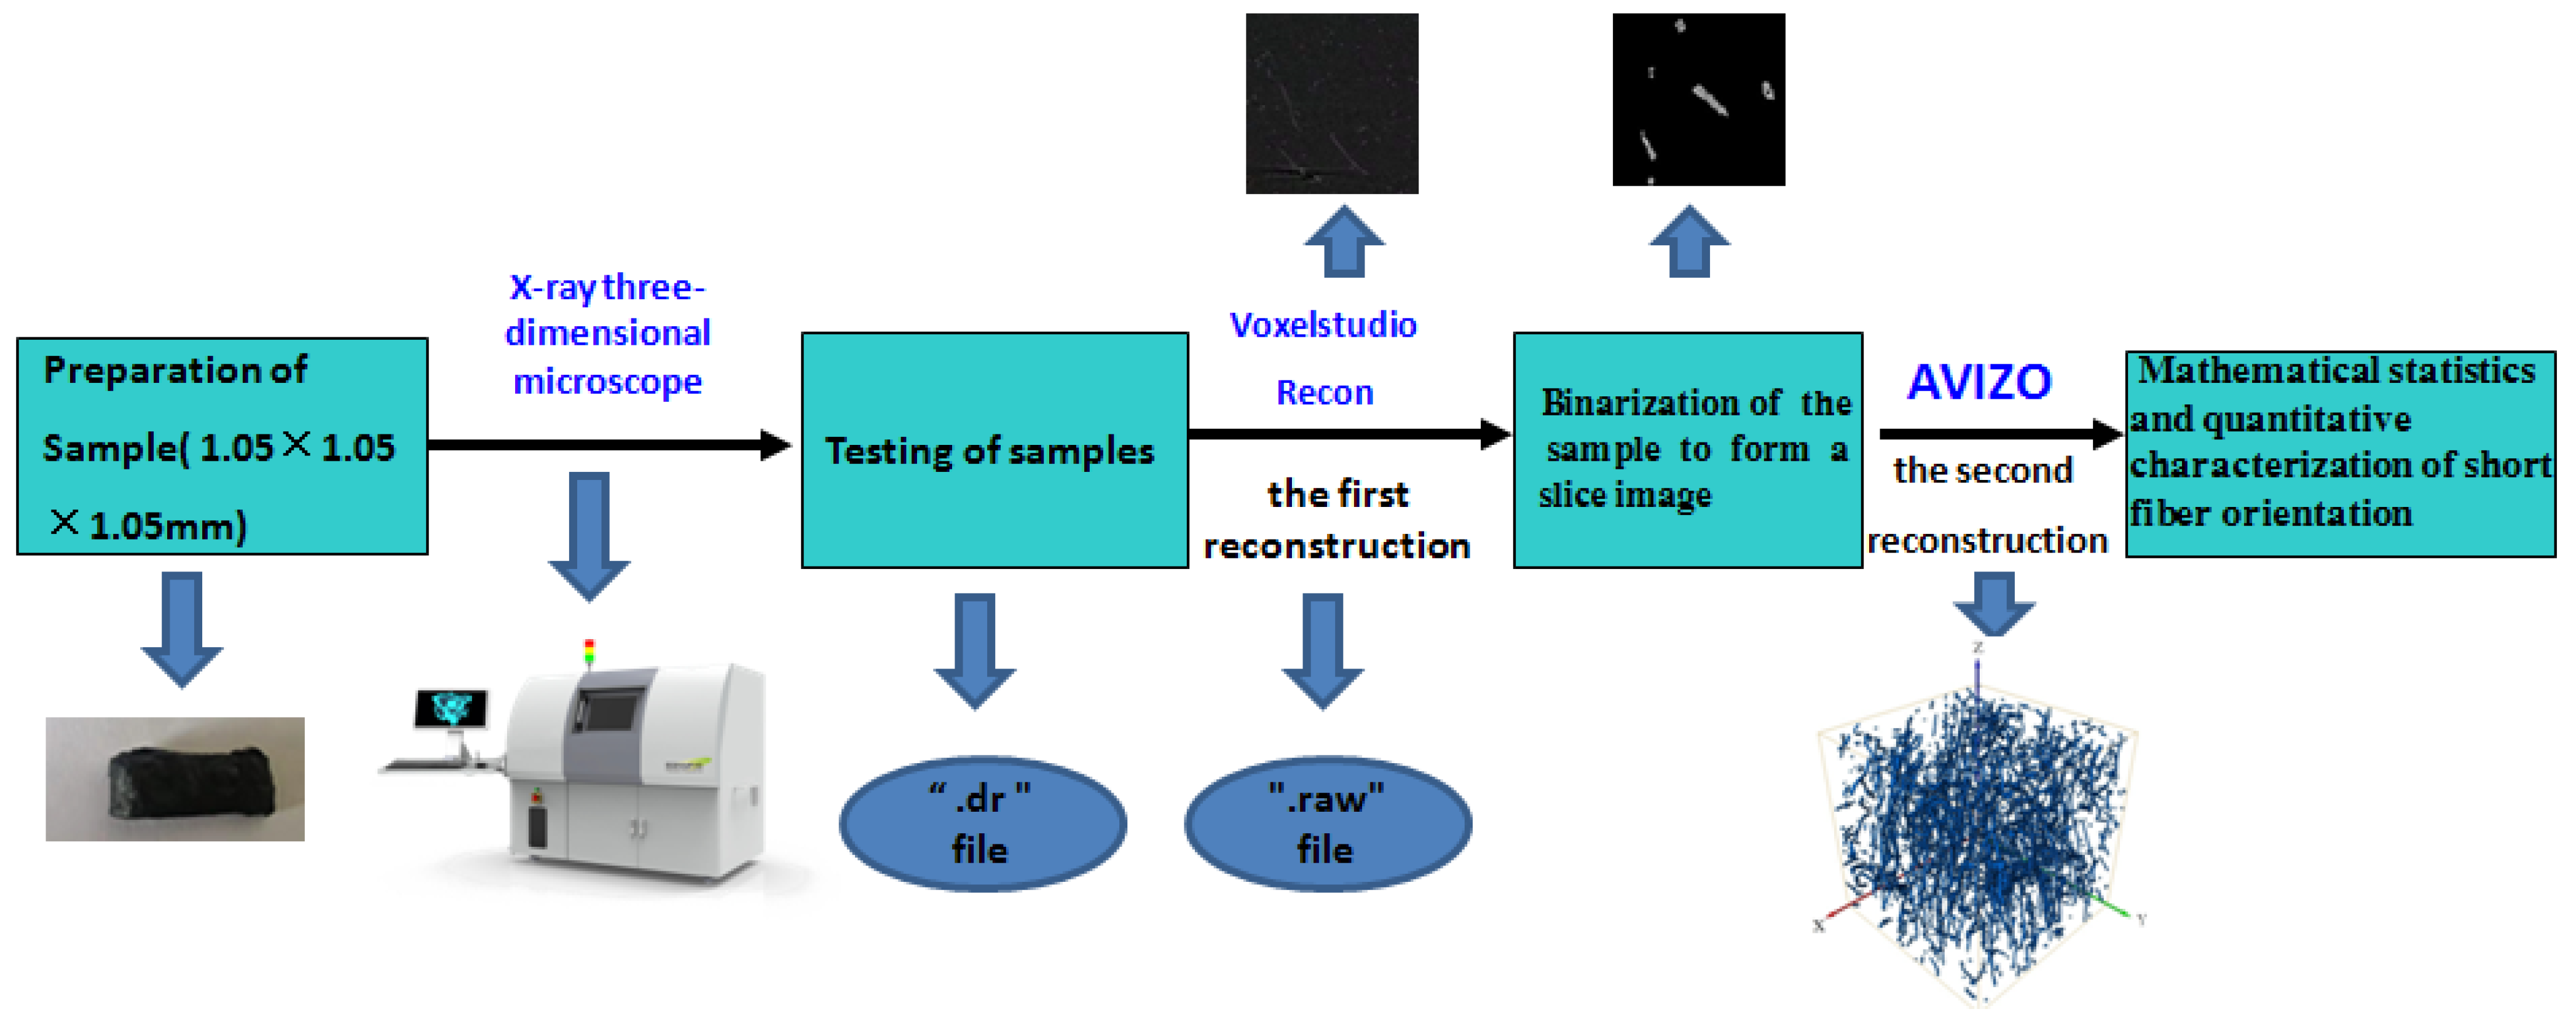
2.4. Three-Dimensional Reconstruction Experiments of an X-ray Three-Dimensional Microscope and 3Dmed
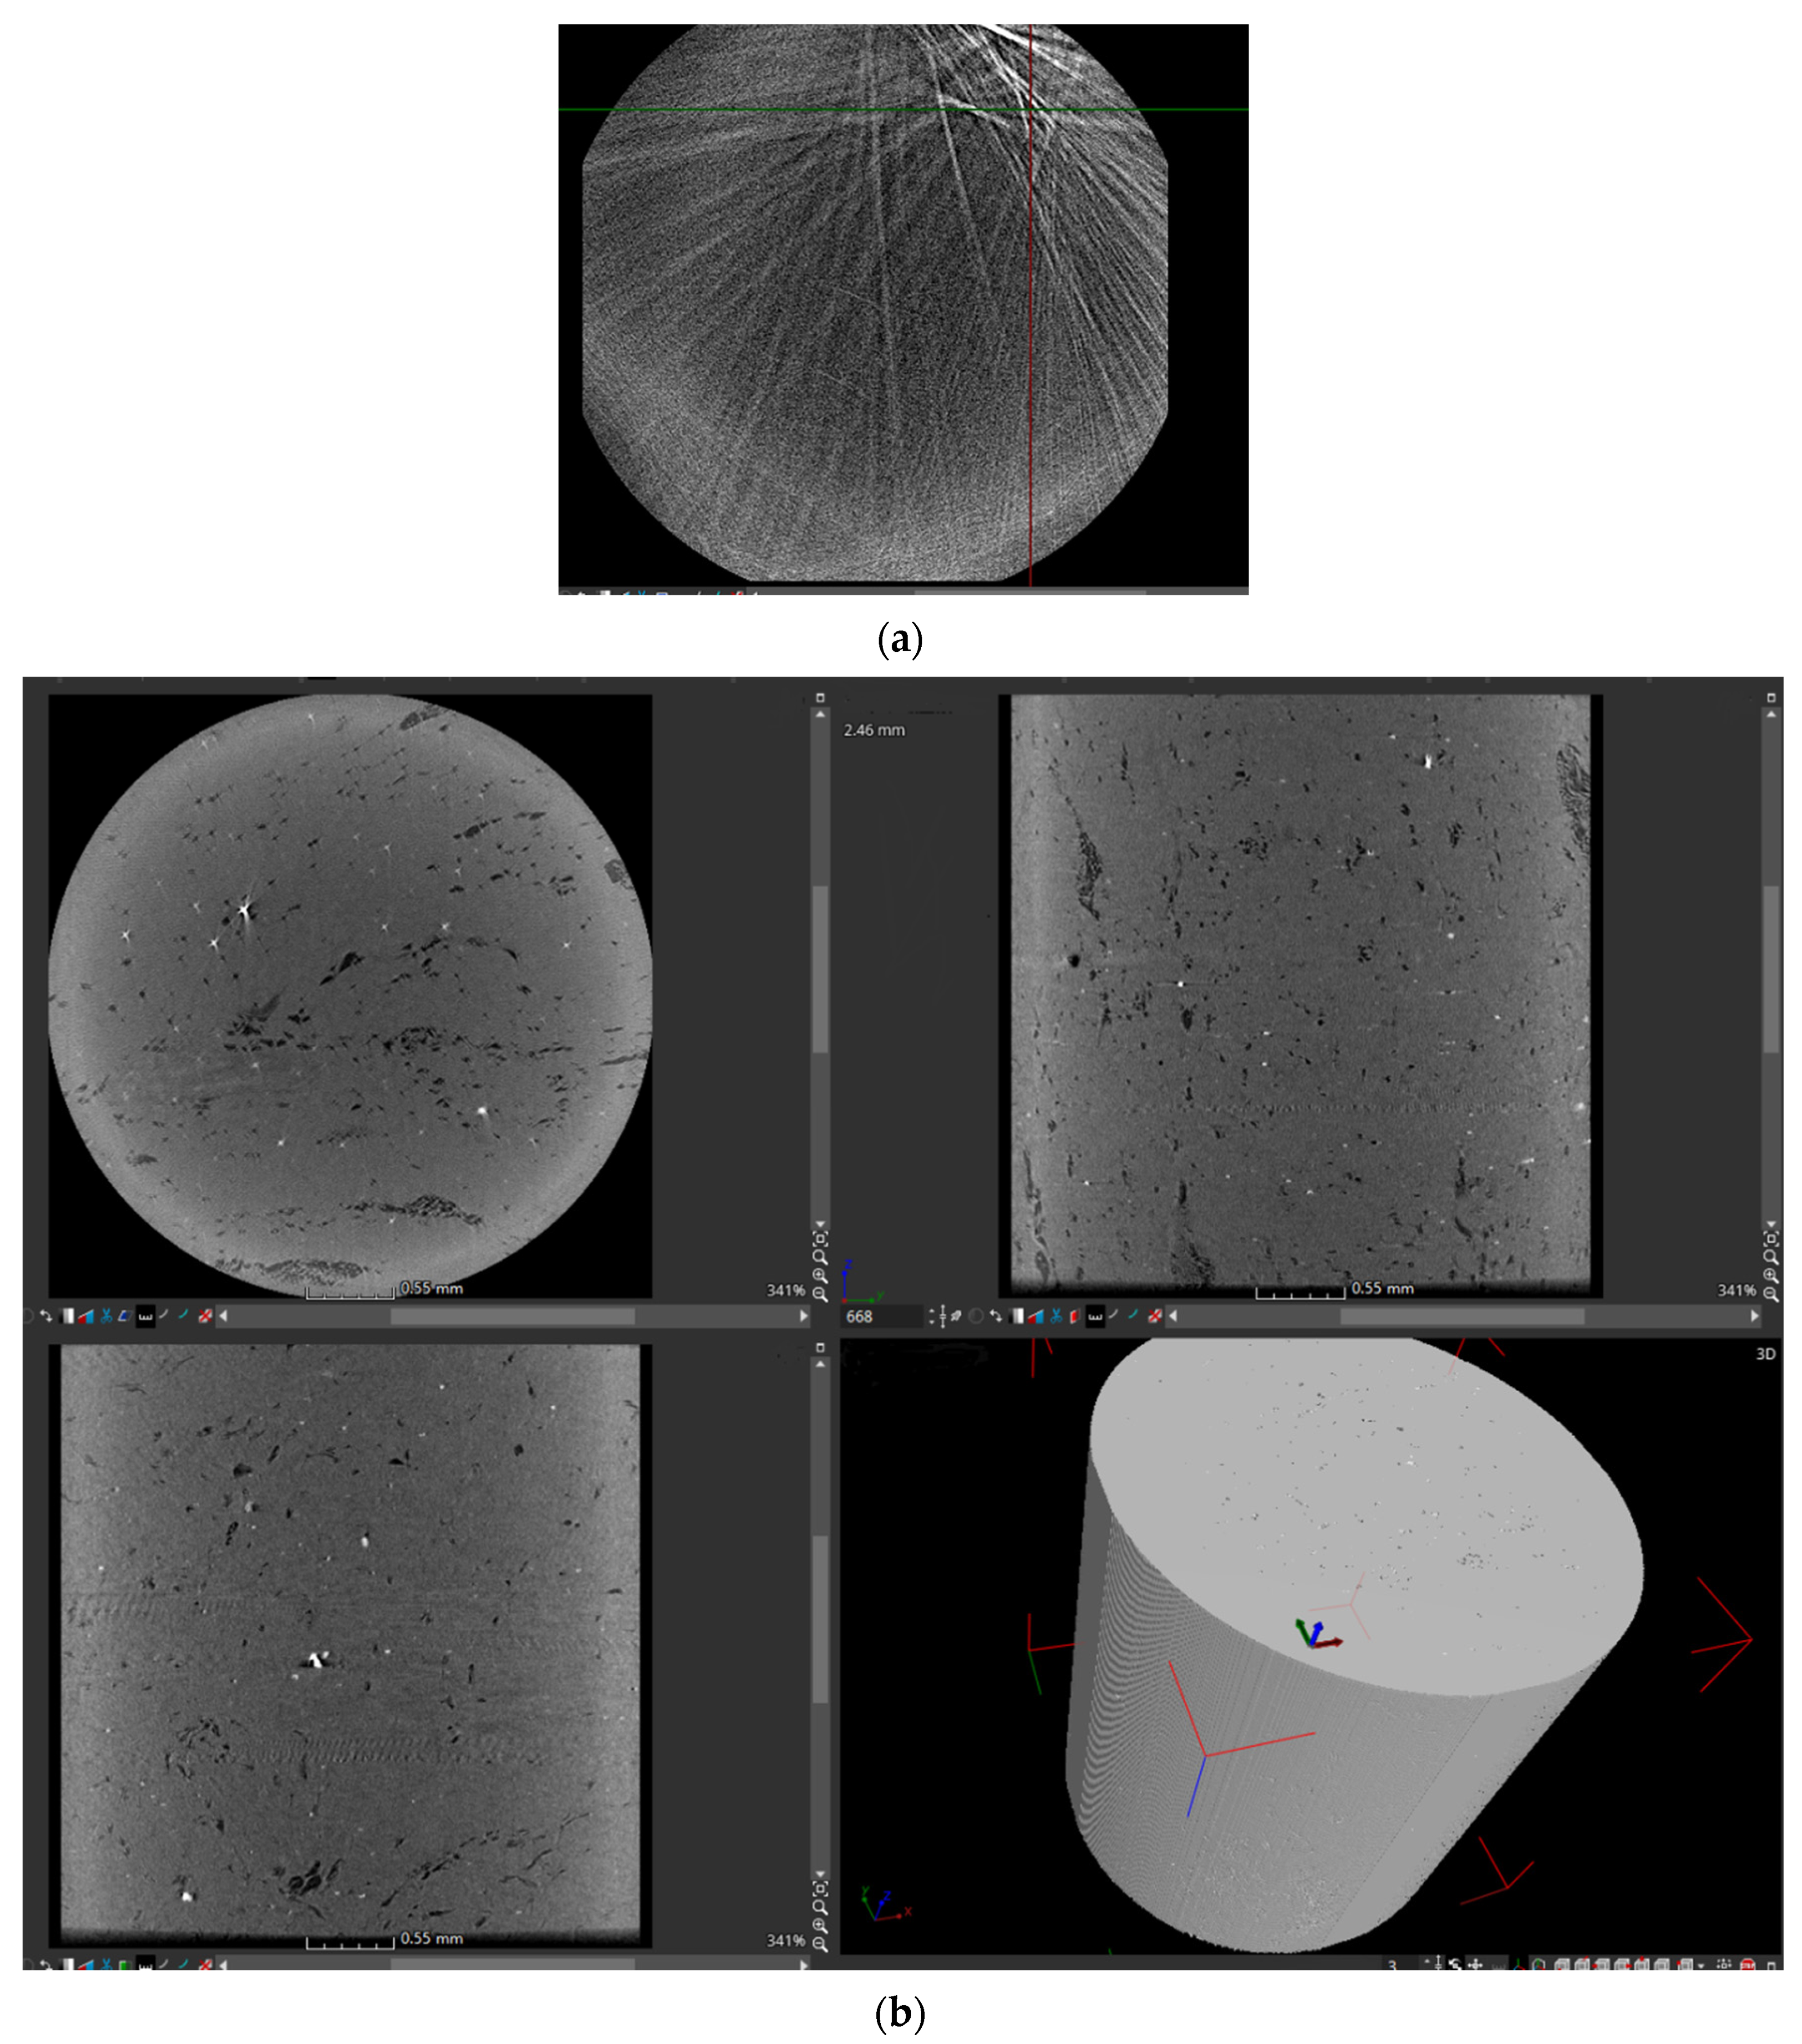
2.4.1. Three-Dimensional Reconstructed Images of Avizo Software
2.4.2. Comparison of Three-Dimensional Reconstructed Images between 3Dmed and Avizo Software
3. Three-Dimensional Reconstruction and Characterization of X-ray Image
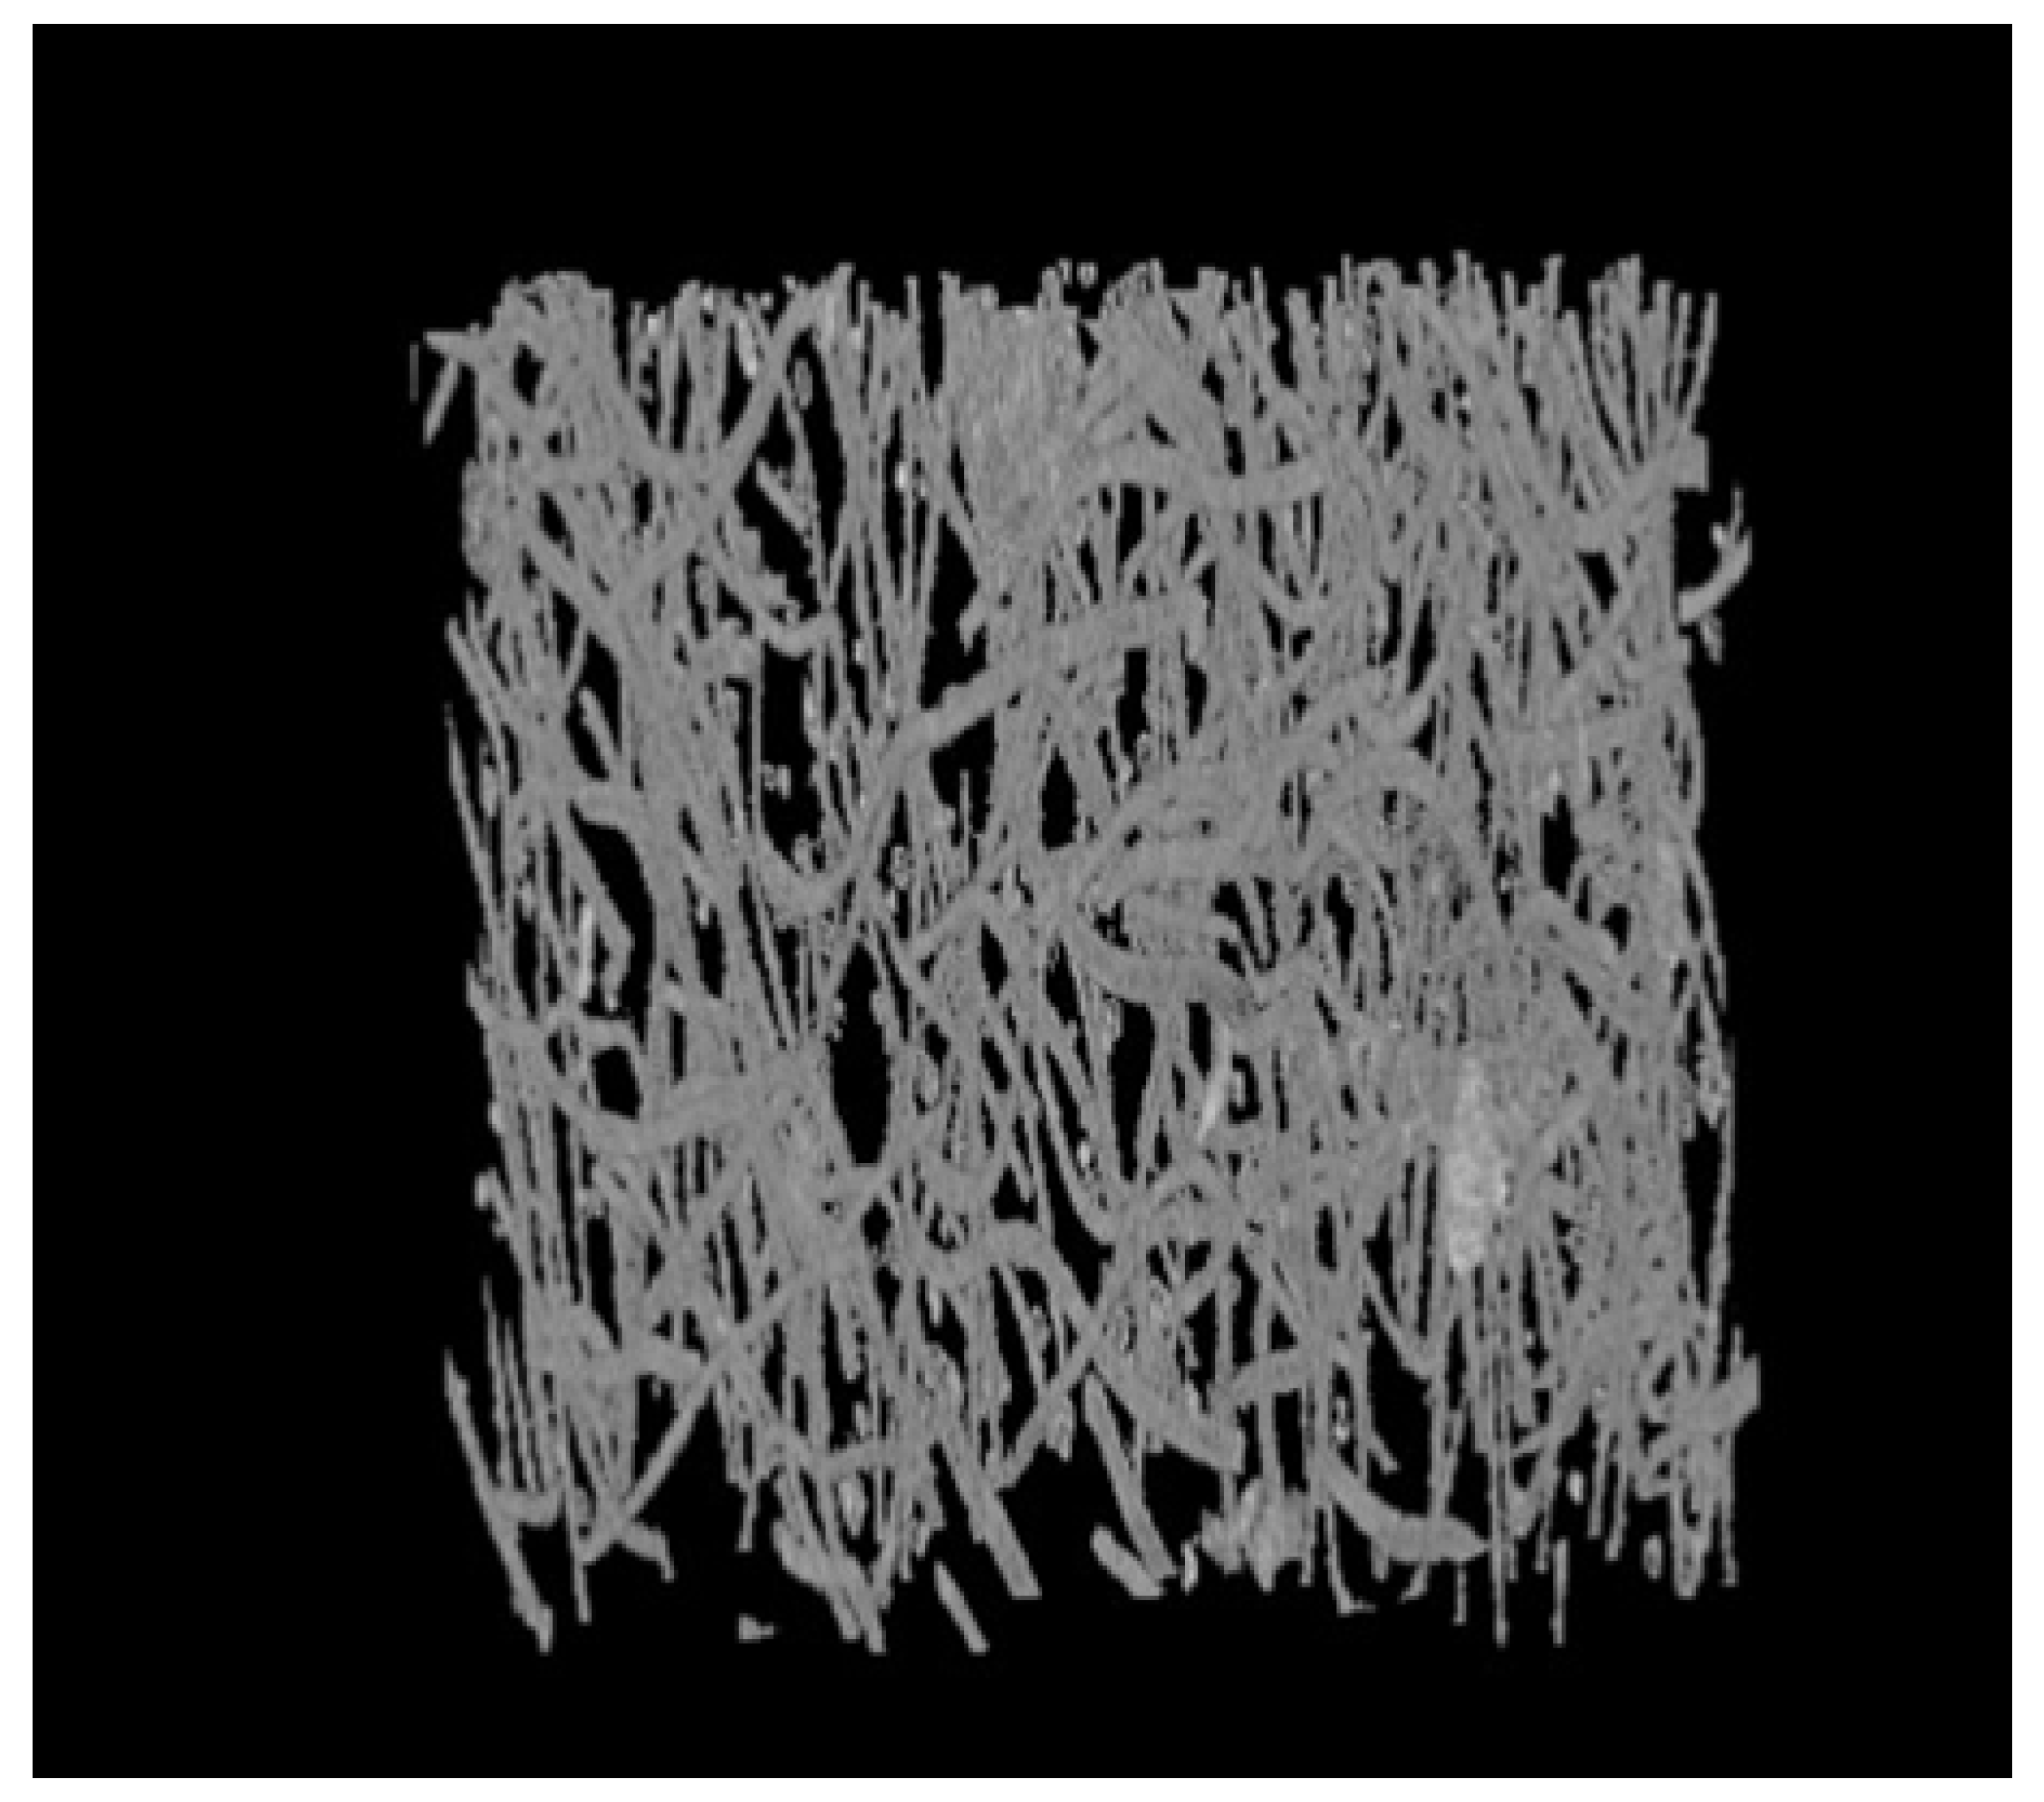
3.1. Processing and Analysis of Three-Dimensional Reconstructed Image Based on Avizo
Digital Image Processing
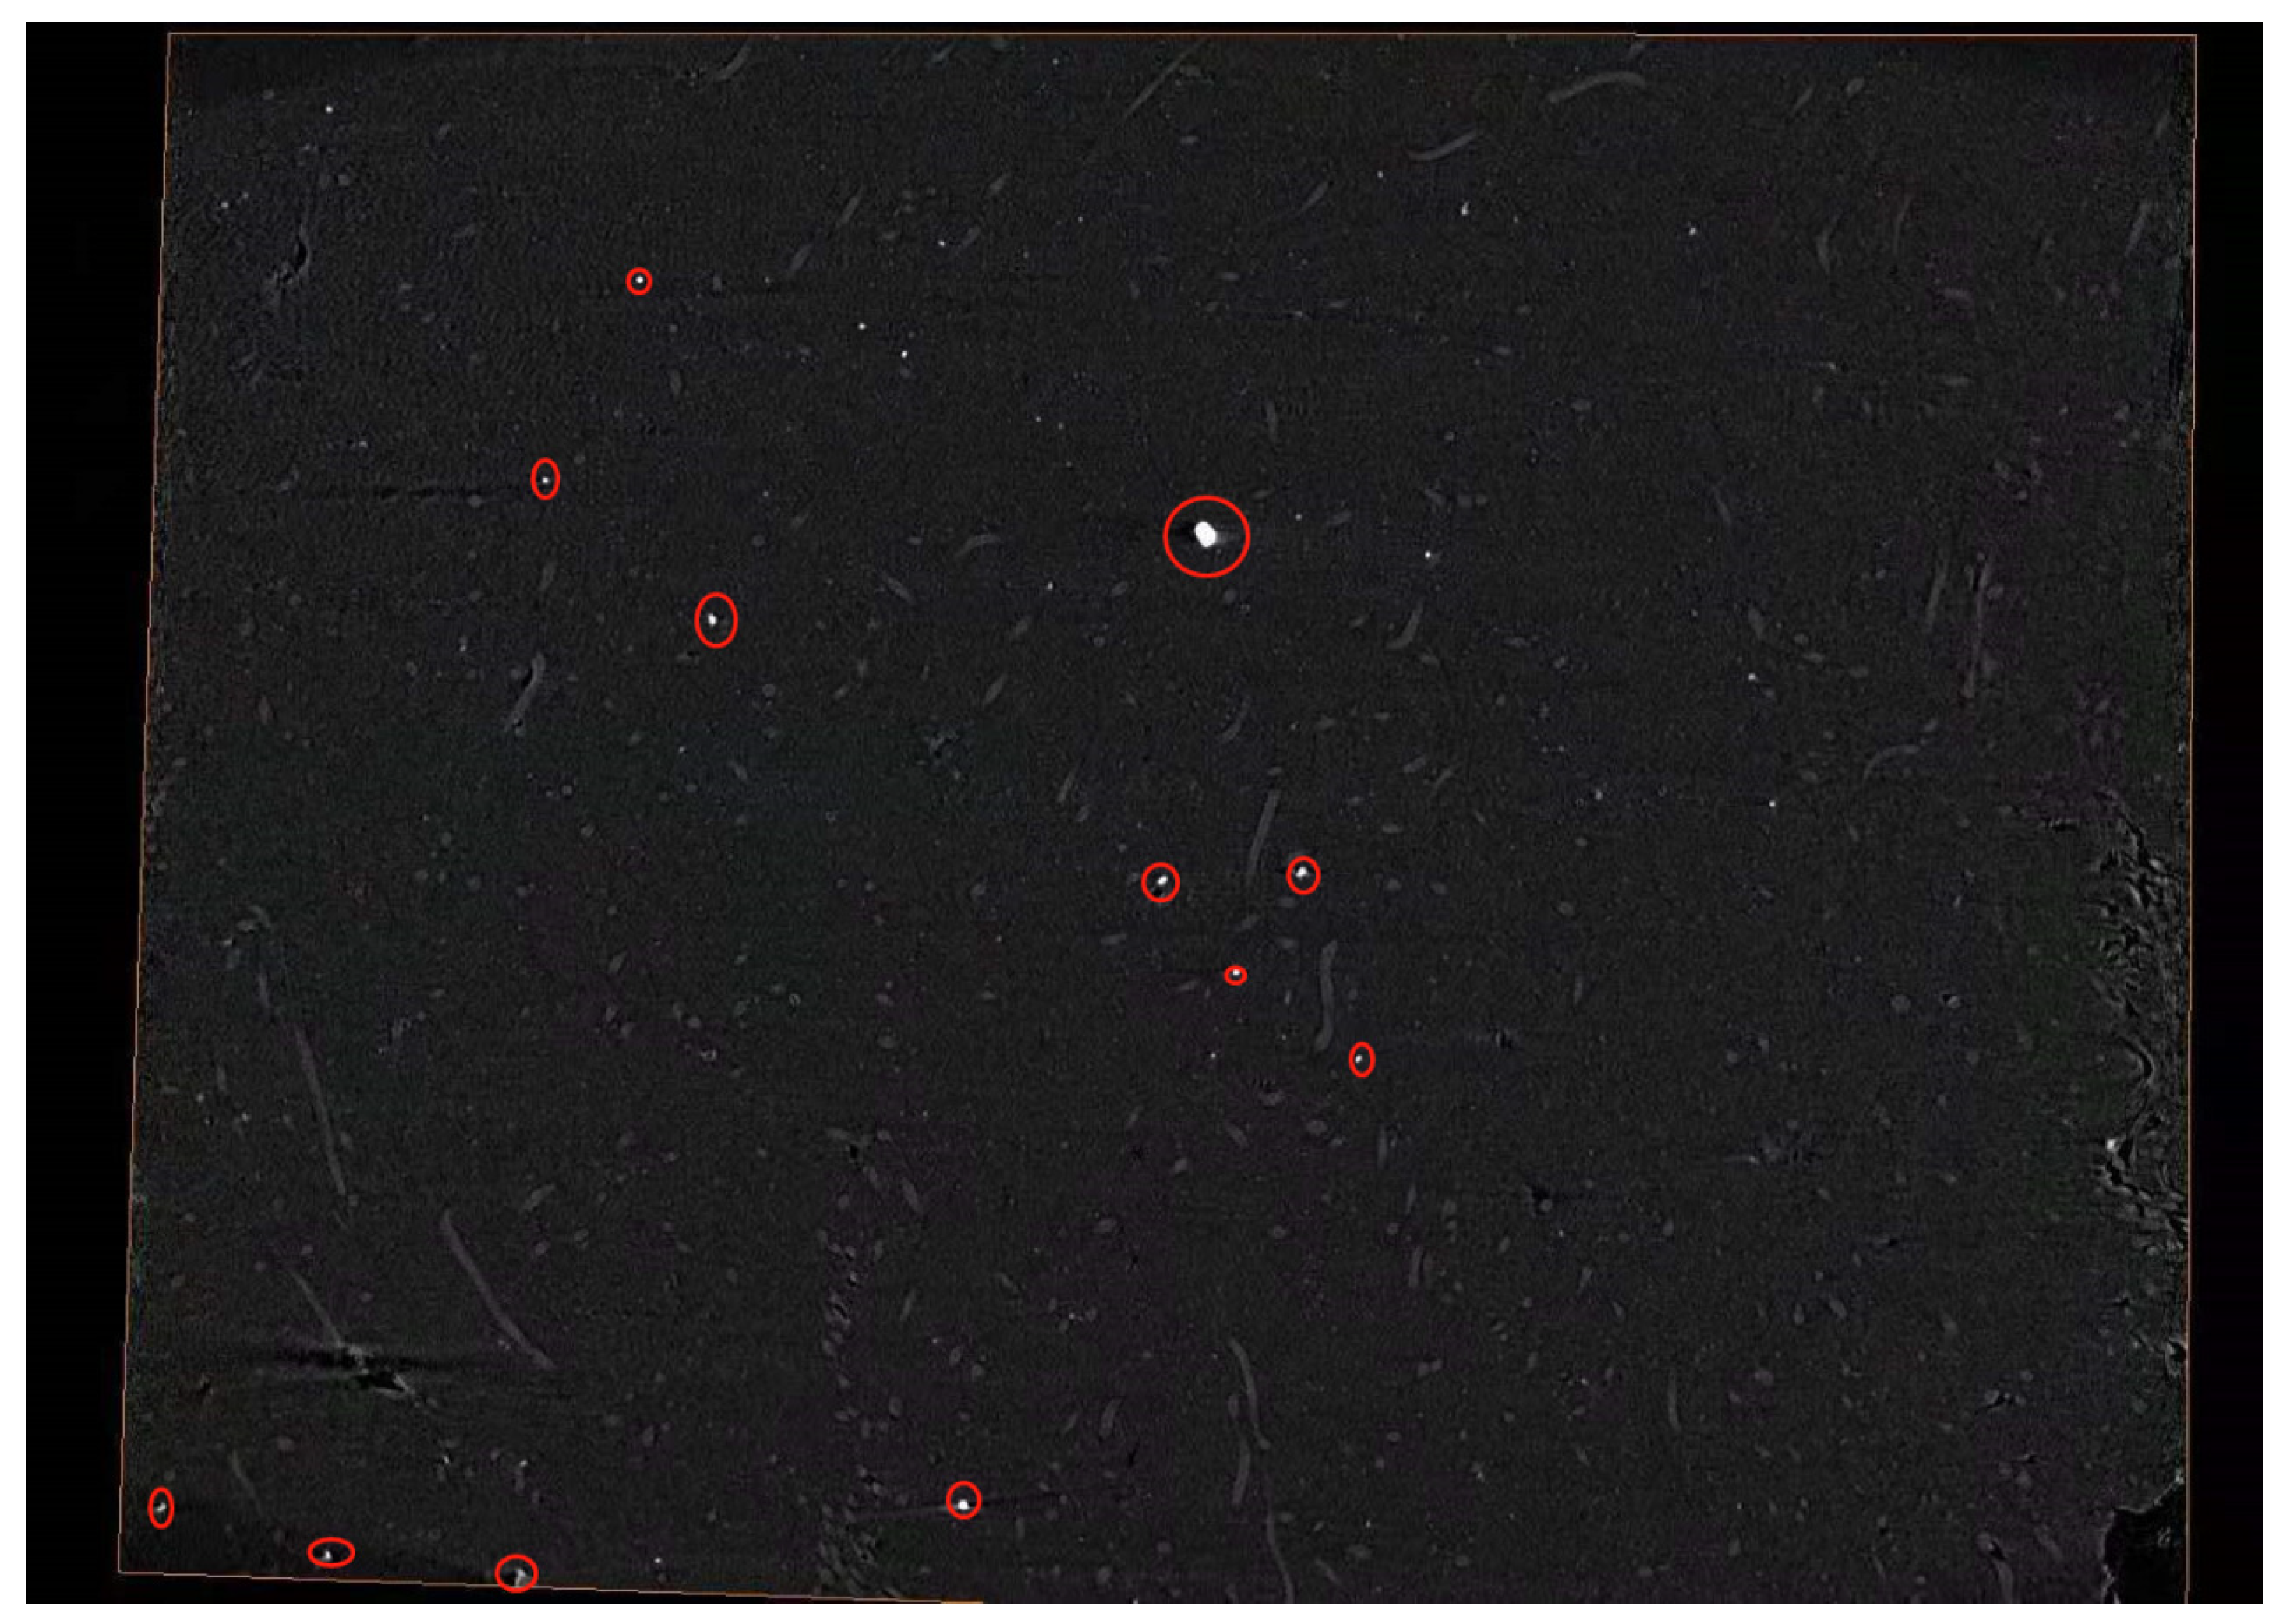
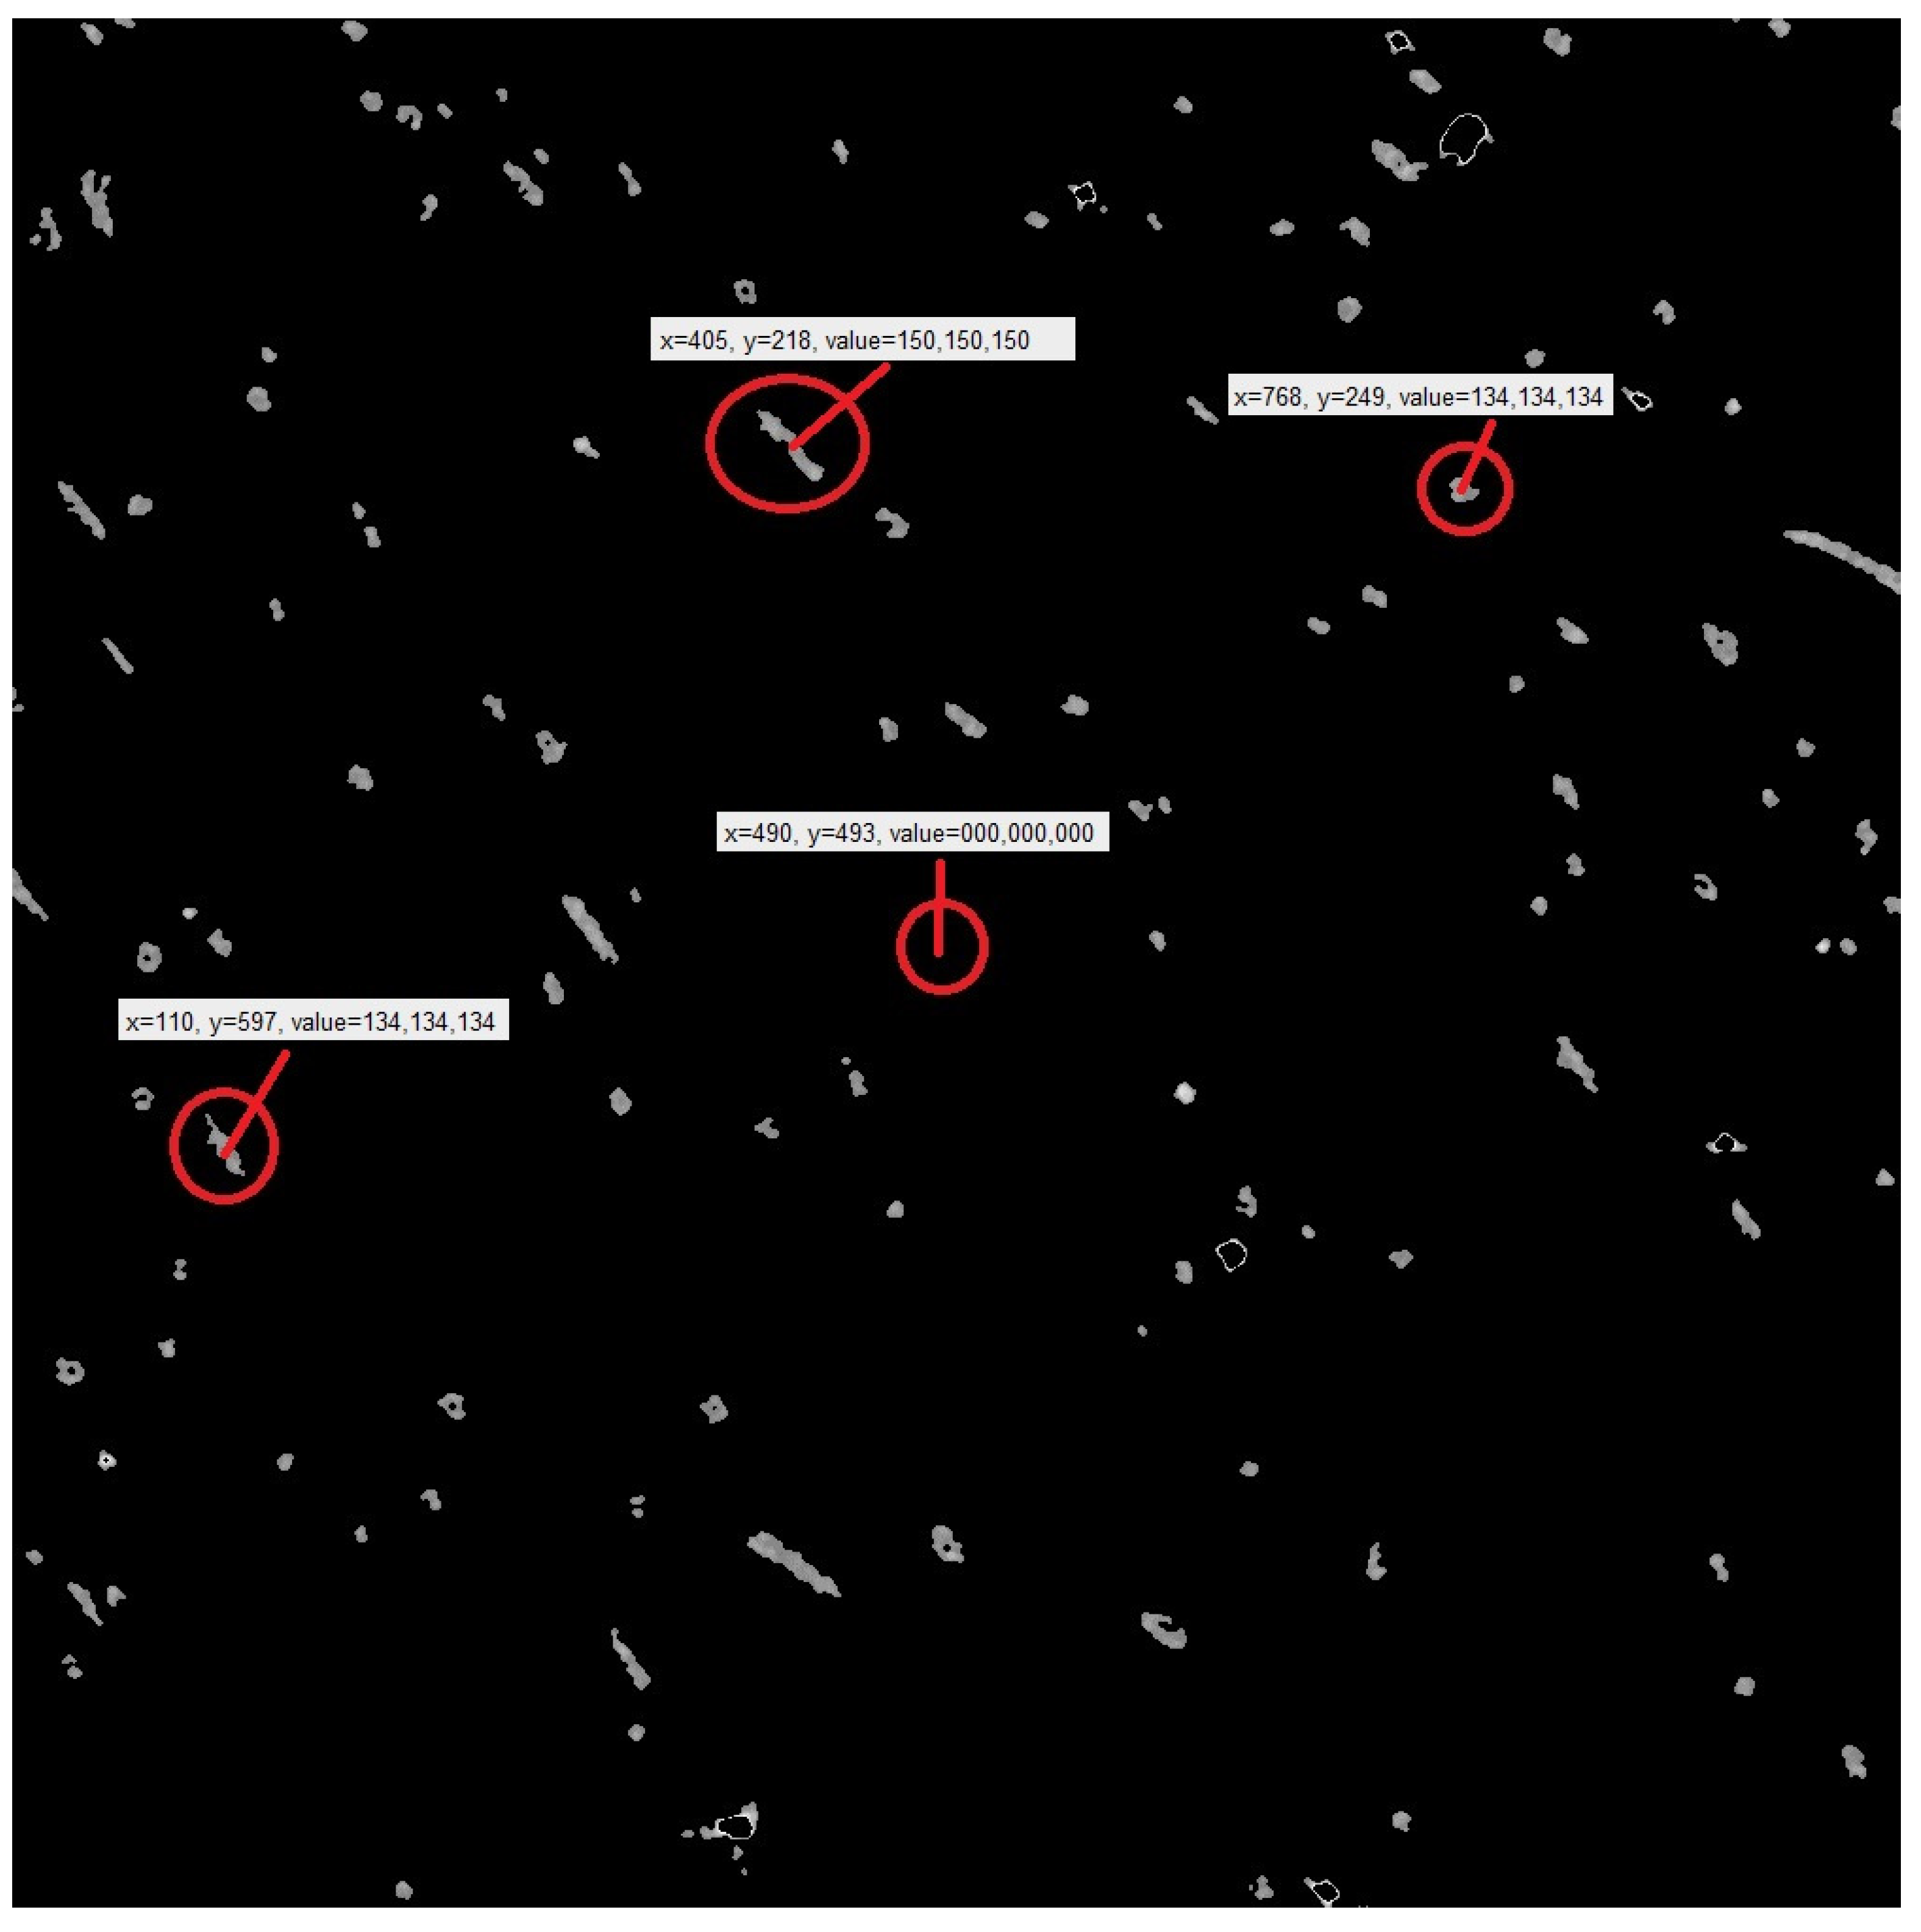
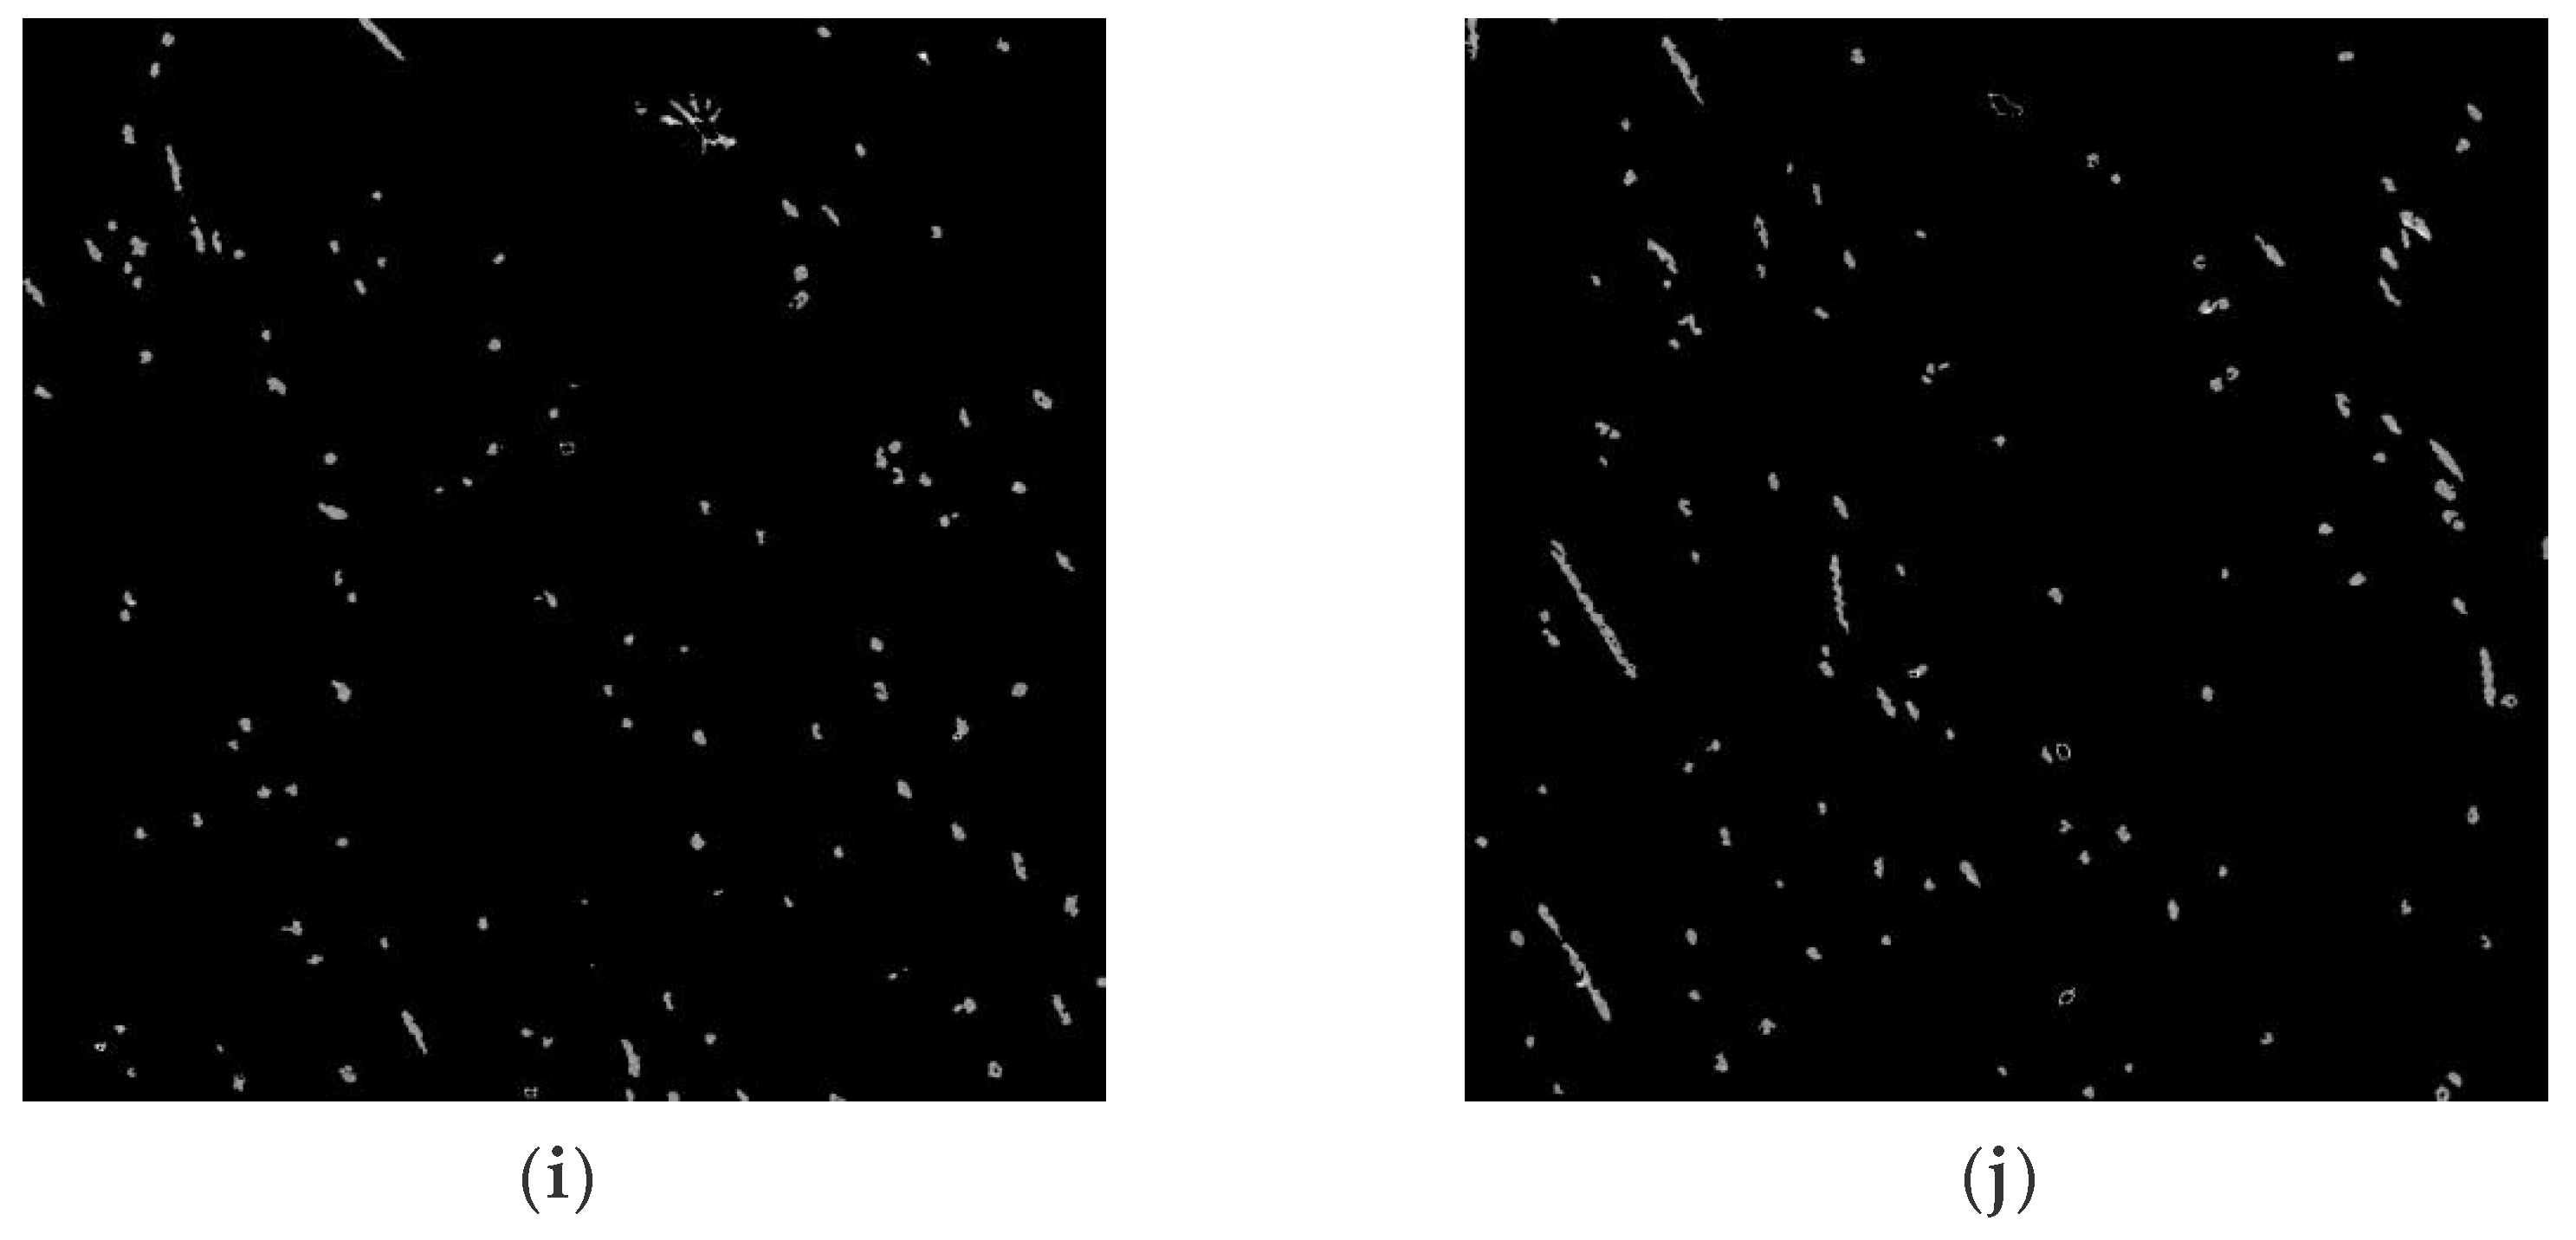
3.2. Identification and Comparison of Polyester Short Fibers
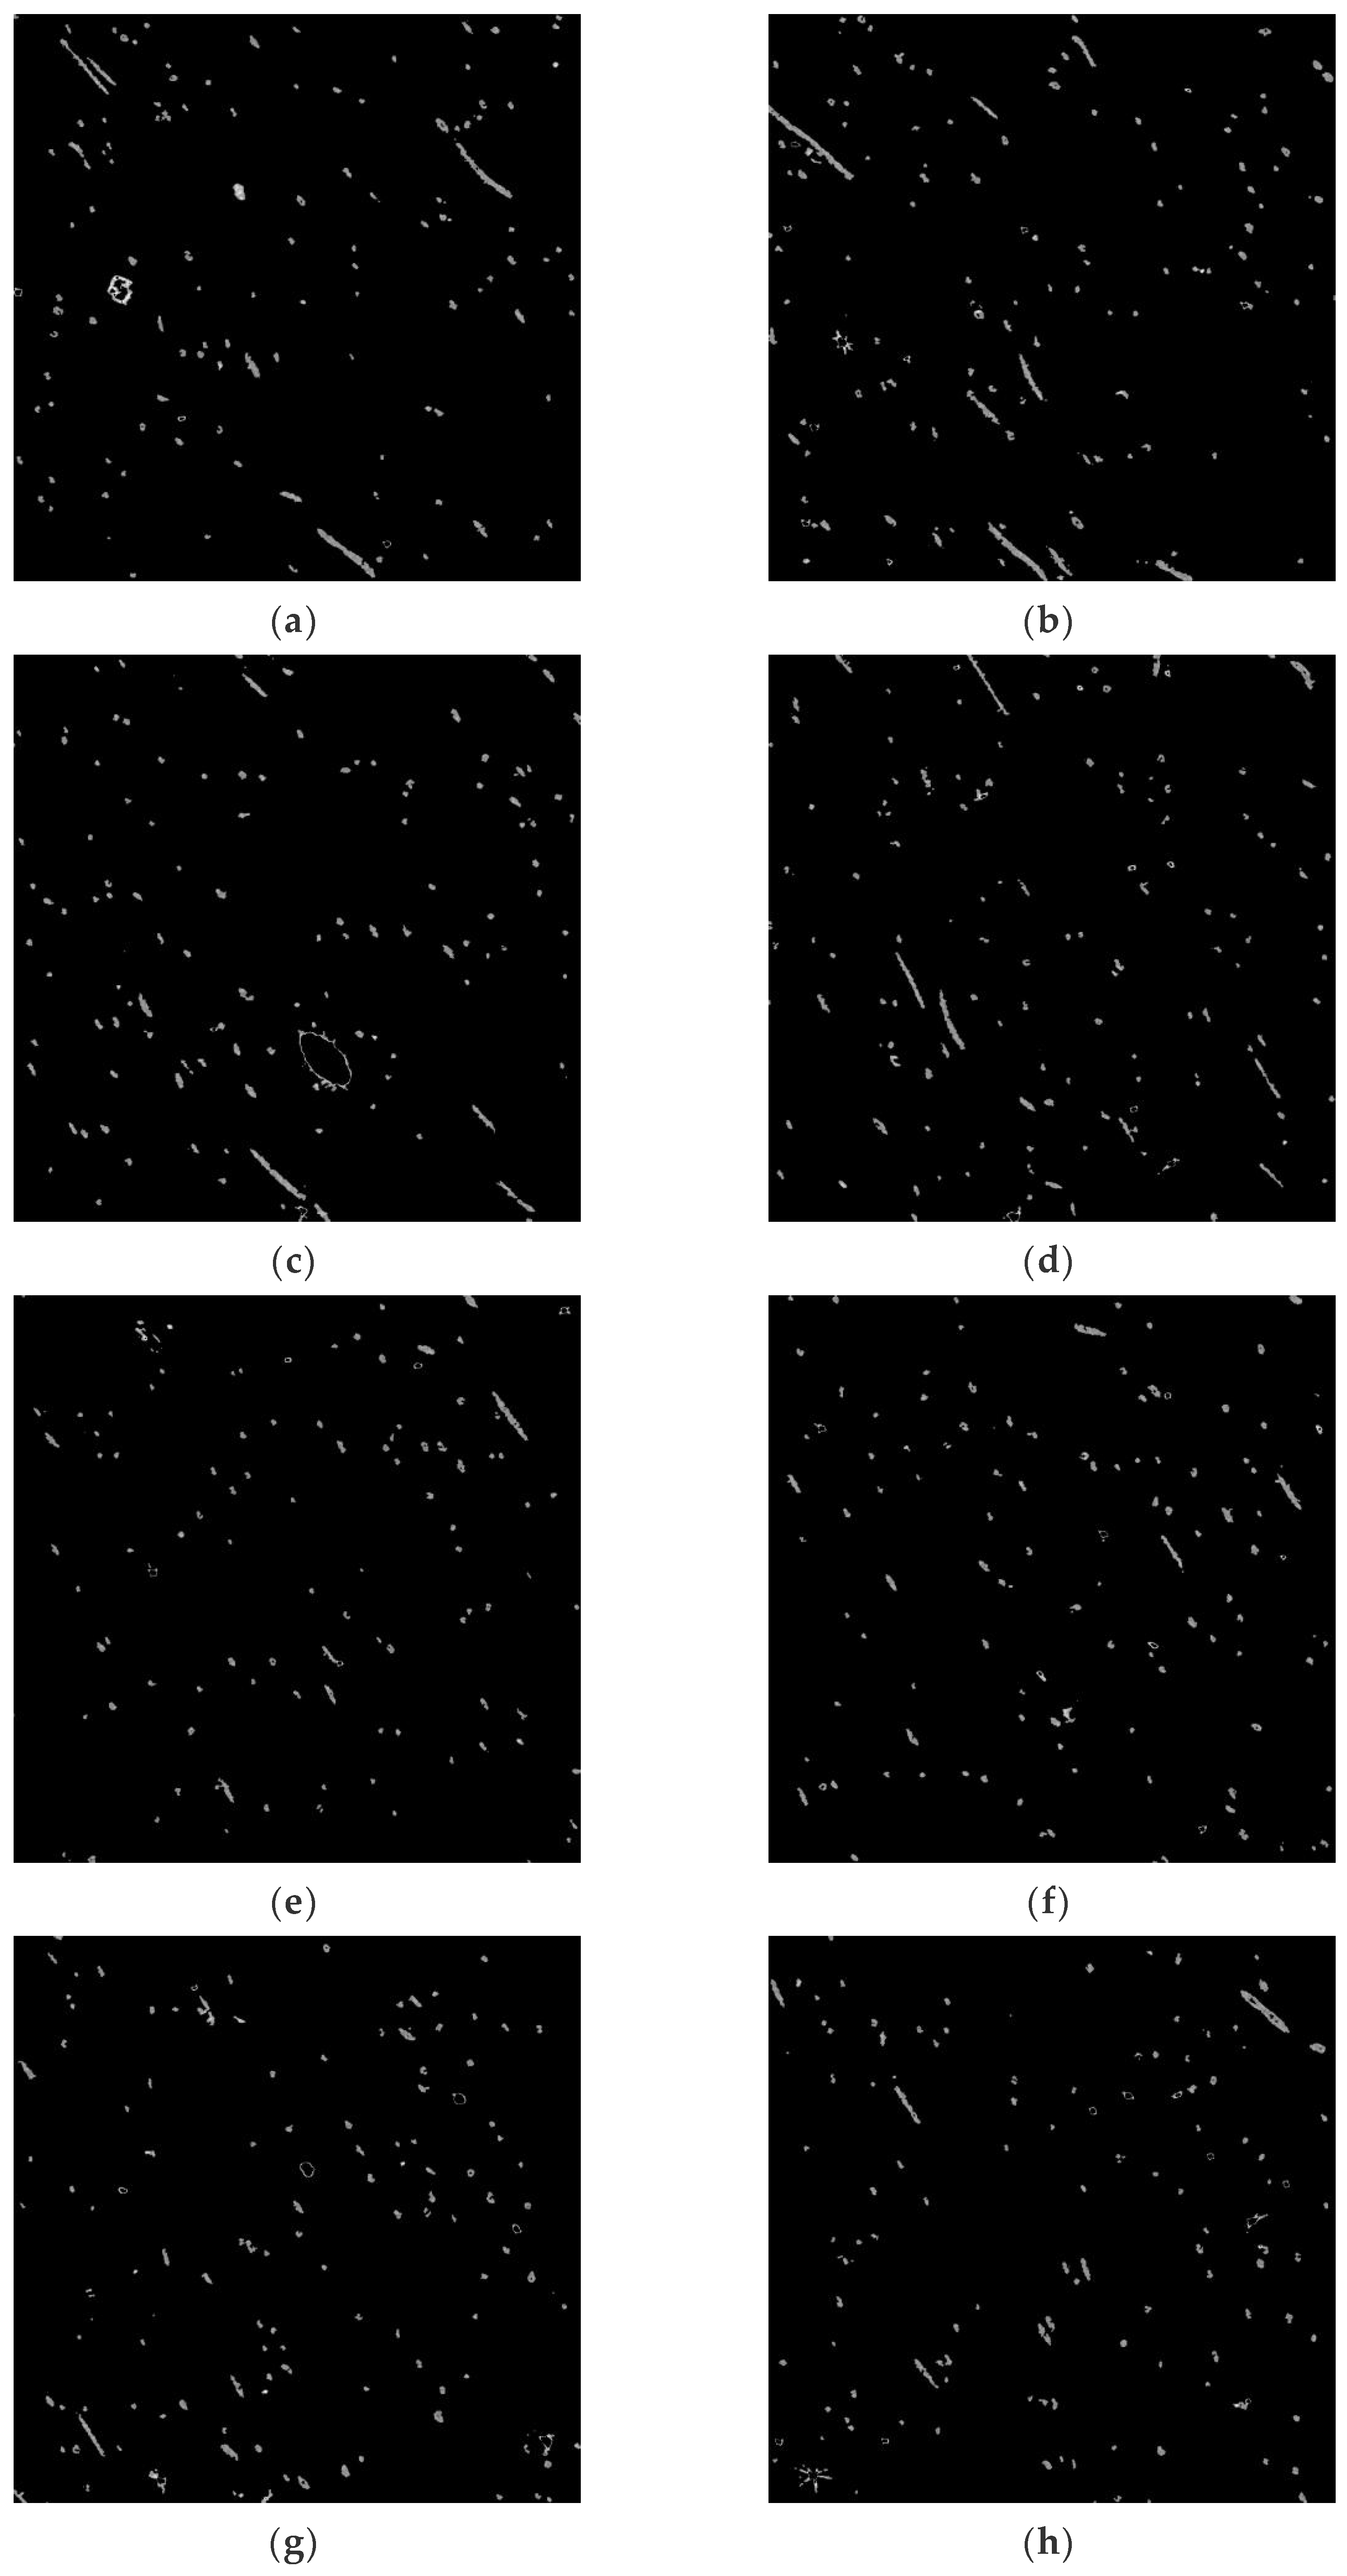
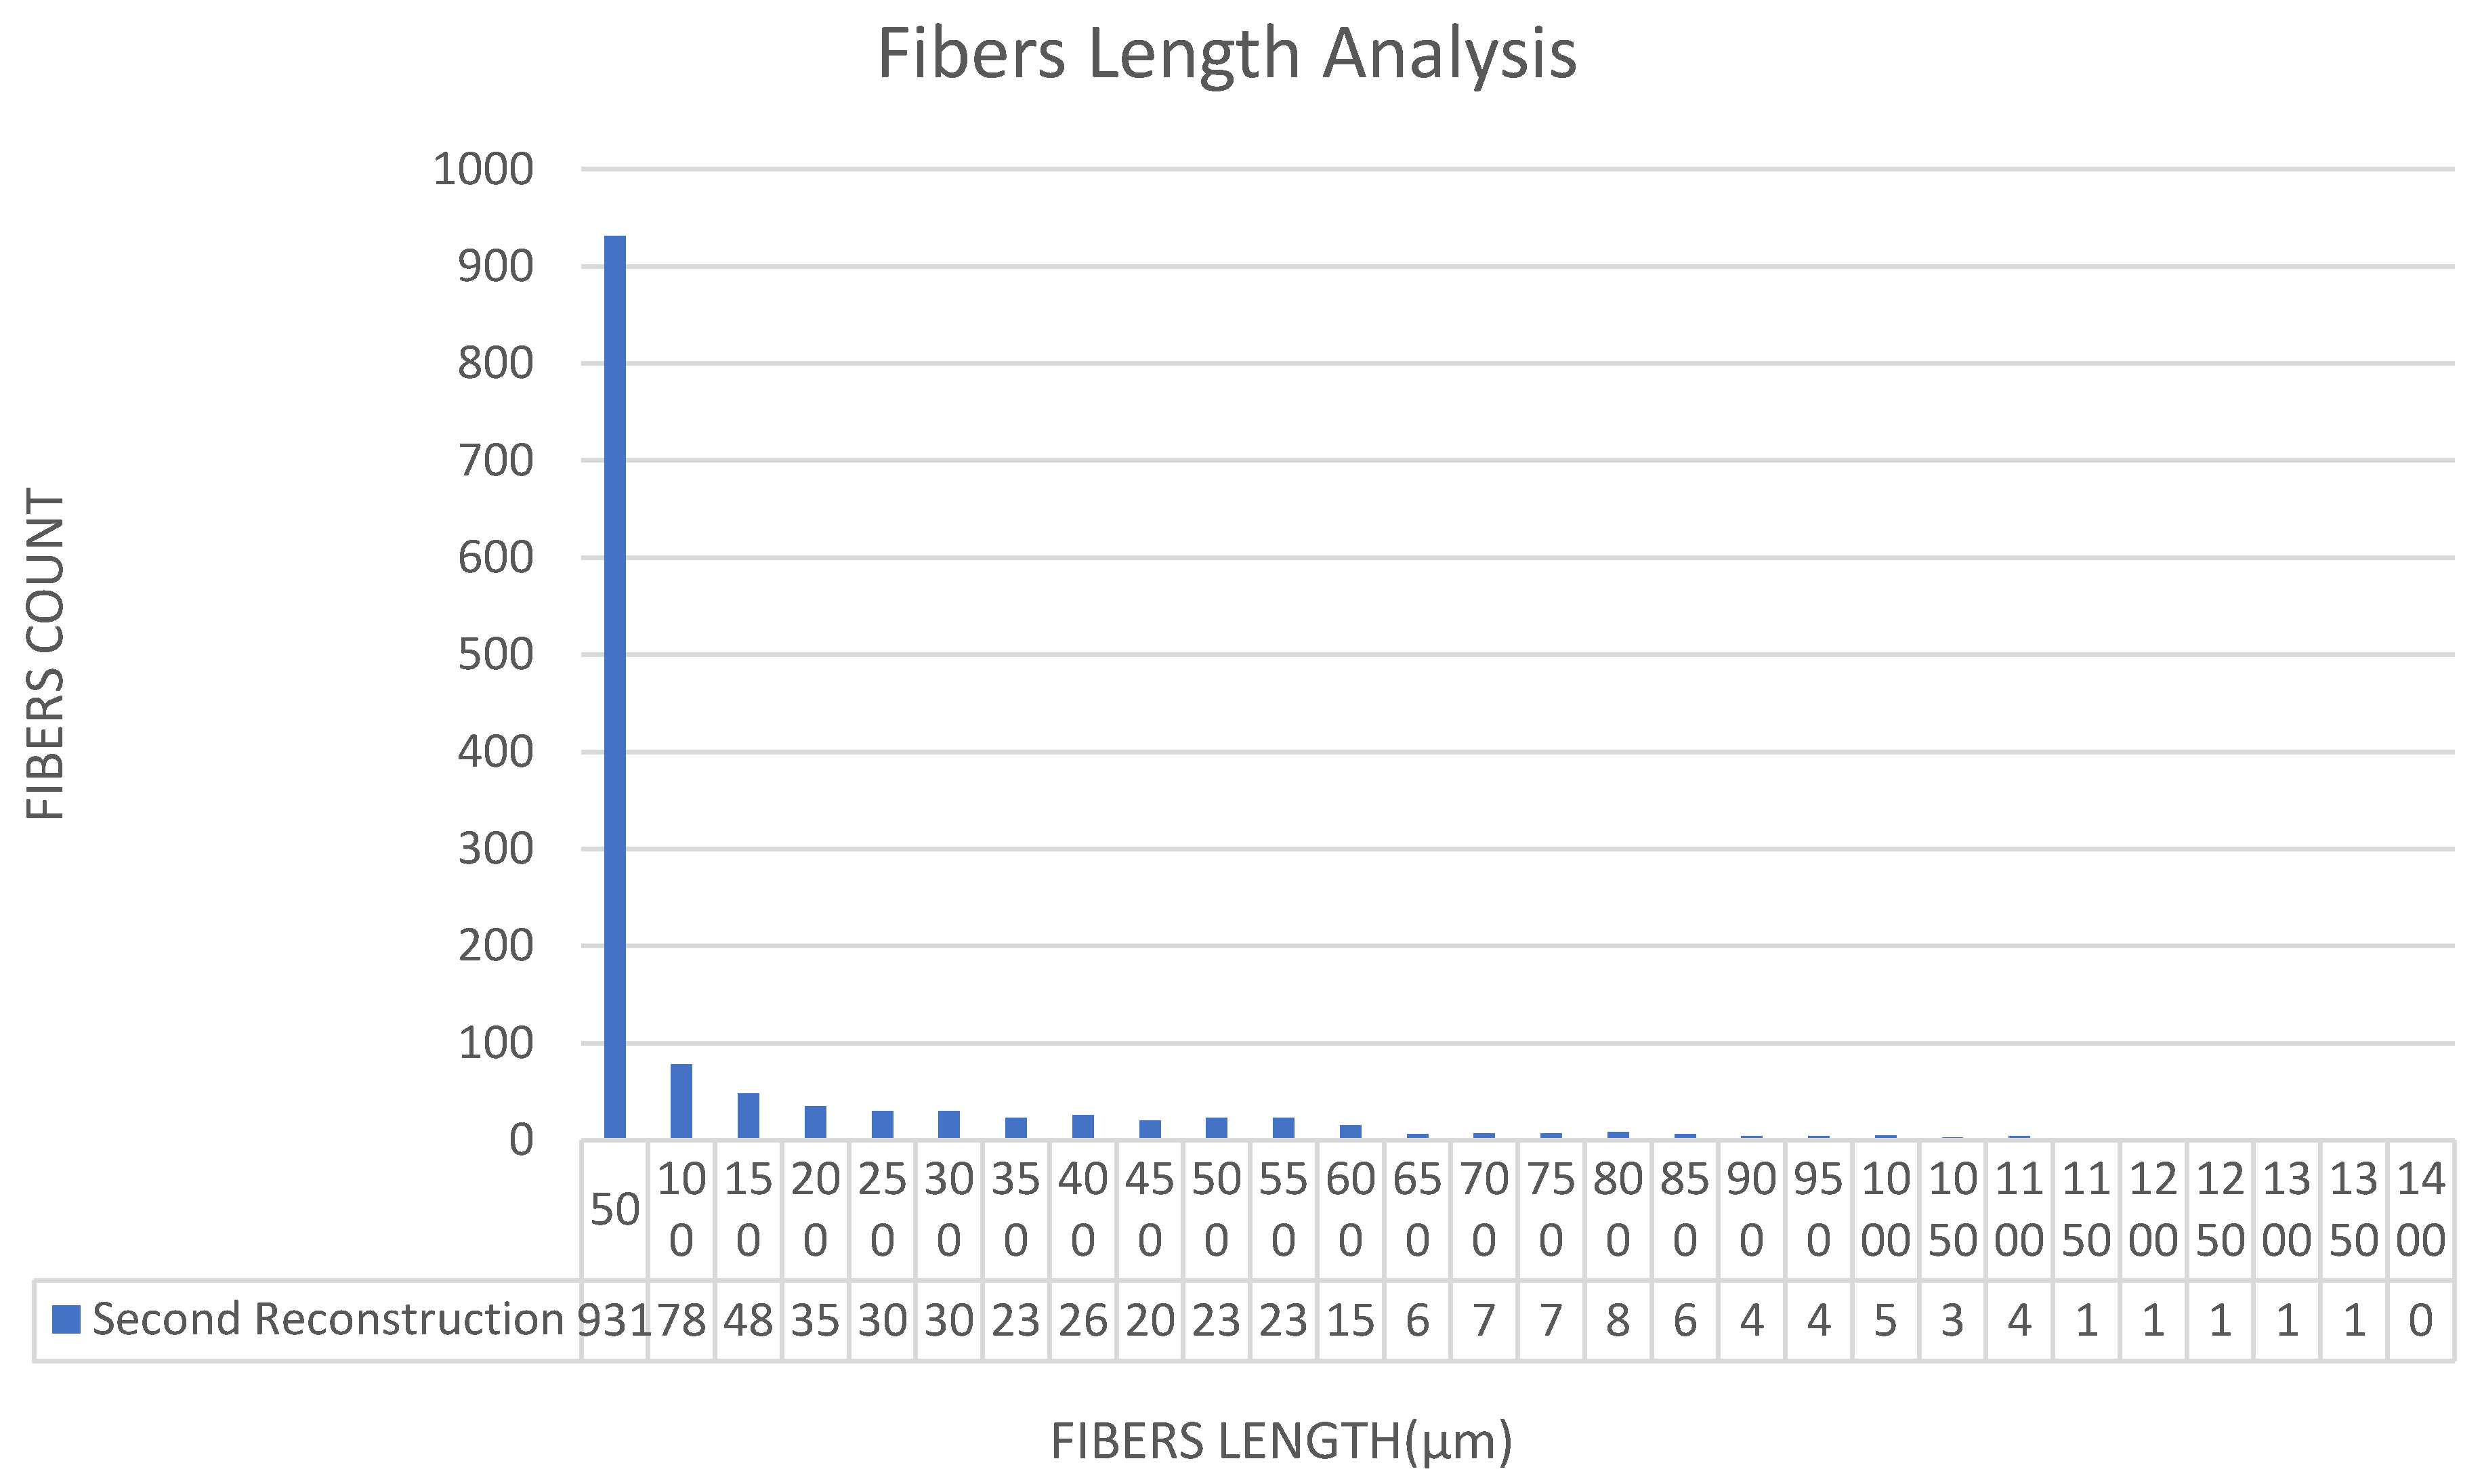
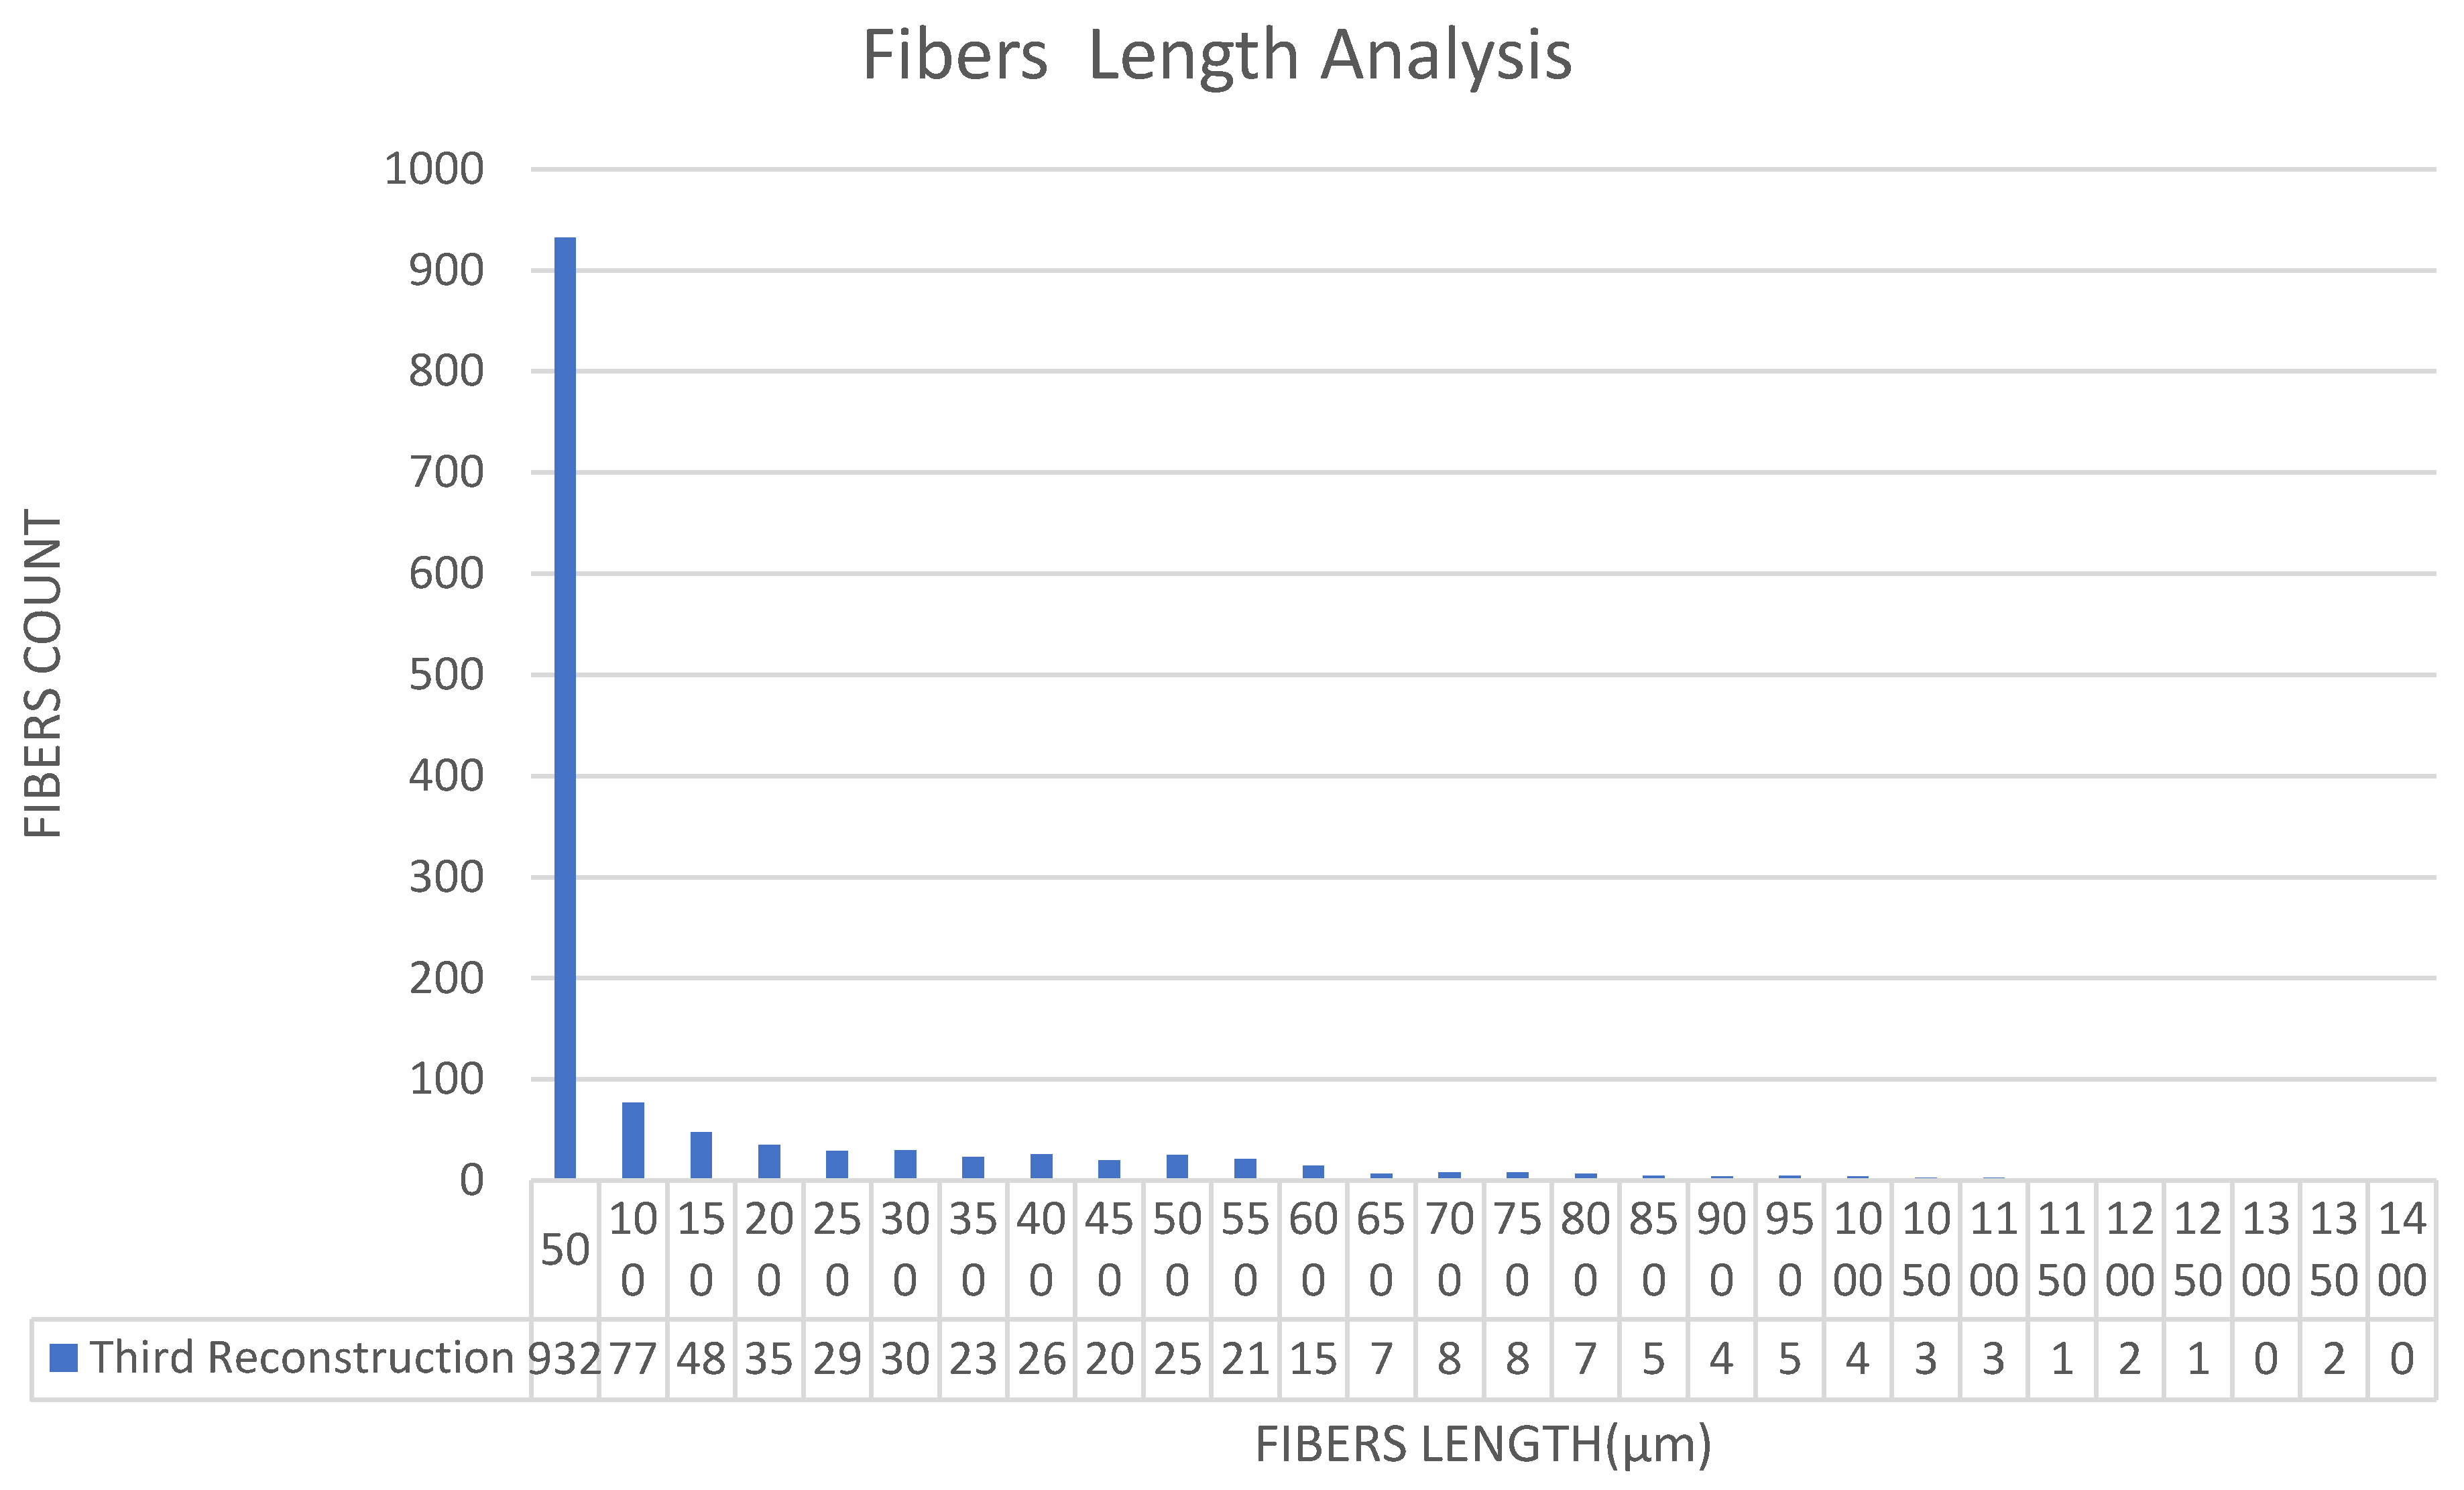
3.3. Identification and Comparison of the Whole Polyester Short Fiber in the Adjacent Slice Images
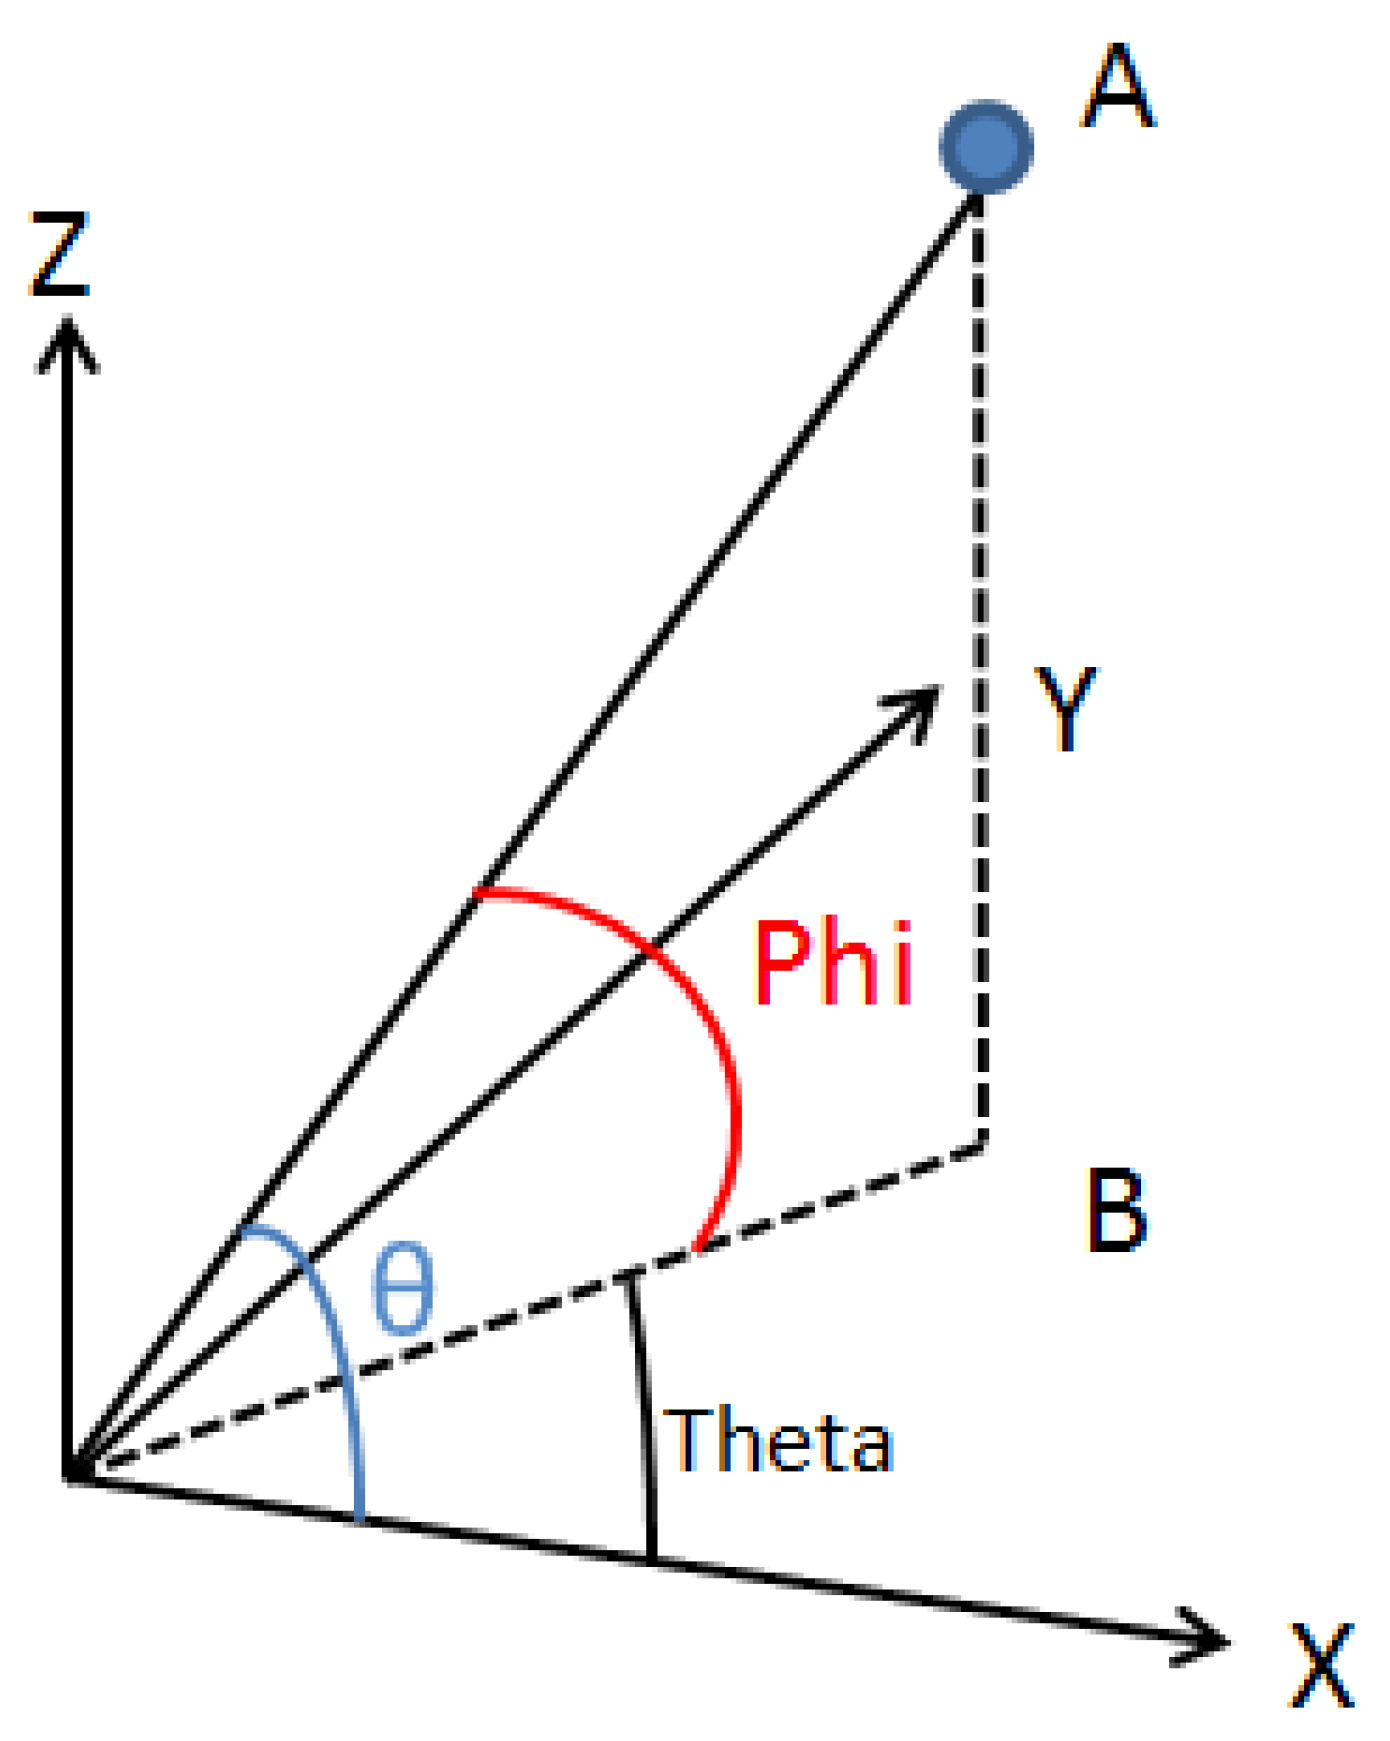
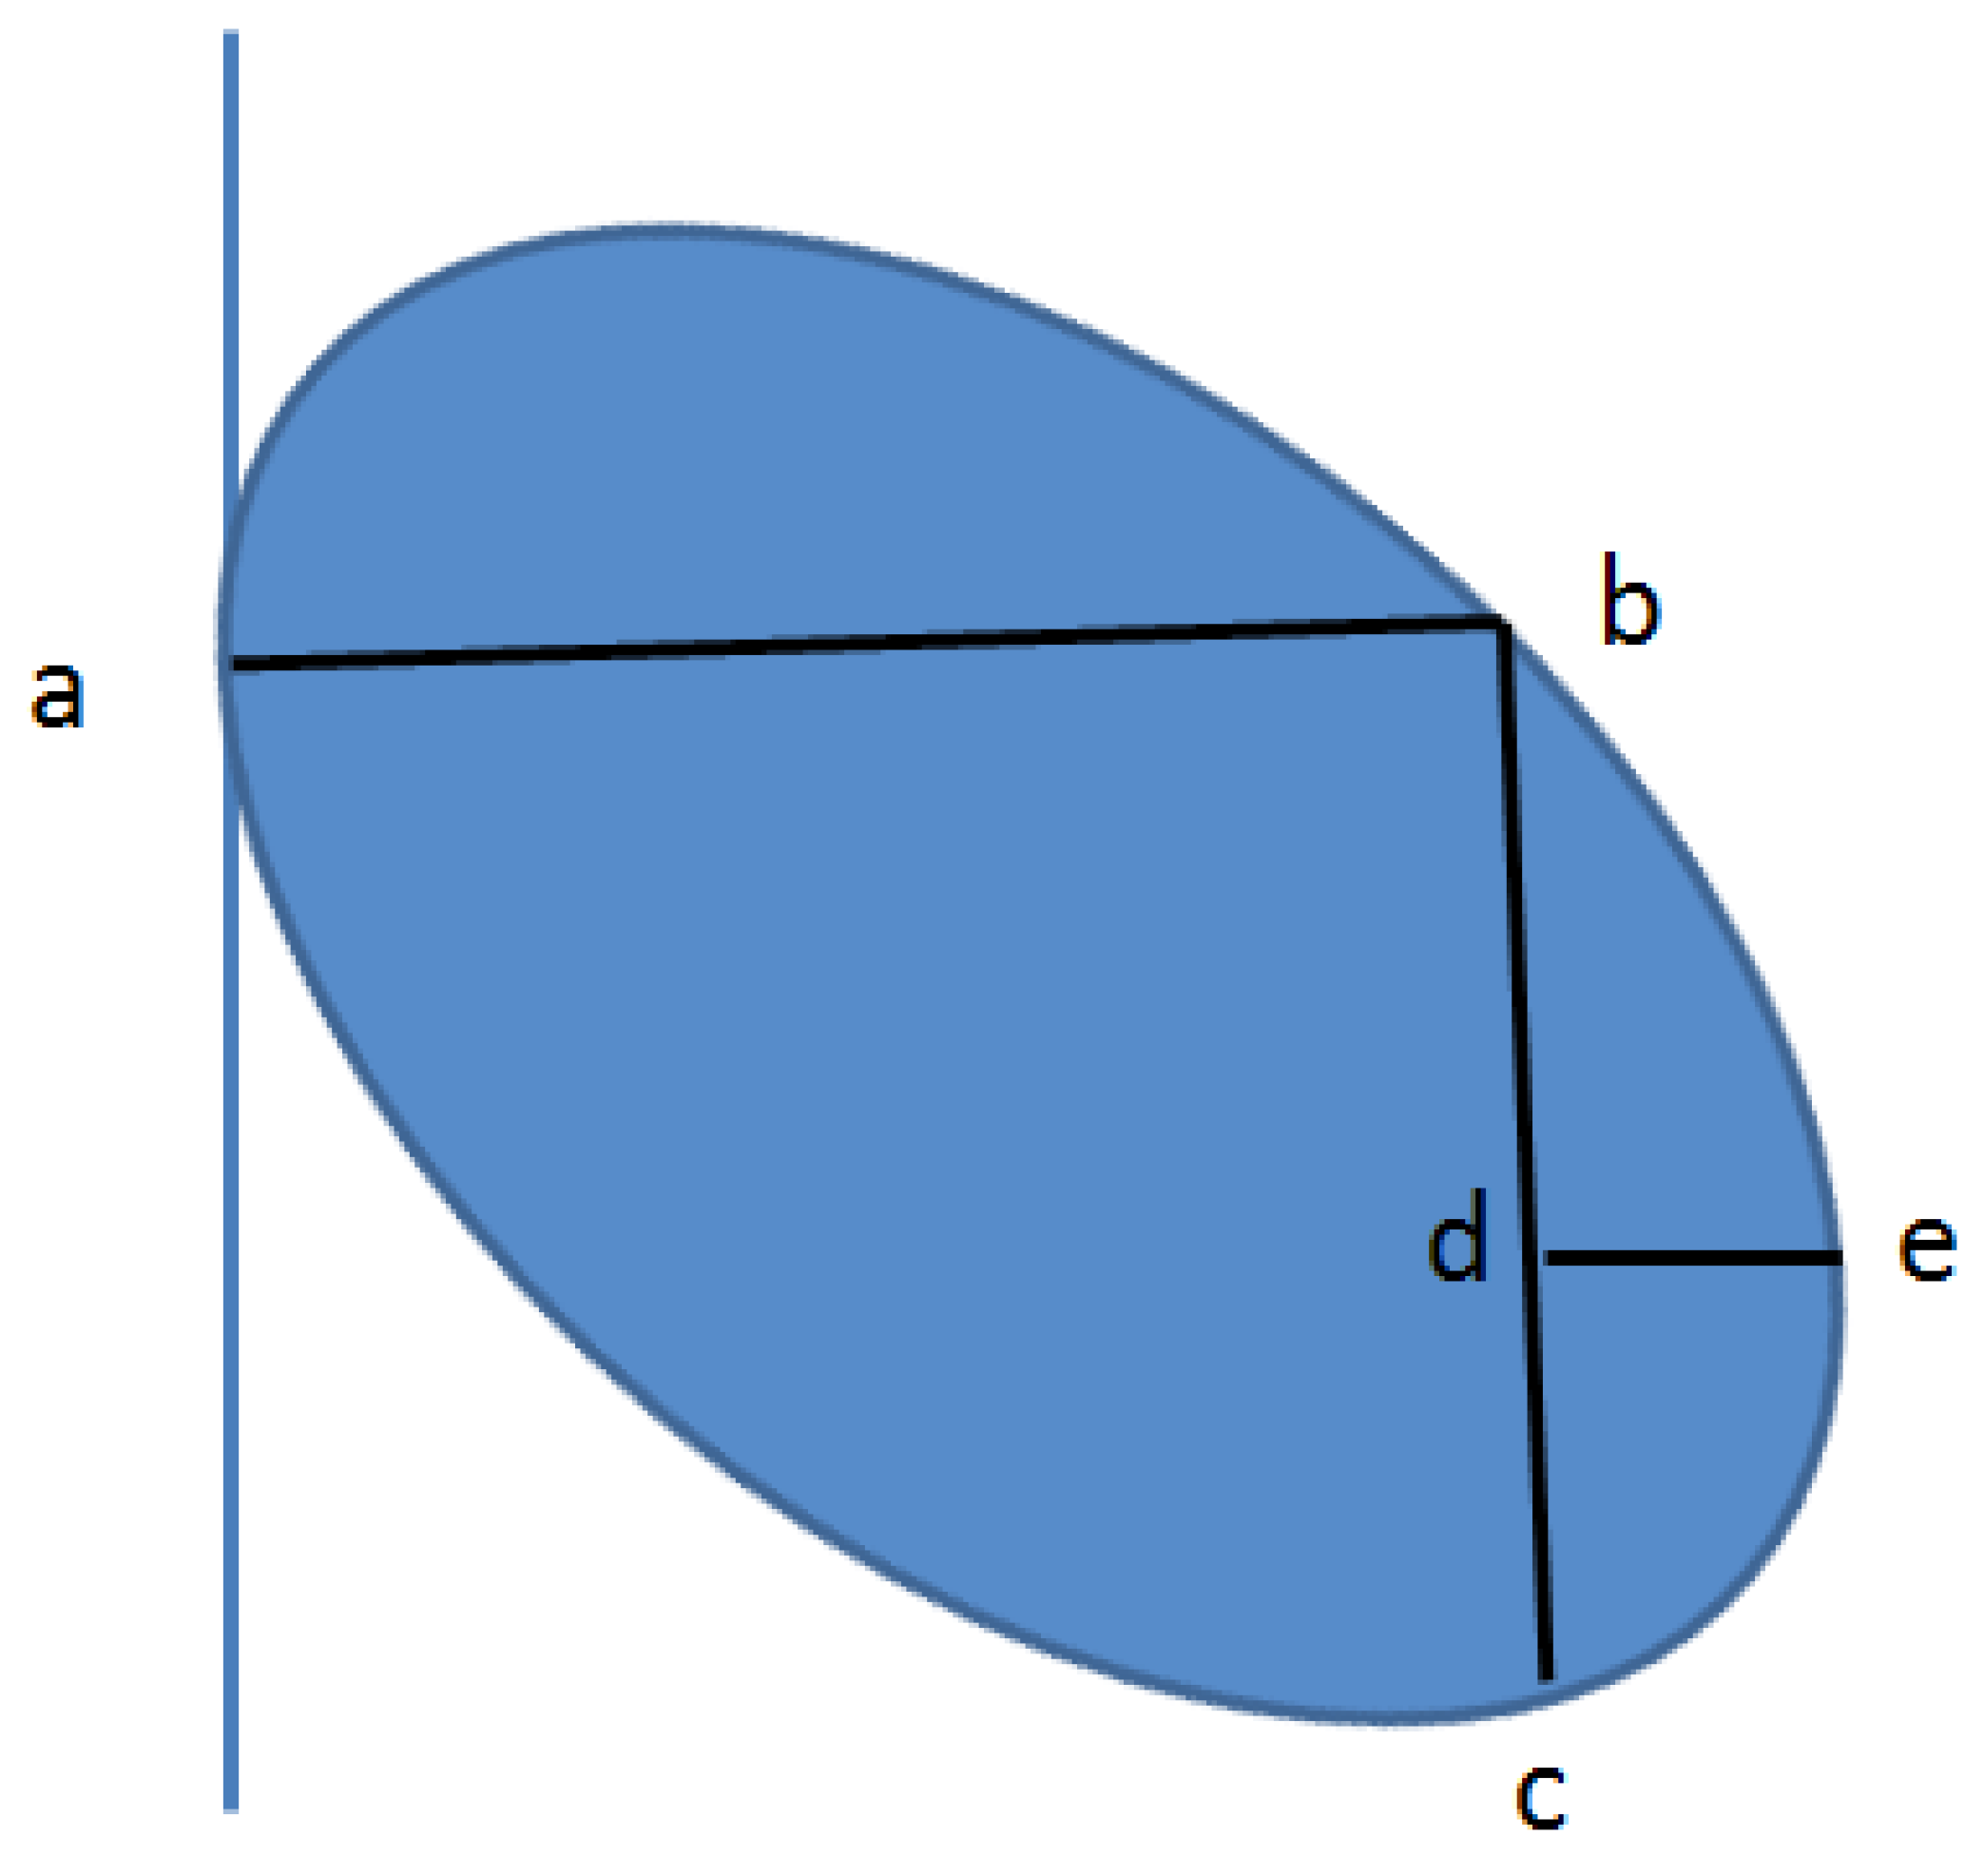
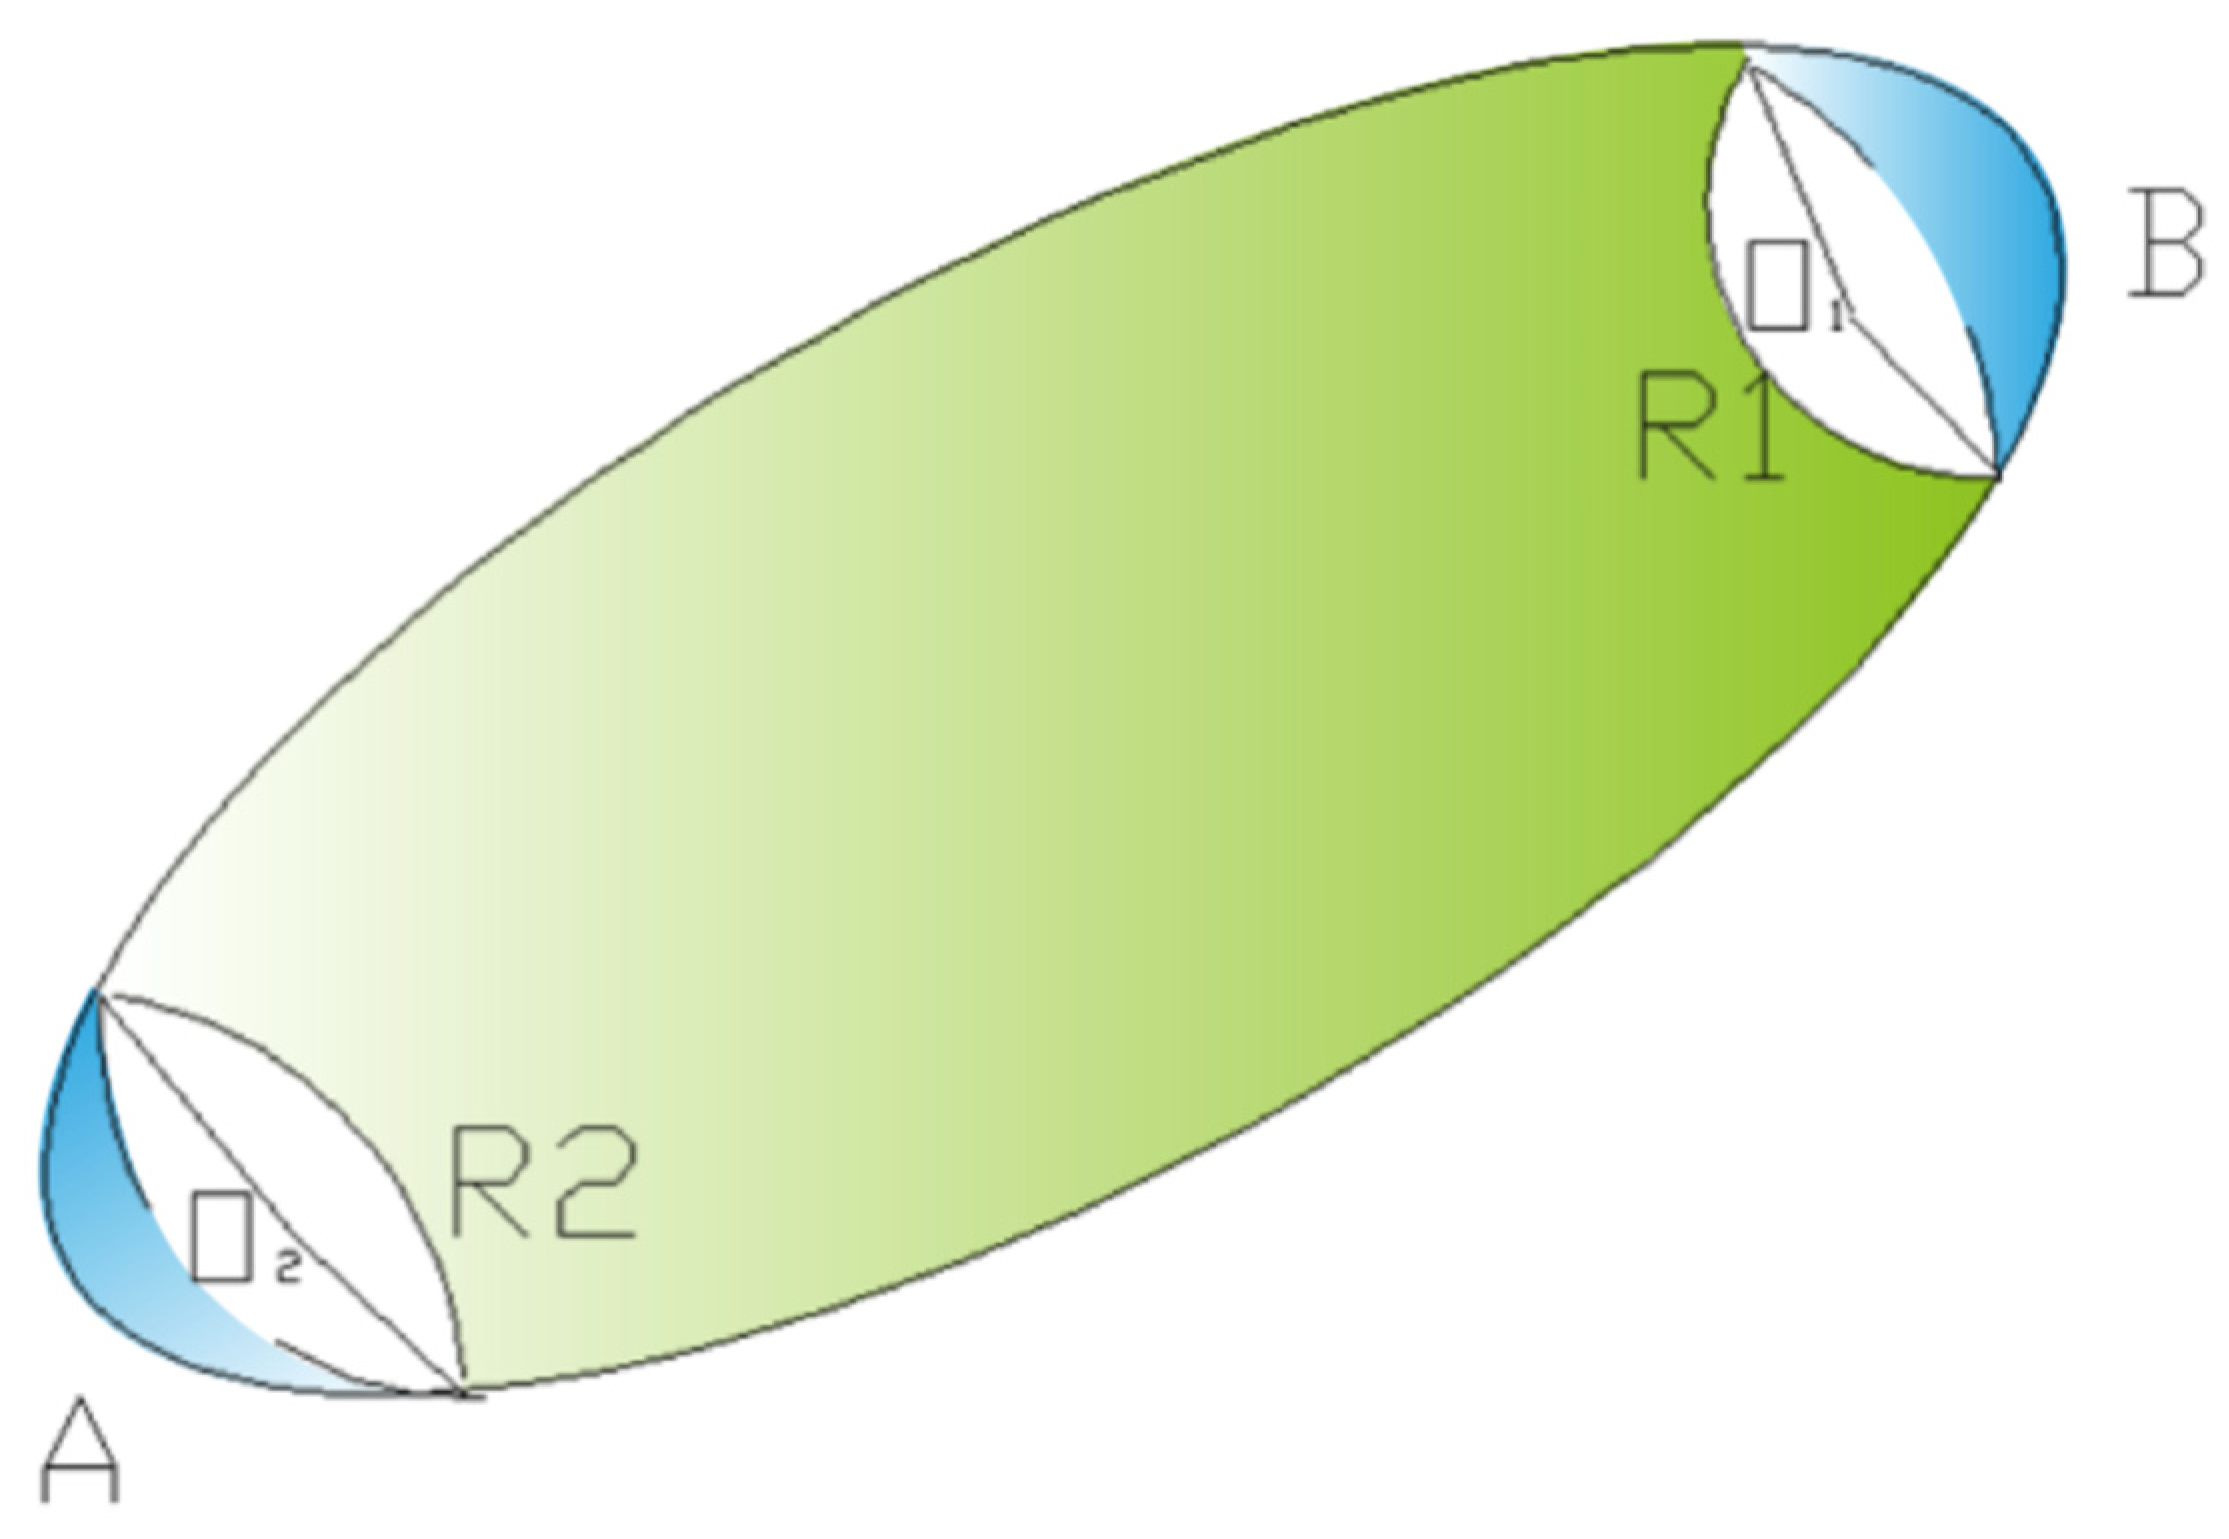
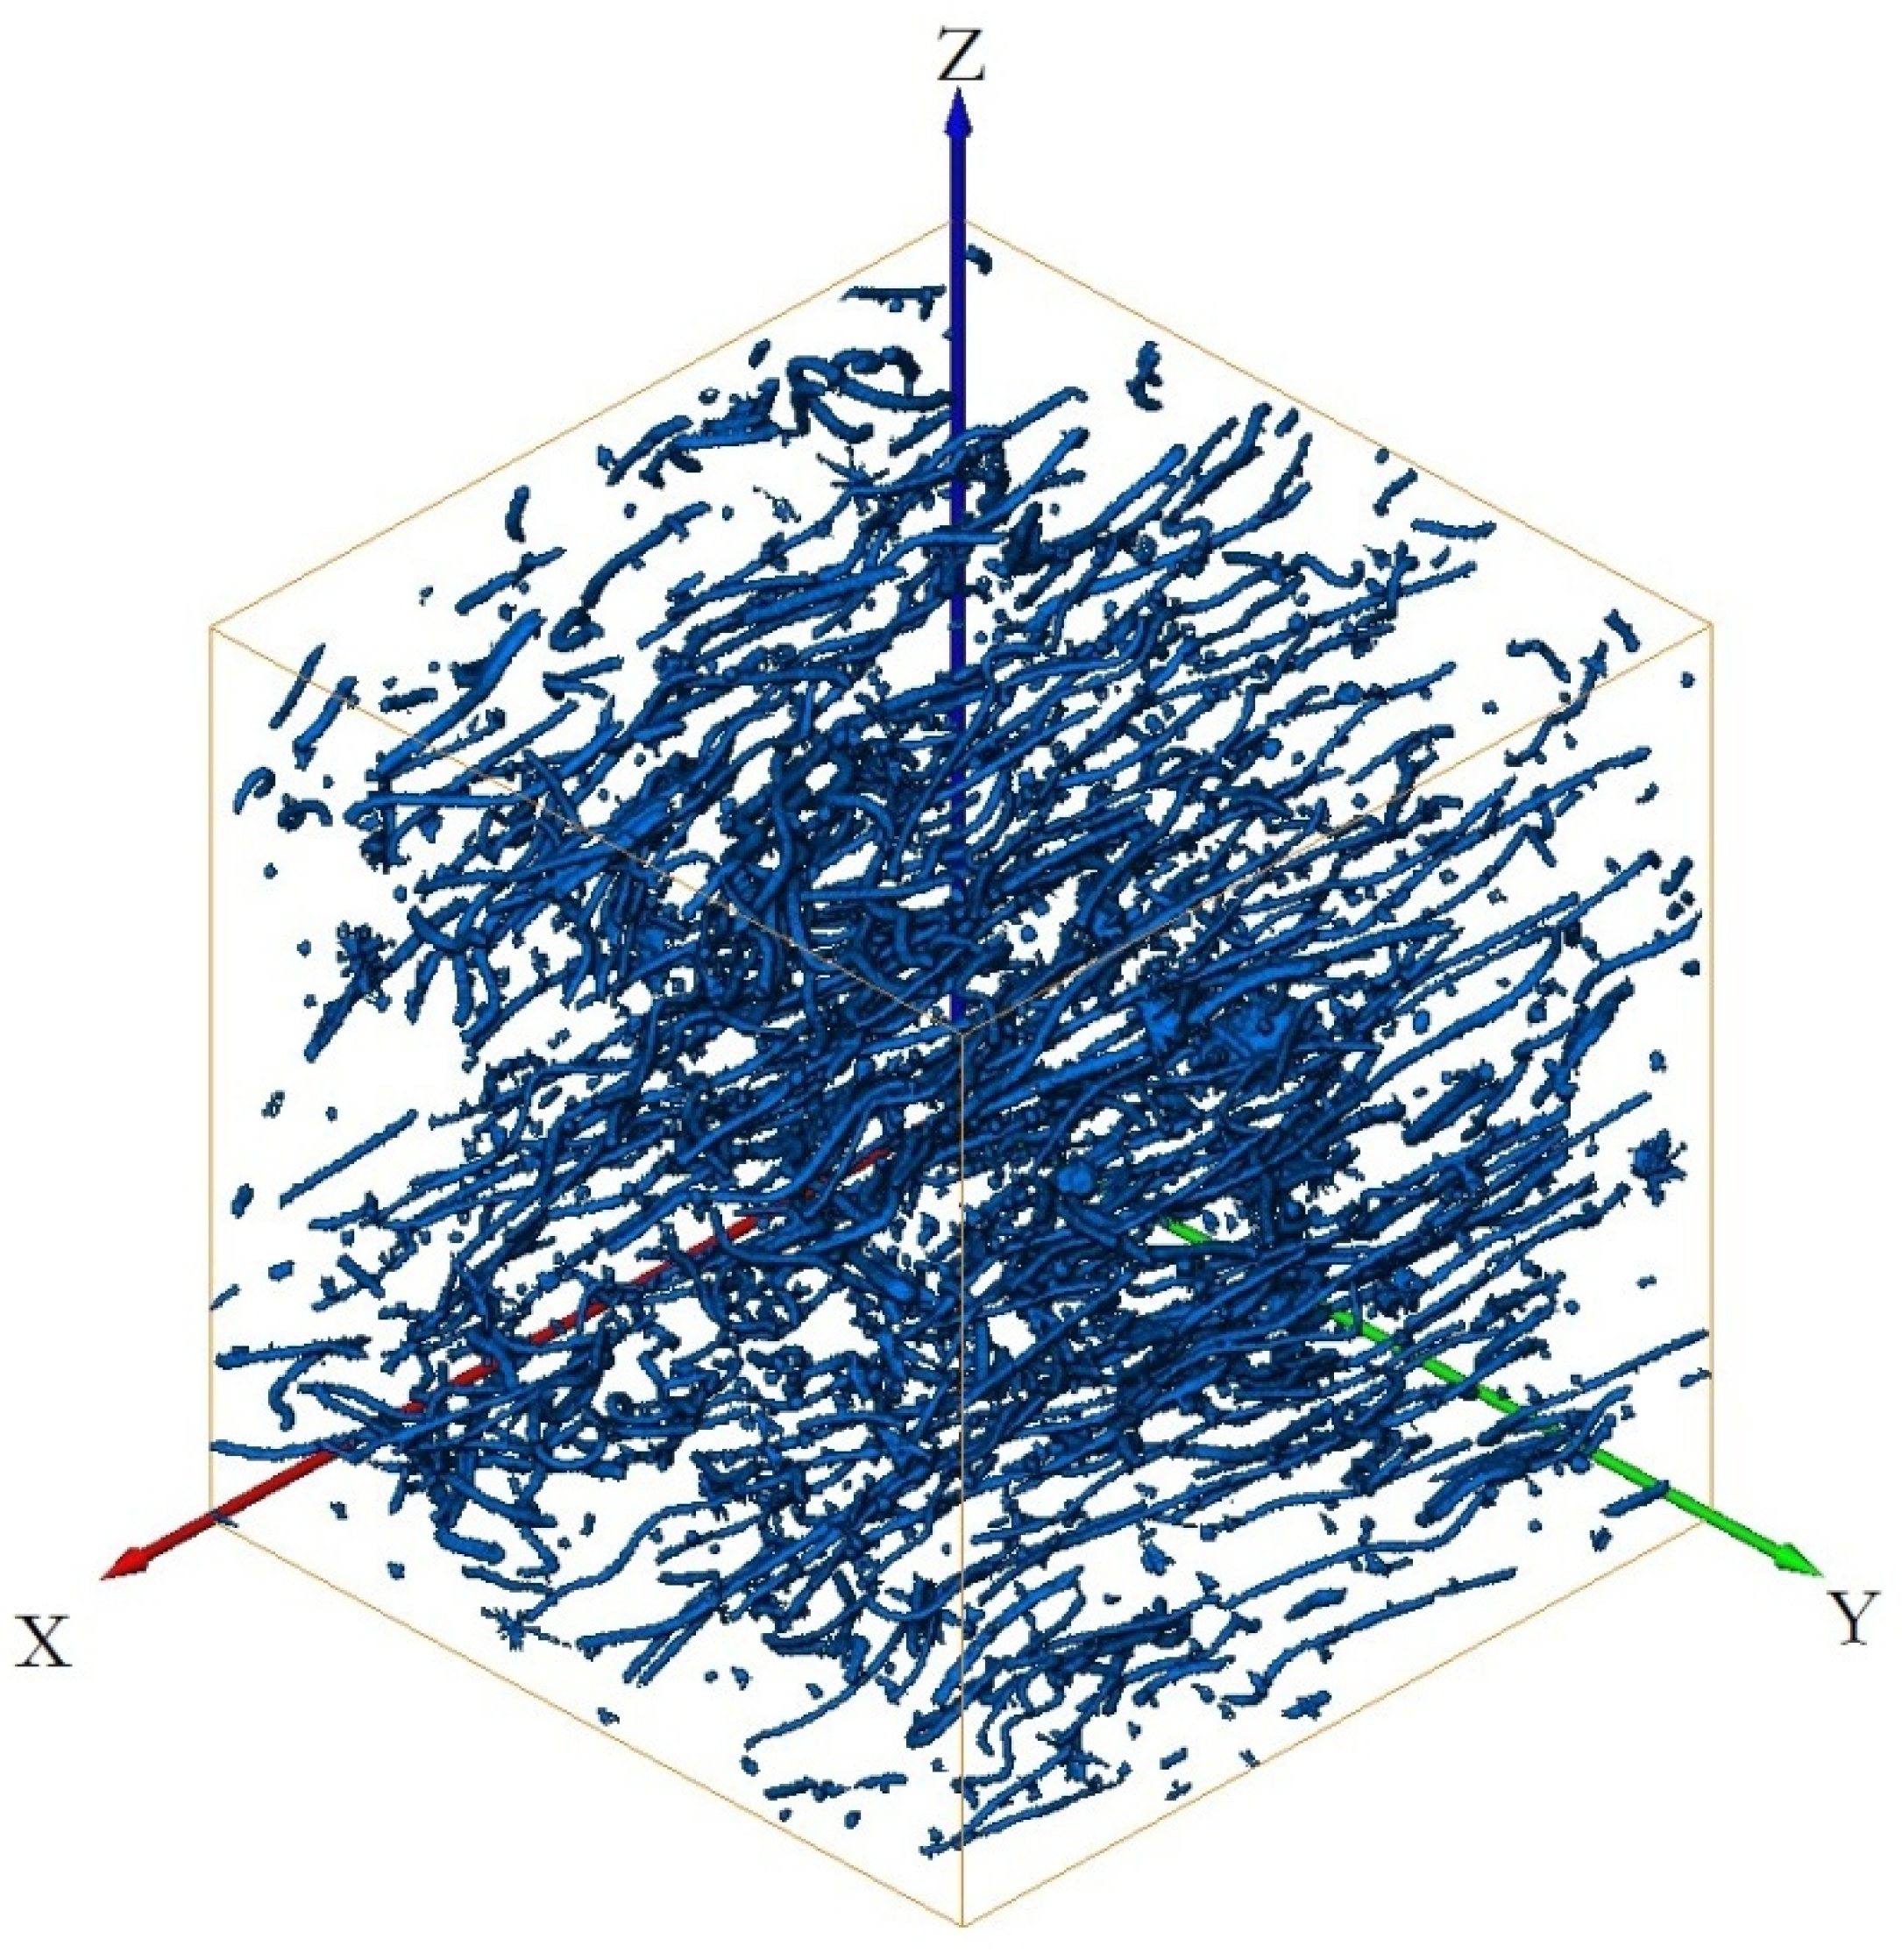
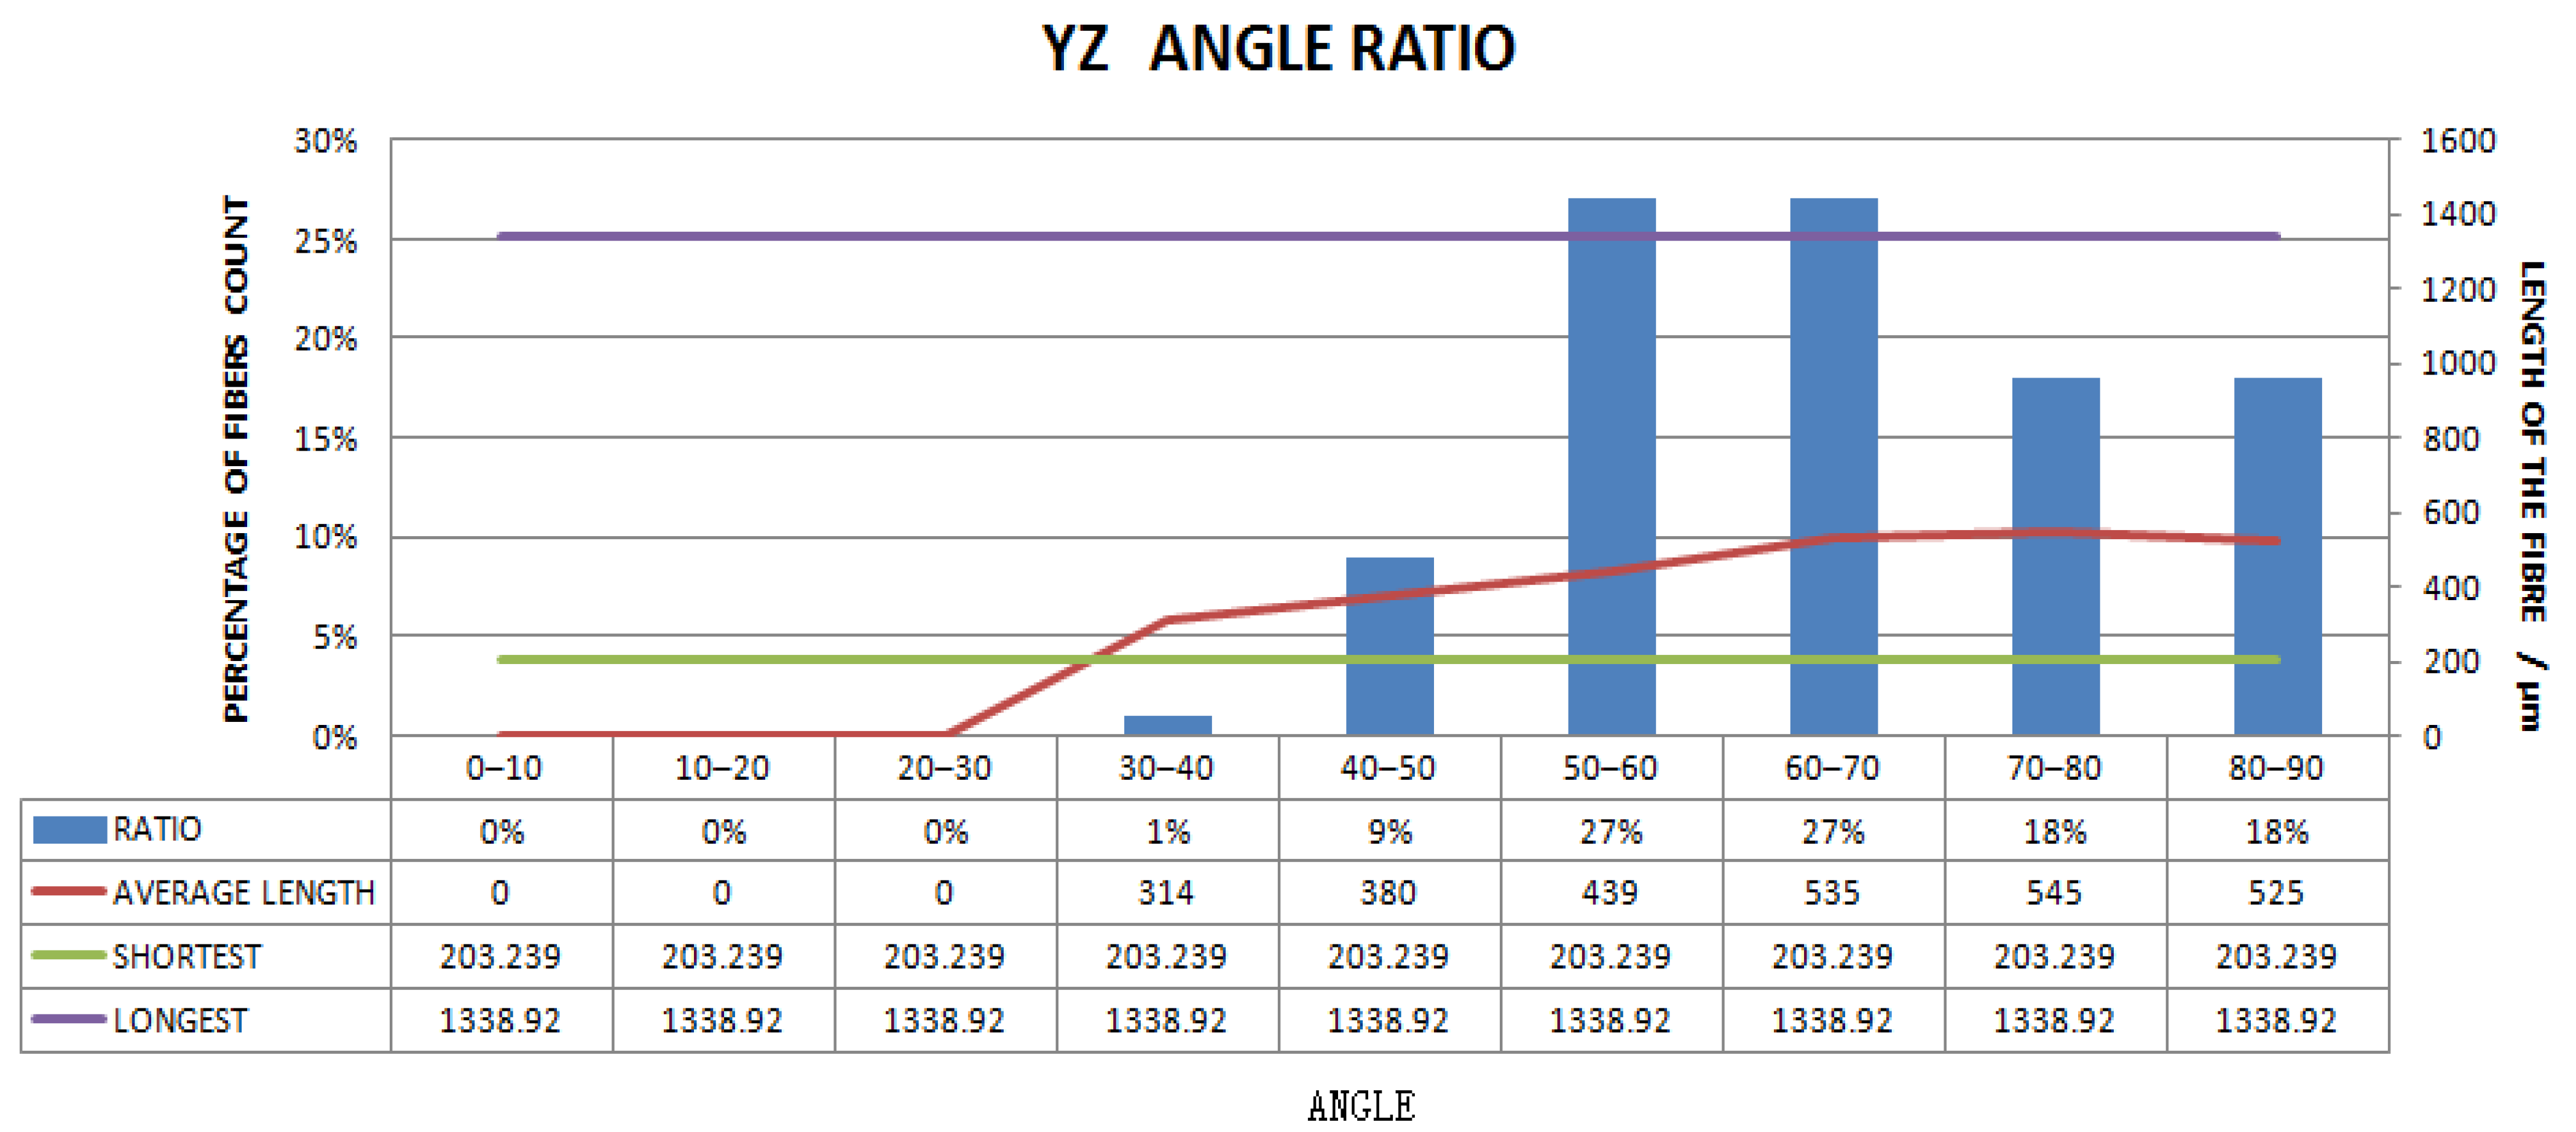
3.4. Computer Simulation Results of Polyester Short Fiber Orientation
4. Conclusions
Author Contributions
Funding
Institutional Review Board Statement
Informed Consent Statement
Data Availability Statement
Acknowledgments
Conflicts of Interest
References
- Wang, C.S.; Yu, B.H.; Bian, H.G. Experimental study on characterization of short fiber orientation of steel wire by industrial CT. Rubber Ind. 2017, 64, 683–687. [Google Scholar]
- Sun, G.D.; Liu, C.H. Simulation research on fiber orientation of tensile sample for long glass fiber reinforced polypropylene composites material. Die Mould Ind. 2017, 43, 56–60. [Google Scholar]
- Charles, L.T. The Use of Tensors to Describe and Predict Fiber Orientation in Short fiber reinforced rubber composites. J. Rheol. 2000, 31, 751–784. [Google Scholar]
- Advani, S.G.; Tucker, C.L. The Use of Tensors to Dcscribe and Predict Fiber Oricntation in Short fiber reinforced rubber composites. J. Rheol. 1987, 31, 98. [Google Scholar] [CrossRef]
- Sheppard, A.; Latham, S.; Middleton, J.; Kingston, A.; Myers, G.; Varslot, T.; Fogden, A.; Sawkins, T.; Cruikshank, R.; Saadatfar, M.; et al. Techniques in helical scanning, dynamic imaging and image segmentation for improved quantitative analysis with X-ray micro-CT. Nucl. Inst. Methods Phys. Res. B 2014, 324, 49–56. [Google Scholar] [CrossRef] [Green Version]
- Ritman, E.L. Current Status of Developments and Applications of Micro-CT. Annu. Rev. Biomed. Eng. 2011, 13, 531–552. [Google Scholar] [CrossRef]
- Wang, M.A. How to select an Industrial CT. Plast. Manuf. 2014, 4, 61–65. [Google Scholar]
- Zhang, A.D.; Li, J.; Chen, F.; Sun, L.X. 3D reconstruction of industrial CT images. Nucl. Electron. Detect. Technol. 2005, 4, 420–422. [Google Scholar]
- Fang, Q.; Lian, C.B.; Chai, Z.H.; Ren, G.X. Microstructure Analysis of Deformation Band in Porous Sandstone Based on Threedimensional X-ray Microscope. Comput. Tomogr. Theory Appl. 2019, 28, 167–174. [Google Scholar]
- Kogan, M.I.; Popov, I.V.; Kirichenko, E.Y.; Mitrin, B.I.; Sadyrin, E.V.; Kulaeva, E.D.; Popov, I.V.; Kulba, S.N.; Logvinov, A.K.; Akimenko, M.A.; et al. X-ray micro-computed tomography in the assessment of penile cavernous fibrosis in a rabbit castration model. Andrology 2021, 9, 1467–1480. [Google Scholar] [CrossRef]
- Ritman, E.L. Molecular imaging in small animals—Roles for micro-CT. J. Cell. Biochem. 2003, 87, 116–124. [Google Scholar] [CrossRef] [PubMed]
- Badea, C.T.; Drangova, M.; Holdsworth, D.W.; Johnson, G.A. In vivo small-animal imaging using micro-CT and digital subtraction angiography. Phys. Med. Biol. 2008, 53, 319–350. [Google Scholar] [CrossRef] [PubMed] [Green Version]
- Ritman, E. Micro-computed tomography-Current status and developments. Annu. Rev. Biomed. Eng. 2004, 6, 185–208. [Google Scholar] [CrossRef] [PubMed]
- Sasov, A. Micro-CT for Nondestructive 3D Reconstruction of MEMS and Sensors; Chapter 4407; Microelectronic and MEMS Technologies: Edinburgh, UK, 2001; pp. 388–394. [Google Scholar]
- Pedro, G.-H.; Karolina, G.; James, K. Phase segmentation of uncured prepreg X-ray CT micrographs. Compos. Part A 2021, 149, 106527. [Google Scholar]
- Yin, X.; Chang, J.W.W.; Wang, Q.; Zhang, C.; Wang, X. Three-dimensional morphologic classifications and analysis of canal isthmuses in permanent molars. Surg. Radiol. Anat. SRA 2021, 43, 1793–1799. [Google Scholar] [CrossRef]
- Viveen, J.; Perilli, E.; Zahrooni, S.; Jaarsma, R.L.; Doornberg, J.N.; Bain, G.I. Three-dimensional cortical and trabecular bone microstructure of the proximal ulna. Arch. Orthop. Trauma Surg. 2021. [Google Scholar] [CrossRef]
- Clark, D.P.; Badea, C.T. Advances in micro-CT imaging of small animals. Phys. Med. 2021, 88, 175–192. [Google Scholar] [CrossRef]
- Nakanishi, K.; Yamamoto, S.; Watabe, T.; Kaneda-Nakashima, K.; Shirakami, Y.; Ooe, K.; Toyoshima, A.; Shinohara, A.; Teramoto, T.; Hatazawa, J.; et al. Development of high-resolution YAP(Ce) X-ray camera for the imaging of astatine-211(At-211) in small animals. Med. Phys. 2020, 47, 5739–5748. [Google Scholar] [CrossRef]
- Marques, J.L.C.; Freire, L.G.; Scardini, I.D.L.; Vieira, B.R.; de Sousa, F.B.; Dos Santos, M. Shaping efficiency of XP-endo shaper and Mtwo instruments in long oval root canals: A micro-CT study. Aust. Endod. J. 2021, 47, 624–630. [Google Scholar] [CrossRef]
- Ermakova, O.; Orsini, T.; Fruscoloni, P.; Chiani, F.; Gambadoro, A.; Putti, S.; Cirilli, M.; Mezzi, A.; Kaciulis, S.; Pasquini, M.; et al. Three-Dimensional X-ray Imaging of β-Galactosidase Reporter Activity by Micro-CT: Implication for Quantitative Analysis of Gene Expression. Brain Sci. 2021, 11, 746. [Google Scholar] [CrossRef]
- Fu, Y.J.; Gao, Y.; Gao, Y.X.; Tan, X.L.; Zhang, L.; Huang, D.M. Three-dimensional analysis of coronal root canal morphology of 136 permanent mandibular first molars by micro-computed tomography. J. Dent. Sci. 2022, 17, 482–489. [Google Scholar] [CrossRef] [PubMed]
- dPei, N.; Shang, J.J.; Bond, L.J. Analysis of Progressive Tensile Damage of Multi-walled Carbon Nanotube Reinforced Carbon Fiber Composites by Using Acoustic Emission and Micro-CT. J. Nondestruct. Eval. 2021, 40, 51. [Google Scholar]
- Guessasma, S.; Abouzaid, K.; Belhabib, S.; Bassir, D.; Nouri, H. Interfacial Behaviour in Polymer Composites Processed Using Droplet-Based Additive Manufacturing. Polymers 2022, 14, 1013. [Google Scholar] [CrossRef] [PubMed]
- Jelić, A.; Sekulić, M.; Travica, M.; Gržetić, J.; Ugrinović, V.; Marinković, A.D.; Božić, A.; Stamenović, M.; Putić, S. Determination of Mechanical Properties of Epoxy Composite Materials Reinforced with Silicate Nanofillers Using Digital Image Correlation (DIC). Polymers 2022, 14, 1255. [Google Scholar] [CrossRef]
- Kanbur, B.B.; Zhou, Y.; Shen, S.; Wong, K.H.; Chen, C.; Shocket, A.; Duan, F. Metal Additive Manufacturing of Plastic Injection Molds with Conformal Cooling Channels. Polymers 2022, 14, 424. [Google Scholar] [CrossRef]
- Sun, X.; Li, T.; Shi, F.; Liu, X.; Zong, Y.; Hou, B.; Tian, H. Sulphate Corrosion Mechanism of Ultra-High-Performance Concrete (UHPC) Prepared with Seawater and Sea Sand. Polymers 2022, 14, 971. [Google Scholar] [CrossRef]
- Manzoor, F.; Golbang, A.; Dixon, D.; Mancuso, E.; Azhar, U.; Manolakis, I.; Crawford, D.; McIlhagger, A.; Harkin-Jones, E. 3D Printed Strontium and Zinc Doped Hydroxyapatite Loaded PEEK for Craniomaxillofacial Implants. Polymers 2022, 14, 1376. [Google Scholar] [CrossRef]
- Cometa, S.; Bonifacio, M.A.; Tranquillo, E.; Gloria, A.; Domingos, M.; De Giglio, E. A 3D Printed Composite Scaffold Loaded with Clodronate to Regenerate Osteoporotic Bone: In Vitro Characterization. Polymers 2021, 13, 150. [Google Scholar] [CrossRef]
- Kovačević, M.S.; Savović, S.; Djordjevich, A.; Bajić, J.; Stupar, D.; Simić, S. Measurements of growth and decay of radiation induced attenuation during the irradiation and recovery of plastic optical fibres. Opt. Laser Technol. 2013, 47, 148–151. [Google Scholar] [CrossRef]
- Freeman, H. Computer processing of line-drawing images. Comput. Surv. CSUR 1974, 6, 57–97. [Google Scholar] [CrossRef]
- Jing, H. Evaluation and System Development of Carbon Black Dispersion in Rubber Based on Image Processing Technology. Ph.D. Thesis, Yangzhou University, Yangzhou, China, 2021. [Google Scholar]
- Galloway, J.A.; Montminy, M.D.; Macosko, C.W. Image analysis for interfacial area andcocontinuity detection in polymer blends. Polymer 2002, 43, 4715–4722. [Google Scholar] [CrossRef]
- Ren, M.; Yang, J.; Sun, H. Tracing boundary contours in a binary image. Image Vis. Comput. 2002, 20, 125–131. [Google Scholar] [CrossRef]
- Wang, L.; Li, J.; Zhang, N.; Zhang, X.; Xia, Y.; Chai, B.; Gao, C.; Mao, S.; Ji, Y.; Sheng, W.; et al. Investigations of EGFR configurations on tumor cellsurface by high-resolution electron microscopy. Biochem. Biophys. Res. Commun. 2020, 532, 179–184. [Google Scholar] [CrossRef] [PubMed]
- Chen, J.L.; Kundu, A. Rotation and gray scale transform invariant texture identificationusing wavelet decomposition and hidden Markov model. Trans. Pattern Anal. Mach. Intell. 1994, 16, 208–214. [Google Scholar] [CrossRef]
- Lee, M.K.; Golzarian, M.R.; Kim, I. A new color index for vegetation segmentation andclassification. Precis. Agric. 2021, 22, 179–204. [Google Scholar] [CrossRef]


| Order | Area3d (μm2) | EqDiameter (μm) | OrientationPhi | Length3d (μm) | Index |
|---|---|---|---|---|---|
| 1 | 264,931 | 94.6989 | 77.2901 | 1315.89 | 71 |
| 2 | 121,081 | 77.9211 | 42.5806 | 1309.55 | 164 |
| 3 | 215,218 | 92.1428 | 31.8204 | 1210.28 | 41 |
| 4 | 87,404.7 | 68.9036 | 58.3198 | 1196.75 | 287 |
| 5 | 82,641.6 | 68.5778 | 35.6701 | 1157.19 | 27 |
| 6 | 53,918.3 | 57.7063 | 19.8742 | 1127.63 | 48 |
| 7 | 103,179 | 74.6303 | 14.9699 | 1086.5 | 124 |
| 8 | 69,829 | 66.1144 | 45.6686 | 1080.66 | 334 |
| 9 | 120,102 | 75.4554 | 42.1048 | 1062.73 | 201 |
| 10 | 95,093.7 | 70.3466 | 81.3404 | 1040.24 | 26 |
| 11 | 143,002 | 80.9693 | 5.11669 | 1001 | 21 |
| 12 | 43,093.3 | 52.271 | 29.0356 | 995.184 | 6 |
| 13 | 120,898 | 77.8978 | 51.2825 | 993.604 | 43 |
| 14 | 36,476.2 | 51.07 | 60.9781 | 964.368 | 188 |
| 15 | 84,127.3 | 68.3818 | 23.85 | 962.495 | 251 |
| 16 | 47,385.3 | 58.0941 | 48.6091 | 960.1 | 342 |
| 17 | 54,238.5 | 57.9373 | 48.0718 | 953.391 | 455 |
| 18 | 34,945.2 | 51.5429 | 22.3521 | 928.395 | 42 |
| 19 | 49,319.5 | 58.9736 | 67.3858 | 923.234 | 228 |
| 20 | 63,904.8 | 63.2888 | 53.967 | 922.506 | 632 |
| 21 | 86,741.7 | 68.5626 | 10.6566 | 910.088 | 276 |
| 22 | 50,208.5 | 58.6293 | 39.7015 | 903.591 | 143 |
| 23 | 31,335.2 | 48.9865 | 53.2345 | 887.79 | 234 |
| 24 | 31,891.1 | 49.9132 | 15.6743 | 882.007 | 305 |
| 25 | 52,290.5 | 58.3729 | 45.5043 | 877.403 | 542 |
| 26 | 49,711.7 | 57.3143 | 59.4516 | 839.301 | 180 |
| 27 | 43,719.8 | 54.5866 | 41.3494 | 827.392 | 395 |
| 28 | 56,090.6 | 59.3268 | 19.8924 | 812.941 | 33 |
| 29 | 45,255.6 | 56.1426 | 48.8758 | 811.979 | 735 |
Publisher’s Note: MDPI stays neutral with regard to jurisdictional claims in published maps and institutional affiliations. |
© 2022 by the authors. Licensee MDPI, Basel, Switzerland. This article is an open access article distributed under the terms and conditions of the Creative Commons Attribution (CC BY) license (https://creativecommons.org/licenses/by/4.0/).
Share and Cite
Yu, B.; Ren, J.; Wang, K.; Wang, C.; Bian, H. Experimental Study on the Characterization of Orientation of Polyester Short Fibers in Rubber Composites by an X-ray Three-Dimensional Microscope. Materials 2022, 15, 3726. https://0-doi-org.brum.beds.ac.uk/10.3390/ma15103726
Yu B, Ren J, Wang K, Wang C, Bian H. Experimental Study on the Characterization of Orientation of Polyester Short Fibers in Rubber Composites by an X-ray Three-Dimensional Microscope. Materials. 2022; 15(10):3726. https://0-doi-org.brum.beds.ac.uk/10.3390/ma15103726
Chicago/Turabian StyleYu, Benhui, Jianbin Ren, Kongshuo Wang, Chuansheng Wang, and Huiguang Bian. 2022. "Experimental Study on the Characterization of Orientation of Polyester Short Fibers in Rubber Composites by an X-ray Three-Dimensional Microscope" Materials 15, no. 10: 3726. https://0-doi-org.brum.beds.ac.uk/10.3390/ma15103726