
Microresonators and Microantennas—Tools to Explore Magnetization Dynamics in Single Nanostructures


Helmholtz-Zentrum Dresden-Rossendorf, Institute of Ion Beam Physics and Materials Research, 01328 Dresden, Germany
*
Authors to whom correspondence should be addressed.
Magnetochemistry 2021, 7(2), 28; https://0-doi-org.brum.beds.ac.uk/10.3390/magnetochemistry7020028
Submission received: 25 January 2021
/
Revised: 9 February 2021
/
Accepted: 12 February 2021
/
Published: 19 February 2021
(This article belongs to the Special Issue Recent Advances in Nanomagnetism)
Abstract
:The phenomenon of magnetic resonance and its detection via microwave spectroscopy provide insight into the magnetization dynamics of bulk or thin film materials. This allows for direct access to fundamental properties, such as the effective magnetization, g-factor, magnetic anisotropy, and the various damping (relaxation) channels that govern the decay of magnetic excitations. Cavity-based and broadband ferromagnetic resonance techniques that detect the microwave absorption of spin systems require a minimum magnetic volume to obtain a sufficient signal-to-noise ratio (S/N). Therefore, conventional techniques typically do not offer the sensitivity to detect individual micro- or nanostructures. A solution to this sensitivity problem is the so-called planar microresonator, which is able to detect even the small absorption signals of magnetic nanostructures, including spin-wave or edge resonance modes. As an example, we describe the microresonator-based detection of spin-wave modes within microscopic strips of ferromagnetic A2 Fe60Al40 that are imprinted into a paramagnetic B2 Fe60Al40-matrix via focused ion-beam irradiation. While microresonators operate at a fixed microwave frequency, a reliable quantification of the key magnetic parameters like the g-factor or spin relaxation times requires investigations within a broad range of frequencies. Furthermore, we introduce and describe the step from microresonators towards a broadband microantenna approach. Broadband magnetic resonance experiments on single nanostructured magnetic objects in a frequency range of 2–18 GHz are demonstrated. The broadband approach has been employed to explore the influence of lateral structuring on the magnetization dynamics of a Permalloy (Ni80Fe20) microstrip.
1. Introduction
Determining dynamic properties of magnetic materials, i.e., their time-dependent behavior, often provides key insights into understanding of the magnetic response in micro- or nano-sized objects. The understanding of nanomagnetism plays an important role for generating future spintronic applications, such as memory and logic devices based on employing the quanta of magnetic excitations—spin-waves or magnons [1,2,3,4]. Here, we review the use of a unique approach to study magnetization dynamics in magnetic samples with small volume via microresonator- and microantenna-based microwave spectroscopy. Microwave spectroscopy allows the investigation of the fundamental (low energy) modes of spin systems. In ferromagnetically coupled spin ensembles, such modes are termed ferromagnetic resonance (FMR) modes.
FMR as a method is one of the main spectroscopic techniques, allowing for an investigation of static properties, such as the effective magnetization that provides the effective internal field acting on the spins (the effective magnetization actually is a magnetic induction with the unit Tesla, although the term magnetization is nonetheless widely used in literature), g-factor, and magnetic anisotropy, as well as dynamical properties such as magnetic relaxation mechanisms [5,6,7]. Typically, cavity-based (e.g., X-band; ~10 GHz) and broadband spectrometers are commonly used to detect microwave absorption upon exciting FMR modes [8,9,10,11]. Due to the minimum number of spins, which are needed to generate measurable signals, conventional cavities (cm-size) are not suited to detect FMR of micro-/nano-sized objects [12]. Therefore, to achieve a significantly better signal-to-noise ratio (S/N), planar microresonators have been introduced for microwave absorption measurements in small specimen—at first for electron spin resonance (ESR) experiments [13,14]. In microresonators, a microcoil produces a homogeneous rf-field inside of the loop into which a magnetic object is placed and homogeneously excited by the rf magnetic induction. A higher S/N ratio is achieved by a tremendous enhancement of the so-called filling factor that describes the concentration of the excitation field to the volume of the sample. As the loop diameter of microresonators can be fabricated down to the 1 µm size, the filling factor is significantly larger than in a conventional cm-sized cavity. The recent decade has seen microresonators become an established tool that has been employed on many different single magnetic objects, such as magnetic nanowires, nanotubes, biological materials, as well as magnetic tunnel junctions [15,16,17,18,19].
In this work, we demonstrate the use of microresonator-FMR on single strip samples made from prototype ferromagnetic materials in form of embedded Fe60Al40-stripes. We discuss the fundamental dynamic modes. The sensitivity of single-frequency microresonators (similar to conventional cavity-based systems) is so high that one can detect not only the uniform modes, but also non-uniform ones, such as localized and standing spin-wave modes or uniform edge modes. The dynamics of the strip geometry are compared and explained by simulation results obtained from the mumax3 code. Besides the microresonator approach, we introduce and describe so-called microantennas, a novel extension towards broadband (i.e., frequency-variable) FMR detection on laterally structured Permalloy (Ni80Fe20, hereafter Py) samples. The accessible frequency range of our setup is 2–18 GHz, which is limited only by the frequency range the components of the detection system can operate in. Broadband detection provides a straight-forward insight into magnetic relaxation. In the following, the term µ-FMR is used synonymously with the FMR methodology provided by microresonators and microantennas. The main advantage of a using microresonator/microantenna approach relies on a tremendous increase of the filling factor upon scaling down the resonator volume to the micrometer size, comparable to the one of the nanostructure. This high filling factor allows the increase of the detection sensitivity by orders of magnitude as compared to conventional FMR setups, also based on a measurement of the absorbed microwave power.
2. Materials and Experimental Methods
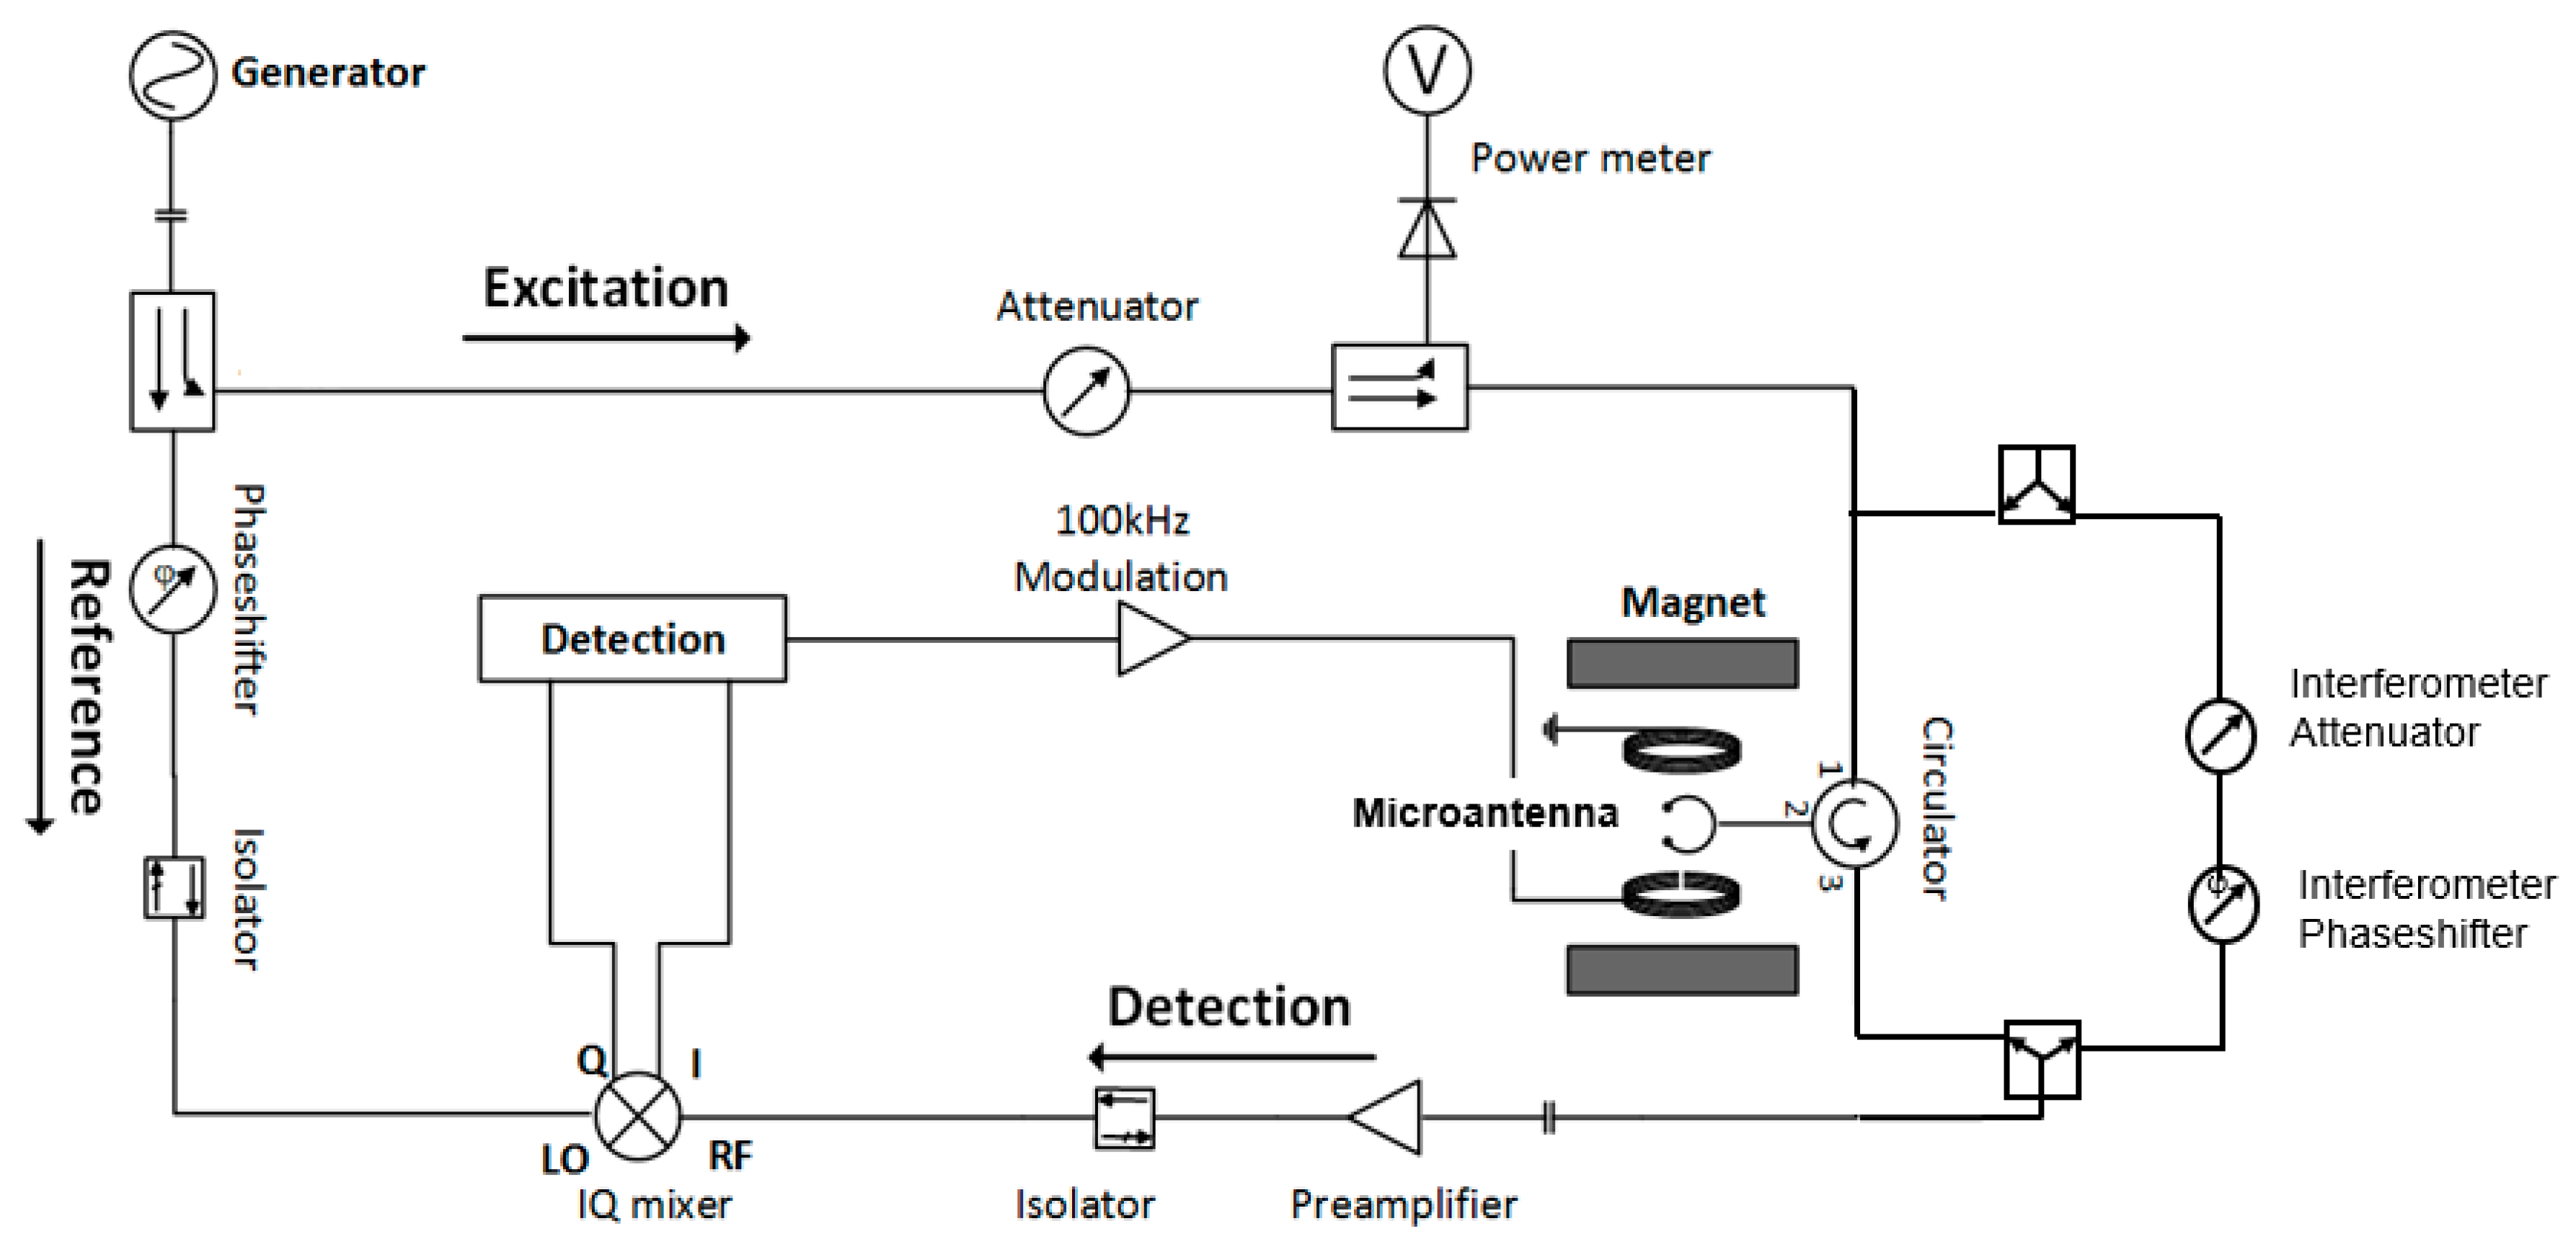
The FMR measurements on micrometer-sized Fe60Al40 and Py strips were performed on a home-built microwave spectrometer. A microwave bridge in combination with field-modulation and lock-in technique is used to improve to signal to noise ratio. Microwave power is divided into two paths. One is the excitation path, where the power level can be adjusted by an attenuator and is launched via the circulator into the resonator; the other arm is the reference arm, which biases the quadrature mixer at the operation frequency (homodyne detection technique). The phase shifter in the reference arm adjusts the phase at the local oscillator (LO) input of the quadrature mixer. Thereby, it allows for detection of absorption as well as dispersion of the FMR signals on the I and Q outputs, respectively (as seen modified sketch in Figure 1 without Mach–Zehnder interferometer). Technical details about the microwave spectrometer can be found in our previous study [17].
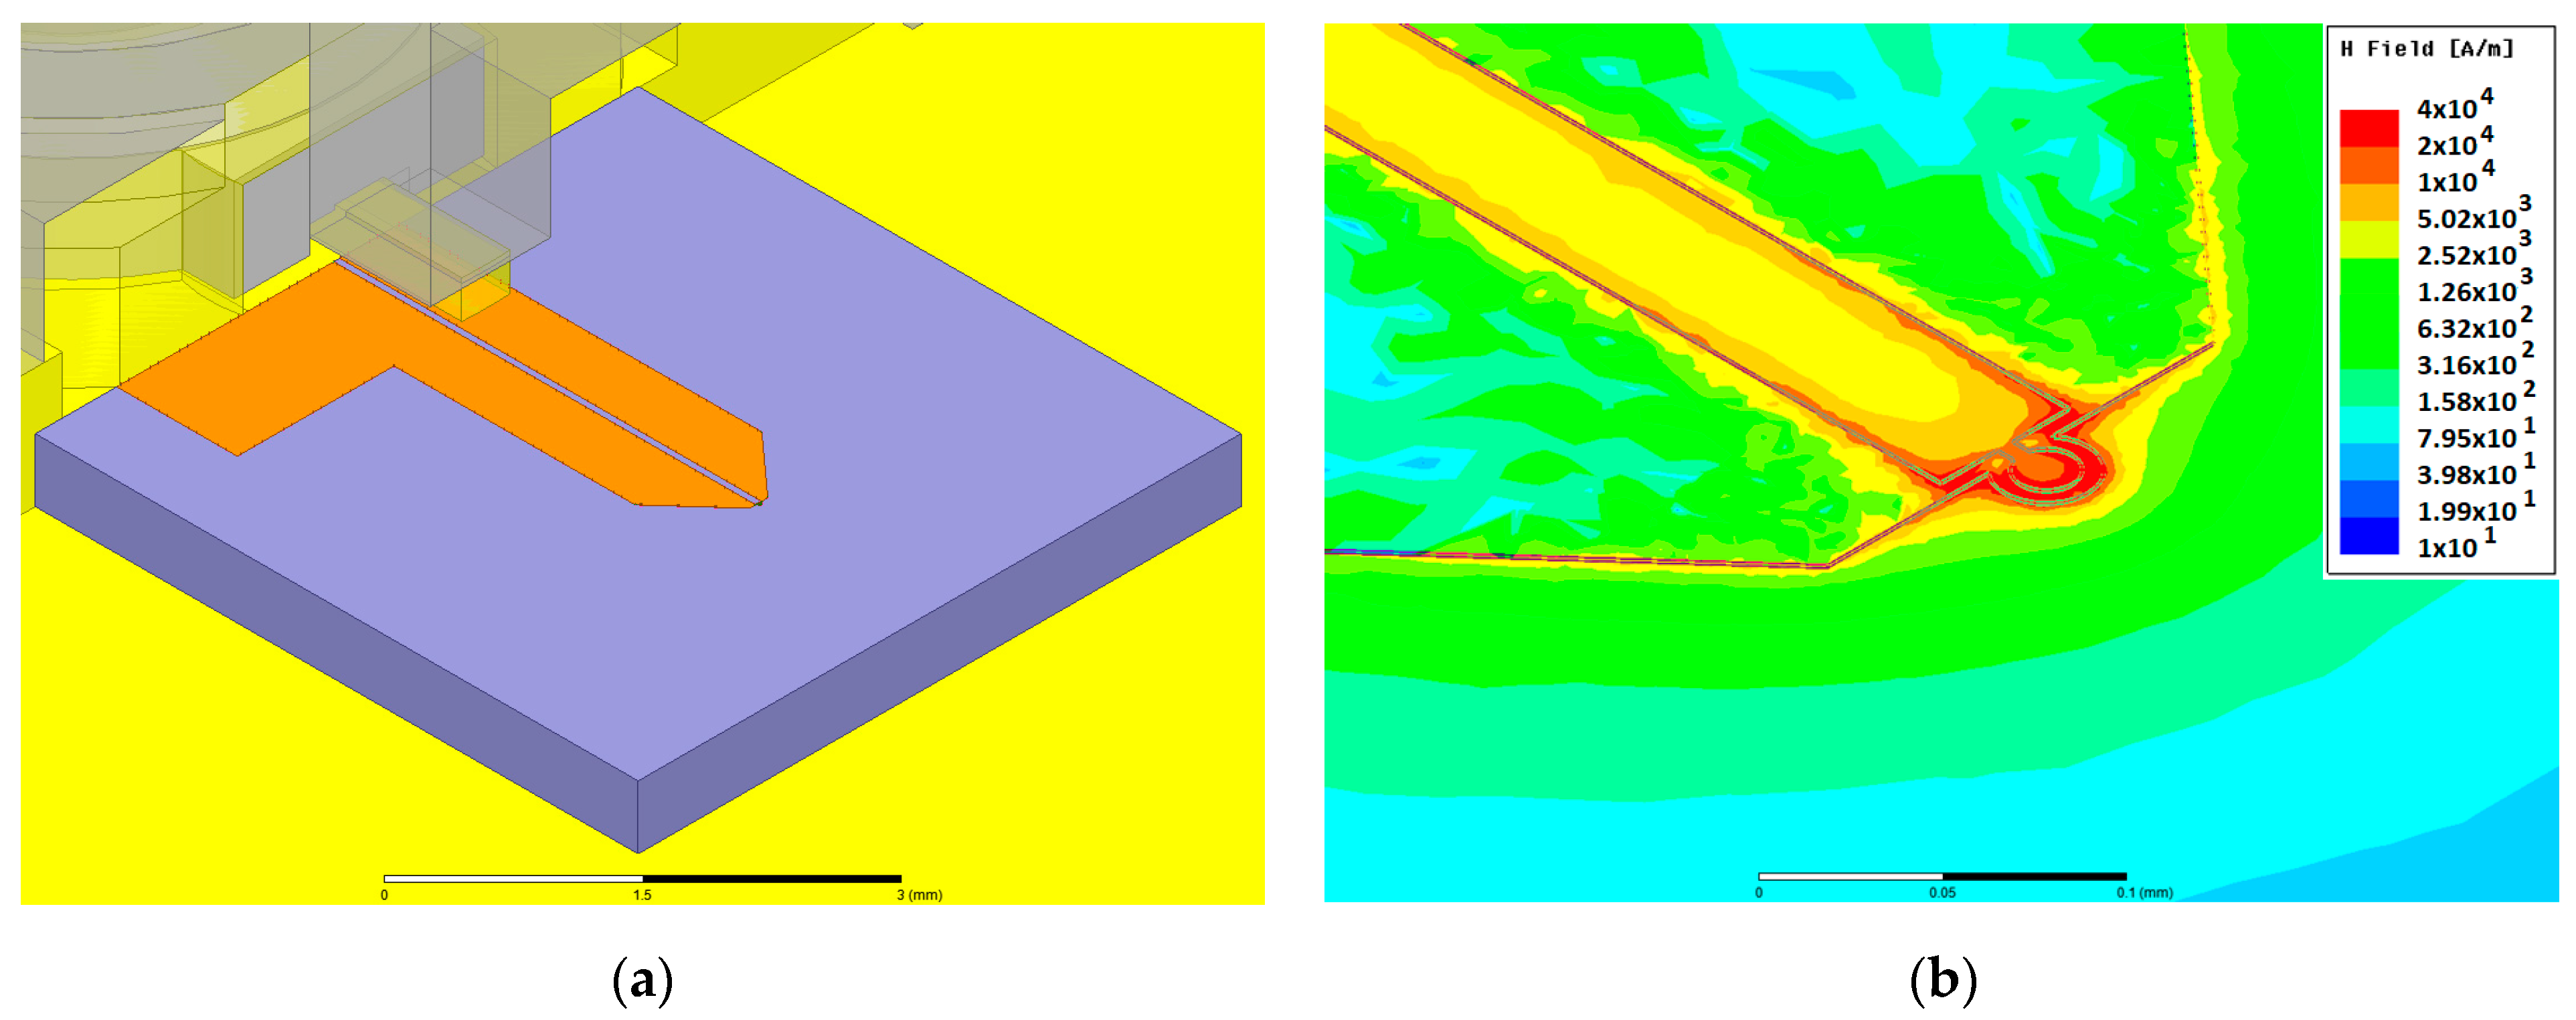
For the excitation and detection of the signals, we use planar near field antennas, tuned and matched for operation at a fixed frequency by means of stubs (microresonators), as well as broadband near field antennas with flat frequency response (microantennas), made of a shorted coplanar transmission line. While microresonators offer an increased sensitivity for measurements on micron-sized samples, microantennas allow for broadband measurements, revealing important dynamic magnetic properties like the damping. Microantennas consist of the section of a coplanar stripline, shorted at the end by a narrow strip, which acts as a near field antenna, coupling the microwave power to the precessing magnetic moment of the sample. For even more efficient and uniform excitation perpendicular to the plane, we built a loop into the shorting strip (Figure 1a). The loop size is tailored to be close to the dimensions of the sample. Electromagnetic simulations using the commercial finite element (FEM) simulation software HFSS (ANSYS), confirm the quite homogeneous distribution of the microwave magnetic field inside the loop (Figure 1b). Both the planar microresonator and the microantenna structures are fabricated by optical lithography.
To facilitate the broadband measurements with the microantennas, we added a Mach–Zehnder interferometer to the microwave spectrometer (see Figure 2, [17]): A power divider splits the microwave equally into a fraction used for (i) the resonant excitation of the sample and (ii) for the interferometer’s reference arm. For a given operation frequency, the attenuation and phase in the reference arm of the interferometer are adjusted such that the microwave power reflected from the microantenna with the sample is cancelled in the power combiner. This reduces the trace noise level and allows using higher microwave excitation power without the risk of saturating the low-noise amplifier. By sweeping the magnetic field of the electromagnet, we drive the sample into magnetic resonance. At resonance, the impedance of the microantenna is modified by the strong change of the sample’s magnetic permeability, and the reflected power reappears at the input of the preamplifier.
FMR experiments were performed on Fe60Al40 and Py (Ni80Fe20) samples. A 32 nm Fe60Al40 thin film was grown on a 270-nm-thick SiO2/Si substrate by magnetron-sputtering at room temperature. A post-annealing process was applied to the film in order to obtain the pristine (B2-paramagnetic) state [20]. Initially, a 14 µm diameter disc of 32 nm thick B2 Fe60Al40 was exposed by using photolithography. After preparation of the Fe60Al40 disk, the microresonator with 20 µm loop diameter was prepared around the disk by means of UV lithography and lift-off. The top-side, containing the microstrip lines or coplanar striplines, respectively, was metallized by 5 nm Cr/600 nm Cu/100 nm Au, whereas the backside metallization is serving as a ground. To fabricate the ferromagnetic strip, a focused Ne+ ion beam of 25 keV energy was rastered over a 10 µm × 1 µm region, keeping the fluence fixed at 1 × 10¹⁵ ions/cm2. The region exposed to the incident ions was disordered to form A2 ordered Fe60Al40, thereby realizing the embedded ferromagnetic stripe [20]. The frequency is defined by the shape and layout of the microresonator. Here we used a microresonator design with a loop diameter of 20 µm optimized for an eigenfrequency of 14 GHz (empty resonator). As control experiment and to obtain relevant parameters, an extended Fe60Al40 film was investigated by VSM and FMR (Ms = 708 kA/m and A = 4 pJ/m [21], not shown here). For the Py structure, a Py film was grown onto a MgO (001) substrate using electron beam evaporation. A 5 by 2 µm2 resist strip was prepared on the film by e-beam lithography, and the unprotected film was etched down to the substrate by Ar ion milling. Similarly to the Fe60Al40 strip, the microantenna was fabricated around the Py strip using lithography. However, one should note that the microantenna is designed in a coplanar geometry. It thus requires top side metallization only (5 nm Cr / 600 nm Cu/ 100 nm), comprising the signal as well as the ground lines.
3. Experimental Results and Discussion
The microresonator FMR experiments were performed on ferromagnetic 10µm × 1 µm × 0.032 µm A2-Fe60Al40 strips, embedded in a circular paramagnetic B2-Fe60Al40 matrix. A sketch of such a sample is shown in the inset of Figure 1a. The details of the preparation are described in Section 2. Fe60Al40 exhibits a stable, ordered B2-structure that shows paramagnetic behavior. Irradiation with energetic ions leads to a randomization of the lattice positions of the Fe and Al atoms, forming an A2 structure that is ferromagnetic [20,22,23,24,25,26]. Irradiation induced disorder is a versatile tool for patterning magnetic structures of desired geometries embedded within paramagnetic surroundings. The patterning can be performed using broad-beam irradiation through shadow masks [24], or using a focused ion-beam for direct magnetic writing [22,25]. The magnetic properties of Fe60Al40 films under broad-beam irradiation have been reported by Schneider et al. [27]. The effective magnetization (µ0Meff) of the films, depending on the degree of disordering, can reach up to 850 mT, which is comparable to that of Py.
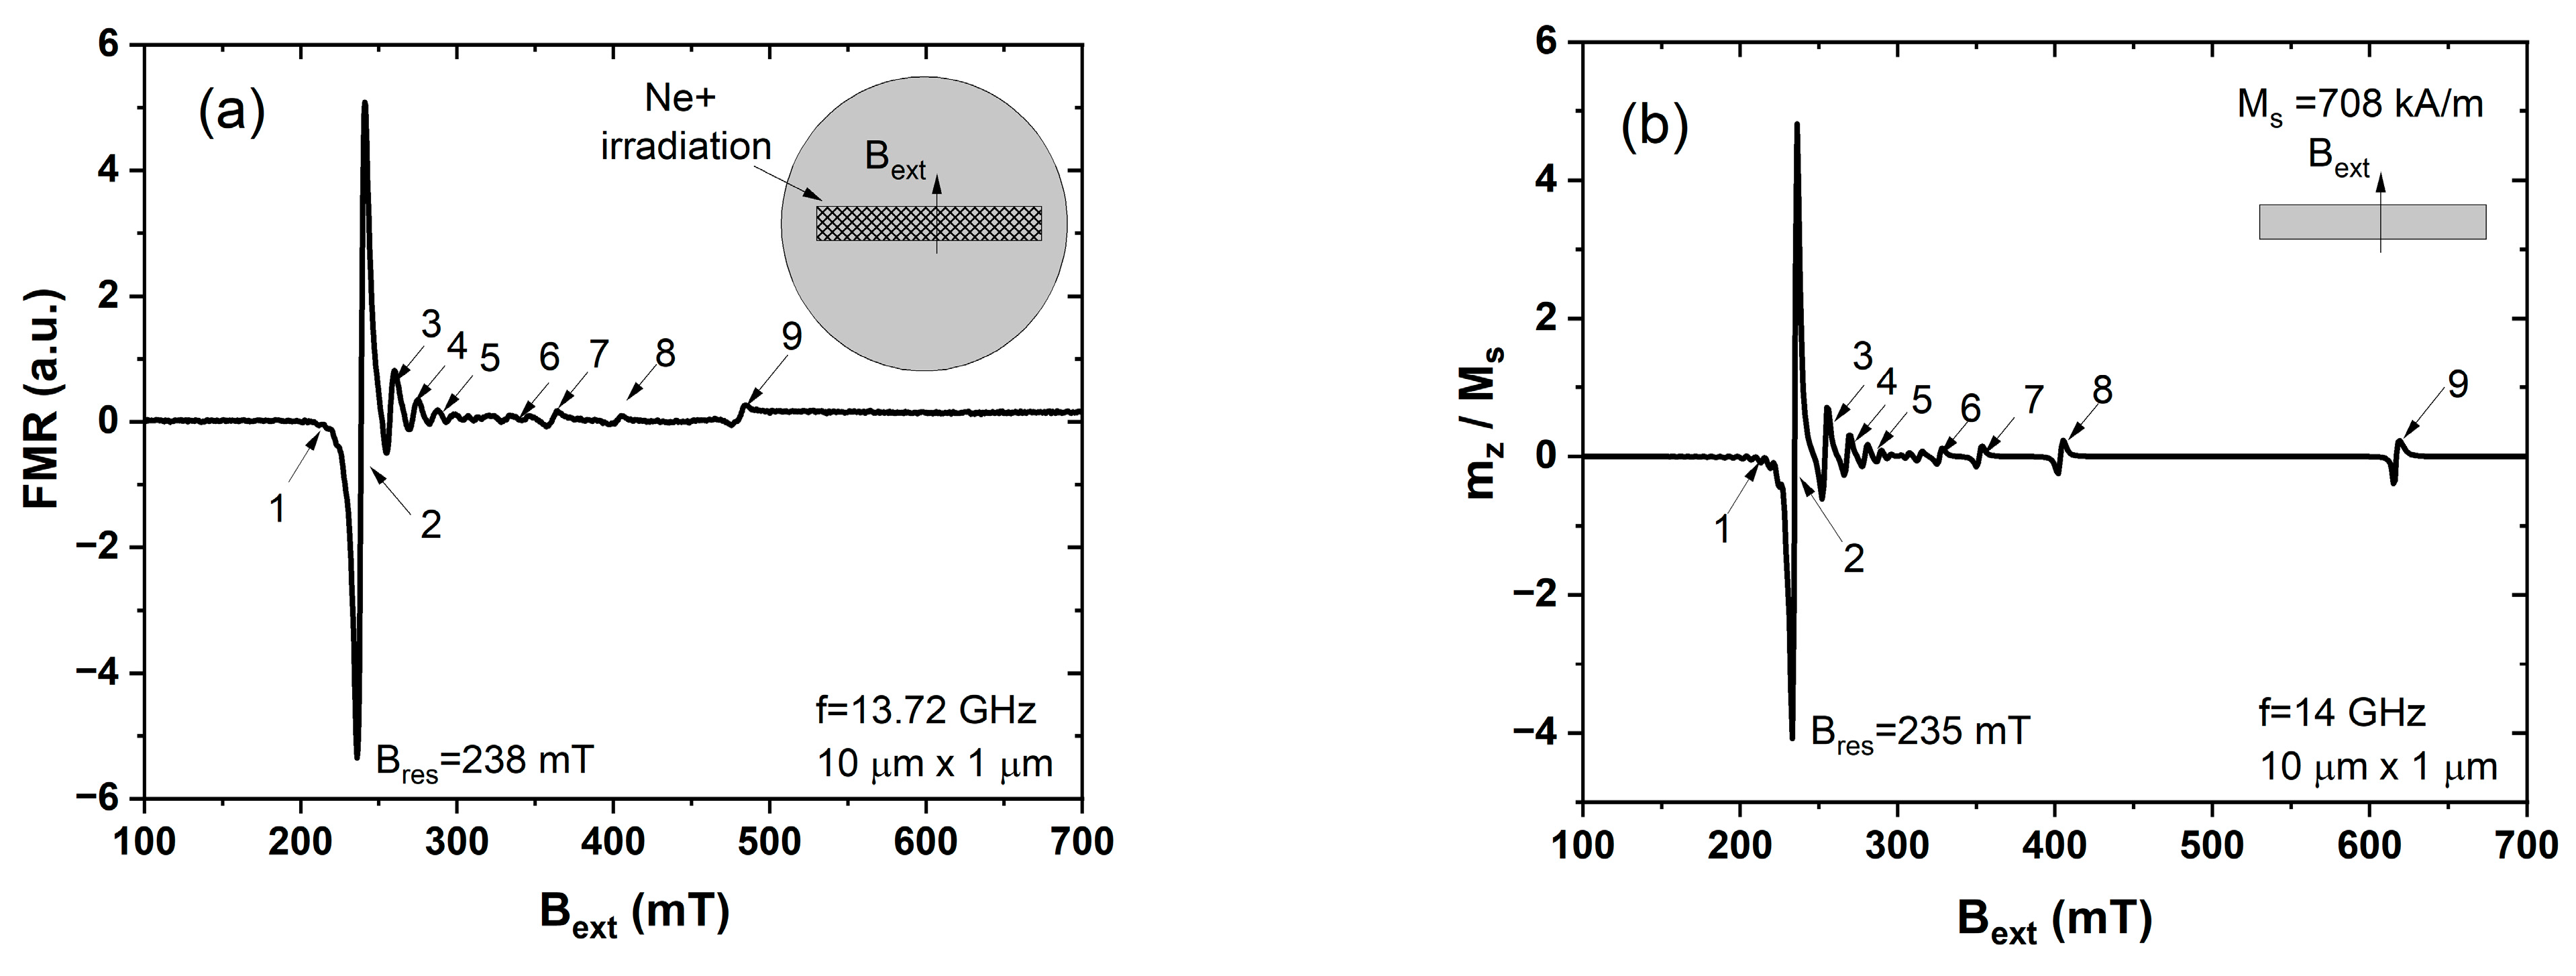
Figure 3a shows a measured FMR spectrum with a fixed excitation frequency of 13.72 GHz and a variable external field Bext applied perpendicular to the long axis of the ferromagnetic A2 Fe60Al40 stripe, embedded in a B2 Fe60Al40 surrounding, produced by direct writing using a focused Ne+ beam [23,26]. By using highly sensitive microresonator FMR detection, at least nine different resonance modes can be identified in the embedded ferromagnetic structure, as indicated by the numbering in Figure 3a. To visualize the mode character, micromagnetic simulations were performed using the mumax3 code [28]. For the simulations, we chose the following parameters: sample size 10 × 1 µm2, thickness 32 nm, saturation magnetization Ms = 708 kA/m (as measured by vibrating sample magnetometry), and an exchange constant A = 4 pJ/m [21] (calculated from (exchange dominated) perpendicular standing spin-wave modes [29] observed in a thin film sample by conventional broadband FMR). To model the FMR experiment, we used a continuous-wave method, described in the literature [30] with an excitation field in z direction (along the thickness of the sample). In Figure 1b, the result of the simulation is shown in terms of the perpendicular dynamic component of the magnetization mz normalized by Ms. This component is directly related to the experimentally detected FMR signal that is proportional to the high frequency susceptibility. By comparing qualitatively the results of the simulation with the measurement, we find a good agreement between both, as one can identify all nine resonance modes in the simulation as well. The values of the resonance field (for experiment and simulations) are extracted by fitting a complex Lorentzian function [31]. Those values are given in Table 1, proving again the good agreement between experiment and simulation (except the edge mode, No. 9).
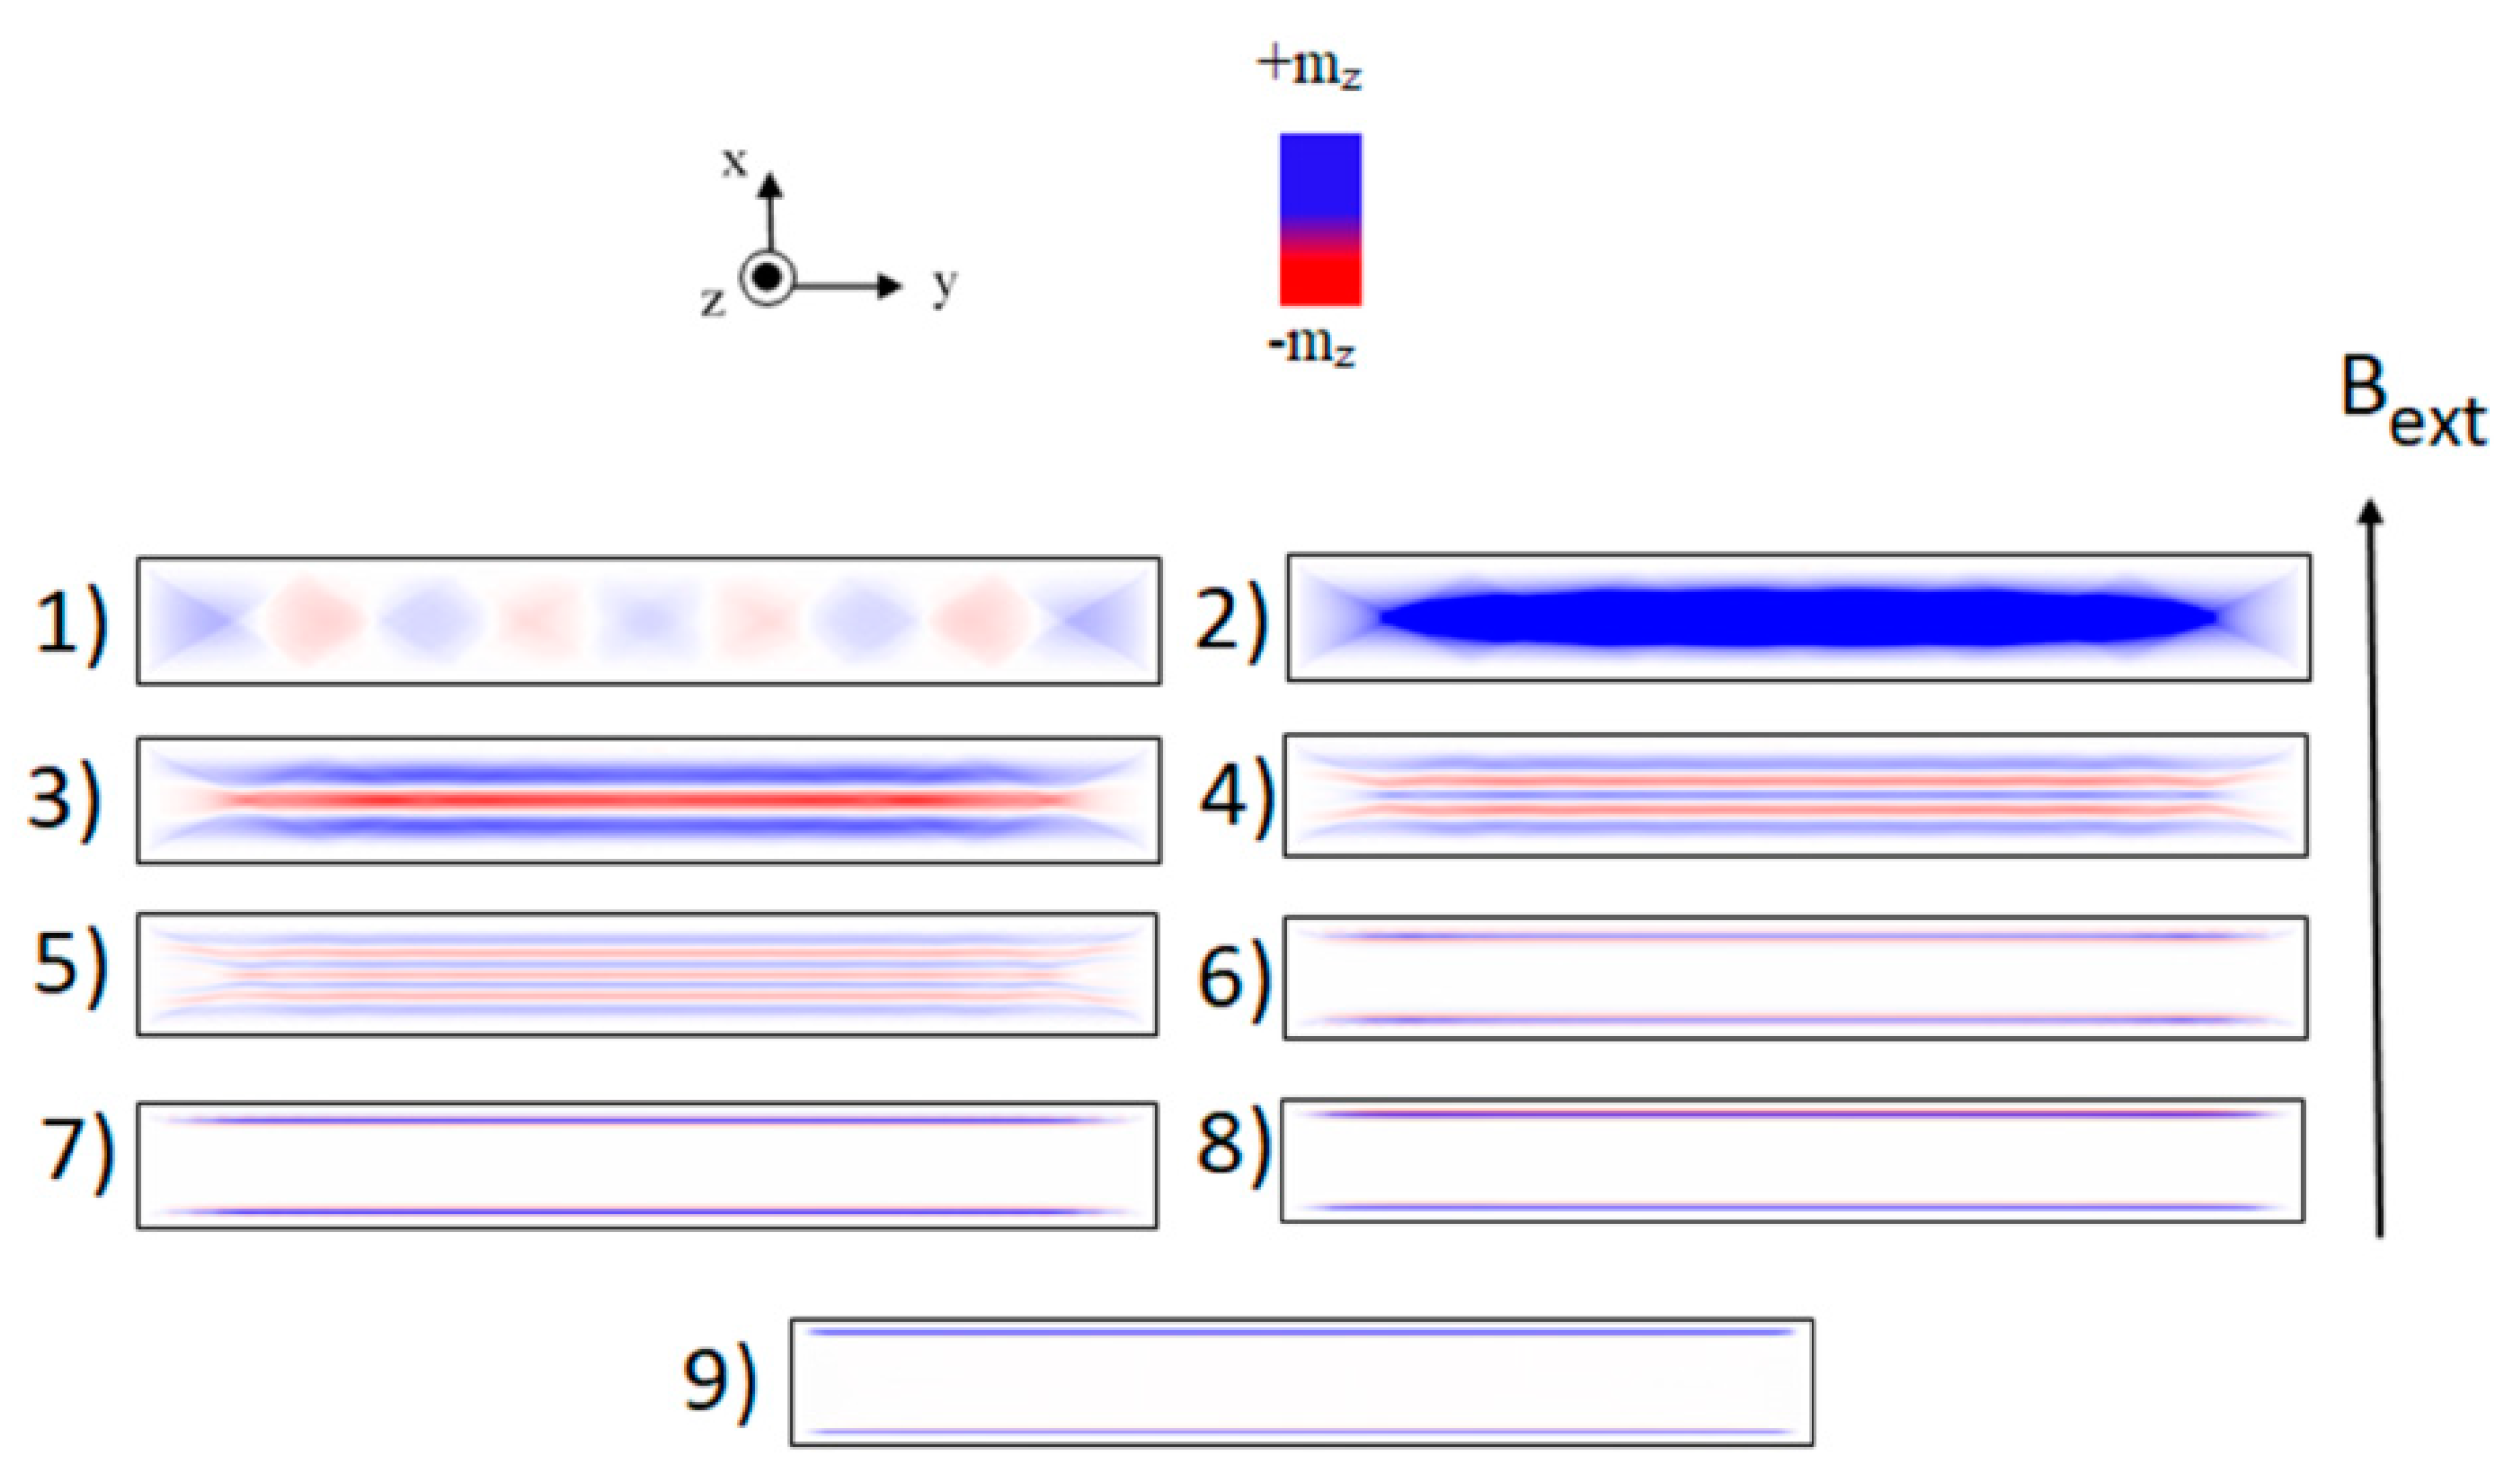
When performing a micromagnetic simulation, it is also possible to create snapshots of the magnetic configuration within the sample system. Those snapshots were always taken at the moment (in time) when the oscillating excitation field (sine-function) crosses the zero line. While a system is in resonance, it has a phase shift of 90° to the excitation field, resulting in a maximum amplitude in the snapshot. The snapshots, corresponding to the resonance mode labeling in Figure 3, are shown in Figure 4. The color contrast corresponds to the local out-of-plane component of the dynamic magnetization, i.e., mz, which is proportional to the measured FMR signal. The resonance (2) can be identified as the quasi-uniform mode. As seen from the pattern, just the center region of the stripe fulfills the resonance condition, while having a local mz = 0 at the edges of the system. Due to the shape of the sample (demagnetizing field) and boundary conditions at the edges, the expected resonance field in those regions is different, justifying the quasi-uniform mode. The pattern of resonance mode number (1) exhibits periodically varying mz along the length of the strip. While we are using ferromagnetic resonance as technique, we expect just modes with a standing wave character, as propagating modes would lead to a zero net microwave absorption. Nevertheless, it is possible to assign a wave vector k to the pattern, which is in this case perpendicularly (x-direction) oriented to the static magnetization (y-direction), well-known for a spin wave in Damon-Eshbach geometry [32]. Due to the geometric shape of the sample, it is not possible to excite standing spin waves with arbitrary wavelength, so we can observe only a discrete number of spin waves in Figure 3b. Note that these spin waves with wave vector perpendicular to the static magnetization occur at a smaller external field as compared to the quasi-uniform mode. As known from the dispersion relation of Damon–Eshbach modes [33], those need (for finite wavelength) more energy for excitation than the uniform mode. The reason for this lies in the fact that the dynamic stray fields the magnetic moments produced due to their non-uniform precessional motion are associated with an increased dipolar energy as compared to a uniform excitation for which all spins rotate with the same phase. A smaller resonance field compared to the quasi-uniform mode thus indicates a larger energy of the mode. The pattern maps of the resonances 3–5 are typical for so-called backward volume modes with different wave numbers. In this case, the wave vector is parallel to static magnetization (along the y-direction), while we observe a decreasing wavelength by increasing the applied external field. The resonance modes marked with 6–7–8 are so-called localized modes. As seen from the pattern for those modes, the excited resonant region (blue) is close to the long edge of the strip. In this region of the strip, the demagnetizing field is quite inhomogeneous, which implies even directly neighbored regions to exhibit different resonance conditions. Since the spins in those regions are still coupled to each other via exchange interaction, the excited region (in resonance) sends out propagating spin waves into the neighbored one. In turn, one wave is launched towards the strip center and another one propagates towards the edge of the long axis of the strip. While the wavelength of this propagating wave is given by the size of the excited region, it is small (in the range of a 10th of a nm) compared to the strip width (1 µm). As a result, the propagation length before the wave is damped out is also rather small. Due to this fact, the propagating wave directed to the center of the stripe will never reach the center region. The propagating wave directed to the edge, however, is able to reach it (because the excited location is close to the edge) and will be reflected back. The reflected wave interferes with the primary wave, leading to destructive/constructive interference. Just by having a constructive interference, the ferromagnetic resonance is able to couple to this mode. This explains why the localized modes are appearing also in discrete manner within the FMR spectrum. The mode No. 9 finally is the true edge mode, for which only magnetic moments exactly at the edge of the strip are excited. In contrast to the localized modes discussed before, for the edge mode no interference is occurring. The physical nature of the edge mode is different. It is very much comparable to the quasi-uniform mode, just shifted to higher external field values, due to the demagnetization field at the strip edge being larger than in the center region [34,35]. All uniform and non-uniform modes can be correlated with the simulation results. Only the edge mode was observed at much lower resonance field than expected from the simulation. One has to note that the real edge may differ from the ideal one in terms of its geometrical profile or its magnetic parameters. Moreover, the embedded strip geometry, for which the ferromagnetic spins of the ion-irradiated strip at the edges form an interface to a paramagnetic Fe60Al40 surrounding matrix, might magnetically be different as compared to the free-standing strip assumed in the simulation. Note that the edge mode observed at lower magnetic fields implies the edge mode frequency to be larger than those for the edge mode of the simulated free-standing strip.
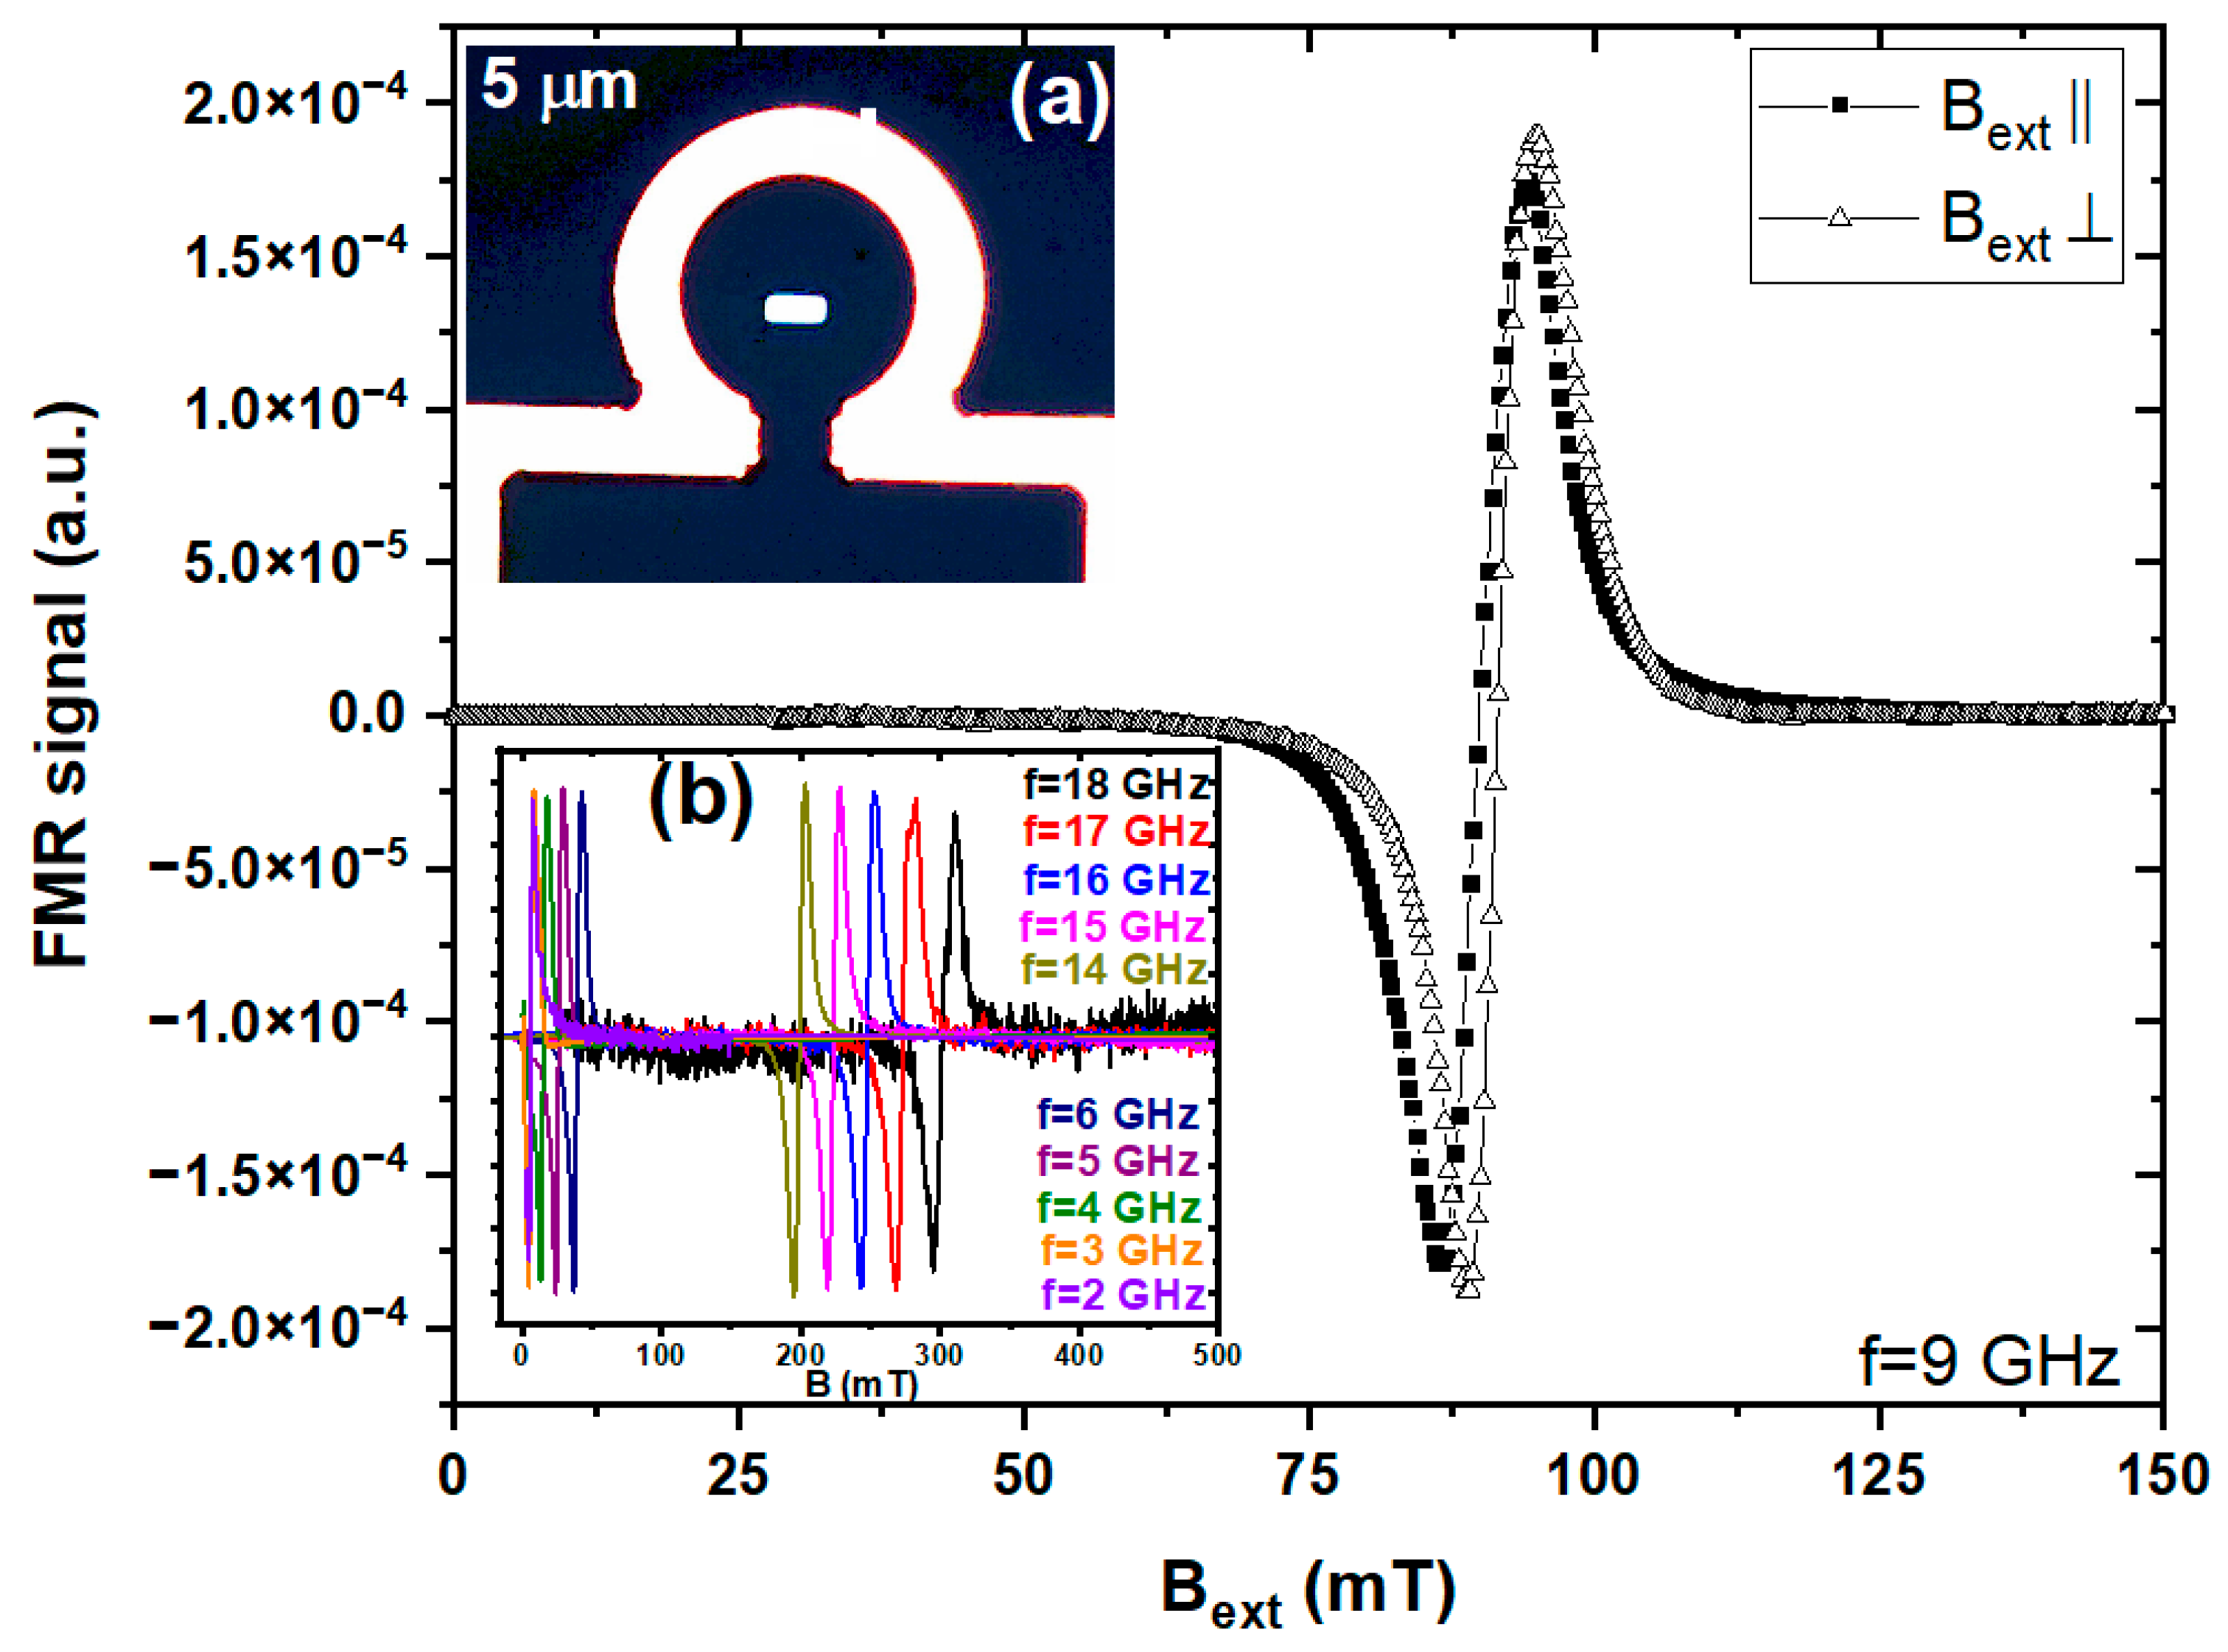
In the following, we would like to show how broadband µ-FMR can be utilized to determine the magnetization dynamics of a 5 × 2 × 0.015 µm3 Permalloy (Py) microstrip. While the strip exhibits a mode spectrum similar to the one discussed for the FeAl-strip before, we want to restrict our discussion in the following to the quasi-uniform mode. As discussed above, to increase the amount of insight to the magnetization dynamics, it is advantageous to perform measurements over a broad frequency range. Therefore, a broadband microantenna design was used instead of single-frequency microresonators. The microantenna setup also uses the microwave bridge to achieve high detection sensitivity and, thereby, can detect a spin resonance signal of about 106 spins/GHz1/2, while conventional spectroscopy techniques require around 1010 spins/GHz1/2 [36]. In Figure 5a, the FMR spectra of the Py strip are shown, measured at a frequency of 9 GHz for both the easy (Bext parallel to the long strip axis) and hard axis (Bext perpendicular to the long axis). The quasi-uniform mode for both orientations is clearly resolved in the FMR spectra. The main advantage of using a microantenna/microresonator approach is to allow for detecting the FMR response of single structures. Earlier experiments, performed to understand the behavior of magnetic strips, typically have investigated arrays of strips [37,38]. This, however, introduces difficulties in the interpretation of the data, as inter-strip coupling may influence the results. Moreover, modes stemming significantly from the samples’ edge are broadened and thus very weak due to the different strips in the array having a distribution of edge properties. The resonance field values of easy and hard directions are found to be close to each other due to a rather small shape anisotropy (as revealed also from the inset a of Figure 5 that shows an optical micrograph of the microantenna loop that is encapsulating the strip, the latter having an aspect ratio of only 2.5). In the inset b of Figure 5, FMR spectra are shown for the lower and upper limit of the frequency range of microantenna (2–18GHz). As seen from FMR spectra, a Lorentzian line shape is obtained.
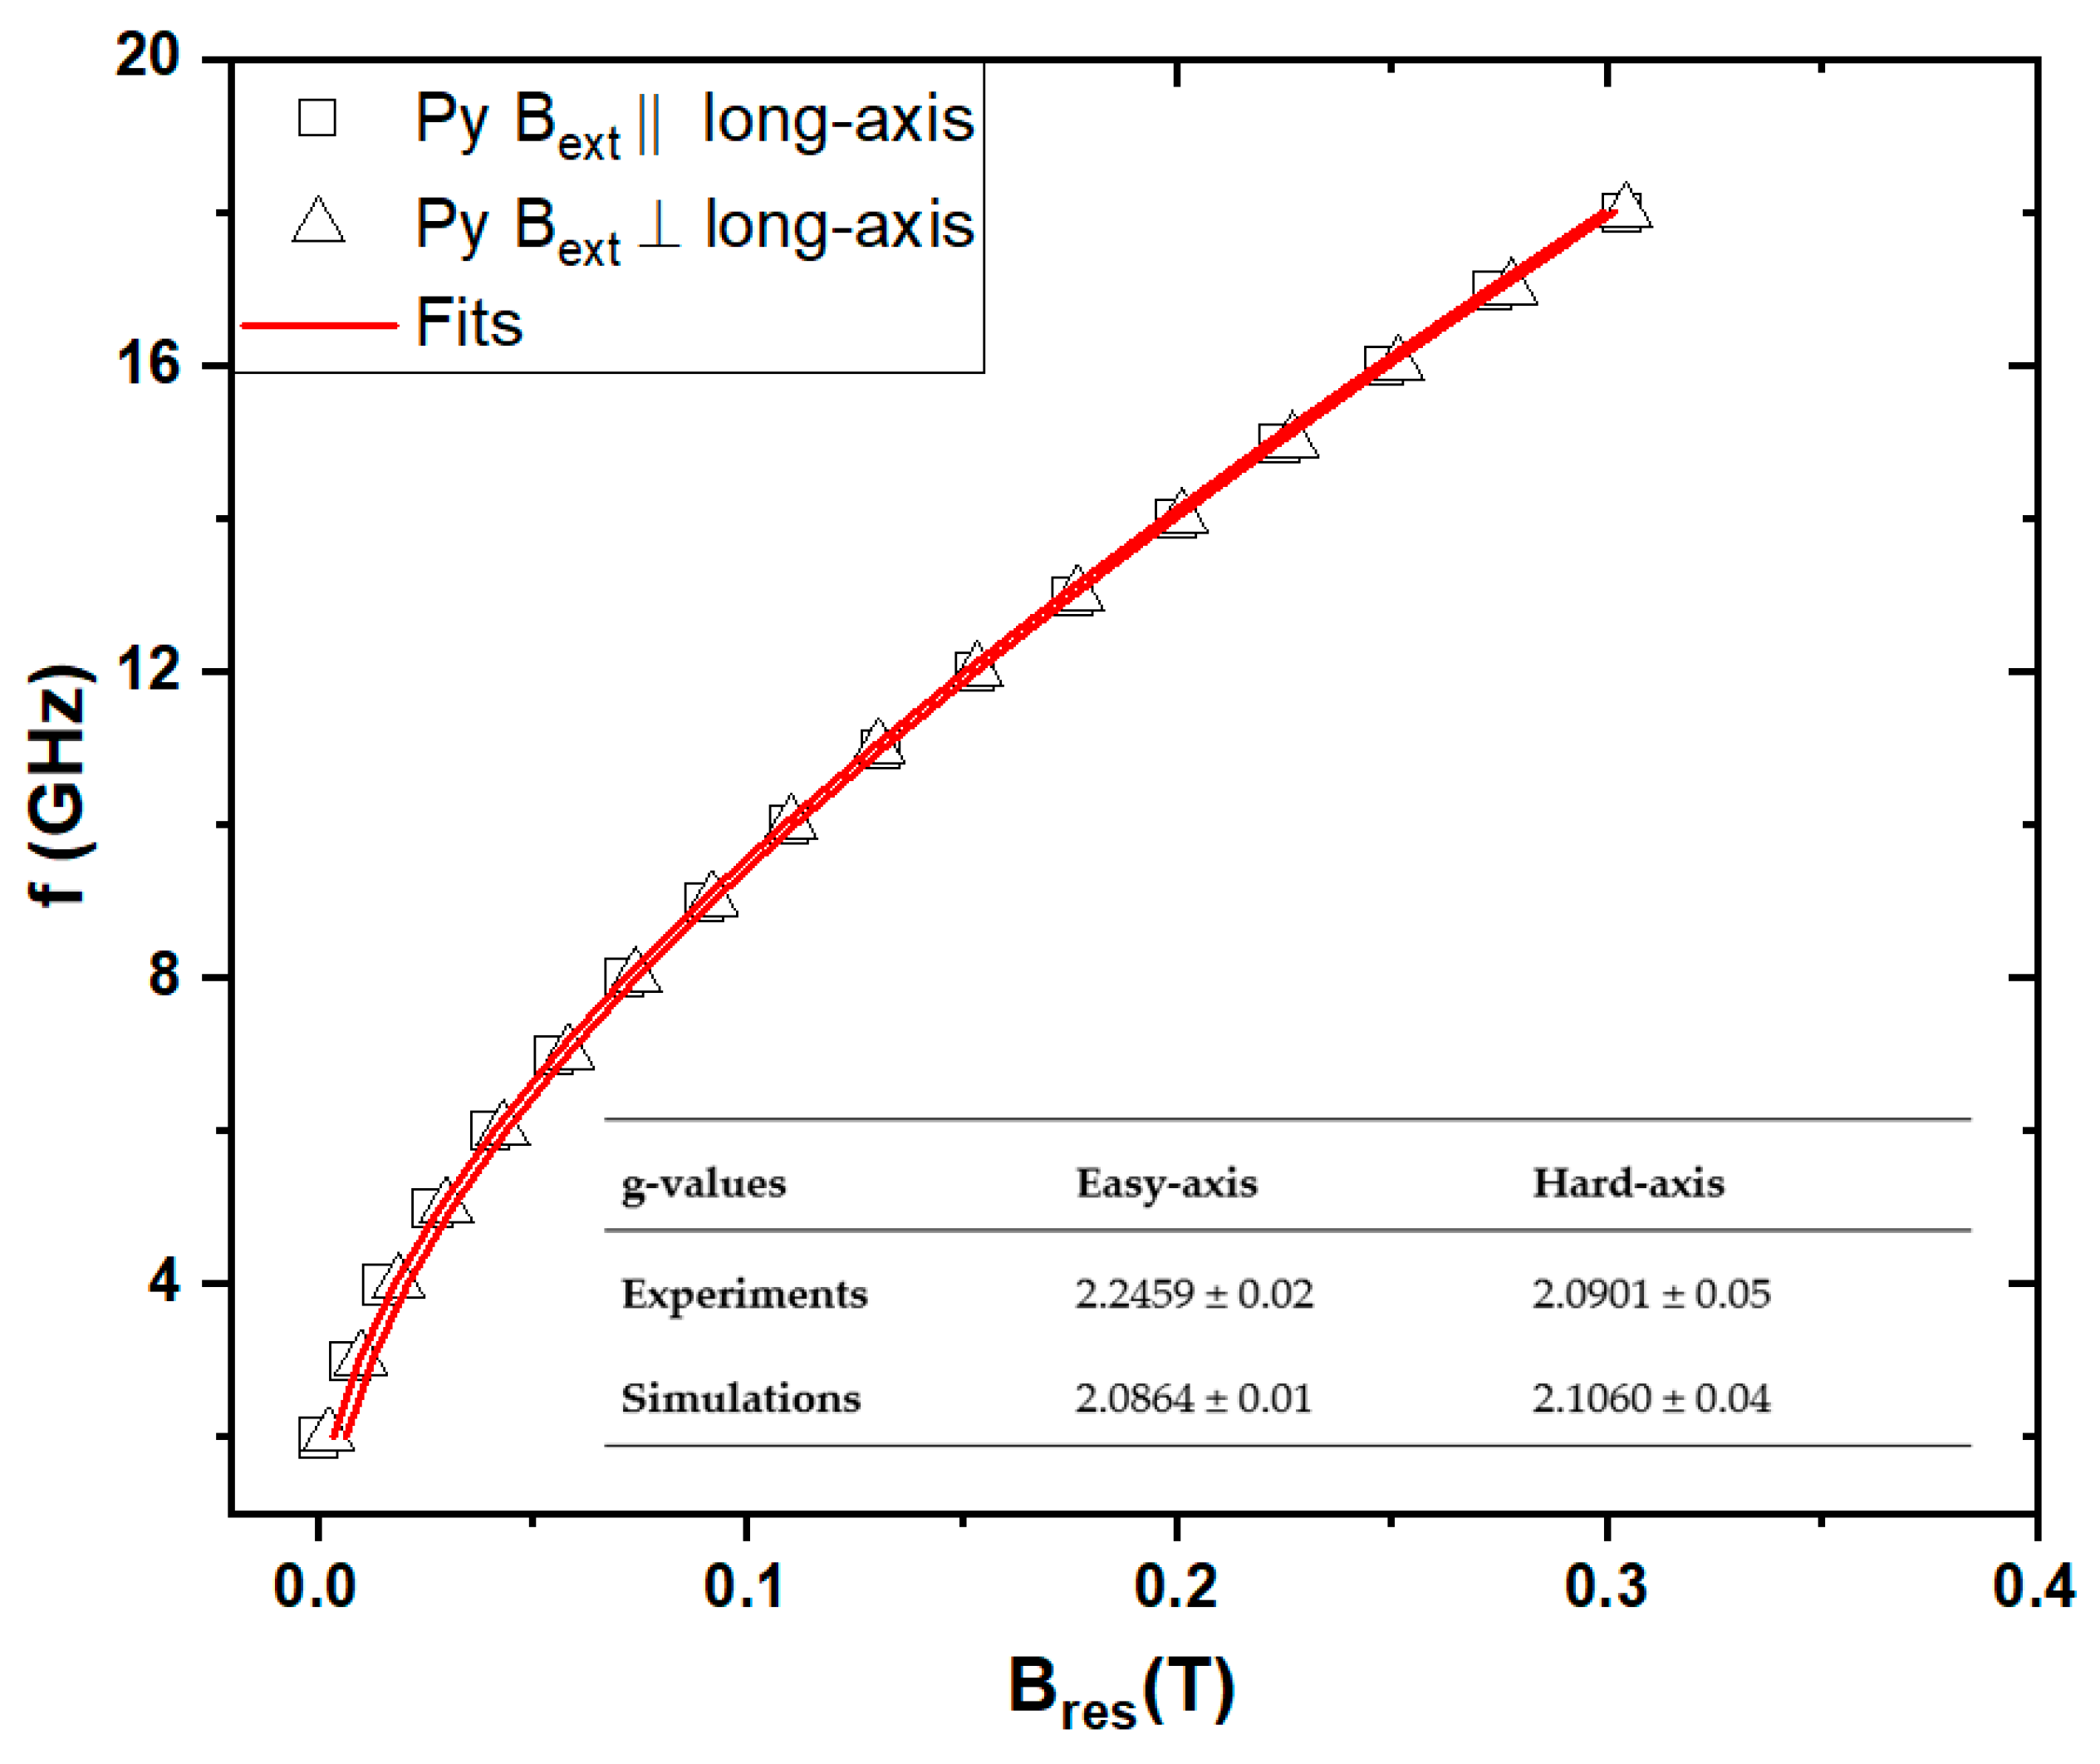
In Figure 6, the obtained resonance fields are plotted for different microwave frequencies for the Py strip (squares: easy axis, triangles: hard axis). Applying the well-known resonance equations for an extended thin film as given by Equation (1) [31], the effective magnetization Meff and the g-factor can be determined as fit parameters.
here is denotes the gyromagnetic ratio, is the in-plane angle of the magnetization Ms, and is the in-plane angle of the external magnetic field. K2‖/Ms is the uniaxial in-plane anisotropy, which is introduced to mimic the uniaxial symmetry of the strip. The effective magnetization is defined as the difference between the saturation magnetization and the perpendicular uniaxial anisotropy field: 4πMeff = 4πMs − 2K2⊥/Ms. All in-plane angles , , and are defined with respect to the long dimension of the strip. For definitions of the resonance equation, we refer to ref [31]. In case of easy-axis measurement ( = 0), Equation (1) results in:
In case of hard-axis measurements (), Equation (1) yields:
As given in the inset table, the thin film equations yield anisotropic g-factors, while the rigorous simulation taking into account the true mode pattern (see snapshot 2) in Figure 4 to visualize the pattern of the quasi-uniform mode yields perfect fits for both directions with an isotropic g-factor of 2.12. In contrast, the thin formulas assume all spins to precess in-phase. The example shows that this incorrect scenario results in an erroneous determination of magnetic parameters—here the g-factor. In fact, the g-factor is isotropic, even in the small object, as is clearly revealed by the microantenna measurement together with the micromagnetic simulations. For completeness, we add the values for the effective field, which was found to be 938 mT. As result of the micromagnetic simulation, a comparison of simulation and experimental resonance field values is given in Table 2. For both axes, the resonance field values are in quite good agreement, only slight differences about 1mT between simulation and experimental values occur. Those might result from the shape of the sample being not perfectly rectangular, thereby having impact on the demagnetizing factors, which in fact modify the resonance equations.
4. Conclusions
Understanding dynamical properties of nanomagnets plays a crucial role for future spin-based technologies. Our experimental results prove that microresonators are highly sensitive to detecting not only the uniform precession, but also localized spin waves and edge modes in nanometer-sized objects. Besides the microresonator approach, we introduced a “broadband” microantenna design, which adds a variability of the microwave excitation frequency. The method was tested via studying a Py strip sample. The planar (coplanar) structure of the microresonators (microantenna) furthermore provides the advantage of easy access to the material under investigation e.g. in form of light beams. This opens a route to study magnetic resonance in systems that exhibit plasmonic or photonic properties, including the coupling of those fundamental excitations to the magnetic system (e.g., magneto-plasmonics). Moreover, microresonators can be used to study the effects of particle irradiation on the dynamic properties. Recently, the helium ion microscope (HIM) generating a focused ion beam that allows for stepwise “cutting” a sample inside the microresonator loop was used in connection. The process was successfully employed on Fe-filled multi-wall carbon nanotubes (CNT) [19]. The microresonators may further be of use to study magnetism in or of liquids, as they are compatible with liquid environments, e.g., solutions magnetic nanoparticles [18]. In addition, since the magnetic excitation of the resonator loop penetrates into the dielectric resonator substrate by several micrometers, embedded magnetic structures within the dielectric material could be detected. The choice of dielectric material is thereby very flexible, and indeed, prototype resonators based on GaAs have been fabricated, and the method is likely extendable to a variety of other materials.
A disadvantage of the method is that no explicit time-domain measurements are possible, since the external magnetic field is swept quasi-statically. The method thus is a classical frequency domain one that currently in its version of the microantennas provides access to a frequency range of 2–18 GHz, with current efforts being made to achieve up to 35–40 GHz.
As summary, the method which we call “µ-FMR”, provides unique insight into the magnetic behavior of a variety of micro/nano-sized magnetic specimens and likely provides a tool for pushing down the detection limit of magnetic resonance experiments to in principle get access to single objects with dimensions below 50 nm.
Author Contributions
Conceptualization: J.L.; methodology: H.C.; formal analysis: H.C.; writing—review and editing: J.L. and H.C.; supervision: J.L. All authors have read and agreed to the published version of the manuscript.
Funding
This study is funded by Institute of Ion Beam Physics and Materials Research at Helmholtz-Zentrum Rossendorf e.V. and the German Research Foundation (DFG)—project number 322462997.
Acknowledgments
We thank S. Stienen for the mumax3 simulations and comments, R. Narkowicz for technical support and comments, K. Lenz and R. Bali for fruitful discussions and comments, and Md. S. Anwar for thin film growth. Additionally, we are thankful to G. Hlawacek for the focused ion beam irradiation. Support by the Nanofabrication Facilities Rossendorf at IBC and the ion beam center of HZDR is gratefully acknowledged.
Conflicts of Interest
The authors declare no conflict of interest.
References
- Hirohata, A.; Yamada, K.; Nakatani, Y.; Prejbeanu, I.L.; Diény, B.; Pirro, P.; Hillebrands, B. Review on spintronics: Principles and device applications. J. Magn. Magn. Mater. 2020, 509, 166711. [Google Scholar] [CrossRef]
- Barman, A.; Mondal, S.; Sahoo, S.; De, A. Magnetization dynamics of nanoscale magnetic materials: A perspective. J. Appl. Phys. 2020, 128, 170901. [Google Scholar] [CrossRef]
- Wagner, K.; Kákay, A.; Schultheiss, K.; Henschke, A.; Sebastian, T.; Schultheiss, H. Magnetic domain walls as reconfigurable spin-wave nanochannels. Nat. Nanotechnol. 2016, 11, 432. [Google Scholar] [CrossRef]
- Avci, C.A. Picosecond switching in a ferromagnet. Nat. Electron. 2020, 3, 660. [Google Scholar] [CrossRef]
- Wigen, P.E.; Zhang, Z. Ferromagnetic resonance in coupled magnetic multilayer systems. Braz. J. Phys. 1992, 22, 267. [Google Scholar]
- Farle, M. Ferromagnetic resonance of ultrathin metallic layers. Rep. Prog. Phys. 1998, 61, 755. [Google Scholar] [CrossRef]
- Fermin, J.R.; Azevedo, A.; Aguiar, F.M.; Li, B.; Rezende, S.M.J. Ferromagnetic resonance linewidth and anisotropy dispersion in thin Fe films. Appl. Phys. 1999, 85, 7316. [Google Scholar] [CrossRef]
- De Sihues, M.D.; Durante-Rincon, C.A.; Fermin, J.R. A ferromagnetic resonance study of NiFe alloy thin films. J. Magn. Magn. Mater. 2007, 316, 462. [Google Scholar] [CrossRef]
- Lenz, K.; Kosubek, E.; Tolinski, T.; Lindner, J.; Baberschke, K. In situ ferromagnetic resonance in coupled ultrathin trilayers with perpendicularly oriented easy axes. J. Phys. Condens. Matter 2003, 15, 7175. [Google Scholar] [CrossRef]
- Zhang, Z.; Zhou, L.; Wigen, P.E.; Ounadjela, K. Angular dependence of ferromagnetic resonance in exchange-coupled Co/Ru/Co trilayer structures. Phys. Rev. B 1994, 50, 6094. [Google Scholar] [CrossRef]
- Urban, R.; Woltersdorf, G.; Heinrich, B. Gilbert Damping in Single and Multilayer Ultrathin Films: Role of Interfaces in Nonlocal Spin Dynamics. Phys. Rev. Lett. 2009, 87, 27120. [Google Scholar] [CrossRef] [PubMed]
- Poole, C.P., Jr. Electron Spin Resonance; Interscience: New York, NY, USA, 1967. [Google Scholar]
- Narkowicz, R.; Suter, D.; Stonies, R. Planar microresonators for EPR experiments. J. Magn. Reson. 2005, 175, 275. [Google Scholar] [CrossRef]
- Narkowicz, R.; Suter, D.; Niemeyer, I. Scaling of sensitivity and efficiency in planar microresonators for electron spin resonance. Rev. Sci. Instrum. 2008, 79, 084702. [Google Scholar] [CrossRef] [Green Version]
- Banholzer, A.; Narkowicz, R.; Hassel, C.; Meckenstock, R.; Stienen, S.; Posth, O.; Suter, D.; Farle, M.; Lindner, J. Visualization of spin dynamics in single nanosized magnetic elements. Nanotechnology 2011, 22, 295713. [Google Scholar] [CrossRef] [PubMed] [Green Version]
- Schoeppner, C.; Wagner, K.; Stienen, S.; Meckenstock, R.; Farle, M.; Narkowicz, R.; Suter, D.; Lindner, J. Angular dependent ferromagnetic resonance analysis in a single micron sized cobalt stripe. J. Appl. Phys. 2014, 116, 033913. [Google Scholar] [CrossRef]
- Cansever, H.; Narkowicz, R.; Lenz, K.; Fowley, C.; Ramasubramanian, L.; Yildirim, O.; Niesen, A.; Huebner, T.; Reiss, G.; Lindner, J.; et al. Investigating spin-transfer torques induced by thermal gradients in magnetic tunnel junctions by using micro-cavity ferromagnetic resonance. J. Phys. D Appl. Phys. 2018, 51, 224009. [Google Scholar] [CrossRef]
- Zingsem, B.W.; Feggeler, T.; Terwey, A.; Ghaisari, S.; Spoddig, D.; Faivre, D.; Meckenstock, R.; Farle, M.; Winklhofer, M. Biologically encoded magnonics. Nat. Commun. 2019, 10, 4345. [Google Scholar] [CrossRef] [Green Version]
- Lenz, K.; Narkowicz, R.; Wagner, K.; Reiche, C.F.; Körner, J.; Schneider, T.; Kákay, A.; Schultheiss, H.; Weissker, U.; Wolf, D.; et al. Magnetization Dynamics of an Individual Single-Crystalline Fe-Filled Carbon Nanotube. Small 2019, 15, 1904315. [Google Scholar] [CrossRef] [PubMed]
- Ehrler, J.; Liedke, M.O.; Cizek, J.; Boucher, R.; Butterling, M.; Zhou, S.; Böttger, R.; Hirschmann, E.; Trinh, T.T.; Wagner, A.; et al. The role of open-volume defects in the annihilation of antisites in a B2-ordered alloy. Acta Mater. 2019, 176, 167. [Google Scholar] [CrossRef]
- Tahir, N.; Bali, R.; Gieniusz, R.; Mamica, S.; Gollwitzer, J.; Schneider, T.; Lenz, K.; Potzger, K.; Lindner, J.; Krawczyk, M.; et al. Tailoring dynamic magnetic characteristics of Fe60Al40 films through ion irradiation. Phys. Rev. B 2015, 92, 144429. [Google Scholar] [CrossRef]
- Bali, R.; Wintz, S.; Meutzner, F.; Hubner, R.; Boucher, R.; Unal, S.; Valencia, A.; Neudert, K.; Potzger, J.; Bauch, F.; et al. Fassbender. Nano Lett. 2014, 14, 435. [Google Scholar] [CrossRef]
- La Torre, E.; Smekhova, A.; Schmitz-Antoniak, C.; Ollefs, K.; Eggert, B.; Cöster, B.; Walecki, D.; Wilhelm, F.; Rogalev, A.; Lindner, J.; et al. Local probe of irradiation induced structural changes and orbital magnetism in Fe60Al40 thin films via order-disorder phase transition. Phys. Rev. B 2018, 98, 024101. [Google Scholar] [CrossRef] [Green Version]
- Nord, M.; Semisalova, A.; Kákay, A.; Hlawacek, G.; Maclaren, I.; Liersch, V.; Volkov, O.; Makarov, D.; Paterson, G.W.; Potzger, K.; et al. Strain Anisotropy and Magnetic Domains in Embedded Nanomagnets. Small 2019, 15, 1904738. [Google Scholar] [CrossRef] [Green Version]
- Ehrler, J.; Sanyal, B.; Grenzer, J.; Zhou, S.; Böttger, R.; Wende, H.; Lindner, J.; Faßbender, J.; Leyens, C.; Potzger, K.; et al. Magneto-structural correlations in a systematically disordered B2 lattice. New J. Phys. 2020, 22, 073004. [Google Scholar] [CrossRef]
- Röder, F.; Hlawacek, G.; Wintz, S.; Hübner, R.; Bischoff, L.; Lichte, H.; Potzger, K.; Lindner, J.; Fassbender, J.; Bali, R. Direct Depth- and Lateral- Imaging of Nanoscale Magnets Generated by Ion Impact. Sci. Rep. 2015, 5, 16786. [Google Scholar]
- Schneider, T.; Lenz, K.; Semisalova, A.; Gollwitzer, J.; Heitler-Klevans, J.; Potzger, K.; Fassbender, J.; Lindner, J.; Bali, R. Tuning ferromagnetic resonance via disorder/order interfaces. J. Appl. Phys. 2019, 125, 195302. [Google Scholar] [CrossRef]
- Vansteenkiste, A.; Leliaert, J.; Dvornik, M.; Helsen, M.; Garcia-Sanchez, F.; Van Waeyenberge, B. The design and verification of mumax3. AIP Adv. 2014, 4, 107133. [Google Scholar] [CrossRef] [Green Version]
- Gui, Y.S.; Mecking, N.; Hu, C.M. Quantized spin excitations in a ferromagnetic microstrip from microwave photovoltage measurements. Phys. Rev. Lett. 2007, 98, 217603. [Google Scholar] [CrossRef] [PubMed] [Green Version]
- Wagner, K.; Stienen, S.; Farle, M. Continuous wave approach for simulating Ferromagnetic Resonance in nanosized elements. arXiv 2015, arXiv:1506.05292. [Google Scholar]
- Liedke, M.O.; Körner, M.; Lenz, K.; Fritzsche, M.; Ranjan, M.; Keller, A.; Cizmar, E.; Zvyagin, S.A.; Facsko, S.; Potzger, K.; et al. Crossover in the surface anisotropy contributions of ferromagnetic films on rippled Si surfaces. Phys. Rev. B 2013, 87, 024424. [Google Scholar] [CrossRef]
- Möller, M.; Lenz, K.; Lindner, J. Frequency-domain magnetic resonance-alternative detection schemes for samples at the nanoscale. J. Surf. Interfaces Mater. 2014, 2, 46. [Google Scholar] [CrossRef]
- Körner, M.; Lenz, K.; Gallardo, R.A.; Fritzsche, M.; Mücklich, A.; Facsko, S.; Lindner, J.; Landeros, P.; Fassbender, J. Two-magnon scattering in permalloy thin films due to rippled substrates. Phys. Rev. B 2013, 88, 054405. [Google Scholar]
- Trossman, J.; Lim, J.; Bang, W.; Ketterson, J.B.; Tsai, C.C.; Lee, S.J. Effects of an adjacent metal surface on spin wave propagation. AIP Adv. 2018, 8, 056024. [Google Scholar] [CrossRef] [Green Version]
- McMichael, R.D.; Maranville, B.B. Edge saturation fields and dynamic edge modes in ideal and nonideal magnetic film edges. Phys. Rev. B 2006, 74, 024424. [Google Scholar] [CrossRef]
- Boero, G.; Bouterfas, M.; Massin, C.; Vincent, F.; Besse, P.-A.; Popovic, R.S. Electron-spin resonance probe based on a 100 μm planar microcoil. Rev. Sci. Instrum. 2003, 74, 11. [Google Scholar] [CrossRef]
- Chen, X.; Ma, Y.G.; Ong, C.K. Magnetic anisotropy and resonancefrequency of patterned soft magnetic strips. J. Appl. Phys. 2008, 104, 013921. [Google Scholar] [CrossRef]
- Skorohodov, E.V.; Gorev, R.V.; Yakubov, R.R.; Demidov, E.S.; Khivintsev, Y.V.; Filimonov, Y.A.; Mironov, V.L. Ferromagnetic resonance in submicron permalloy stripes. J. Magn. Magn. Mater. 2017, 424, 118. [Google Scholar] [CrossRef] [Green Version]
Figure 1.
Layout (a) and magnetic microwave field (b) distribution of the microantenna, obtained by FEM simulation of the structure.
Figure 1.
Layout (a) and magnetic microwave field (b) distribution of the microantenna, obtained by FEM simulation of the structure.

Figure 2.
Schematic of the Mach–Zehnder–FMR spectrometer. For broadband measurements, an interferometer arm consisting of two power dividers, variable attenuator, and phase shifter was added parallel to the circulator of the original design [17]. Exchangeable circulators and isolators are used in order to cover a frequency range from 2 to 18 GHz.

Figure 3.
(a) Microresonator FMR experiment on an embedded Fe60Al40 strip with the size of 10 × 1 × 0.032 µm (irradiated with Ne+ with E = 25 keV) performed at 13.72 GHz (b) mumax3 simulation of a free-standing Fe60Al40 strip at 14 GHz. FMR signals are labelled from 1 to 9.
Figure 3.
(a) Microresonator FMR experiment on an embedded Fe60Al40 strip with the size of 10 × 1 × 0.032 µm (irradiated with Ne+ with E = 25 keV) performed at 13.72 GHz (b) mumax3 simulation of a free-standing Fe60Al40 strip at 14 GHz. FMR signals are labelled from 1 to 9.

Figure 4.
Snapshots of the FMR modes found in the simulated FMR spectra shown in Figure 1b. Blue/white/red colors represent the mz component.
Figure 4.
Snapshots of the FMR modes found in the simulated FMR spectra shown in Figure 1b. Blue/white/red colors represent the mz component.

Figure 5.
FMR spectra taken at 9 GHz along the hard axis (open triangles) and easy axis (solid squares). (a) The inset shows the optical microscopy image of the Py strip inside the microantenna loop. (b) FMR spectra measured at the lower and upper limit of the frequency range of the µ-FMR setup.
Figure 5.
FMR spectra taken at 9 GHz along the hard axis (open triangles) and easy axis (solid squares). (a) The inset shows the optical microscopy image of the Py strip inside the microantenna loop. (b) FMR spectra measured at the lower and upper limit of the frequency range of the µ-FMR setup.

Figure 6.
Field dependences of the resonance frequency of the strip sample with field along the short and long axis, respectively. The inset table shows the experimental (easy and hard axis) g-values as well as the ones that result from fitting the simulated resonance fields to the above mentioned equations.


Table 1.
Comparison of the resonance field values from experiment and simulation. Except for mode (8), the difference between measurement and simulation is larger for modes more confined to the edge region of the sample (i.e., for modes (6), (7), and (9)).
Table 1.
Comparison of the resonance field values from experiment and simulation. Except for mode (8), the difference between measurement and simulation is larger for modes more confined to the edge region of the sample (i.e., for modes (6), (7), and (9)).
| Bres, (mT). | (1) | (2) | (3) | (4) | (5) | (6) | (7) | (8) | (9) |
|---|---|---|---|---|---|---|---|---|---|
| Measurement | 216 | 238 | 257 | 272 | 285 | 344 | 361 | 403 | 481 |
| Simulation | 215 | 235 | 254 | 268 | 279 | 327 | 352 | 403 | 617 |
Table 2.
Comparison of the resonance field values from experiment and simulation of Py strip for both axis at selected frequencies. Resonance field values are given in mT for both axis.
Table 2.
Comparison of the resonance field values from experiment and simulation of Py strip for both axis at selected frequencies. Resonance field values are given in mT for both axis.
| f(GHz) | Bres-Simulation (easy-axis)/mT | Bres-Experiment (easy-axis)/mT | Bres-Simulation (hard-axis)/mT | Bres-Experiment (hard-axis)/mT |
|---|---|---|---|---|
| 9 | 88.5 | 89.6 | 92.6 | 91.8 |
| 11 | 128.6 | 130.4 | 132.8 | 131.3 |
| 12 | 150.6 | 152.4 | 154.8 | 153.4 |
| 13 | 173.6 | 175.3 | 177.5 | 176.8 |
| 14 | 197.6 | 199.4 | 201.1 | 201.1 |
| 15 | 222.4 | 223.5 | 225.8 | 226.7 |
| 16 | 248.0 | 247.9 | 251.3 | 251.4 |
| 17 | 274.3 | 272.9 | 277.5 | 277.6 |
| 18 | 301.1 | 303.1 | 304.2 | 304.4 |
Publisher’s Note: MDPI stays neutral with regard to jurisdictional claims in published maps and institutional affiliations. |
© 2021 by the authors. Licensee MDPI, Basel, Switzerland. This article is an open access article distributed under the terms and conditions of the Creative Commons Attribution (CC BY) license (http://creativecommons.org/licenses/by/4.0/).
Share and Cite
MDPI and ACS Style
Cansever, H.; Lindner, J. Microresonators and Microantennas—Tools to Explore Magnetization Dynamics in Single Nanostructures. Magnetochemistry 2021, 7, 28. https://0-doi-org.brum.beds.ac.uk/10.3390/magnetochemistry7020028
AMA Style
Cansever H, Lindner J. Microresonators and Microantennas—Tools to Explore Magnetization Dynamics in Single Nanostructures. Magnetochemistry. 2021; 7(2):28. https://0-doi-org.brum.beds.ac.uk/10.3390/magnetochemistry7020028
Chicago/Turabian StyleCansever, Hamza, and Jürgen Lindner. 2021. "Microresonators and Microantennas—Tools to Explore Magnetization Dynamics in Single Nanostructures" Magnetochemistry 7, no. 2: 28. https://0-doi-org.brum.beds.ac.uk/10.3390/magnetochemistry7020028
Note that from the first issue of 2016, this journal uses article numbers instead of page numbers. See further details here.