Article

Enhancing PLS-SEM-Enabled Research with ANN and IPMA: Research Study of Enterprise Resource Planning (ERP) Systems’ Acceptance Based on the Technology Acceptance Model (TAM)

1
Faculty of Economics and Business, University of Maribor, 2000 Maribor, Slovenia
2
Faculty of Economics, University of Kragujevac, 34000 Kragujevac, Serbia
*
Author to whom correspondence should be addressed.
Submission received: 16 March 2022 / Revised: 16 April 2022 / Accepted: 18 April 2022 / Published: 20 April 2022

Abstract

:
PLS-SEM has been used recently more and more often in studies researching critical factors influencing the acceptance and use of information systems, especially when the technology acceptance model (TAM) is implemented. TAM has proved to be the most promising model for researching different viewpoints regarding information technologies, tools/applications, and the acceptance and use of information systems by the employees who act as the end-users in companies. However, the use of advanced PLS-SEM techniques for testing the extended TAM research models for the acceptance of enterprise resource planning (ERP) systems is scarce. The present research aims to fill this gap and aims to show how PLS-SEM results can be enhanced by advanced techniques: artificial neural network analysis (ANN) and Importance–Performance Matrix Analysis (IPMA). ANN was used in this research study to overcome the limitations of PLS-SEM regarding the linear relationships in the model. IPMA was used in evaluating the importance and performance of factors/drivers in the SEM. From the methodological point of view, results show that the research approach with ANN artificial intelligence complements the results of PLS-SEM while allowing the capture of nonlinear relationships between the variables of the model and the determination of the relative importance of each factor studied. On other hand, IPMA enables the identification of factors with relatively low performance but relatively high importance in shaping dependent variables.

1. Introduction

This article concerns enhancing traditional techniques in PLS-SEM with both artificial neural network (ANN) analysis and Importance-Performance Matrix Analysis (IPMA) when analyzing the maturity stage of the acceptance of enterprise resource planning (ERP) systems.
A review of the literature reveals that traditional PLS-SEM has been a powerful tool in researching business information solutions for the past 40 years [1,2,3,4,5,6,7,8,9]. With increasingly advanced and complex business information solutions, the PLS-SEM approach has also been increasingly used. However, advanced techniques and their resulting improved usability of PLS-SEM results that are achieved by combining such analysis with techniques such as ANN analysis are rarely reported.
The use of the PLS-SEM technique is very common in various fields of research where the researcher is interested in identifying statistically significant influencing factors for the dependent variables of the model. The limitation of the PLS-SEM technique is reflected, in particular, in the assumption of linear relationships between the model variables [10,11]. Although this limitation is important for a number of areas where this approach is applied, its importance is even more pronounced in management, which deals with human decisions that are multidimensional and complex by nature [12,13].
One possible approach is to supplement the results achieved by the PLS-SEM technique with the ANN method, which is one of the most valuable and commonly implemented artificial intelligence tools. The need to implement advanced data analysis methods in the discipline of management and business sciences, in general, is growing. In such cases, ANN can be an effective option for solving complex prediction problems. In management, these approaches are particularly successful in modeling nonlinear relationships between a dependent variable (or variables) and input data. Therefore, the previously mentioned disadvantage of PLS-SEM being able to recognize only linear relationships can be overcome precisely by using ANN, which recognizes nonlinear relationships [10,14]. In addition, traditional statistical methods and models assume that consumer decisions are linear and compensatory, which means that the deficiency of one factor may be compensated by improving other factor predictor [15]. This is often not the case in acceptance studies, i.e., consumer assessment as well as the decision-making process may not be compensatory and applied linear models might be inaccurate, so ANNs could be used to successfully resolve this issue [16]. Next, ANN techniques can give higher prediction accuracy as compared to linear ones [11,17], and they are also more robust and flexible [13]. Finally, the introduction of another research method would help to verify and reinforce the results obtained by PLS-SEM, thus improving the validity and reliability of these results [18]. However, because the ANN approach is not aimed at testing hypotheses and studying the impact of factors on the dependent variable(s) [10,14,18,19], the obtained PLS-SEM results from the first part of our research study are used in forming an ANN model that includes the statistically significant factors identified in the PLS-SEM.
IPMA is used in the last part of the research to assess the performance of key factors influencing the key dependent variables of the model. The implementation of IPMA provides additional results and important information that adds value to the PLS-SEM findings. The analysis of path coefficients, which allows the analysis of the importance dimension of an individual factor, is enriched in IPMA by considering the performance dimension through the average values of latent variables along with their indicators [20].
The importance of the research and of methodological approach we propose is high for managerial practice, as presented in this paper by the study of the acceptance of ERP systems based on the theoretical conceptual model—the technology acceptance model (TAM). It should be emphasized that with the digitalization of business, the importance of information systems in companies is enormous. Nowadays, in the time of the so-called digital transformation, the use of ERP systems in companies is necessary as they represent a central (main) information system to support almost all business processes on the operational levels of the companies [21]. In addition to that, the main characteristics of ERP systems are enterprise-wide integration, modular design (including business modules such as accounting and finance, purchasing, sales, manufacturing, services, human resources, etc.), a central common database where each data is written once, real-time operations, integration with other information systems, best business practices, consistent user interface, strategic planning, automatic functions, etc., [21,22,23,24,25,26,27,28]. Although ERP systems were first mentioned by Gartner in 1990, they remain the most important standard software to support business processes in companies, where technology has changed several times over the decades and the functionalities of these solutions are constantly being added to and expanded [29]. Since ERP systems are standard information systems created according to best practice, companies are expected to take over business processes ERP systems when implemented, which often leads to changes in business processes within the company and, among other things, to a different way of working for users. The successful implementation of ERP systems increases the company’s competitive advantages since research has shown that the effective use of ERP systems can notably decrease the time required to conclude business processes and increase the process of the effective sharing of information in companies [22,23]. On the other hand, ERP system implementations very frequently fail, thus leading to unachieved yet expected benefits [24,25], especially in the stage of use (also called the mature stage) of the ERP lifecycle in the company. In this stage, theoretically, users gain in-depth knowledge of how to utilize the ERP system and therefore adopt the system such that the usage itself is beginning to be a constant, daily activity. Several studies (i.e., [26,27,30,31]) have identified that users’ unwillingness and their negative attitudes to adopt and use the implemented ERP systems may be a common reason for ERP system implementation failures. Our research provides in-depth insights into the importance of the external and internal factors of the business information system that shape and influence the effective mature use of ERP systems in companies.
The empirical study presented in this paper was conducted in an automotive multinational corporation consisting of several subsidiary companies across several countries. In this industry, great emphasis is placed on the use of ERP systems in the entire manufacturing supply chain, especially in terms of reducing costs, speeding up and automating production, and better product quality [28], so the acceptance of ERP systems is very important for the studied corporation. The corporation implemented an SAP ERP solution provided by SAP AG in all subsidiary companies in the past and is now, after many years of use, in its maturity stage; therefore it should be used at the advanced level by their SAP ERP users. While the acceptance of the newly implemented ERP systems in companies is often studiedthe so-called stabilization phase in the five-year period after the introduction of the ERP into the companythere are many fewer studies regarding the maturity stage, referring to the advanced and therefore different usage and acceptance issues. In this paper, we therefore present a large corporation that has been using the ERP long enough to be able to analyze its mature, advanced use, while at the same time being multinational and diverse. Better knowledge regarding the factors that shape user acceptance of the ERP system in the mature stage is needed for successful ERP applications and use [30,32,33,34,35]. For this reason, the main purpose of this research is to enrich the results of PLS-SEM with the advanced data analysis methods of ANN and IPMA, thus creating the basis for evidence-based, grounded business decisions to support the development of the mature use of ERPs in companies.
The structure of the paper is as follows: Section 2, Materials and Methods, introduces the methodological techniques that were implemented in the paper, followed by a brief description of the ERP systems and the theoretical model, TAM, as the basis of our case research. The last two subsections in this section detail the research model and research approach. Results, described in the subsections according to the defined stages of the research design, are given in Section 3. Then, the research model formed, the results obtained, the practical value for evidence-based decision making and some ideas for future research are discussed in Section 4. Section 5 describes the main conclusions.

2. Materials and Methods
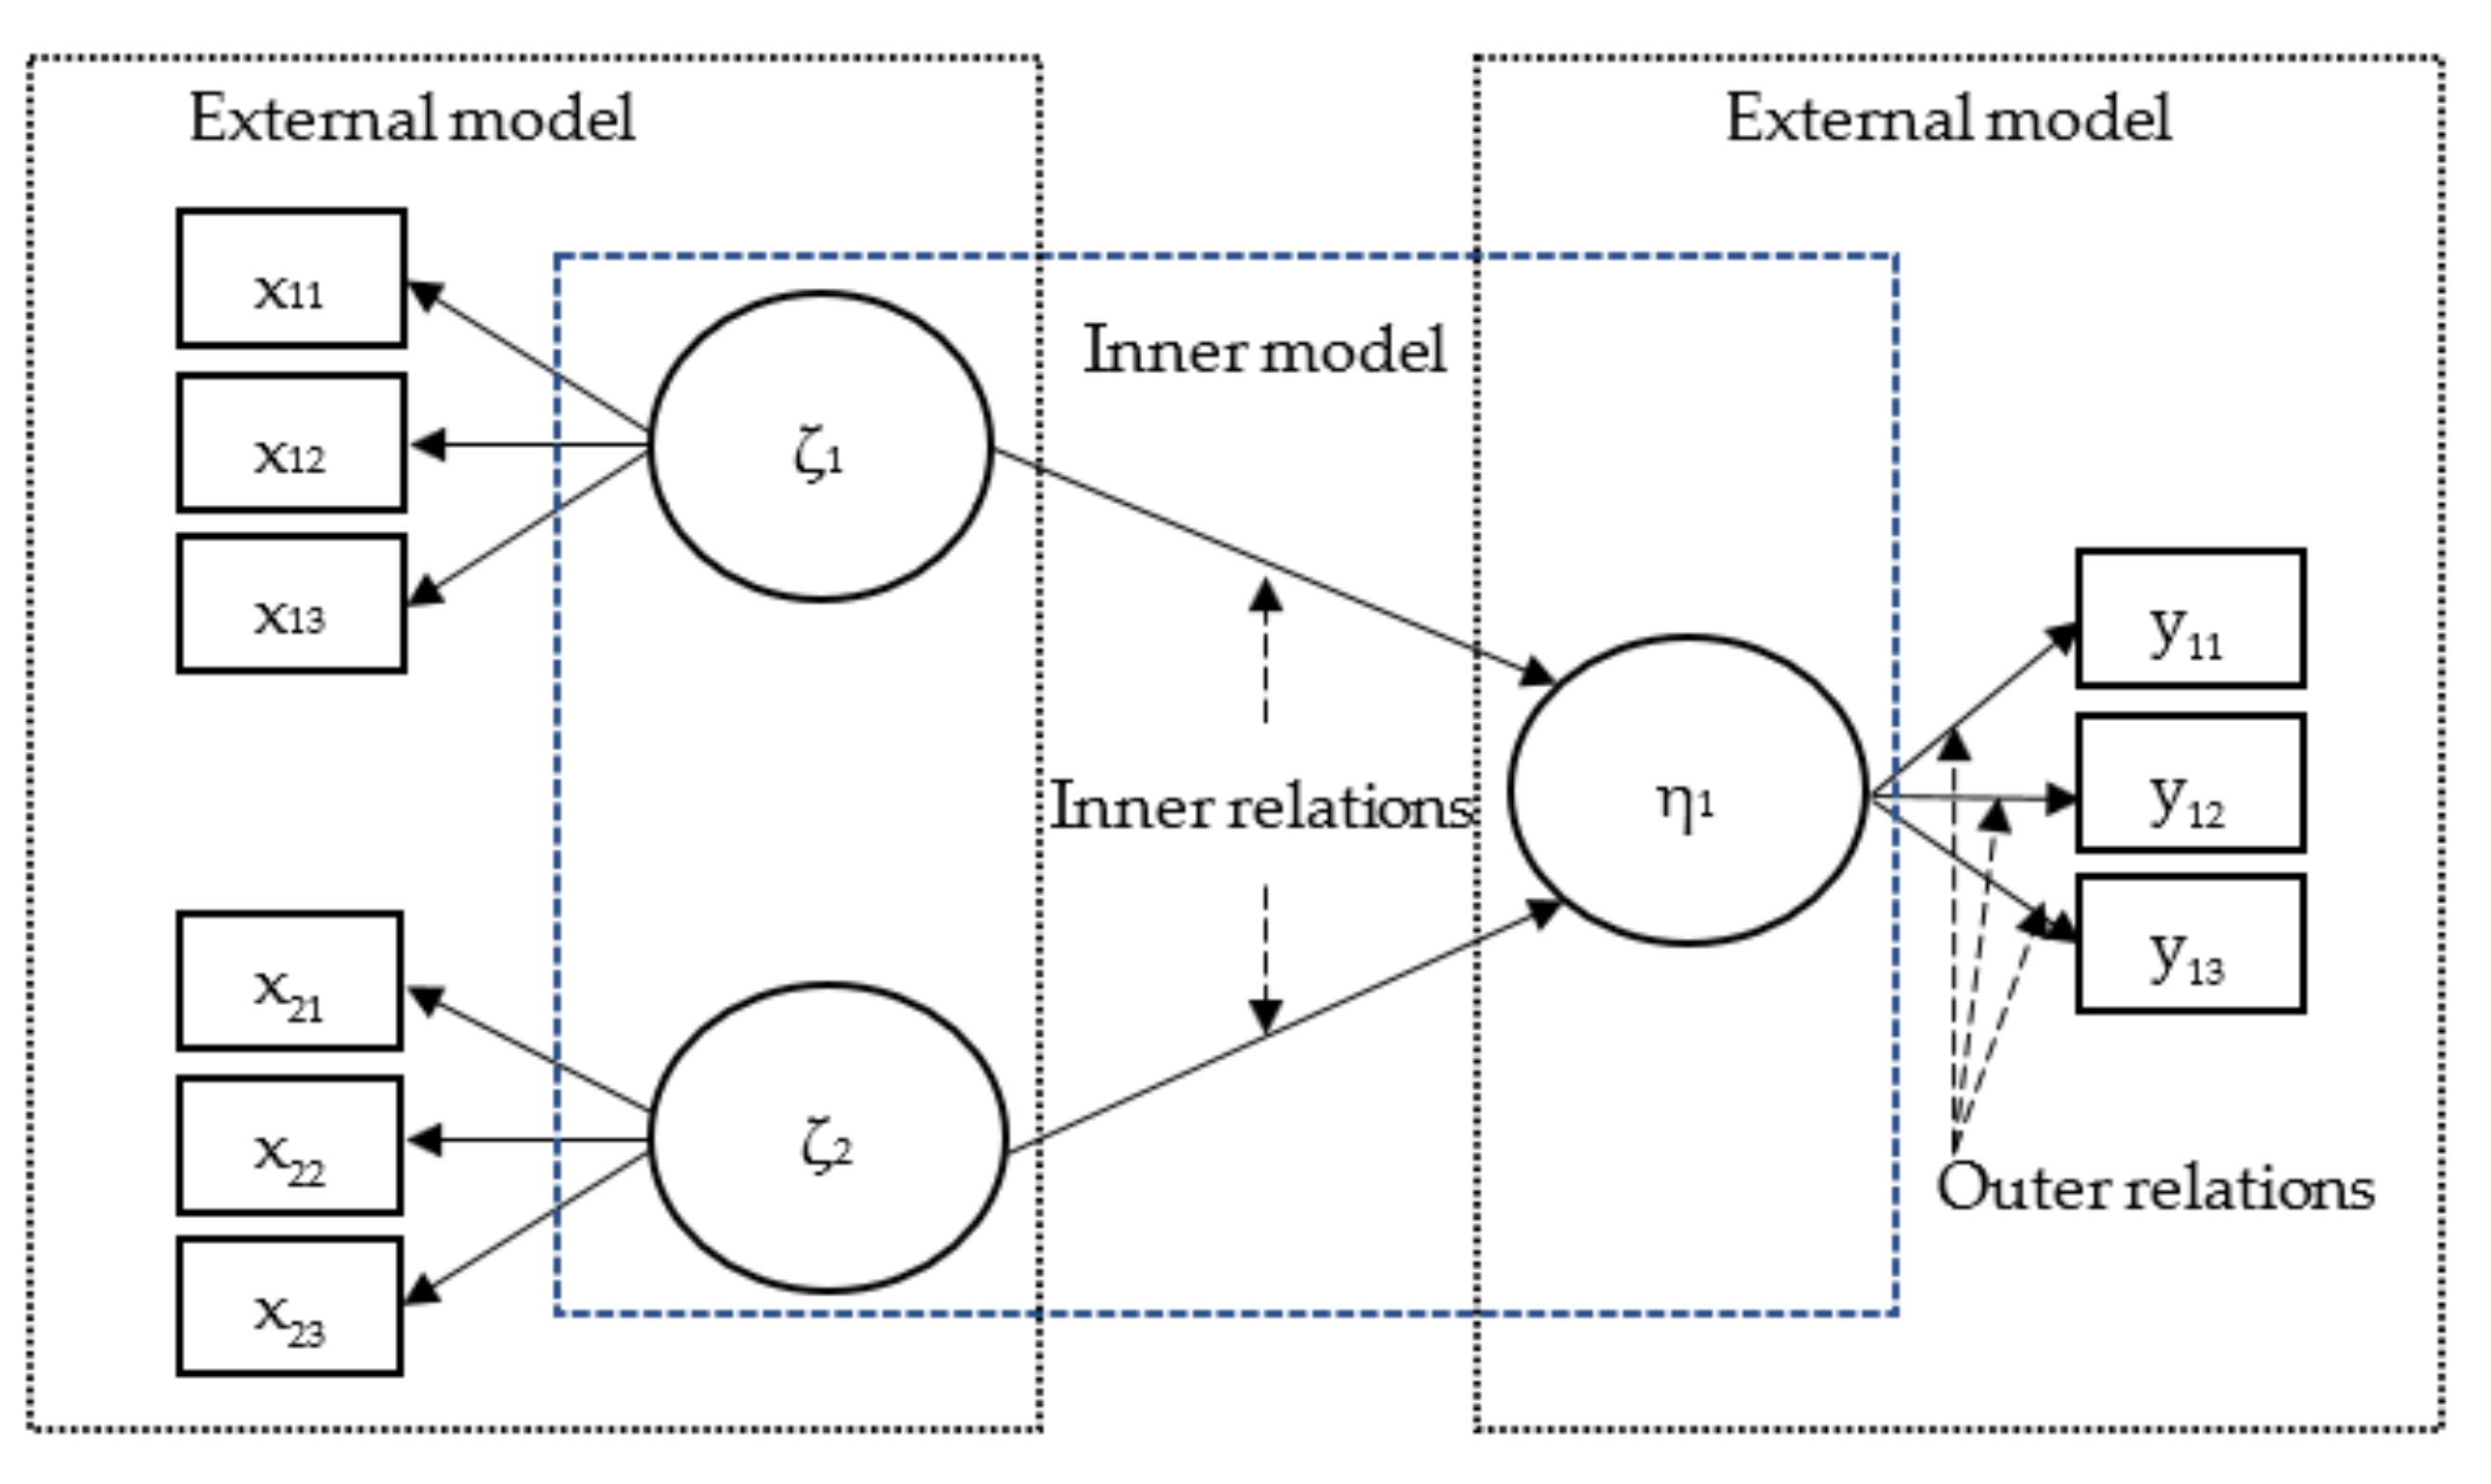
2.1. PLS-SEM

PLS path modeling is an SEM technique based on the analysis of variance. It has become an accepted technique for analyzing path models with at first latent variables (called the measurement model) and then their relationships (the structural model) [36]. It is often used in the fields of the social sciences, especially in economics and business science [37,38,39].
Within SEM, a set of relationships between independent and dependent variables (one or more of both) can be modeled, while variables can be constructs as well as measured variables. The aim of the SEM can be to examine (test) the model, to test determined model hypotheses, to reform the model formed, or to test two or more interrelated models [40]. Covariance-based SEM (such as AMOS, EQS, LISREL) and component-based SEM (such as PLS) are two types of SEM. The SEM allows researchers flexibility in modeling relationships between several endogenous (η) and exogenous (ξ) latent variables or constructs. There are two types of linear relationships: inner and outer relationships [41], as presented through the example in Figure 1.
The internal model (also called the measurement model) determines the relationships between unobserved constructs, whereas the external models (or the structural models) determine the relationships between the construct and its observed or measured indicators [42]. The relationships between measured variables and constructs originate from external relations that can be defined either as reflective or formative ones. Reflective items designate the effects of the investigated construct. Formative items compose the studied construct. The Bentler–Weeks method is used for component-based SEM specifications [40], where each latent or measured variable in the model is either dependent or an independent variable. SEM specification is expressed by the following “set of equations [40], p. 743:
η = + Γξ + ζ
where
  • η vector of dependent constructs (m × 1),
  • ξ vector of independent constructs (k × 1),
  • B is a (m × m) matrix of regression coefficients between dependent variables,
  • Γ is a (m × k) matrix of regression coefficients between dependent and independent variables, and
  • ζ is an error vector (m × 1).
The measurement model is assessed first. The evaluation of reflective measurement models consists of composite reliability (CR) for the assessment of the reliability of each indicator, internal consistency, and average variance extracted (AVE) to assess convergent validity [43]. The internal consistency reliability measure for a specific construct used is Cronbach’s α, where M represents the number of indicators (i = 1, 2, …M) by which the specific construct is measured, and s i 2 is the variance of the i-th indicator for each construct [43]:
Cronbach s   α = M M 1 1 i = 1 M s i 2 s i 2
Due to the limitations of Cronbach’s α (i.e., assumptions that all indicators are equally reliable and as the number of items in the model increases, the Cronbach’s α may increase, even if it does not contribute to greater reliability of the measurement scale), an additional measure of internal consistency reliability was used—a CR measure, defined as [43]:
C R = i = 1 M l i 2 i = 1 M l i 2 + i = 1 M v a r   e i
Here l i constitutes the standardized outer loading of the i-th indicator (i = 1, 2…M) of the specific construct and v a r   ( e i ) constitutes the i-th indicator’s variance of the measurement error. Due to the fact that CR tends to overestimate the internal consistency reliability, we report both criteria.
To assess the convergent validity of constructs, AVE measure was used [40], representing the communality of a specific construct:
A V E = i = 1 M l i 2 M
The Fornell–Larcker criterion, cross-loadings, and HTMT ratio (the heterotrait–monotrait ratio) of correlations may be implemented to assess discriminant validity [37,38,39]. The Fornell–Larcker criterion [44,45] requires the construct to share more variance with its associated indicators than with any other construct. Therefore, AVE should be larger than the squared correlation with any other construct. Garson [38] pointed out that cross-loadings are alternative to AVE and that at a bottom level, each indicator has the highest correlation with its own construct, compared with any other construct. HTMT ratio presents “the geometric mean of the heterotrait–monotrait correlations divided by the average of the monotrait–hetero method correlations”, as defined by Henseler et al. [37] who suggest that HTMT value should not exceed 0.90, while Garson [38] set the threshold at 1.0
The next stage of the research is focused on the structural model analysison hypothesis testing, which consists of the assessment of standardized path coefficients significance and the level of R2 values. Garson [35] pointed out that including predictors in the model be likely to increase R2, although the exposed predictors have only an insignificant level of impact on the dependent variable; therefore, it is necessary to use adjusted R2. Adjusted R2 can be computed by the formula:
A d j u s t e d   R 2 = 1 1 R 2 n 1 n k 1
where R2 is the unadjusted R2, n equals the size of the sample, and k is the number of predictors.
Statistical significance of the path coefficients was calculated implementing the bootstrapping resampling method, where five thousand sub-samples were included [46]. The bootstrap method allows testing the null hypothesis that the standardized path coefficient equals 0 in the population. Using the standard error of the bootstrap obtained distribution, a t test is used to test whether the path coefficient (for example β 1 ) is significantly different from 0, as follows:
t = β 1 s e β 1 *
Here s e β 1 * represents the standard error of the bootstrap derived distribution for β 1 , while β 1 is the path coefficient estimated from the original model and empirical data.
The coefficient of determination (R2), as defined above, describes “the amount of variance of the dependent construct explained by all of the explanatory constructs affecting it. Its values are from 0 to 1. The higher the value better the predictive capacity of the model” [47]. Chin determined that “0.19 is weak, 0.33 is moderate, and 0.67 is substantial explanatory power of the model” [48]. In addition to the R2 values, the size effect f2 is used, which is defined as the change in the coefficient of determination value when an individual independent construct is excluded from the model. Its equation is as follows [49]:
f 2 = R i n c l u d e d 2 R e x c l u d e d 2 1 R i n c l u d e d 2  
Here R i n c l u d e d 2 and R e x c l u d e d 2 are the coefficient of determination values for the dependent variable when an individual independent “construct is included in or excluded from the model” [49].
A mediation effect is generated if certain construct or variable intervenes between two existing constructs. An arrow between the two constructs represents the direct relationship or effect, while indirect effects involve a set of relations where one or more constructs are intervening. Hair et al. [49] pointed out that mediation effects are often present in the models but are often not analyzed. There could be two types of non-mediation in the model: (1) “direct-only non-mediation”, with significant direct effect only and (2) “no-effect non-mediation”, where there is no significant effect and three mediation types: (i) “complementary”, where both direct and indirect effects are significant and pointing in the same direction, (ii) “competitive”, where both effects are significant but pointing to opposite directions, and (iii) “indirect-only mediation”, where only the indirect effect is significant [43,50]. Hair et al. [45] pointed out to the importance of the bootstrapping of the indirect effects’ sampling distribution. They added that bootstrapping needs no assumptions regarding the sampling distribution of the statistics or the form of the variables’ distribution and can be applied to small sample sizes with a higher level of confidence.
The next step includes the blindfolding procedure. Its objective is to assess the model’s predictive accuracy. The blindfolding approach introduced by Wold [51] was implemented that is based on the cross-validation (cv) strategy and includes the calculations of cv-redundancy and cv-communality for constructs and indicators. The index of cv-redundancy index (i.e., Stone-Geisser’s Q2) “measures the quality of the structural model, where the cv-communality (H2) measures the quality of the measurement model” [38]. H2 uses only the measurement model. It measures the capacity of the path model to predict the manifest variables directly from their own latent variable by cv. The mean values of the Q2 that refer to the dependent constructs are used to assess the overall quality of the structural model if they are positive for all dependent constructs’ subparts. An H2 and Q2 value that is greater than 0 indicates the relevance and predicting power of the structural models and measurements [38].

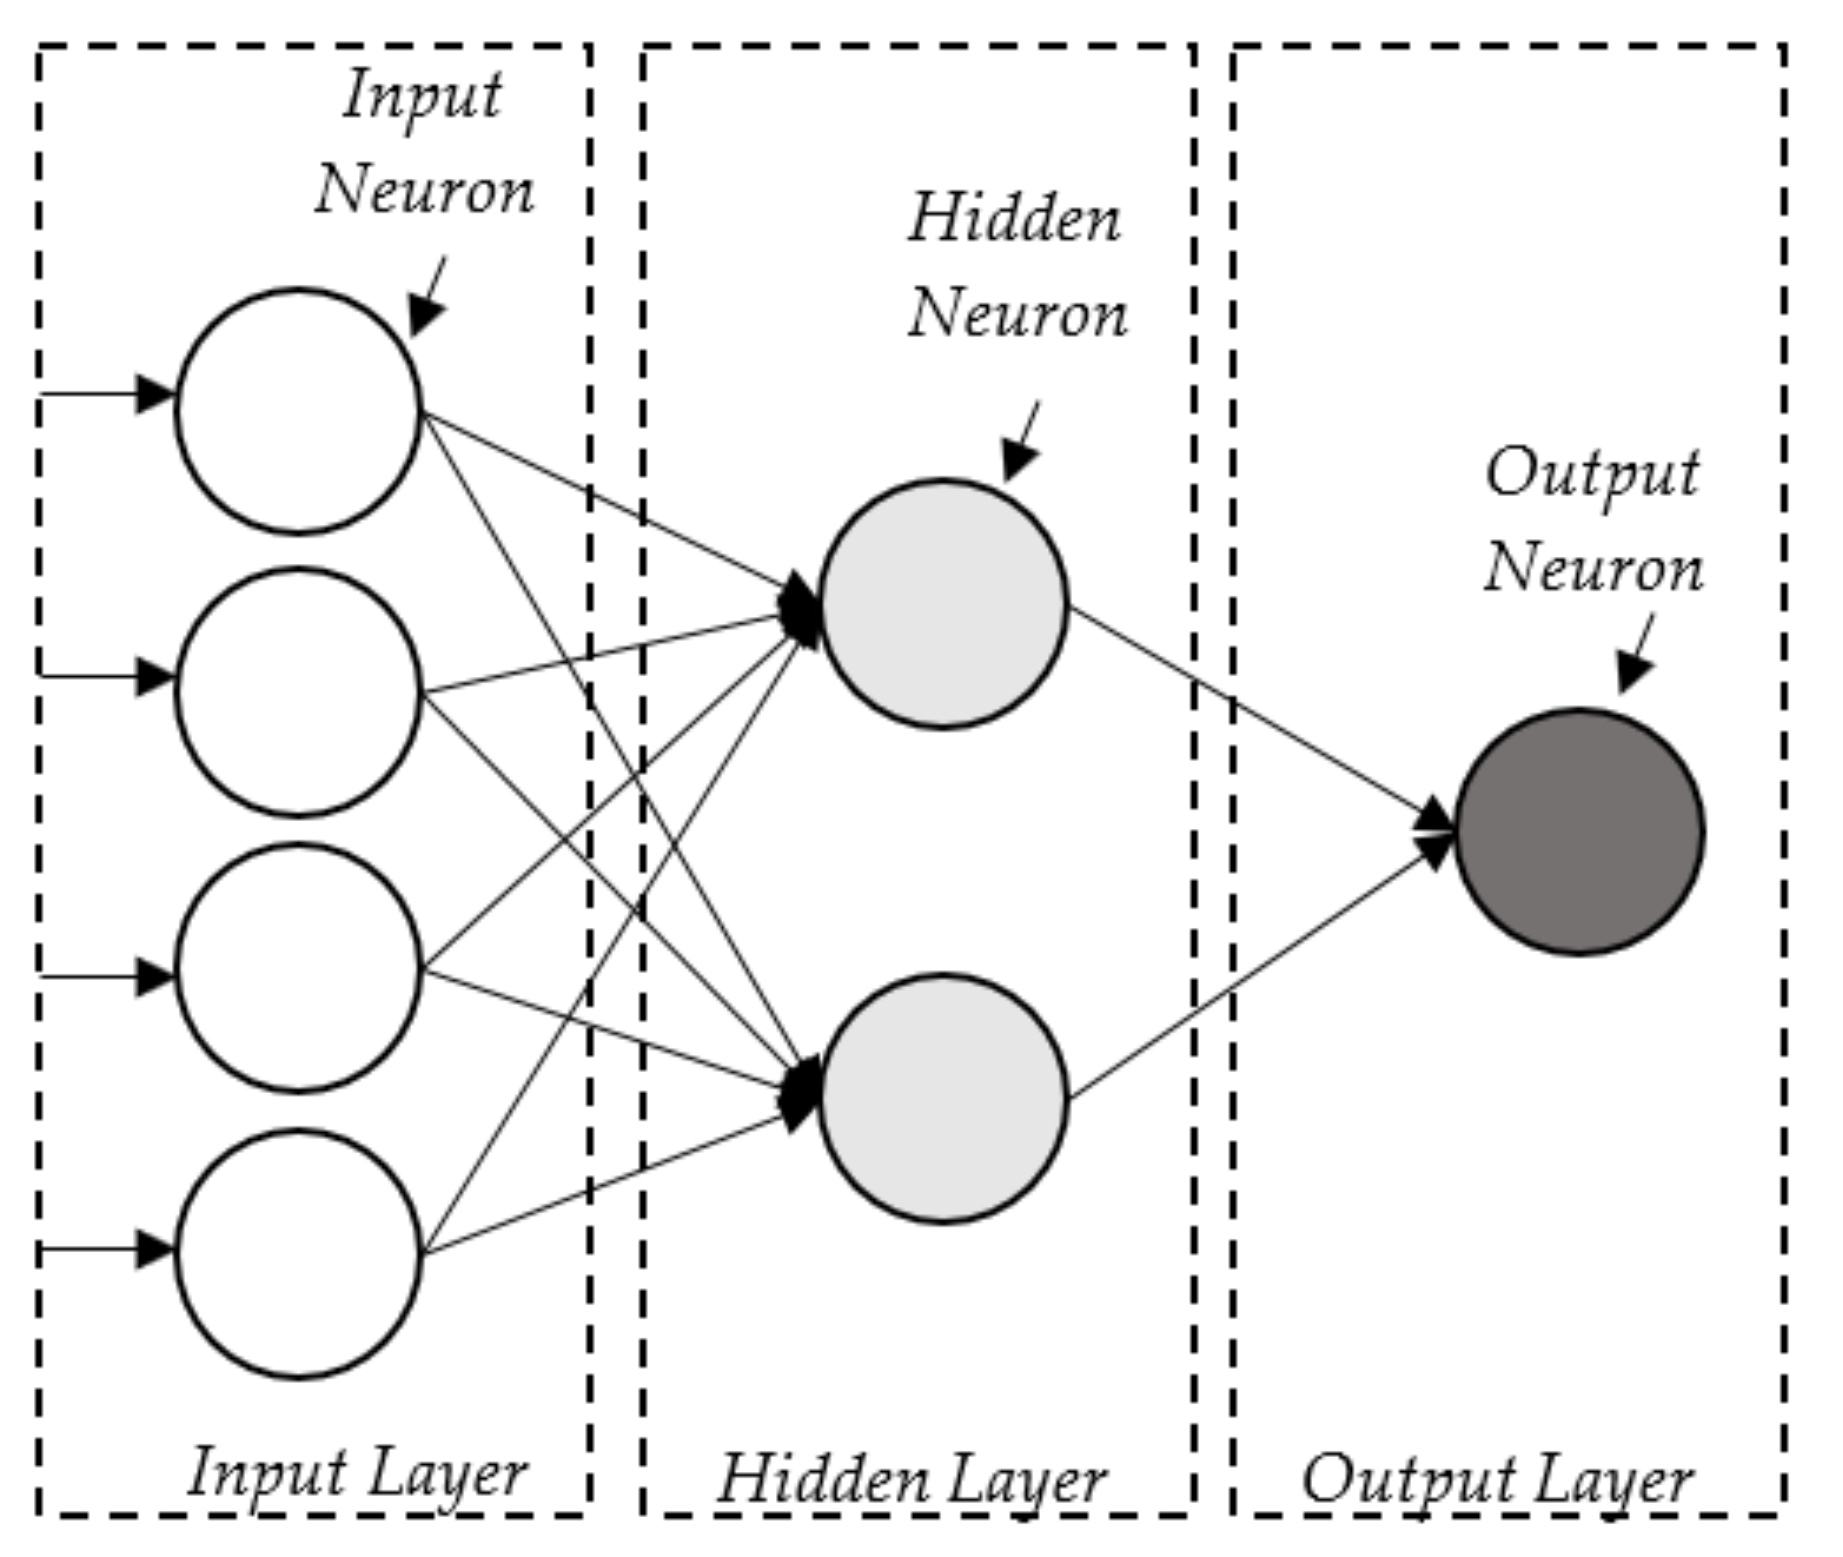
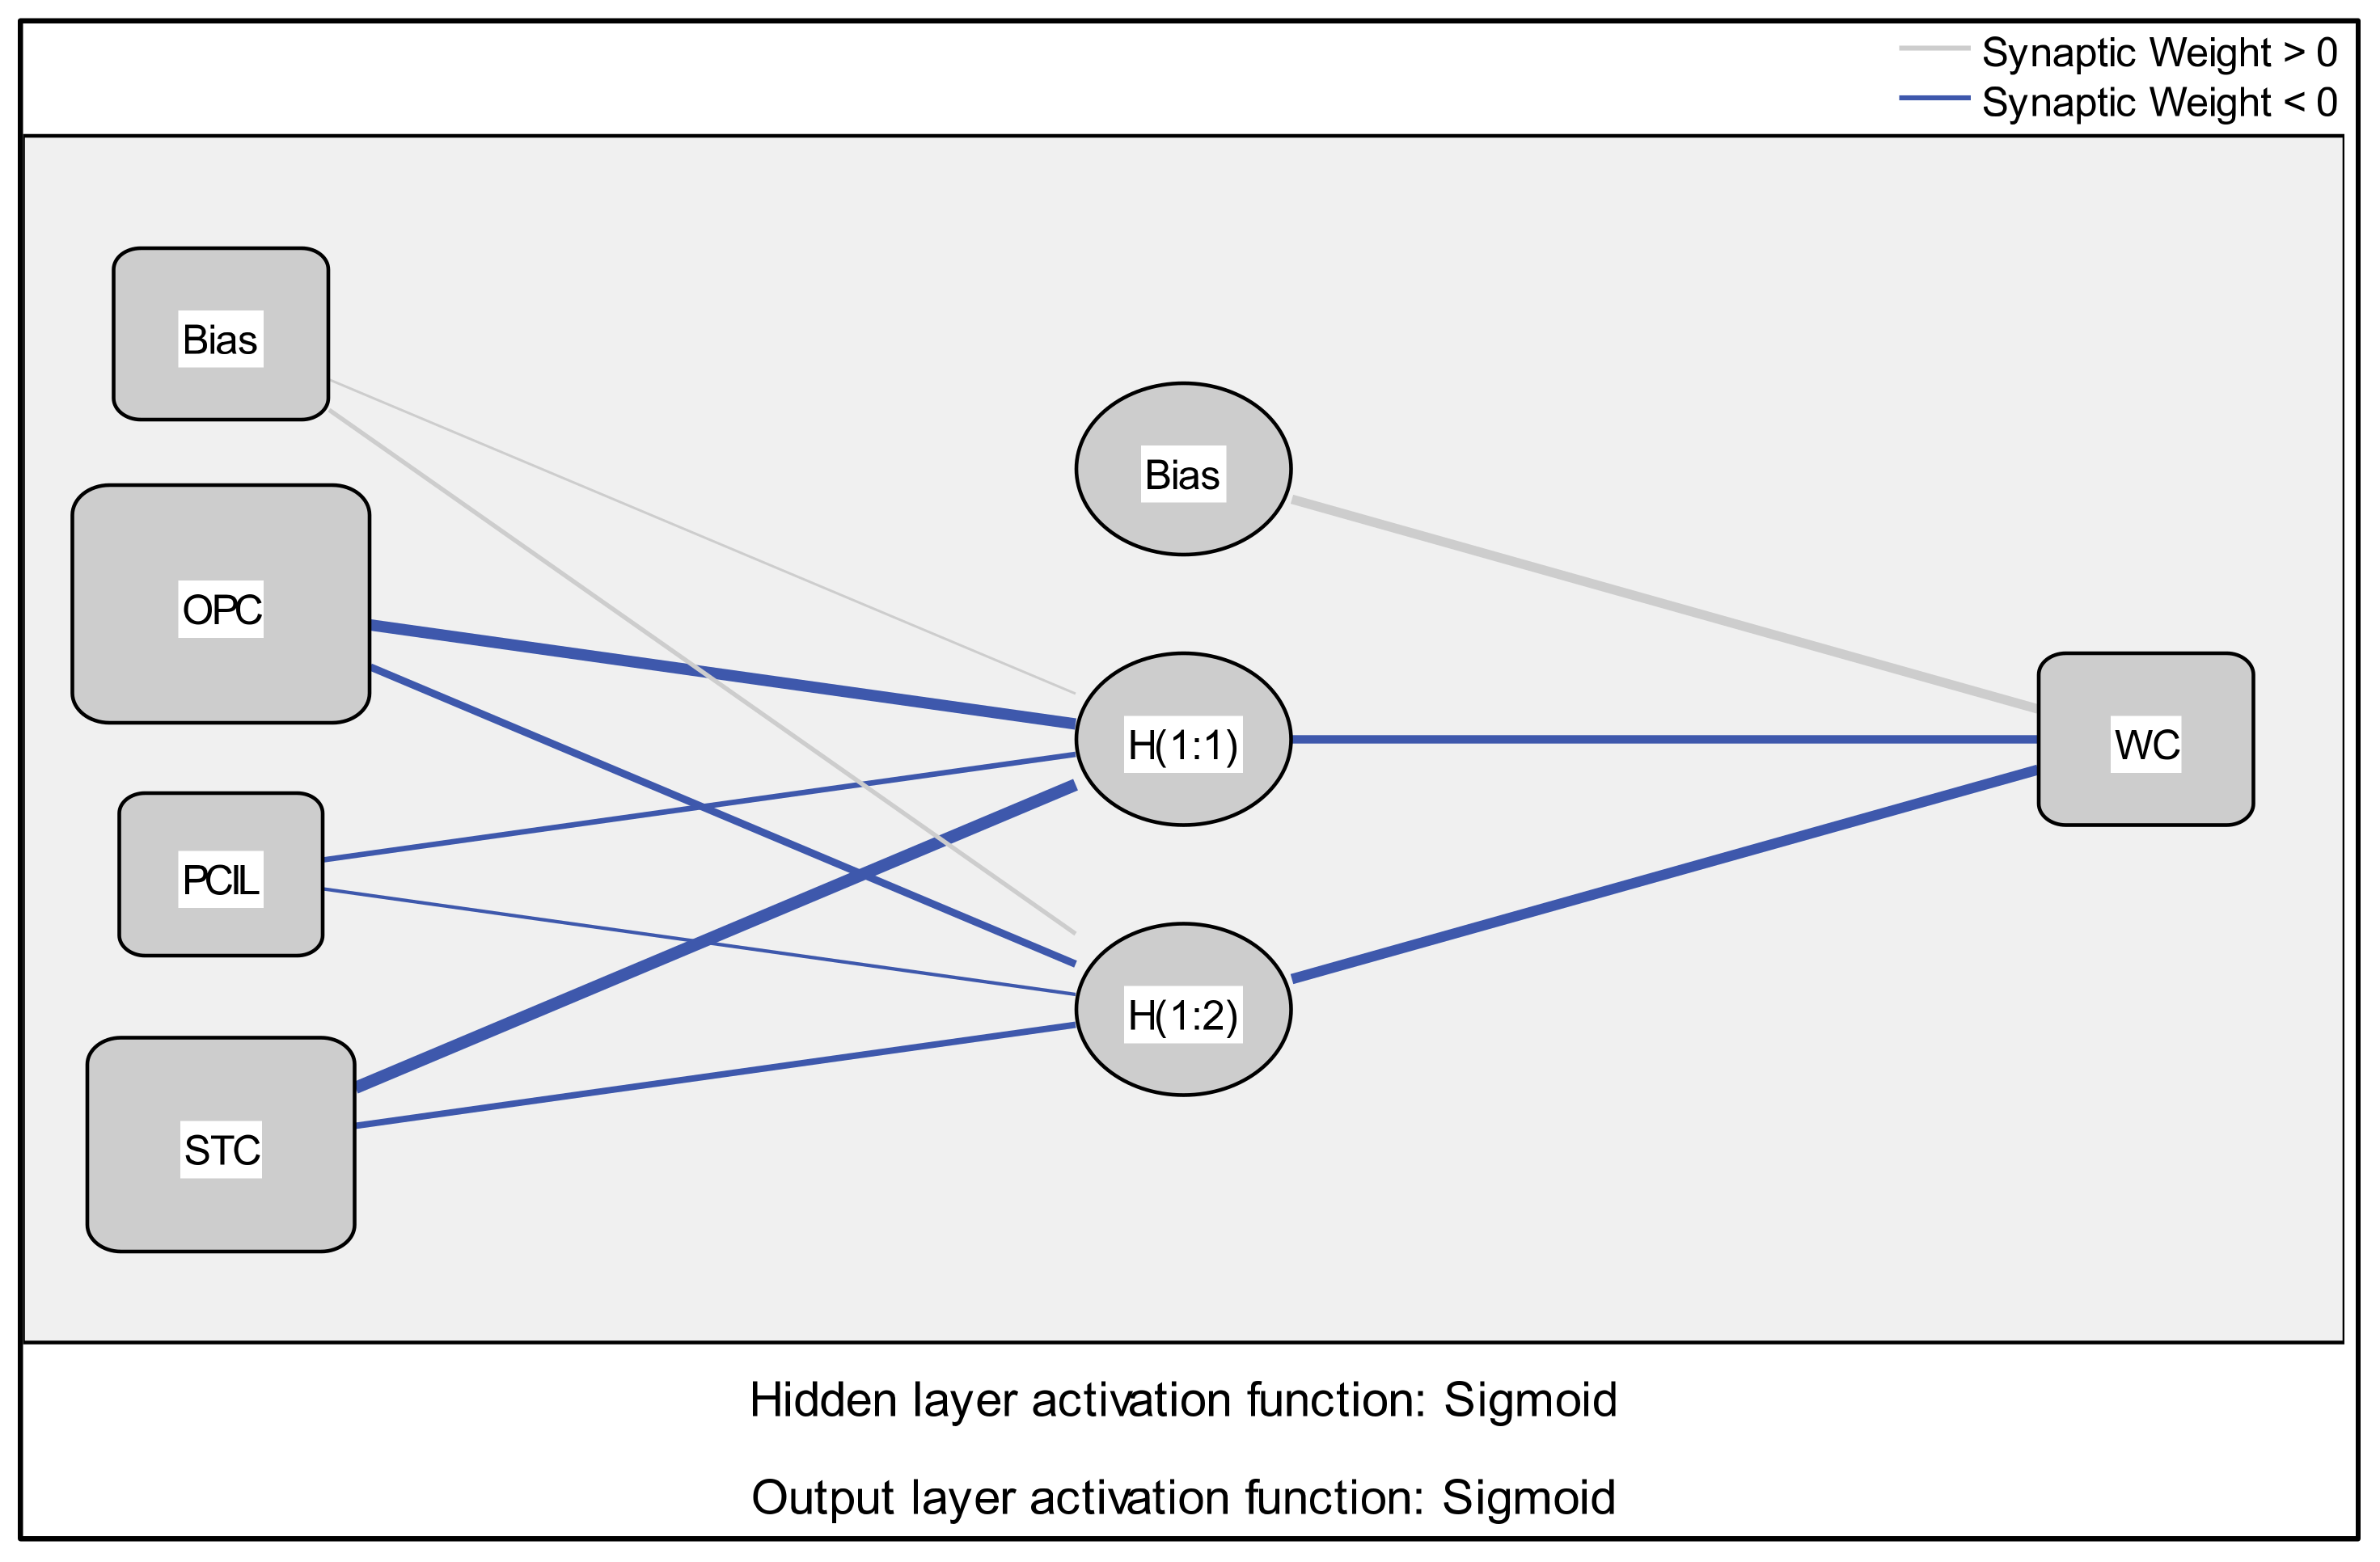
2.2. Artificial Neural Network Analysis (ANN)
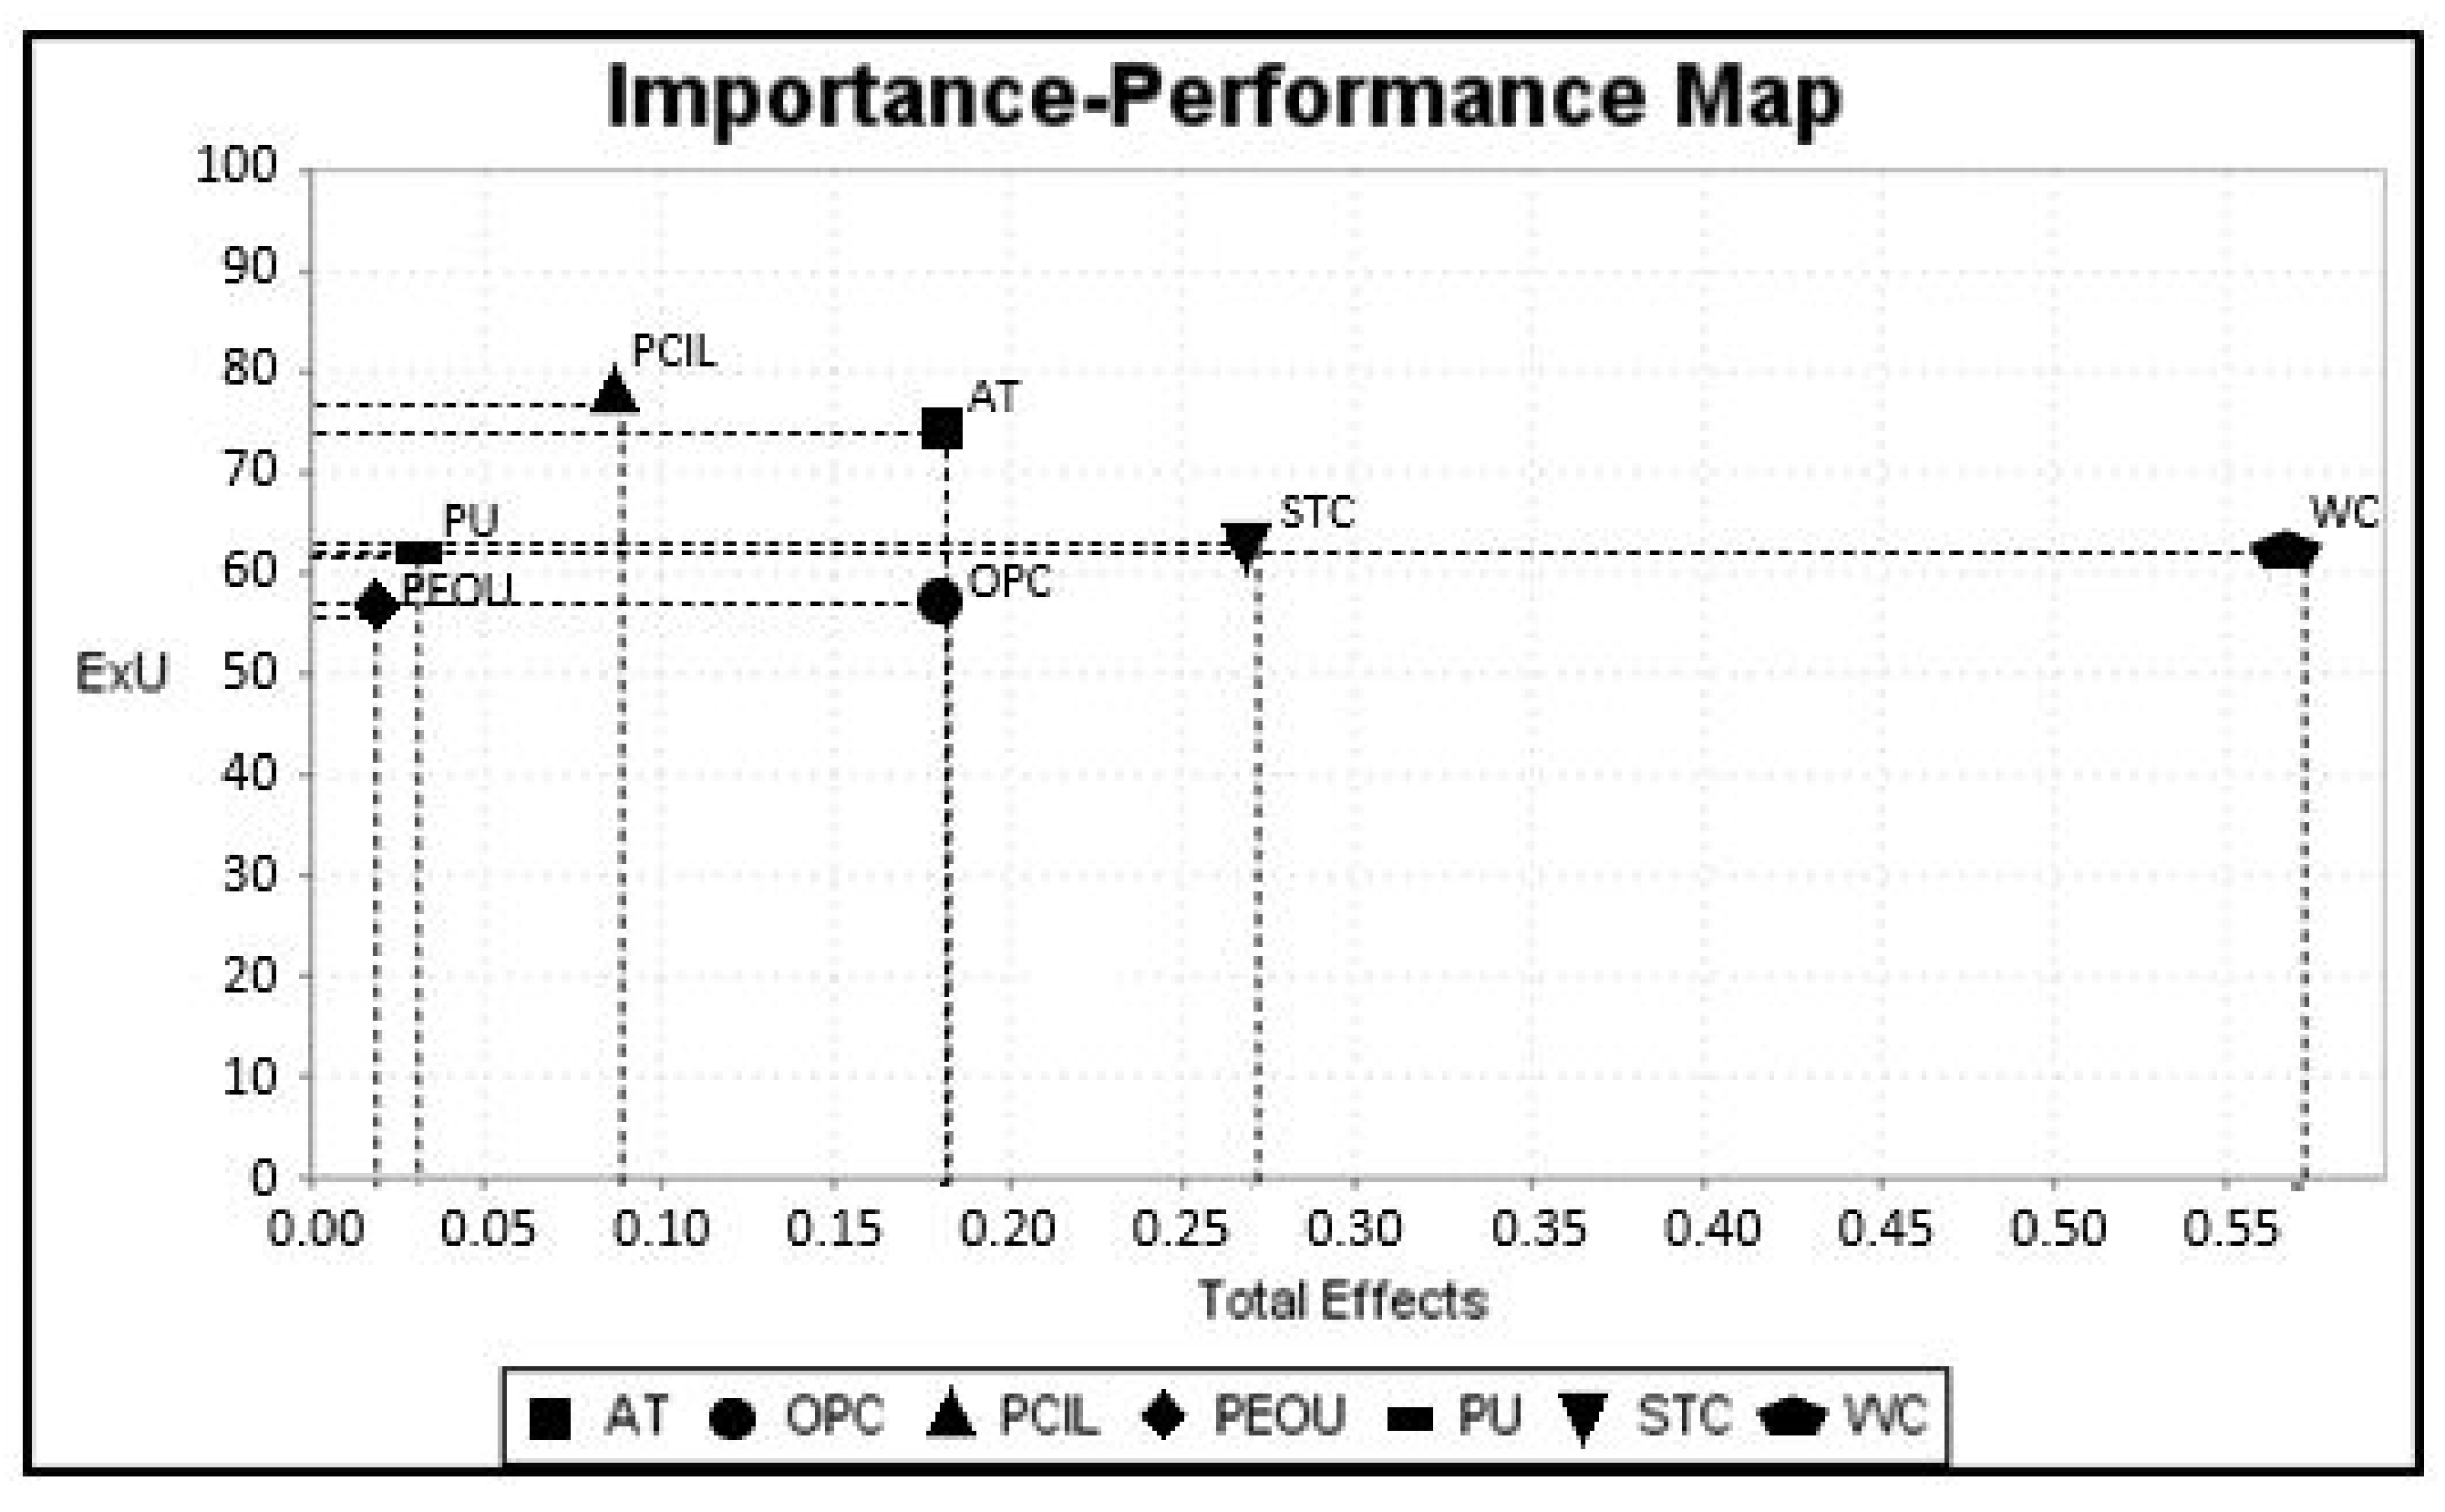
PLS-SEM, as well as the other well-known conventional statistical techniques, work exceptionally well when the relationships among variables are linear. As a linear technique, it cannot consider any non-linear effects in the research model, which in some cases could lead to over-simplification and inaccurate results [52]. In order to overcome this potential drawback, ANN models are introduced. ANN is “a massively parallel distributed processor made up of simple processing units, which have a neural propensity for storing experimental knowledge and making it available for use” [53] and it is analogous to the human brain as it learns and stores data through iterative learning process. Artificial neural networks are complex models, classified as artificial intelligence/machine learning techniques, which easily model non-linear relationships [54,55]. In addition, ANN models are also more accurate as compared to the linear models [56] and also more robust and flexible [13,19]. Unfortunately, the ANN approach, due to “black-box” operating nature of ANN models, cannot be used to test of causal relationship among variables [57,58]. Therefore, a hybrid, two-step approach is suggested [16,59]: Firstly, PLS-SEM is used to test hypotheses, i.e., to establish statistically significant predictors of dependent constructs, and, secondly, only significant predictors are utilized as constructs in ANN models. A broad review of the studies combining SEM and ANN in technology acceptance studies can be found in Kalinic, et al. [60].
Though numerous different types of ANNs exists [60], in this research, feedforward back-propagation multilayer perceptron (MLP) is used as one of the most common and most popular ones [61,62]. An input layer and one or more hidden layers along with an output layer form typical MLP ANN model, while each layer consists of one or more neurons, as presented in Figure 2.
The number of significant predictors in the model determines the number of neurons in the input layer (i.e., input neurons); while the number of neurons in the output layer (i.e., output neurons) equates the number dependent constructs (outputs) [54,63]. The number of neurons in hidden layer(s) (i.e., hidden neurons) generally depend on the neural network architecture (the numbers of hidden layers, model inputs and outputs), activation functions, sample size, etc., [64] and often is selected using trial-and-error or by simulation software [65].
Input neurons simply accept input signals and forward them to the neurons in the hidden layer. A single neuron is a simple computing unit. First, the weighted sum of all inputs to the neuron is calculated. For example, this sum for the i-th hidden neuron would be:
s i = j = 1 n w i , j x j + b i
where x j is the value of j-th input signal, n equals the number of inputs, w i , j is synaptic weight connecting j-th input with i-th hidden neuron, and b i is a bias (or a threshold) of i-th hidden neuron. The initial values of synaptic weights and biases are set randomly, between 0 and 1, and final values are determined through iterative training process which minimizes cost function, via the backpropagation of error. The output of the hidden neuron is finally calculated by feeding a previously calculated weighted sum through the activation function, which brings nonlinearity to the ANN model. There are different examples of triggering functions (e.g., Rectified Linear Unit—ReLU, hyperbolic tangent), but the most frequently used in the behavioral studies is Sigmoid [60]. Here, the output of the activation function, i.e., the output of i-th hidden neuron— h i is calculated as:
h i = σ s i = 1 1 + e s i = 1 1 + e j = 1 n w i , j x j + b i
where s i is previously calculated weighted sum of inputs. Although complex ANN models (deep learning) consist of several hidden layers, even ANNs with just the single one can model any continuous function [55] and recent study shows that the most of technology acceptance studies used ANN models with just one hidden layer [60].
The k-th neuron in the output layer (in a more general case, with more than one output) calculates the output y k of the ANN model in the same way as hidden neurons: as a weighted sum of its inputs (which are the outputs of the hidden neurons), fed through the nonlinear activation function, e.g., sigmoid:
y k = σ s h k = 1 1 + e s h k = 1 1 + e l = 1 m v k , l h l + c k
where h l is the output of l-th hidden neuron, m is the number of hidden neurons, v k , l is synaptic weight connecting l-th hidden neuron with k-th output, and c k is a bias of k-th output neuron.

2.3. IPMA

Standard PLS-SEM studies support details on the relative significance of constructs in the structural model and explains relationships among them. As an alternative to analyzing the importance dimension (i.e., the path coefficients), IPMA examines the performance dimension. IPMA involves five steps [20]. The first step demands checking the fulfilment of the eligibility requirements for performing the analysis. The second step represents the computation of the performance values of the latent variables. To make it possible to interpret the performance levels and to compare them, IPMA rescales indicator scores between 0 and 100 (0—the lowest, 100—the highest). The rescaling of j-th observation for indicator i (i = 1, 2, …, M) proceeds via:
x i j r e s c a l e d = E x i j min x i max x i min x i × 100
In Equation (11) xi is the i-th indicator, min(xi) and max(xi) constitute its minimum and maximum value respectively, while E(xij) constitutes its actual score for respondent j. The rescaled construct is the linear combination of both the rescaled indicator’s data and the outer weights. The rescaled weights are calculated on the basis of the standardized outer weights of the PLS path model estimation after being unstandardized. The third step involves analysis of the constructs’ importance values (i.e., the meaning of construct) that are derived from the total effect (the total sum of all the indirect effects and the direct effects in the structural model [43]). In the fourth step, the creation of the importance–performance map for a chosen construct originates from these previous results using scatter plotting. In the fifth step, IPMA may be expanded on the indicator level to gain accurate data on the highly likely successful managerial measures [20]. IPMA, therefore, extends the results of the standard PLS-SEM method [46].

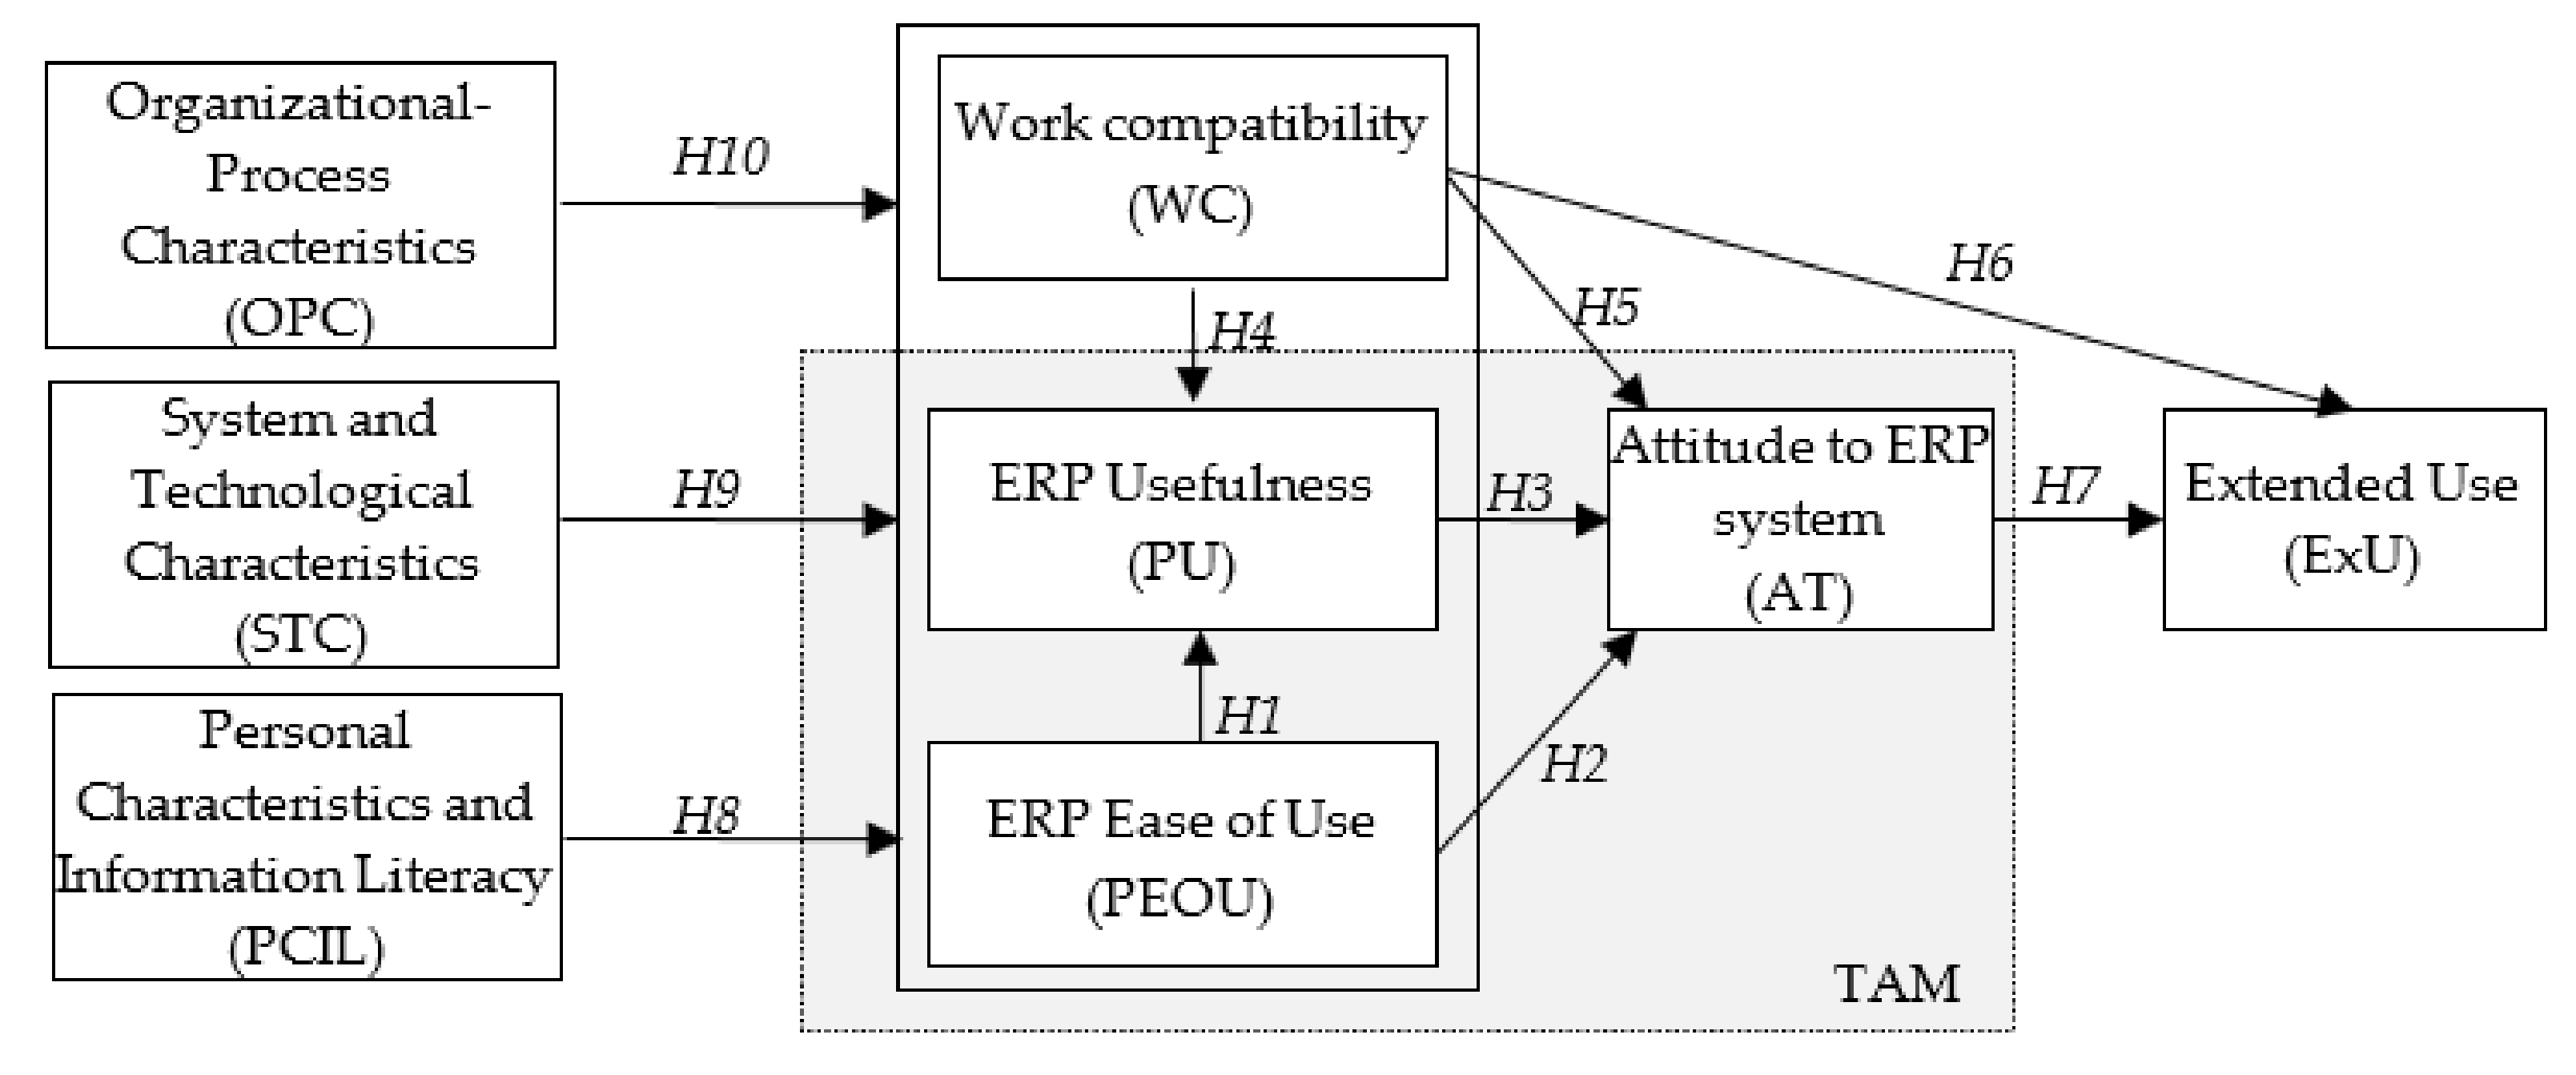
2.4. ERP Systems and the Technology Acceptance Model

Organizations are implementing ERP systems to increase productivity as well as turn out to be more responsive. As several studies have revealed, one reason for ERP systems implementation disasters can be recognized as employees’ unwillingness to accept and use an implemented ERP system [25,66,67,68,69]. Huang and Yasuda [67], in their wide-ranging study of 86 surveyed scientific papers on ERP subjects, indicated that many scientific papers deal with the pre-implementation phase combined with the implementation phase of ERP implementation, but postimplementation studies are seldom. Schlichter and Kraemmergaard [69], in their wide-ranging study of 885 peer-assessed abstracts of journals, also showed a study about the optimization of ERP systems which indicated that post-implementation, usefulness, the accomplishment of competitive benefit through ERP systems, ERP systems employees, and the financial benefits of ERP systems should all be assessed. Several other researchers also indicated the issue of the low utilization of ERP systems, i.e., employees do not take advantage of the implemented ERP system at a higher stage [21,25,32,66,68,70,71,72]. Therefore, researchers have focused their research attempts on the acceptance of ERP systems by employees in companies to study circumstances that lead to the use of EPR systems at an advanced level.
Several theoretical models are known for researching the acceptance and use of information systems and information technology (IS/IT) in general. The most often used theoretical theories and models are the “theory of planned behavior” [73], the “theory of reasoned action” [74], the “technology acceptance model (TAM)” [75,76], the “innovation diffusion theory” [77], the “technology–organization–environment model” [78], the “unified theory of acceptance and use of technology” [79,80], etc. (see [27,81]). Among them, the TAM proved to be very promising for researching different viewpoints of ERP systems acceptance and the use by of these systems by users (employees) in companies [22,27,32,33,34,35,64,82,83,84]. The TAM, defined and verified by Davies, is well established and tested in numerous studies (for the latest research, see [27]). Therefore, TAM was used as a research model in several research studies conducted in the past 10 years. Among others, the most important research studies were conducted by Costa et al. [32], Scholtz et al. [71], Calisir et al. [72], Mayeh et al. [83], Shih and Huang [85], Youngberg et al. [86], Erasmus et al. [87], Klaus and Changchit [88], Putri et al. [89], Grandón et al. [90], Koksalmis and Damar [91], etc. These researchers have, in their research studies, experimented with the TAM model by developing TAM model extensions and modifications.
The structure of the TAM is as follows: construct perceived usefulness (PU) and construct perceived ease of use (PEOU) represent the most relevant beliefs for systems and technology (the ERPs) acceptance by users [75]. The construct PU is defined as ‘the degree to which a person believes that using a particular system would enhance his or her job performance’ [75], p. 320. In contrast, the construct PEOU refers to ‘the degree to which a person believes that using a particular system would be free of an effort’ [75], p. 320. According to TAM, construct PU and construct PEOU have a positive effect on the construct user’s attitude (AT) regarding using a system or technology, which further affects the construct user’s behavioral intention (BI) to use it. The stronger the intentions to use the system or technology, the higher the level of actual use (U). TAM also includes the expected impact of the construct PEOU on the construct PU [76].
Lately, when researching ERP acceptance, models have been developed that expand the described TAM with various external constructs, especially with constructs considered as antecedents of construct PEOU and construct PU, such as Venkatesh and Davis’s TAM 2 [92], the model of the determinants of construct PEOU by Venkatesh [93], and TAM 3 developed by Venkatesh and Bala [94]. The research model, presented in this paper, was extended with the external constructs, that proved important by Sternad et al. [33,34,35]: organizational process characteristics (OPC), system and technological characteristics (STC) and personal characteristics with the information literacy (PCIL). These are affecting the construct PU and the construct PEOU.
An additional external construct, namely perceived work compatibility (WC), was included in our research model, seen as the employees’ perception of fit between the ERP system used and employees’ motivation to use it, regardless of the confirmed suitability [82] and refers to the level to which the ERP system enables the employees to perform their working duties using the implemented ERP system. Additionally, the TAM research model in our case was redesigned by replacing the constructs BI and U with extended use (ExU), since our research case focuses on factors affecting the present-day use of ERP systems in the maturity phase. The construct ExU was initially proposed by Hsieh and Wang [95] in their studies. ExU is defined as the usage which exceeds the average, normal use and can guide to a higher quality of the results and benefits [95]. ExU, therefore, refers to the complexity and in-depth use and frequency of using different ERP functionalities [27,30,31,34,35,41,64,77,78,79,80,81,83,92,93,94,96,97,98].
The relationships associated with these additional constructs (WC and EXU) are as follows: construct WC influences construct PU [82,96]; that is, with the increased perceived fit of the ERP system to the job needs the perceived usefulness increases, as well. A well-founded assumption may also be set regarding the direct impact of the construct WC on the construct AT and on the construct ExU. Suppose ERP users perceive that the system increases compatibility with their everyday duties. In that case, they gain an expanded positive posture toward using that system, including its extended use [26,34,35,76]. The research model is further defined in the next section and presented in Figure 3.

2.5. Research Model

The research model of our research case is based on TAM, as described in the previous section, and is presented in Figure 3 below. The external factors grouped in personal (PCIL), organizational (OPC), and technological (STC) groups of factors are expected to affect the construct PU and construct PEOU of ERP systems, along with the construct WC. In Figure 3, Davis’s initial TAM research model [75,76] is marked in grey. As already mentioned, construct PEOU has an impact on the construct PU, while both influence construct AT and that further has an impact on the construct ExU by employees.
Regarding the use of ERP systems by its users, we can assume, as already mentioned, that a relation among construct WC and construct PU exists, as well as the direct impact of the construct WC on construct AT and on the construct ExU.
Figure 3. Conceptual Model [30,31,32,65]; extended by the authors.
Mathematics 10 01379 g003
Hypotheses that reflect the dependencies and directions of relationships are based on the TAM model and its extensions [22,27,32,33,34,35,64,72,82,83,84]. Therefore, we hypothesized:
H1. 
PEOU of ERP use has direct positive impact on PU of ERP use.
H2. 
PEOU of ERP use has direct positive impact on AT towards ERP use.
H3. 
PU of ERP use has direct positive impact on AT towards ERP use.
H4. 
WC with ERP users’ job description tasks has a direct positive effect on their PU of ERP use.
H5. 
WC with ERP users’ job description tasks has a direct positive effect on AT towards ERP use.
H6. 
WC with ERP users’ job description tasks has a direct positive effect on the ExU.
H7. 
AT towards ERP use has a direct positive effect on the ExU.
The issue of the TAM research model-based studies that are focused on ERP systems is that many of them include a very modest range of external factors influencing user acceptance and use of these systems [33,34]. When ERP systems are used in companies, a larger number of external factors may be important for shaping ERP user acceptance. Consequently, for higher-order factors, it may be important to group several external factors together. In our research, the factors of the second order were formed when hypothesizing the following:
H8. 
A conceptual external factor of personal characteristics and information literacy (PCIL) statistically significantly influences the antecedents of AT and ExU.
H8a. 
A conceptual external factor PCIL statistically significantly influences the WC.
H8b. 
A conceptual external factor PCIL statistically significantly influences the PU.
H8c. 
A conceptual external factor PCIL statistically significantly influences the PEOU.
H9. 
A conceptual factor of the system and technological characteristics (STC) statistically significantly influences the antecedents of AT and ExU.
H9a. 
A conceptual external factor STC statistically significantly influences the WC.
H9b. 
A conceptual external factor STC statisticalčy significantly influences the PU.
H9c. 
A conceptual external factor STC statistically significantly influences the PEOU.
H10. 
A conceptual factor of organizational-process characteristics (OPC) statistically significantly influences the antecedents of AT and ExU.
H10a. 
A conceptual external factor OPC statistically significantly influences the WC.
H10b. 
A conceptual external factor OPC statistically significantly influences the PU.
H10c. 
A conceptual external factor OPC statistically significantly influences the PEOU.

2.6. Research Approach

For our research study, we chose an international corporation that consisted of several subsidiaries which operated in the automotive industry in four countries. Researching ERP systems and their acceptance in the automotive industry is the topic of several researchers. Published research, in the majority of cases, applies TAM as a research model for different aspects of technologies and information systems, including researching ERP acceptance [99,100,101,102,103,104]. Therefore, we used TAM as basic research model to study the international corporation, which consisted of companies which are suppliers producing car components/parts for major car producers worldwide. Because the study aimed to research ERP use in its mature stage when ERP is used at an advanced level and because we wanted to research its use in different organizational cultures, we selected these companies. They implemented SAP ERP systems 19 years ago and conducted several upgrades to the systems used. The companies involved are in four countries and employ more than 4000 employees. We addressed a random sample of users in these companies, consisting of 860 employees who have been using the ERP system for several years and can be considered advanced users. We sent them e-mails with invitations and a link to the web questionnaire.
The questionnaire was prepared in four languages (Slovenian, Serbian, Croatian, and the Bosnian and Herzegovinian language) according to the international character of the of companies studied. Before starting a survey, a pilot study took place, which included a group of ERP advanced users and a group of key users from different companies. Based on their feedback, a few minor changes were made to make the questions more understandable to respondents in different countries. The elements with the missing data were excluded, resulting in 208 valid questionnaires that were further analyzed (24.19%).
The empirical data were analyzed in the five stages of the methodological approach involving the PLS-SEM by using SmartPLS 3 [46] and the ANN analysis by using IBM SPSS 20, as follows:
  • The measurement model is assessed in the first step;
  • The structural model is assessed in the second step;
  • The third step includes the blindfolding procedure;
  • The fourth step includes use of ANN analysis;
  • The fifth part of our research includes IPMA.
While analyzing data, the approaches defined by Henseler et al. [37] and Garson [38] and Hair et al. [43,45] were implemented.

3. Results

3.1. Description of the Sample

Table 1 displays the sample structure details. Among respondents, 27.4% (57) were female and 72.6% (151) were male, and all were employees and users of the implemented ERP system. The majority, over 65%, reported to have at least some higher education; others reported secondary educational levels or less. Sample characteristics are in Table 2.
Collected data show that respondents use the ERP system for about three hours daily. 59.1% (123) are employed in positions at the operational level (e.g., professional experts and other similar positions), 29.3% (61) are managers at the low level (e.g., manager of a group or manager of anorganizational unit), 20.6% (22) are managers at the middle level, and 1% (2) are managers at the corporate governance and/or top management level. The total working experience equals, on average, 16.1 years, while the average working time at the current position equals 8.1 years.

3.2. The Assessment of the Measurement Model

The measurement model constructs were valued via assessment of reliability, then via convergent as well as discriminant validity. Second-order external factors (implementing the repeated indicators technique—the hierarchical component model proposed by Wold [51]) were formed. Some external first-order factors did not meet the evaluation requirements—therefore, the following four factors were excluded from further analysis: the factor computer self-efficacy and the factor experience with computers were excluded from the PCIL second-order factors, and the factor ERP training and the factor organizational culture were excluded from the OPC second-order factors. Results of reliability and convergent validity for constructs are presented in Table 3. Results of discriminant validity are presented in Table 4 and hypotheses testing results are in Table 5. Table 6 brings the results of second-order factors. All results are discussed as follows.
Cronbach’s α and CR measures were calculated [37,38,45]. As shown in Table 3, for each of the 14 scales used in the study Cronbach’s α and CR were higher than threshold, which is 0.7, thus confirming their reliability [37,38,45].
Table 3. Psychometric properties of the research instrument (sample size = 208).
ConstructIndiatorMean|SDLoadingsCRαAVER2|Adj. R2
PCIL: Personal InnovativenessPI15.28|1.430.730.820.820.61
PI24.54|1.710.79
PI35.33|1.540.82
PCIL: Computer AnxietyCA16.32|1.060.850.800.790.66
CA26.46|1.050.77
STC: ERP Data QualityDQ14.60|1.390.770.920.920.66
DQ24.65|1.500.80
DQ34.04|1.620.80
DQ44.52|1.570.82
DQ54.23|1.660.82
DQ64.64|1.620.85
STC: System PerformanceSP14.64|1.620.890.880.880.60
SP25.18|1.350.71
SP35.03|1.350.79
SP44.70|1.400.71
SP54.97|1.400.85
STC: User Manuals (Help)UM14.38|1.550.930.880.880.71
UM24.56|1.350.80
UM34.31|1.400.79
STC: System FunctionalitySF13.64|1.570.910.910.910.83
SF23.60|1.660.92
OPC: Business Processes FitBPF14.86|1.450.930.930.930.87
BPF24.88|1.410.93
OPC: ERP SupportSU14.61|1.610.690.710.710.55
SU24.29|1.510.80
OPC: ERP CommunicationCU14.09|1.650.710.740.750.50
CU23.65|1.570.70
CU34.64|1.510.73
PUPU14.76|1.510.880.970.970.890.674|0.669
PU24.70|1.560.94
PU34.74|1.550.97
PU44.67|1.530.98
PEOUPEOU14.61|1.480.880.830.820.570.614|0.612
PEOU24.49|1.480.88
PEOU34.05|1.580.72
PEOU44.24|1.510.76
WCWC14.50|1.490.870.890.890.740.594|0.588
WC24.75|1.450.88
WC34.92|1.350.83
ATAT15.74|1.210.700.840.820.730.669|0.664
AT25.21|1.450.99
ExUExU13.02|2.190.760.900.900.640.379|0.372
ExU24.21|1.510.88
ExU33.98|1.630.80
ExU43.89|1.640.74
ExU53.45|1.440.80
Note: α = Cronbach’s α; R2 = explanatory power or variance; Adj. R2 = adjusted R2.
Convergent validity was examined via Fornell and Larcker’s criteria: all item factor loadings should be significant and higher than threshold, which is 0.70, and AVE for each construct, where threshold is 0.50 [43]. All item factor loadings in our study fulfilled these criteria except for one indicator that equalled 0.69, which is also above the minimal satisfactory level (0.50) suggested by Fornell and Larcker [43]. AVE values were above 0.50. The Cronbach’s α, CR as well as AVE of the second-order model are presented in Table 6. Cronbach’s α were above 0.70, CRs were above 0.80, and AVEs were equal to or above 0.50. As shown in Figure 4 and Table 6, the loadings of the first-order factors on the second-order factors went above 0.70, with the exception of two indicators, which were 0.64 and 0.68, thus still fulfilling the criteria for the minimal satisfactory level. Measurement scales show strong convergent validity.
The discriminant validity was analyzed using the criteria described in Section 2.1. Details of this estimation are presented in Table 4. All measurement loadings were above 0.70. This represents that the reflective model fits well [37,38,45] and cross-loadings were lower (data and results available by request). Additionally, all HTMT variables were less than 1.0 (italic numbers in Table 4). All three criteria of discriminant validity are fulfilled.
Table 4. Results of discriminant validity (intercorrelation of the latent variables and HTMT variables (italic).
1234567891011121314
1: PCIL: Personal Innovativness0.78
2: PCIL: Computer Anxiety0.33
(0.33)
0.81
3: STC: ERP Data Quality0.11
(0.13)
−0.03
(0.06)
0.81
4: STC: System Performance0.16
(0.18)
0.05
(0.10)
0.77
(0.76)
0.78
5: STC:
User Manuals
0.14
(0.15)
0.04
(0.08)
0.66
(0.66)
0.52
(0.52)
0.84
6: STC: System Functionality−0.17
(0.16)
−0.22
(0.22)
−0.48
(0.48)
−0.63
(0.63)
−0.32
(0.32)
0.91
7: OPC: Business Processes Fit0.04
(0.07)
0.05
(0.07)
0.75
(0.75)
0.66
(0.67)
0.47
(0.47)
−0.49
(0.49)
0.93
8: OPC: ERP Support0.14
(0.16)
0.21
(0.21)
0.58
(0.57)
0.52
(0.52)
0.54
(0.54)
−0.52
(0.53)
0.44
(0.44)
0.74
9: OPC:
ERP Communication
0.10
(0.12)
0.16
(0.16)
0.52
(0.52)
0.46
(0.46)
0.50
(0.50)
−0.46
(0.46)
0.46
(0.46)
0.70
(0.71)
0.75
10: PU0.15
(0.15)
0.13
(0.14)
0.58
(0.58)
0.61
(0.61)
0.39
(0.39)
−0.56
(0.56)
0.66
(0.66)
0.30
(0.30)
0.31
(0.31)
0.94
11: PEOU0.19
(0.19)
0.07
(0.07)
0.67
(0.66)
0.71
(0.71)
0.57
(0.57)
−0.62
(0.61)
0.63
(0.62)
0.47
(0.47)
0.40
(0.39)
0.71
(0.70)
0.76
12: WC0.23
(0.23)
0.13
(0.13)
0.65
(0.65)
0.64
(0.64)
0.48
(0.48)
−0.62
(0.62)
0.71
(0.71)
0.54
(0.54)
0.50
(0.50)
0.82
(0.81)
0.74
(0.74)
0.86
13: AT0.31
(0.32)
0.27
(0.29)
0.45
(0.45)
0.55
(0.57)
0.35
(0.35)
−0.53
(0.55)
0.49
(0.50)
0.42
(0.43)
0.35
(0.37)
0.70
(0.71)
0.69
(0.71)
0.82
(0.82)
0.86
14: ExU0.40
(0.40)
0.05
(0.10)
0.33
(0.33)
0.38
(0.38)
0.28
(0.28)
−0.30
(0.30)
0.43
(0.43)
0.21
(0.21)
0.24
(0.24)
0.51
(0.51)
0.44
(0.41)
0.61
(0.61)
0.53
(0.53)
0.80
Note: Square root of AVE in bold text; HTMT values in italic text.
Garson [38] pointed out that “standardized root means square residual (SRMS) calculates the difference among the model-implied correlation matrix as well as the observed correlation matrix” and added that the model is well-fitted if SRMS is lower than 0.08. However, some researchers use the more lenient cut-off of 0.10. The SRMS value of the research model in this paper stands at 0.09, and presents that model as allowable.
All criteria of the measurement model were met, so we were able to continue our analysis with the structural model analysis.

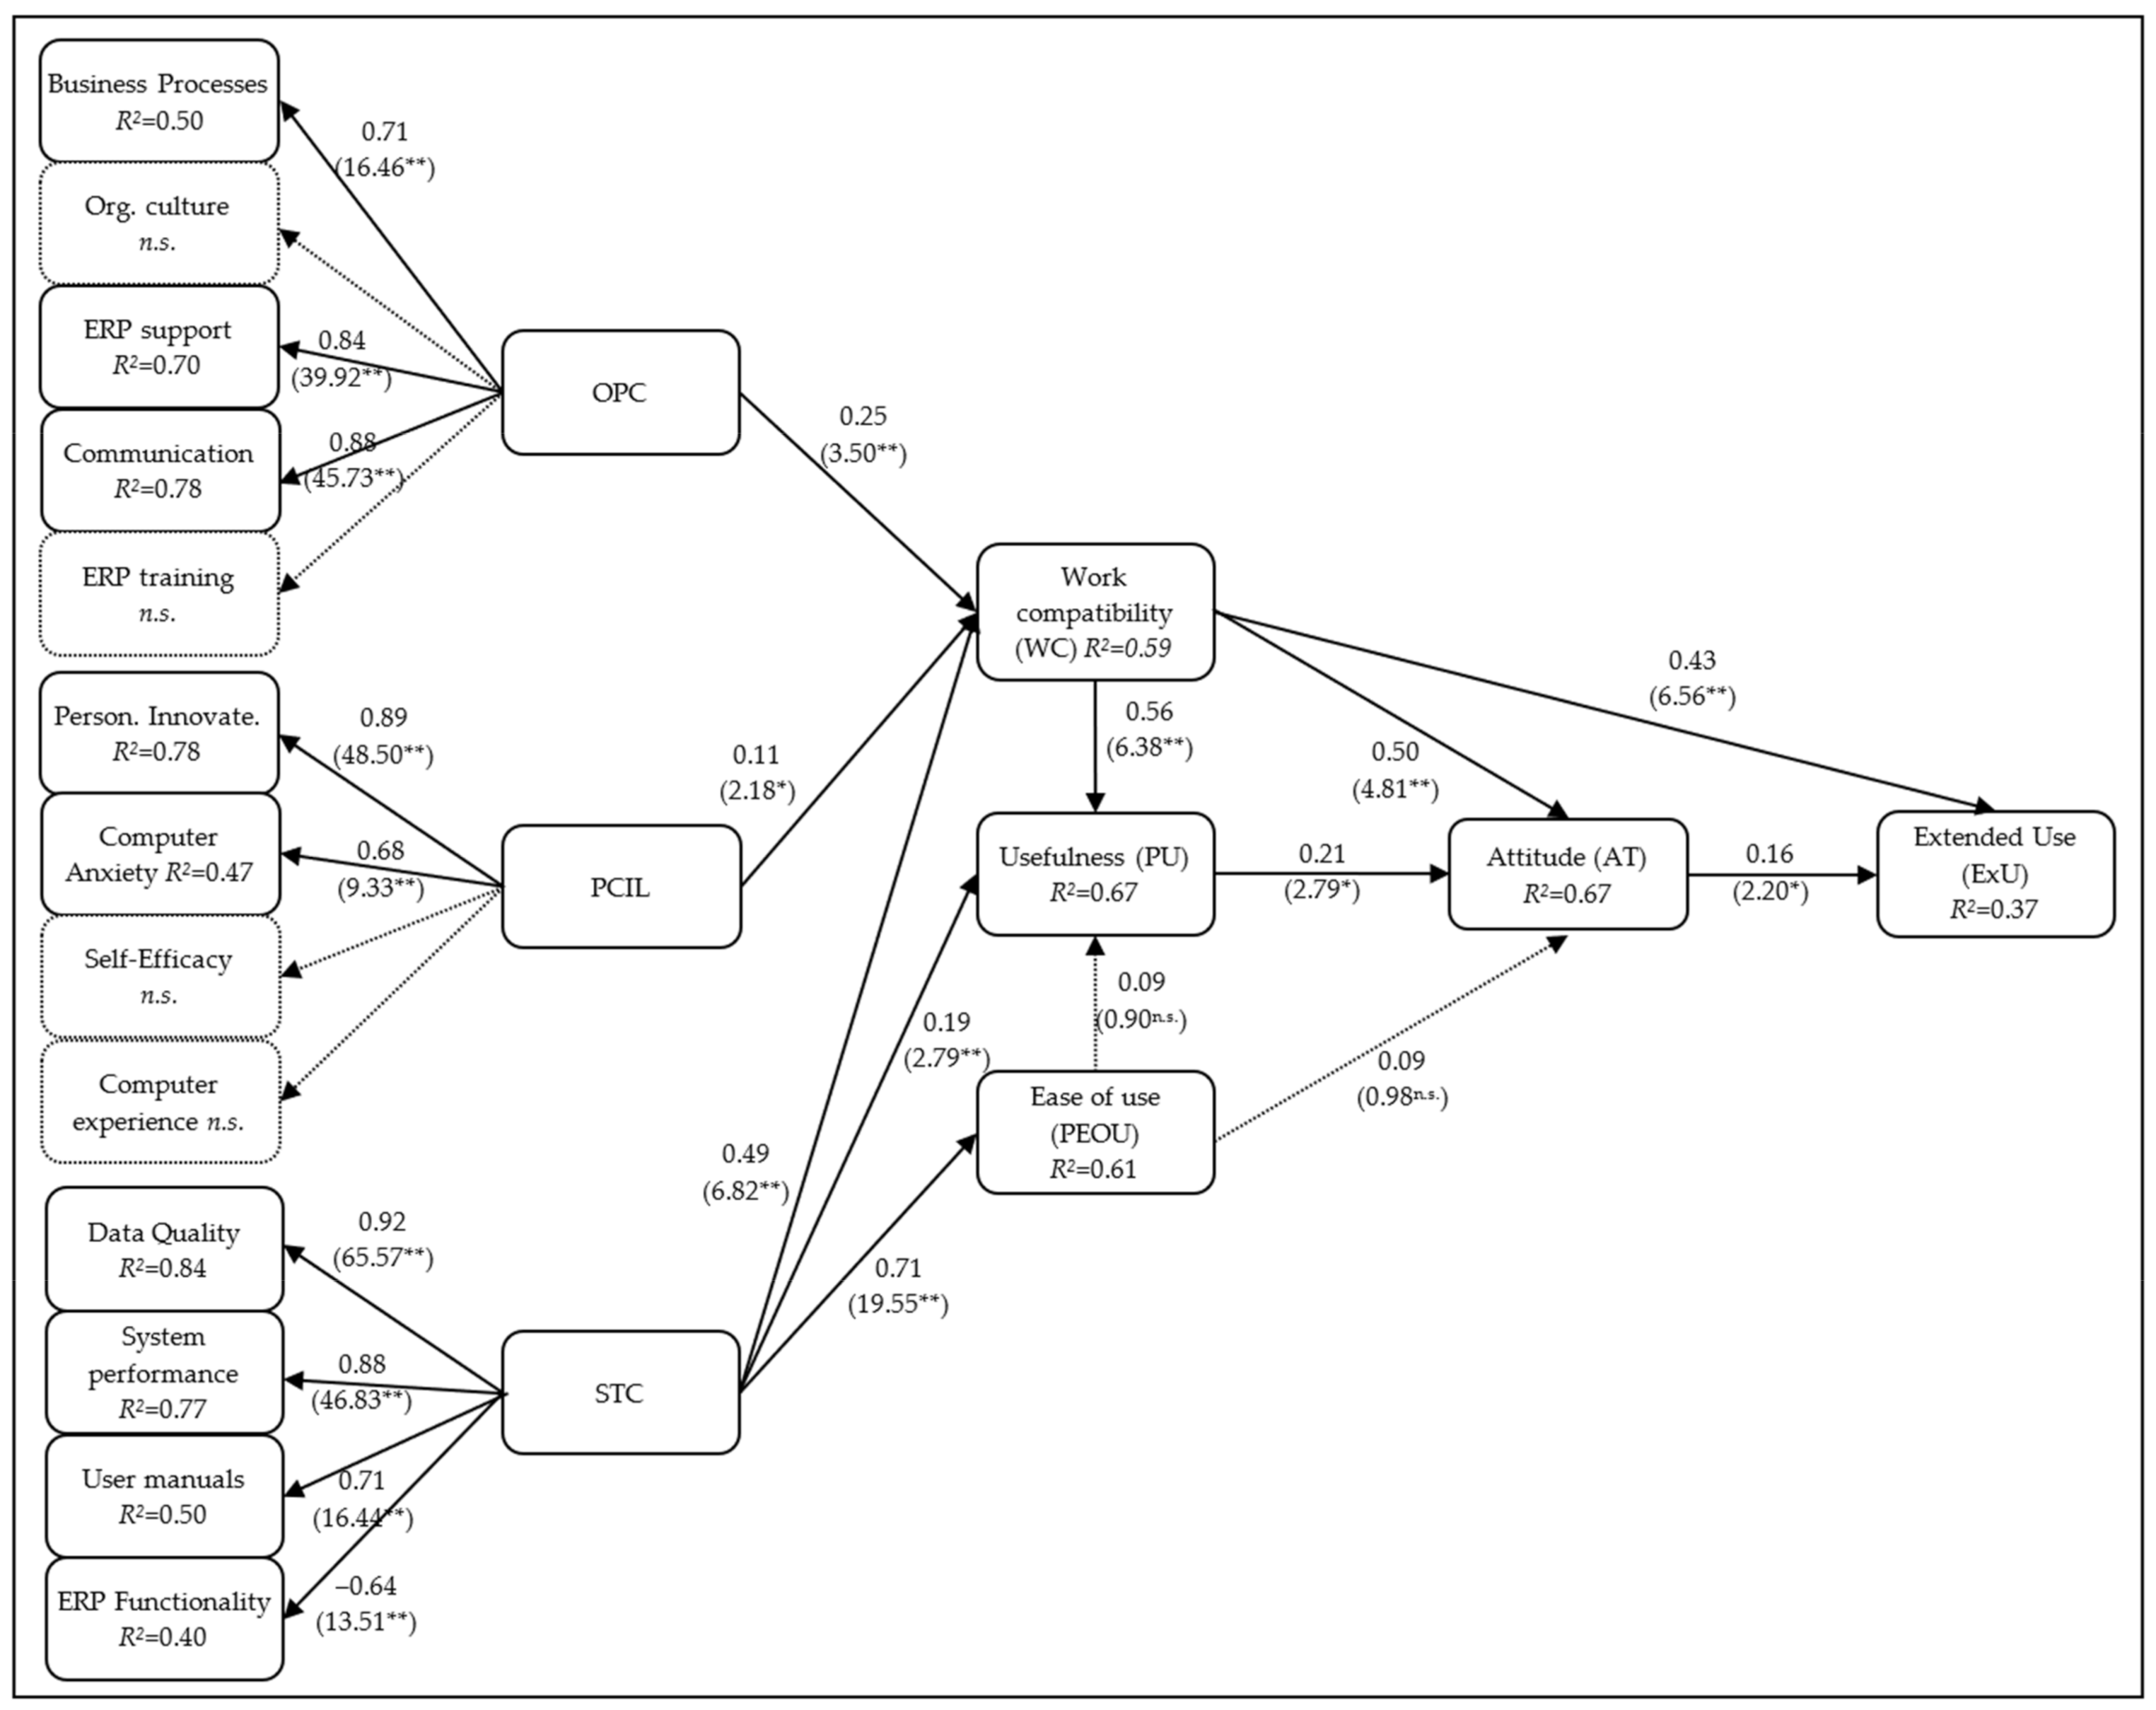
3.3. Structural Model

The hypotheses listed above were tested. As already mentioned, bootstrapping (5000 sub-samples) was used to examine the statistical significance of each path coefficient by performing t tests [48].
Table 5 and Figure 4 include the results obtained. Construct PEOU had no significant impact neither on construct PU (t = 0.90, p > 0.05) nor on construct AT (t = 0.98, p > 0.05). Further, construct PU had a weak positive impact on construct AT (t = 2.79, p < 0.05). Construct WC had a strong and significant positive impact on construct AT (t = 4.81, p < 0.01), construct PU (t = 6.38, p < 0.01), and construct ExU (t = 6.56, p < 0.01). Additionally, construct AT had a weak but important impact on construct ExU (t = 2.20, p < 0.05).
Table 5. Hypothesized relationships (for all TAM constructs and significant relationships of extended TAM constructs).
Relationshipβ (Path Coefficient)95% Confidence Intervalt Statisticsf2
OPC→WC0.25[0.108; 0.388]3.50 **0.08 a
STC→WC0.49[0.341; 0.621]6.82 **0.22 b
PCIL→WC0.11[0.012; 0.205]2.18 *0.04 a
STC→PU0.19[0.059; 0.332]2.79 **0.03 a
WC→PU0.56[0.383; 0.721]6.38 **0.42 c
PEOU→PU0.09[−0.114; 0.290]0.90 n.s.0.00
SCT→PEOU0.71[0.629; 0.771]19.55 **1.59 c
WC→AT0.50[0.277; 0.684]4.81 **0.33 b
PU→AT0.21[0.036; 0.376]2.79 **0.01
PEOU→AT0.09[−0.080; 0.274]0.98 n.s.0.00
WC→ExU0.43[0.295; 0.558]6.56 **0.15 a
AT→ExU0.16[0.005; 0.298]2.20 *0.01
Note: Path significance: ** p < 0.01; * p < 0.05; n.s. = not significant. f2 thresholds: a > 0.02 (weak effect); b > 0.15 (moderate effect); c > 0.35 (strong effect).
As shown in Figure 4 and Table 6, the second-order factors significantly positively impacted construct WC, construct PU as well as construct PEOU. Second-order factor PCIL shows significantly positive but weak impact on construct WC (t = 2.18, p < 0.05). Second-order factor STC had a weak impact on construct PU (t = 2.79, p < 0.01), a moderate impact on construct WC (t = 6.82, p < 0.01) and a very strong positive impact on construct PEOU (t = 19.55, p < 0.01). Additionally, the second-order factor OPC had a weak positive impact on construct WC (t = 3.50, p < 0.01). In addition to this, other relationships between second-order factors OPC, STC, and PCIL on one side and constructs of original TAM (namely PEOU, PU and WC, on the other side were tested, but none of the relationships were significant.
Table 6. Path coefficients—external constructs in the second-order model.
Second-Order Constructs
PCIL
α = 0.75
CR = 0.75
AVE = 0.50
STC
α = 0.85
CR = 0.86
AVE = 0.51
OPC
α = 0.84
CR = 0.84
AVE = 0.51
First-Order Constructs
PCIL: Personal Innovativeness0.89 (t = 48.50)
PCIL: Computer Anxiety0.68 (t = 9.60)
STC: ERP Data Quality 0.91 (t = 60.56)
STC: System Performance 0.88 (t = 44.90)
STC: User Manuals (Help) 0.70 (t = 15.42)
STC: System Functionality −0.66 (t = 15.11)
OPC: Business Processes Fit 0.71 (t = 16.89)
OPC: ERP Support 0.84 (t = 39.06)
OPC: ERP Communication 0.88 (t = 47.68)
Note: t values are in brackets; all values are signed at p < 0.01.
The variance explained for each dependent variable is indicated by the R2 generated for each regression equation. The structural model gives a demonstration of predictive power since R2 and adjusted R2 for key dependent variables are very high. R2 is 0.59 for construct WC, 0.67 for construct PU, 0.61 for construct PEOU, 0.67 for construct AT, and 0.37 for construct ExU, as presented in Table 3. All adjusted R2 are “moderate” according to Chin [48], except AT and PU, which are “substantial”. The research discovered that the research model used explains, on average, a high proportion of the variance since the average R2 equals 0.58. The model average f2 (as defined in Section 2.1), which equals 0.24, reflects the moderate effect size-independent factors have on dependent factors (Table 5). The highest effect was identified for second-order factor STC on construct PEOU (f2 = 1.59), and it contributes the most to the research model average effect size.
Moderating effects for the factors of the extended TAM were explored, and the results are presented in Table 7:
  • When analyzing the impact of construct WC on construct ExU, complementary mediation exists, while direct effect as well as indirect effect are significant. Indirect effects analysis shows the following results:
    The indirect effect of AT (AT; WC→AT→ExU) is significant (β = 0.081, t = 1.993, p = 0.046, [0.008; 0.171]);
    The indirect effects of PU and of AT (WC→PU→AT→ExU) do not meet the significance threshold (β = 0.019, t = 1.509, p = 0.131, [0.001; 0.053]);
  • When analyzing the impact of construct WC on construct AT, complementary mediation exists, while direct effects and an indirect effects via construct PU are significant and pointed in the same direction;
  • When analyzing the impact of construct PEOU on construct AT, neither direct nor indirect effects are significant (no-effect non-mediation);
For second-order factors, total effects on construct ExU were calculated—these effects exist and are important. Each group of second-order factors significantly impacts the construct ExU:
  • OPC significantly affects the construct ExU (β = 0.133, t = 3.450, p = 0.001);
  • STC has a significant effect on construct ExU (β = 0.277, t = 5.961, p = 0.000);
  • PCIL has a significant effect on construct ExU (β = 0.057, t = 2.114, p = 0.035).
Further analysis shows that for all three second-order factors, only the indirect effect through construct WC is significant (OPC→WC→ExU: β = 0.108, t = 3.099, p = 0.002; PCIL→WC→ExU: β = 0.046, t = 2.085, p = 0.037; STC→WC→ExU: β = 0.210, t = 4.588, p = 0.000), while indirect effects through construct PU and construct PEOU are not statistically significant.
Table 7. Direct and indirect effect of extended TAM model.
Direct Effect (DE)95% Confidence Interval of DEt ValueSignificance (p < 0.05)?Indirect Effect (IE)95% Confidence Interval of IEt ValueSignificance (p < 0.05)?
WC→ExU0.432[0.295; 0.558]6.563Yes (0.000)0.081[0.008; 0.171]1.993Yes (0.046)
WC→AT0.495[0.277; 0.684]4.805Yes (0.000)0.117[0.008; 0.171]2.417Yes (0.016)
PEOU→AT0.089[−0.080; 0.274]0.980No (0.327)0.020[−0.017; 0.095]0.733No (0.464)
Figure 4. Findings of structural model analysis. Note: Path sign.: ** p < 0.01; * p < 0.05; n.s. = not significant (dotted arrows).
Mathematics 10 01379 g004

3.4. Blindfolding Procedure

In addition to assessing the R2 values (i.e., a measure of predictive accuracy), the Stone–Geisser’s Q2 value (i.e., a criterion of predictive relevance) was calculated as well. The blindfolding approach [51] calculates the cv-communality index (H2) as well as the cv-redundancy index (Q2) for constructs and indicators. An H2 and Q2 values greater than zero confirm that the structural and measurement models are important for forecasting [38]. As can be seen from Table 8, all values of H2 exceed 0 (average values of H2 = 0.492) and all values of Q2 exceed 0 (average value of Q2 = 0.442). Our measurement model shows a higher level of quality as compared with the structural one. Since the value of 0.02 indicates “a small effect size, 0.15 a medium one, and 0.35 a high effect size” [105], both models have a high level of predictive acceptability.

3.5. Artificial Neural Network Analysis

The next step is the application of ANN models. They are applied to classify the relative impact of only important predictors acquired from analysis of PLS-SEM. Based on the proposed research model and the results of PLS-SEM, it is possible to create four ANN models: Model 1, where the inputs are OPC, PCIL, and STC and the output is WC; Model 2, where the inputs are STC and WC and the output is PU; Model 3, where the inputs are WC and PU and the output is AT); and Model 4, where the inputs are WC and AT and the output is ExU).
However, before assessing the ANN models, the ANOVA Test of Linearity was applied [15,62]. It tests the presence of non-linear relationships in potential ANN models. The results of the ANOVA test of Linearity are included in Table 9.
The test results show that the connection among construct WC and construct AT has a statistically significant deviation from linearity (with significance p < 0.05), while the relationship between construct AT and construct ExU is very close to this conclusion (p = 0.055). These results justify the introduction of artificial neural networks, which are capable of considering non-linear effects present and, therefore, of more accurately modeling user behavior.
In this research, ANNs were formed in SPSS 20. All ANN models have one hidden layer [59], and the number of neurons in this hidden layer was regulated by simulation software system [65,106]. There were two hidden layers for all four ANN models. As an activation function in hidden as well as output layers, sigmoid was used [58,101]. An example of an ANN model created in SPSS is shown in Figure 5.
The testing research sample was split into training sub-sample (90% of the data) and testing sub-sample (left over 10% of the data) [19,107]. Among the more common problems in the ANN analysis is the over-fitting—the situation when the ANN model simply remembers all training cases and loses the capability for general analysis, i.e., forecasting the result accurately with a previously invisible set of inputs [64]. To avoid this situation, ten-fold cross-validation was used [52,107].
“The RMSE (Root Mean Square Error) is applied to estimate the predictive accuracy of ANN models” [65,108]. The results that refer to both sets of data (testing and training) for all 10 ANNs were obtained (Table 10).
Low average values for RMSE for all four ANN models, for both training and testing datasets (varying from 0.0913 to 0.1354), reflect the good predictive power of the models [57].
Finally, to determine the relative importance of each predictor (variations of the output for different values of the input), sensitivity analysis of the ANN models was performed. The normalized significance of each predictor was computed by dividing the relative significance values by the largest significance value [16,107]. It is usually expressed in percentages. The results of ANN sensitivity analysis, i.e., the relative and normalized importance of the predictors in each ANN model, were obtained (Table 11).
The most significant predictor of WC is the OPC—(second-order construct), followed by STC (second-order construct) and PCIL (second-order construct), which is in contrast with the PLS-SEM results, in which STC had a stronger effect than OPC. WC was identified as a far more important antecedent of PU than STC, which is the same as predicted by PLS-SEM, with a minor relative difference in influence—the ANN model predicted that this relative difference was slightly lower than that predicted by PLS-SEM. Similarly, WC was identified as a far more significant predictor of AT than PU, which is again the same as predicted by PLS-SEM results. Again, there was a minor relative difference in influence—the ANN model predicted that this relative difference was slightly higher than the PLS-SEM predictions. Finally, the ANN model predicted that WC has a stronger influence on ExU compared to AT, which is in line with PLS-SEM findings, but the relative difference was slightly lower. These minor differences between the two techniques and the results obtained reflect the higher prediction accuracy of the ANN models, which consider existing non-linear effects among variables [62].

3.6. The Importance–Performance Map Analysis (IPMA)

To obtain further insights, IPMA was used, by merging the importance (I) and performance (P) dimensions analysis [20,38]. IPMA allows identifying areas where the action is required. Namely, one may identify parts of the process with relatively high importance yet relatively low performance to implement the corresponding management tools leading to improvements. Table 12 and Figure 6 show both dimensions of the constructs influencing the dependent variable—ExU.
Table 12. Data of the importance–performance map for extended use of ERP system (ExU).
ImportancePerformance
AT0.16274.207
OPC0.13357.527
PCIL0.05777.587
PEOU0.01856.665
PU0.03461.965
STC0.27762.019
WC0.53262.075
Mean value0.17364.578
Figure 6. 3 IPMA for the endogenous variable extended use of the ERP system (ExU).
Mathematics 10 01379 g006
IPMA results are presented by the two-dimensional graph, where the horizontal axis describes the “importance” (total effect) of influential factors using a scale from 0 to 1, and the vertical axis describes their performance, using a scale from 0 to 100. The graphs in Figure 6 and Table 12 reveal that the most important construct was WC, followed by STC, AT, OPC, PCIL, PU, and PEOU. However, the construct with the best performance was PCIL, followed by the AT, STC, WC, PU, OPC, and PEOU. The most important finding is that the performance of WC does not match its importance. Consequently, for managerial activities to increase the ExU, the emphasis should be on the construct of WC, which can be obtained by emphasizing the predecessors of the second-order construct STC and second-order construct OPC, where performance still has the possibility for significant improvements.

4. Discussion

The main objective of this paper is to show the effectiveness of the proposed methodological process, which consists of five phases and are aimed at determining the important information provided by the results of each implemented methodological phase: (i) PLS-SEM—assessment of measurement model; (ii) PLS-SEM—assessment of structural model; (iii) PLS-SEM—the blindfolding procedure; (vi) ANN analysis based on PLS-SEM results; (v) IPMA procedure based on PLS-SEM results.
We presented a research case and a model of constructs influencing the adoption and in-depth use of important information technology in companies by employees. We emphasize that the information technology we are considering is crucial for maintaining the company’s competitive position and for creating its competitive advantages; moreover, in the conditions of the digitalization of business, which are especially present in the automotive industry (which we considered in our research case), the in-depth use of information systems in the company is the basis of and condition for the operation (existence) of the company. The information technology in question is the ERP, which is a core information system in modern companies.
The importance of successful ERP implementation in all phases of the life cycle is extremely important for companies [46,64,69,81]. Nevertheless, this implementation often suffers from failure, reflecting the fact that the success of the advanced use of ERPs in companies is influenced by several factors, in turn influencing the level of acceptance of these systems by employees. In the research case presented in this paper, we analyzed the factors that influence the acceptance of ERPs by employees in companies based on the attitude they develop towards this information technology and their in-depth use of it. The importance of this topic for companies is also evidenced by extensive research work and the search for solutions to reduce the failure rate through process modeling with a series of theoretical models. In doing so, the TAM has been confirmed to be appropriate in a number of different cases, with SEM proving to be an appropriate methodology used to test the model [11,12,13,14,109,110,111,112,113].
Although business information solutions and systems themselves are becoming increasingly complex, the research methodology for testing theoretical models in this field relatively rarely uses advanced, new approaches within SEM or their combinations with advanced artificial intelligence methods despite the high level of complexity associated with human decisions (which is, of course, the case in the field addressed in this study). Results show that the proposed methodological process enriches results of PLS-SEM; this is achieved using the advanced data analysis methods of the ANN and IPMA, thus creating the basis for evidence-based, grounded business decisions to support the development of the mature use of ERPs in companies. We explored a combined methodological approach involving PLS-SEM, advanced new procedures in this framework, and ANN analysis of artificial intelligence that can intervene in the linearity of the SEM model. We wanted to supplement the PLS-SEM results in terms of the assumption of nonlinear relationships in the model on one hand and, on the other hand, to establish the ranking of the factors obtained with PLS-SEM according to their relative importance as predictors.
The research results obtained in the first three phases (i) PLS-SEM—assessment of measurement model; (ii) PLS-SEM—assessment of structural model; and (iii) PLS-SEM—the blindfolding procedure) follow.
The outcomes endorse the existence and significance of most of the expected relationships foreseen in the structural model using the PLS-SEM technique (Figure 3 and Figure 4), except relationships for construct PEOU (hypotheses H1 and H2), which are two relationships proposed by Davis [75,76]. As Figure 4 shows, construct PEOU had no significant impact on the construct PU and/or the construct AT. This finding corresponds with findings of research studies by other authors, which argue that PEOU seems to be more meaningful during implementation phases of the ERP system and becomes less important in the latter stages of the ERP system life cycle, when the system is in use for a longer time [30,76].
Data analysis shows that construct PU had a direct positive impact on the construct AT, which confirms H3 and prior conducted research studies [33,75,76]. Construct WC was introduced as the level to which an ERP user is able to implement almost all of his/her work duties using implemented ERP system. Our investigation shows that construct WC influenced construct PU, which confirms hypotheses H4 and prior findings [34,35,81,97]. Construct WC also directly and indirectly (through construct PU) influenced construct AT, which confirms hypotheses H5 and prior research studies [30,34,35]. Construct WC also directly and indirectly (through construct AT) influenced construct ExU, which confirms hypothesis H6 [35]. Construct AT did not have as strong a direct impact on construct ExU as construct WC, but it was a significant one (which confirms H7).
The research included external factors by grouping them into second-order factors (which confirms hypotheses H8a, H9a, H9b, H9c and H10a). Results (Figure 4, Table 8) show that several important external factors were identified.
Research results of the fourth phase ((vi) ANN analysis based on PLS-SEM results) that enrich the results of the first three phases follow.
The results show that some relationships show a significant deviation from linearity, which was expected given the content characteristics of the variables in the model. There were some, albeit minor, differences between the findings of the traditional PLS-SEM technique in addition to the ANN analysis, which can represent important added value and useful information for the informed decision-maker and the basics for business decision-making. For example, such a result is a different order of importance for factors or predictors of WC values: the most important predictor was OPC, followed by STC and PCIL, which is in contrast to the PLS-SEM results, in which STC had a stronger influence than OPC. Similarly, the ANN model predicted that WC had a stronger impact on ExU as compared to AT, which is consistent with the PLS-SEM findings, but the relative difference between their importance in ANN is slightly smaller. The results of the ANN analysis and the differences with the SEM results reflect the higher prediction accuracy of the ANN models, which consider existing non-linear effects among variables [62].
Research results of the fifth phase ((v) IPMA procedure based on PLS-SEM results), add the following important information to what has already been gained.
The last step in the research was the importance–performance analysis to identify the gap between the levels of importance and the levels of performance of factors in the model. Based on IPMA results, the researched company can improve ExU through construct WC and its second-order antecedents, as well as via the STC, where the most effort should be focused on data quality and accuracy, higher system performance, better user manuals, and improved ERP system functionalities.
By implementing this methodological approach, this research gives important insights on how to increase the recognition of the impact of several constructs that can expand the level of the ExU in the maturity stage. Knowing the structure of the individual important factors that we have identified, but which have not yet been sufficiently developed in the company, it is possible to form direct instructions for the implementation of managerial decisions based on the results of the research. The implementation of these decisions then affects the success of the acceptance of the ERP system in the mature phase of the use of these systems in the company and results in more in-depth use of ERP solutions by ERP users. This contributes to improvements in their productivity.
This study was limited to quantitative research and was conducted using the TAM research method for the described sample. We also believe that the described findings can be extended by implementing the qualitative approach, which could further enrich the understanding in the field of acceptance and perception of information technology by employees in companies. As we have already noted, human perception and assessment are complex. Therefore, additional qualitative research, with in-depth interviews with carefully selected focus groups (IS/IT users, managers, developers of business information systems) could represent important value-added content from the conducted quantitative research. In addition to that, it would make sense to upgrade this research by examining the differences regarding acceptance of an ERP system by two groups (management and employees) as the scope of functionality that one group of users (employees) has to use varies greatly as compared to the other group (management). This study was also limited to the mature stage of ERP usage in the company; therefore, future research may also investigate the factors that influence the acceptance of ERP solutions in different stages of the life-cycle of ERP usage in companies. Furthermore, it would be also worth studying and testing the model for other business information systems such as CRM, HRM, DMS, etc.

5. Conclusions

The results of our research are important from two perspectives: (i) from a methodological perspective and (ii) from a business practice perspective, to provide a basis for evidence-based decision-making.
From a methodological point of view, we showed how to upgrade the traditional PLS-SEM method results with the artificial intelligence method of ANN analysis and with new advanced techniques within PLS-SEM. We showed how to enrich the results of the PLS-SEM model by identifying nonlinear relationships in the model and by analyzing the relative importance of factors in the model, as well as by IPMA, which in some way shows a bottleneck in the process—the possible gap between the levels of importance and performance for individual factors in the model.
On this basis, business managerial decisions can be more in-depth and reasoned. We used this approach in the example of the model of the acceptance of business information systems by users in organizations, where we studied the mature stages of the use of ERP systems in a company. The presented methodological process is useful in various areas of the business decision-making process in organizations.

Author Contributions

Conceptualization, U.Z., S.B. and P.T.; methodology, S.B., P.T., Z.K. and S.S.Z.; software, U.Z., P.T., Z.K. and S.S.Z.; validation, U.Z. and S.B.; formal analysis, U.Z., S.B., P.T., Z.K. and S.S.Z.; investigation, U.Z.; resources, S.B., P.T. and S.S.Z.; data curation, U.Z. and S.S.Z.; writing—original draft preparation, U.Z.; writing—review and editing, P.T. and S.S.Z.; visualization, U.Z., P.T., Z.K. and S.S.Z.; supervision, S.B. and P.T.; project administration, S.S.Z.; funding acquisition, P.T. and S.S.Z. All authors have read and agreed to the published version of the manuscript.

Funding

Authors acknowledge financial support from the Slovenian Research Agency (research core funding No. P5–0023, ‘Entrepreneurship for Innovative Society) and the Erasmus+ programmes (grant No. 2019-1-CZ01-KA203-061374 “Spationomy 2.0” and grant No. 2019–1-PL01-KA203-065050 “Economics of Sustainability”).

Institutional Review Board Statement

Not applicable.

Informed Consent Statement

Not applicable.

Data Availability Statement

The data presented in this study are available on request from the corresponding author.

Conflicts of Interest

The authors declare no conflict of interest.

Abbreviations

ANN—artificial neural network; IPMA—Importance–Performance Matrix Analysis; ERP—enterprise resource planning; TAM—technology acceptance model; CR—composite reliability; AVE—average variance extracted; HTMT—heterotrait–monotrait; PU—perceived usefulness; PEOU—perceived ease of use; AT—user’s attitude regarding using a system or technology; BI—user’s behavioral intention; U—actual use; OPC—organizational process characteristics; STC—system and technological characteristics; PCIL—personal characteristics with the information literacy; WC—perceived work compatibility; ExU—extended use; SRMS—standardized root means square residual; H2—cv-communality index; Q2—cv-redundancy index; RMSE—root mean square error.

References

  1. Bruckes, M.; Westmattelmann, D.; Oldeweme, A.; Schewe, G. Determinants and barriers of adopting robo-advisory services. In Proceedings of the 40th International Conference on Information Systems, ICIS, Munich, Germany, 15–18 December 2019. [Google Scholar]
  2. Cenfetelli, R.T.; Bassellier, G. Interpretation of formative measurement in information systems research. MIS Q. Manag. Inf. Syst. 2009, 33, 689–707. [Google Scholar] [CrossRef]
  3. Hajli, N. Social commerce constructs and consumer’s intention to buy. Int. J. Inf. Manag. 2015, 35, 183–191. [Google Scholar] [CrossRef]
  4. Hajli, N.; Sims, J. Social commerce: The transfer of power from sellers to buyers. Technol. Forecast. Soc. Chang. 2015, 94, 350–358. [Google Scholar] [CrossRef] [Green Version]
  5. Al-Fraihat, D.; Joy, M.; Masa’deh, R.; Sinclair, J. Evaluating E-learning systems success: An empirical study. Comput. Hum. Behav. 2020, 102, 67–86. [Google Scholar] [CrossRef]
  6. Pal, D.; Arpnikanondt, C. An integrated TAM/ISS model based PLS-SEM approach for evaluating the continuous usage of voice enabled IoT systems. Wirel. Pers. Commun. 2021, 119, 1065–1092. [Google Scholar] [CrossRef]
  7. Rabaa’i, A.A.; ALMaati, S.A. Exploring the determinants of users’ continuance intention to use mobile banking services in Kuwait: Extending the expectation-confirmation model. Asia Pac. J. Inf. Syst. 2021, 31, 141–184. [Google Scholar] [CrossRef]
  8. Kaewsaiha, P.; Chanchalor, S. Factors affecting the usage of learning management systems in higher education. Educ. Inf. Technol. 2021, 26, 2919–2939. [Google Scholar] [CrossRef]
  9. Zhang, S.; Wakefield, R.; Huang, J.; Li, X. Exploring determinants of consumers’ attitudes toward real-time bidding (RTB) advertising. Inf. Technol. People 2021, 34, 496–525. [Google Scholar] [CrossRef]
  10. Leong, L.-Y.; Hew, T.-S.; Tan, G.W.H.; Ooi, K.B. Predicting the determinants of the NFC-enabled mobile credit card acceptance: A neural network approach. Expert Syst. Appl. 2013, 40, 5604–5620. [Google Scholar] [CrossRef]
  11. Tan, G.W.H.; Ooi, K.B.; Leong, L.Y.; Lin, B. Predicting the drivers of behavioral intention to use mobile learning: A hybrid SEM-Neural Networks approach. Comput. Hum. Behav. 2014, 36, 198–213. [Google Scholar] [CrossRef]
  12. Chan, F.T.S.; Chong, A.Y.L. A SEM-neural network approach for understanding determinants of interorganizational system standard adoption and performances. Decis. Support Syst. 2012, 54, 621–630. [Google Scholar] [CrossRef]
  13. Sim, J.J.; Tan, G.W.H.; Wong, J.C.J.; Ooi, K.B.; Hew, T.S. Understanding and predicting the motivators of mobile music acceptance—A multi stage MRA-Artificial neural network approach. Telemat. Inform. 2014, 31, 569–584. [Google Scholar] [CrossRef]
  14. Leong, L.Y.; Hew, T.S.; Lee, V.H.; Ooi, K.B. An SEM-artificial-neural-network analysis of the relationships between SERVPERF, customer satisfaction and loyalty among low-cost and full service airline. Expert Syst. Appl. 2015, 42, 6620–6634. [Google Scholar] [CrossRef]
  15. Leong, L.-Y.; Jaafar, N.I.; Ainin, S. Understanding Facebook commerce (F-commerce) actual purchase from an artificial neural network perspective. J. Electron. Commer. Res. 2018, 40, 75–103. [Google Scholar]
  16. Kalinic, Z.; Marinkovic, V.; Molinillo, S.; Liébana-Cabanillas, F. A multi-analytical approach to peer-to-peer mobile payment acceptance prediction. J. Retail. Consum. Serv. 2019, 49, 143–153. [Google Scholar] [CrossRef]
  17. Chong, A.Y.L. Predicting m-commerce adoption determinants: A neural network approach. Expert Syst. Appl. 2013, 40, 523–530. [Google Scholar] [CrossRef]
  18. Chong, A.Y.L. A two-staged SEM-neural network approach for understanding and predicting the determinants of m-commerce adoption. Expert Syst. Appl. 2013, 40, 1240–1247. [Google Scholar] [CrossRef]
  19. Liébana-Cabanillas, F.; Marinković, V.; Kalinić, Z. A SEM-neural network approach for predicting antecedents of m-commerce acceptance. Int. J. Inf. Manag. 2017, 37, 14–24. [Google Scholar] [CrossRef]
  20. Ringle, C.M.; Sarstedt, M. Gain more insight from your PLS-SEM results: The importance-performance map analysis. Ind. Manag. Data Syst. 2016, 116, 1865–1886. [Google Scholar] [CrossRef]
  21. Bradford, M. Modern ERP: Select, Implement, and Use Today’s Advanced Business Systems, 4th ed.; Pole College of Management, North Carolina State University: Raleigh, NC, USA, 2020. [Google Scholar]
  22. Lee, D.H.; Lee, S.M.; Olson, D.L.; Chung, S.H. The Effect of Organizational Support on ERP Implementation. Ind. Manag. Data Syst. 2010, 110, 269–283. [Google Scholar] [CrossRef]
  23. Ball, B. ERP Integration for SMB Companies Preparing for the Future. Aberdeen Group. 2018. Available online: https://l82od4c3ddp2xkios1wuwoqf-wpengine.netdnassl.com/wp-content/uploads/17237-KB-ERP-Integration-Collaboration.pdf (accessed on 9 December 2020).
  24. Kwahk, K.-Y.; Lee, J.N. The Role of Readiness for Change in ERP Implementation: Theoretical Bases and Empirical Validation. Inf. Manag. 2008, 45, 474–481. [Google Scholar] [CrossRef]
  25. Rajan, C.A.; Baral, R. Adoption of ERP system: An empirical study of factors influencing the usage of ERP and its impact on end user. IIMB Manag. Rev. 2015, 27, 105–117. [Google Scholar] [CrossRef] [Green Version]
  26. Ju, P.-H.; Wei, H.-L.; Tsai, C.-C. Model of Post-Implementation User Participation within ERP Advice Network. Asia Pac. Manag. Rev. 2016, 21, 92–101. [Google Scholar] [CrossRef]
  27. Semenoff, J. How and Why? Explaining the Factors that Influence ERP System Usage from the End-Users Perspective: A Literature Review. Masters’s Thesis, University of Jyväskylä, Jyväskylä, Finland, 2020. [Google Scholar]
  28. Sagegg, O.J.; Alfnes, E. ERP Systems for Manufacturing Supplay Chains: Applications, Configuration, and Performance; CRC Press: Boca Raton, FL, USA; Taylor & Francis Group: Boca Raton, FL, USA, 2020. [Google Scholar]
  29. Montgomery, N.; Anderson, R.; Kostoulas, J.; Woodyer, A. High-Tech Tuesday Webinar: Best Opportunities and Bets for Growth in Enterprise Resource Planning. Gart. Res. 2017. Available online: https://www.gartner.com/en/documents/3640429 (accessed on 15 February 2022).
  30. Nah, F.F.; Tan, X.; Teh, S.H. An Empirical Investigation on End-Users’ Acceptance of Enterprise Systems. Inf. Resour. Manag. J. 2004, 17, 32–53. [Google Scholar] [CrossRef] [Green Version]
  31. Epizitone, A.; Olugbara, O.O. Critical Success Factors for ERP System Implementation to Support Financial Functions. Acad. Account. Financ. Stud. J. 2019, 23, 1–11. [Google Scholar]
  32. Costa, C.; Ferreira, E.; Bento, F.; Aparicio, A. Enterprise resource planning adoption and satisfaction determinants. Comput. Hum. Behav. 2016, 63, 659–671. [Google Scholar] [CrossRef]
  33. Sternad, S.; Gradišar, M.; Bobek, S. The Influence of External Factors on Routine ERP Usage. Ind. Manag. Data Syst. 2011, 111, 1511–1530. [Google Scholar] [CrossRef]
  34. Sternad, S.; Bobek, S. TAM-Based External Factors Related to ERP Solutions Acceptance in Organizations. Int. J. Inf. Syst. Proj. Manag. 2013, 1, 25–38. [Google Scholar] [CrossRef]
  35. Sternad, S.; Bobek, S. ERP Business Solutions Acceptance in Companies. In Managing in Recovering Markets (Springer Proceedings in Business and Economics); Chatterjee, S.R., Ed.; Springer: New Delhi, India, 2014; pp. 283–294. [Google Scholar]
  36. Sarstedt, M.; Ringle, C.M.; Hair, J.F. Partial Least Squares Structural Equation Modeling. In Handbook of Market Research; Homburg, C., Klarmann, M., Vomberg, A.E., Eds.; Springer: Cham, Switzerland, 2021. [Google Scholar] [CrossRef]
  37. Henseler, J.; Hubona, G.; Ray, P.A. Using PLS Path Modeling in New Technology Research: Updated Guidelines. Ind. Manag. Data Syst. 2016, 116, 2–20. [Google Scholar] [CrossRef]
  38. Garson, G.D. Partial Least Squares: Regression and Structural Equation Models; Statistical Associates Publishers: Asheboro, NC, USA, 2016. [Google Scholar]
  39. Rožman, M.; Tominc, P.; Milfelner, B. A comparative study using two SEM techniques on different samples sizes for determining factors of older employee´s motivation and satisfaction. Sustainability 2020, 12, 2189. [Google Scholar] [CrossRef] [Green Version]
  40. Tabachnick, G.B.; Fidell, L.S. Using Multivariate Statistics; Pearson: Boston, MA, USA, 2013. [Google Scholar]
  41. Hsu, P.-F.; Yen, H.R.; Chung, J.-C. Assessing ERP Post-Implementation Success at the Individual Level: Revisiting the Role of Service Quality. Inf. Manag. 2015, 52, 925–942. [Google Scholar] [CrossRef]
  42. Henseler, J.; Ringle, C.M.; Sinkovics, R.R. The use of Partial Least Squares Path Modeling in International Marketing. New Chall. Int. Mark. Adv. Int. Mark. 2009, 20, 277–319. [Google Scholar] [CrossRef]
  43. Hair, J.; Hult, G.T.M.; Ringle, C.M.; Sarstedt, M. A Primer on Partial Least Squares Structural Equation Modeling (PLS-SEM), 2nd ed.; SAGE Publications: Thousand Oaks, CA, USA, 2017. [Google Scholar]
  44. Fornell, C.; Larcker, D.F. Evaluating Structural Equation Models with Unobservable Variables and Measurements Errors. J. Mark. Res. 1981, 18, 39–50. [Google Scholar] [CrossRef]
  45. Hair, J.F.; Risher, J.J.; Sarstedt, M.; Ringle, C.M. When to use and how to report the results of PLS-SEM. Eur. Bus. Rev. 2019, 31, 2–24. [Google Scholar] [CrossRef]
  46. Ringle, C.M.; Wende, S.; Becker, J.-M. SmartPLS 3. SmartPLS GmbH: Boenningstedt. 2015. Available online: http://www.smartpls.com (accessed on 13 January 2020).
  47. Ramírez-Orellana, A.; Valls Martínez, M.D.C.; Grasso, M.S. Using Higher-Order Constructs to Estimate Health-Disease Status: The Effect of Health System Performance and Sustainability. Mathematics 2021, 9, 1228. [Google Scholar] [CrossRef]
  48. Chin, W.W. Issues and opinion on structural equation modeling. MIS Q. 1998, 22, 7–16. [Google Scholar]
  49. Hair, J.F.; Sarstead, M.; Ringle, C.M.; Mena, J.A. An assessment of the use of partial least squares structural equation modeling in marketing. J. Acad. Mark. Sci. 2012, 40, 414–433. [Google Scholar] [CrossRef]
  50. Chin, W.W. How to write up and report PLS analyses. In Handbook of Partial Least Squares: Concepts, Methods and Applications in Marketing and Related Fields (Springer Handbooks of Computational Statistics Series); Esposito, V.V., Chin, W.W., Henseler, J., Wang, H., Eds.; Springer: Berlin/Heidelberg, Germany, 2010; Volume II, pp. 655–690. [Google Scholar]
  51. Wold, H.O.A. Soft modeling: The basic design and some extensions. In Systems under Indirect Observation; Joreskog, K.G., Wold, H.O.A., Eds.; North-Holland: Amsterdam, The Netherlands, 1982; pp. 1–54. [Google Scholar]
  52. Kalinić, Z.; Marinković, V.; Djordjevic, A.; Liebana-Cabanillas, F. What drives customer satisfaction and word of mouth in mobile commerce services? A UTAUT2-based analytical approach. J. Enterp. Inf. Manag. 2020, 33, 71–94. [Google Scholar] [CrossRef]
  53. Haykin, S. Neural Networks: A Comprehensive Foundation; Prentice Hall: Englewood Cliffs, NJ, USA, 2001. [Google Scholar]
  54. Higueras-Castillo, E.; Kalinic, Z.; Marinkovic, V.; Liébana-Cabanillas, F. A mixed analysis of perceptions of electric and hybrid vehicles. Energy Policy 2020, 136, 111076. [Google Scholar] [CrossRef]
  55. Negnevitsky, M. Artificial Intelligence: A guide to Intelligent Systems, 3rd ed.; Pearson Education: Essex, UK, 2011. [Google Scholar]
  56. Foo, P.-Y.; Lee, V.-H.; Tan, G.W.-H.; Ooi, K.-B. A gateway tp realising sustainability performance via green supply chain management practicies: A PLS-ANN approach. Expert Syst. Appl. 2018, 107, 1–14. [Google Scholar] [CrossRef]
  57. Leong, L.-Y.; Hew, T.-S.; Ooi, K.-B.; Lee, V.-H.; Hew, J.J. A hybrid SEM-neural network analysis of social media addiction. Expert Syst. Appl. 2019, 133, 296–316. [Google Scholar] [CrossRef]
  58. Liebana-Cabanillas, F.; Marinkovic, V.; Ramos de Luna, I.; Kalinic, Z. Predicting the determinants of mobile payment acceptance: A hybrid SEM-neural network approach. Technol. Forecast. Soc. Chang. 2018, 129, 117–130. [Google Scholar] [CrossRef]
  59. Sharma, S.; Sharma, H.; Dwivedi, Y. A Hybrid SEM-Neural Network Model for Predicting Determinants of Mobile Payment Services. Inf. Syst. Manag. 2019, 36, 243–261. [Google Scholar] [CrossRef]
  60. Kalinić, Z.; Marinković, V.; Kalinić, L.J.; Liébana-Cabanillas, F. Neural network modeling of consumer satisfaction in mobile commerce: An empirical analysis. Expert Syst. Appl. 2021, 175, 114803. [Google Scholar] [CrossRef]
  61. Chong, A.Y.-L.; Liu, M.J.; Luo, J.; Ooi, K.-B. Predicting RFID adoption in healthcare supply chain from the perspective of users. Int. J. Prod. Econ. 2015, 159, 66–75. [Google Scholar] [CrossRef]
  62. Liébana-Cabanillas, F.; Singh, N.; Kalinic, Z.; Carvajal-Trujillo, E. Examining the determinants of continuance intention to use and the moderating effect of the gender and age of users of NFC mobile payments: A multi-analytical approach. Inf. Technol. Manag. 2021, 22, 133–161. [Google Scholar] [CrossRef]
  63. Pozon-Lopez, I.; Kalinic, Z.; Higueras-Castillo, E.; Liebana-Cabanillas, F. A multi-analytical approach to modeling of customer satisfaction and intention to use in Massive Open Online Courses (MOOC). Interact. Learn. Environ. 2020, 28, 1003–1021. [Google Scholar] [CrossRef]
  64. Sternad Zabukovšek, S.; Kalinić, Z.; Bobek, S.; Tominc, P. SEM-ANN based research of factors´ impact on extended use of ERP systems. Cent. Eur. J. Oper. Res. 2019, 27, 703–735. [Google Scholar] [CrossRef]
  65. Singh, S.; Singh, N.; Kalinić, Z.; Liébana-Cabanillas, F. Assessing determinants influencing continued use of live streaming services: An extended perceived value theory of streaming addiction. Expert Syst. Appl. 2021, 168, 114241. [Google Scholar] [CrossRef]
  66. Hancerliogullari Koksalmis, G.; Damar, S. Exploring the Adoption of ERP Systems: An Empirical Investigation of End-Users in an Emerging Country. In Industrial Engineering in the Big Data Era; Calisir, F., Cevikcan, E., Camgoz Akdag, H., Eds.; Lecture Notes in Management and Industrial Engineering; Springer: Cham, Switzerland, 2019; pp. 307–318. [Google Scholar]
  67. Huang, T.; Yasuda, K. Comprehensive review of literature survey articles on ERP. Bus. Process Manag. J. 2016, 22, 2–32. [Google Scholar] [CrossRef]
  68. Isnalita, S.N.A. ERP system adoption determinants. J. Ris. Akunt. Dan Bisnis Airlangga 2018, 3, 470–480. [Google Scholar] [CrossRef] [Green Version]
  69. Schlichter, B.R.; Kraemmergaard, P. A comprehensive literature review of the ERP research field over a decade. J. Enterp. Inf. Manag. 2010, 23, 486–520. [Google Scholar] [CrossRef]
  70. Bueno, S.; Salmeron, J.L. TAM-based success modelling in ERP. Interact. Comput. 2008, 20, 515–523. [Google Scholar] [CrossRef]
  71. Scholtz, B.; Mahmud, I.; Ramayah, T. Does usability matter? An analysis of the impact of usability on technology acceptance in ERP settings. Interdiscip. J. Inf. Knowl. Manag. 2016, 11, 309–330. [Google Scholar] [CrossRef] [Green Version]
  72. Calisir, F.; Gumussoy, C.A.; Bayram, A. Predicting the behavioural intention to use enterprise resource planning systems—An exploratory extension of the technology acceptance model. Manag. Res. News 2009, 32, 597–613. [Google Scholar] [CrossRef]
  73. Ajzen, I. The Theory of Planned Behavior. Organ. Behav. Hum. Decis. Process. 1991, 50, 179–211. [Google Scholar] [CrossRef]
  74. Fishbein, M.; Ajzen, I. Belief, Attitude, Intention, and Behavior: An Introduction to Theory and Research; Addison-Wesley: Reading, MA, USA, 1975. [Google Scholar]
  75. Davis, F.D. Perceived Usefulness, Perceived Ease of Use, and User Acceptance of Information Technology. MIS Q. 1989, 13, 319–340. [Google Scholar] [CrossRef] [Green Version]
  76. Davis, F.D.; Bagozzi, R.P.; Warshaw, P.R. User acceptance of computer technology: A comparison of two theoretical models. Manag. Sci. 1989, 35, 982–1003. [Google Scholar] [CrossRef] [Green Version]
  77. Rogers, E. Diffusion of Innovations, 4th ed.; The Free Press: New York, NY, USA, 2003. [Google Scholar]
  78. Tornatzky, L.; Fleisher, M. The Process of Technology Innovation; Lexington Books: Lexington, MA, USA, 1990. [Google Scholar]
  79. Venkatesh, V.; Morris, M.G.; Davis, G.B.; Davis, F.D. User acceptance of information technology: Toward a unified view. MIS Q. 2003, 27, 425–479. [Google Scholar] [CrossRef] [Green Version]
  80. Venkatesh, V.; Thong, J.; Xu, X. Consumer Acceptance and Use of Information Technology: Extending the Unified Theory of Acceptance and Use of Technology. MIS Q. 2012, 36, 157–178. [Google Scholar] [CrossRef] [Green Version]
  81. Awa, H.O.; Ukoha, O.; Emecheta, B.C. Using T-O-E theoretical framework to study the adoption of ERP solutions. Cogent Bus. Manag. 2016, 3, 1–23. [Google Scholar] [CrossRef]
  82. Sun, Y.; Bhattacherjee, A.; Ma, Q. Extending Technology Usage to Work Settings: The Role of Perceived Work Compatibility in ERP Implementation. Inf. Manag. 2009, 46, 351–356. [Google Scholar] [CrossRef]
  83. Mayeh, M.; Ramayah, T.; Mishra, A. The Role of Absorptive Capacity, Communication and Trust in ERP Adoption. J. Syst. Softw. 2016, 119, 58–69. [Google Scholar] [CrossRef]
  84. Sternad Zabukovšek, S.; Shah Bharadwaj, S.; Bobek, S.; Štrukelj, T. Technology acceptance model-based research on differences of enterprise resources planning systems use in India and the European Union. Eng. Econ. 2019, 30, 326–338. [Google Scholar] [CrossRef] [Green Version]
  85. Shih, Y.Y.; Huang, S.S. The actual usage of ERP systems: An extended technology acceptance perspective. J. Res. Pract. Inf. Technol. 2009, 41, 263–276. [Google Scholar] [CrossRef]
  86. Youngberg, E.; Olsen, D.; Hauser, K. Determinants of professionally autonomous end user acceptance in an enterprise resource planning system environment. Int. J. Inf. Manag. 2009, 29, 138–144. [Google Scholar] [CrossRef]
  87. Erasmus, E.; Rothmann, S.; Van Eeden, C. A structural model of technology acceptance. SA J. Ind. Psychol. 2015, 41, 1–12. [Google Scholar] [CrossRef]
  88. Klaus, T.; Changchit, C. Sandbox Environments in an ERP System Context: Examining User Attitude and Satisfaction. Electron. J. Inf. Syst. Eval. 2020, 23, 34–44. [Google Scholar] [CrossRef]
  89. Putri, A.D.; Lubis, M.; Azizah, A.H. Analysis of Critical Success Factors (CSF) in Enterprise Resource Planning (ERP) Implementation using Extended Technology Acceptance Model (TAM) at Trading and Distribution Company. In Proceedings of the 4rd International Conference on Electrical, Telecommunication and Computer Engineering (ELTICOM), Medan, Indonesia, 3–4 September 2020. [Google Scholar]
  90. Grandón, E.E.; Díaz-Pinzón, B.; Magal, S.R.; Rojas-Contreras, K. Technology Acceptance Model Validation in an Educational Context: A Longitudinal Study of ERP System Use. J. Inf. Syst. Eng. Manag. 2021, 6, em0134. [Google Scholar] [CrossRef]
  91. Hancerliogullari Koksalmis, G.; Damar, S. An Empirical Evaluation of a Modified Technology Acceptance Model for SAP ERP System. Eng. Manag. J. 2021, 1–16. [Google Scholar] [CrossRef]
  92. Venkatesh, V.; Davis, F.D. A Theoretical Extension of the Technology Acceptance Model: Four Longitudinal Field Studies. Manag. Sci. 2000, 46, 186–205. [Google Scholar] [CrossRef] [Green Version]
  93. Venkatesh, V. User Acceptance of Information Technology: A Unified View. Ph.D. Dissertation, University of Minnesota, Minneapolis, MN, USA, 1998. Unpublished. [Google Scholar]
  94. Venkatesh, V.; Bala, H. Technology acceptance model 3 and a research agenda on interventions. Decis. Sci. 2008, 39, 273–315. [Google Scholar] [CrossRef] [Green Version]
  95. Hsieh, J.J.P.A.; Wang, W. Explaining Employees’ Extended Use of Complex Information Systems. Eur. J. Inf. Syst. 2007, 16, 216–227. [Google Scholar] [CrossRef] [Green Version]
  96. Scott, J.E.; Walczak, S. Cognitive Engagement with a Multimedia ERP Training Tool: Assessing Computer Self-Efficacy and Technology Acceptance. Inf. Manag. 2009, 46, 221–232. [Google Scholar] [CrossRef]
  97. Saeed, K.A.; Abdinnour-Helm, S. Examining the Effects of Information System Characteristics and Perceived Usefulness on Post Adoption Usage of Information Systems. Inf. Manag. 2008, 45, 376–386. [Google Scholar] [CrossRef]
  98. Hiraoka, C. Technology Acceptance of Connected Services in the Automotive Industry; Gabler Springer Science and Business Media: Wuesbaden, Germany, 2007. [Google Scholar]
  99. Karaali, D.; Gumussoy, C.A.; Calisir, F. Factors affecting the intention to use a web-based learning system among blue-collar workers in the automotive industry. Comput. Hum. Behav. 2011, 27, 343–354. [Google Scholar] [CrossRef]
  100. Calisir, F.; Altin Gumussoy, C.; Bayraktaroglu, A.E.; Karaali, D. Predicting the intention to use a web-based learning system: Perceived content quality, anxiety, perceived system quality, image, and the technology acceptance model. Hum. Factors Ergon. Manuf. 2014, 24, 515–531. [Google Scholar] [CrossRef]
  101. Ercsey, I. The Examination of the Corporate Governance System at Supplier Companies: Empirical Evidence from Hungarian Automotive Industry. J. Compet. 2016, 8, 70–86. [Google Scholar] [CrossRef] [Green Version]
  102. Jetter, J.; Eimecke, J.; Rese, A. Augmented reality tools for industrial applications: What are potential key performance indicators and who benefits? Comput. Hum. Behav. 2018, 87, 18–33. [Google Scholar] [CrossRef]
  103. Müller, J.M. Comparing technology acceptance for autonomous vehicles, battery electric vehicles, and car sharing-A study across Europe, China, and North America. Sustainability 2019, 11, 4333. [Google Scholar] [CrossRef] [Green Version]
  104. Cohen, J. Statistical Power Analysis for the Behavioral Sciences; Lawrence Erlbaum: Mahwah, NJ, USA, 1988. [Google Scholar]
  105. Alharbi, A.; Sohaib, O. Technology Readiness and Cryptocurrency Adoption: PLS-SEM and Deep Learning Neural Network Analysis. IEEE Access 2021, 9, 21388–21394. [Google Scholar] [CrossRef]
  106. Lee, V.-H.; Hew, J.-J.; Leong, L.-Y.; Tan, G.W.-H.; Ooi, K.-B. Wearable payment: A deep learning-based dual-stage SEM-ANN analysis. Expert Syst. Appl. 2020, 157, 113477. [Google Scholar] [CrossRef]
  107. Hew, J.-J.; Leong, L.-Y.; Tan, G.W.-H.; Lee, V.-H.; Ooi, K.-B. Mobile social tourism shopping: A dual-stage analysis of a multimediation model. Tour. Manag. 2018, 66, 121–139. [Google Scholar] [CrossRef]
  108. Mei, B.; Brown, G.T.L.; Teo, T. Toward an understanding of preservice english as a foreign language teachers’ acceptance of computer-assisted language learning 2.0 in the People’s republic of China. J. Educ. Comput. Res. 2018, 56, 74–104. [Google Scholar] [CrossRef]
  109. Sánchez-Mena, A.; Martí-Parreño, J.; Aldás-Manzano, J. Teachers’ intention to use educational video games: The moderating role of gender and age. Innov. Educ. Teach. Int. 2019, 56, 318–329. [Google Scholar] [CrossRef]
  110. Scherer, R.; Tondeur, J.; Siddiq, F.; Baran, E. The importance of attitudes toward technology for pre-service teachers’ technological, pedagogical, and content knowledge: Comparing structural equation modelling approaches. Comput. Hum. Behav. 2018, 80, 67–80. [Google Scholar] [CrossRef] [Green Version]
  111. Sternad Zabukovšek, S.; Picek, R.; Bobek, S.; Šišovska, I.; Tominc, P. Technology acceptance model based study of students’ attitudes toward use of enterprise resource planning solutions. J. Inf. Organ. Sci. 2019, 43, 49–71. [Google Scholar] [CrossRef]
  112. Sternad Zabukovšek, S.; Štrukelj, T.; Tominc, P.; Bobek, S. Factors influencing attitudes of students toward ERP systems as computer-aided learning environments. In Handbook of Research on Enhancing Innovation in Higher Education Institutions; Babić, V., Nedelko, Z., Eds.; IGI Global: Hershey, PA, USA, 2020; pp. 485–522. [Google Scholar]
  113. Li, Y.; He, T.; Song, Y.; Yang, Z.; Zhou, R. Factors impacting donors’ intention to donate to charitable crowd-funding projects in china: A UTAUT-based model. Inf. Commun. Soc. 2018, 21, 404–415. [Google Scholar] [CrossRef]
Figure 1. Example of the SEM model.
Mathematics 10 01379 g001
Figure 2. An example of MLP ANN.
Mathematics 10 01379 g002
Figure 5. An example of an ANN model—Model 1.
Mathematics 10 01379 g005
Table 1. Number of responses per country.
CountryAll Users *% of Users
per Country
Frequency in the SampleRelative Frequency in the Sample
Slovenia55764.77%14167.79%
Croatia19622.79%4823.08%
Bosnia and Herzegovina9410.93%167.69%
Republic of Serbia131.51%31.44%
Total860100.00%208100.00%
* in a multinational group of manufacturing companies in the automotive industry
Table 2. Descriptive statistics of respondents’ characteristics.
CharacteristicsFrequencyRelative Frequency
Gender
Female5727.4%
Male15172.6%
Age
20–29167.7%
30–396229.8%
40–497435.5%
>505627.0%
Table 8. cv-redundancy (Q2) and cv-communality (H2) indices.
ConstructH2Q2
PCIL: Personal Innovativeness0.4560.559
PCIL: Computer Anxiety0.4270.353
PCIL0.250
STC: ERP Data Quality (Content)0.5970.582
STC: System Performance0.5110.504
STC: User Manuals (Help)0.5760.38
STC: System Functionality0.6040.396
STC0.432
OPC: Business Processes Fit0.6400.454
OPC: ERP Support0.2960.533
OPC: ERP Communication0.3220.504
OPC0.342
PU0.8300.547
PEOU0.4560.32
WC0.6110.403
AT0.4480.437
ExU0.5580.217
Table 9. ANOVA Test of Linearity.
Sum of SquaresdfMean SquareFSig.Deviation from Linearity
WC × OPC1.275350.0361.2420.184NO
WC × PCIL0.842210.0400.8770.621NO
WC × STC2.000550.0361.1080.310NO
PU × STC2.217550.0401.0380.419NO
PU × WC0.379170.0220.9620.503NO
AT × WC0.864170.0512.9220.000YES
AT × PU0.249100.0250.9030.531NO
ExU × WC0.809170.0481.2370.239NO
ExU × AT0.841110.0761.8080.055NO
Table 10. RMSE values of ANN model.
ANNModel 1
Inputs: OPC, PCIL, STC;
Output: WC
Model 2
Inputs: STC, WC; Output: PU
Model 3
Inputs: WC, PU;
Output: AT
Model 4
Inputs: WC, AT;
Output: ExU
TrainingTestingTrainingTestingTrainingTestingTrainingTesting
10.13200.09150.10490.13110.10660.09780.13440.1327
20.11410.10400.11000.10530.09970.10890.13290.1225
30.11910.11590.12540.09830.12960.06730.13110.1499
40.11130.12400.11270.09260.09880.08050.16010.1309
50.11640.09340.10910.10490.10220.07370.13220.1189
60.11240.10950.10750.11460.09370.12340.13120.1306
70.11140.14860.10750.11250.09880.08190.13560.1338
80.11780.10400.11050.08810.10380.08400.13430.1246
90.11620.07840.11000.10650.09750.10790.13090.1290
100.11630.09570.10930.09900.09840.08800.13140.1237
Mean0.11670.10650.11070.10530.10290.09130.13540.1297
St. dev.0.00600.01970.00560.01230.01000.01770.00880.0086
Table 11. Neural network sensitivity analysis.
NetworkModel 1
Relative Importance
Model 2
Relative Importance
Model 3
Relative Importance
Model 4
Relative Importance
OPCPCILSTCSTCWCWCPUWCAT
10.4980.0720.430.2420.7580.5680.4320.6660.334
20.390.2080.4020.2140.7860.7780.2220.710.29
30.5290.1520.320.2630.7370.5470.4530.6080.392
40.4710.1210.4080.3980.6020.9550.0450.5880.412
50.4510.1170.4330.2180.7820.7590.2410.690.31
60.560.1490.2910.2960.7040.8720.1280.7370.263
70.5030.020.4780.2370.7630.9460.0540.6370.363
80.4260.0680.5060.3210.6790.6830.3170.7460.254
90.4990.1860.3150.2850.7150.9140.0860.7160.284
100.5290.010.4610.3180.6820.9070.0930.7240.276
Average Importance0.4860.1100.4040.2790.7210.7930.2070.6820.318
Normalized Importance (%)100.022.783.338.7100.0100.026.1100.046.6
Publisher’s Note: MDPI stays neutral with regard to jurisdictional claims in published maps and institutional affiliations.

