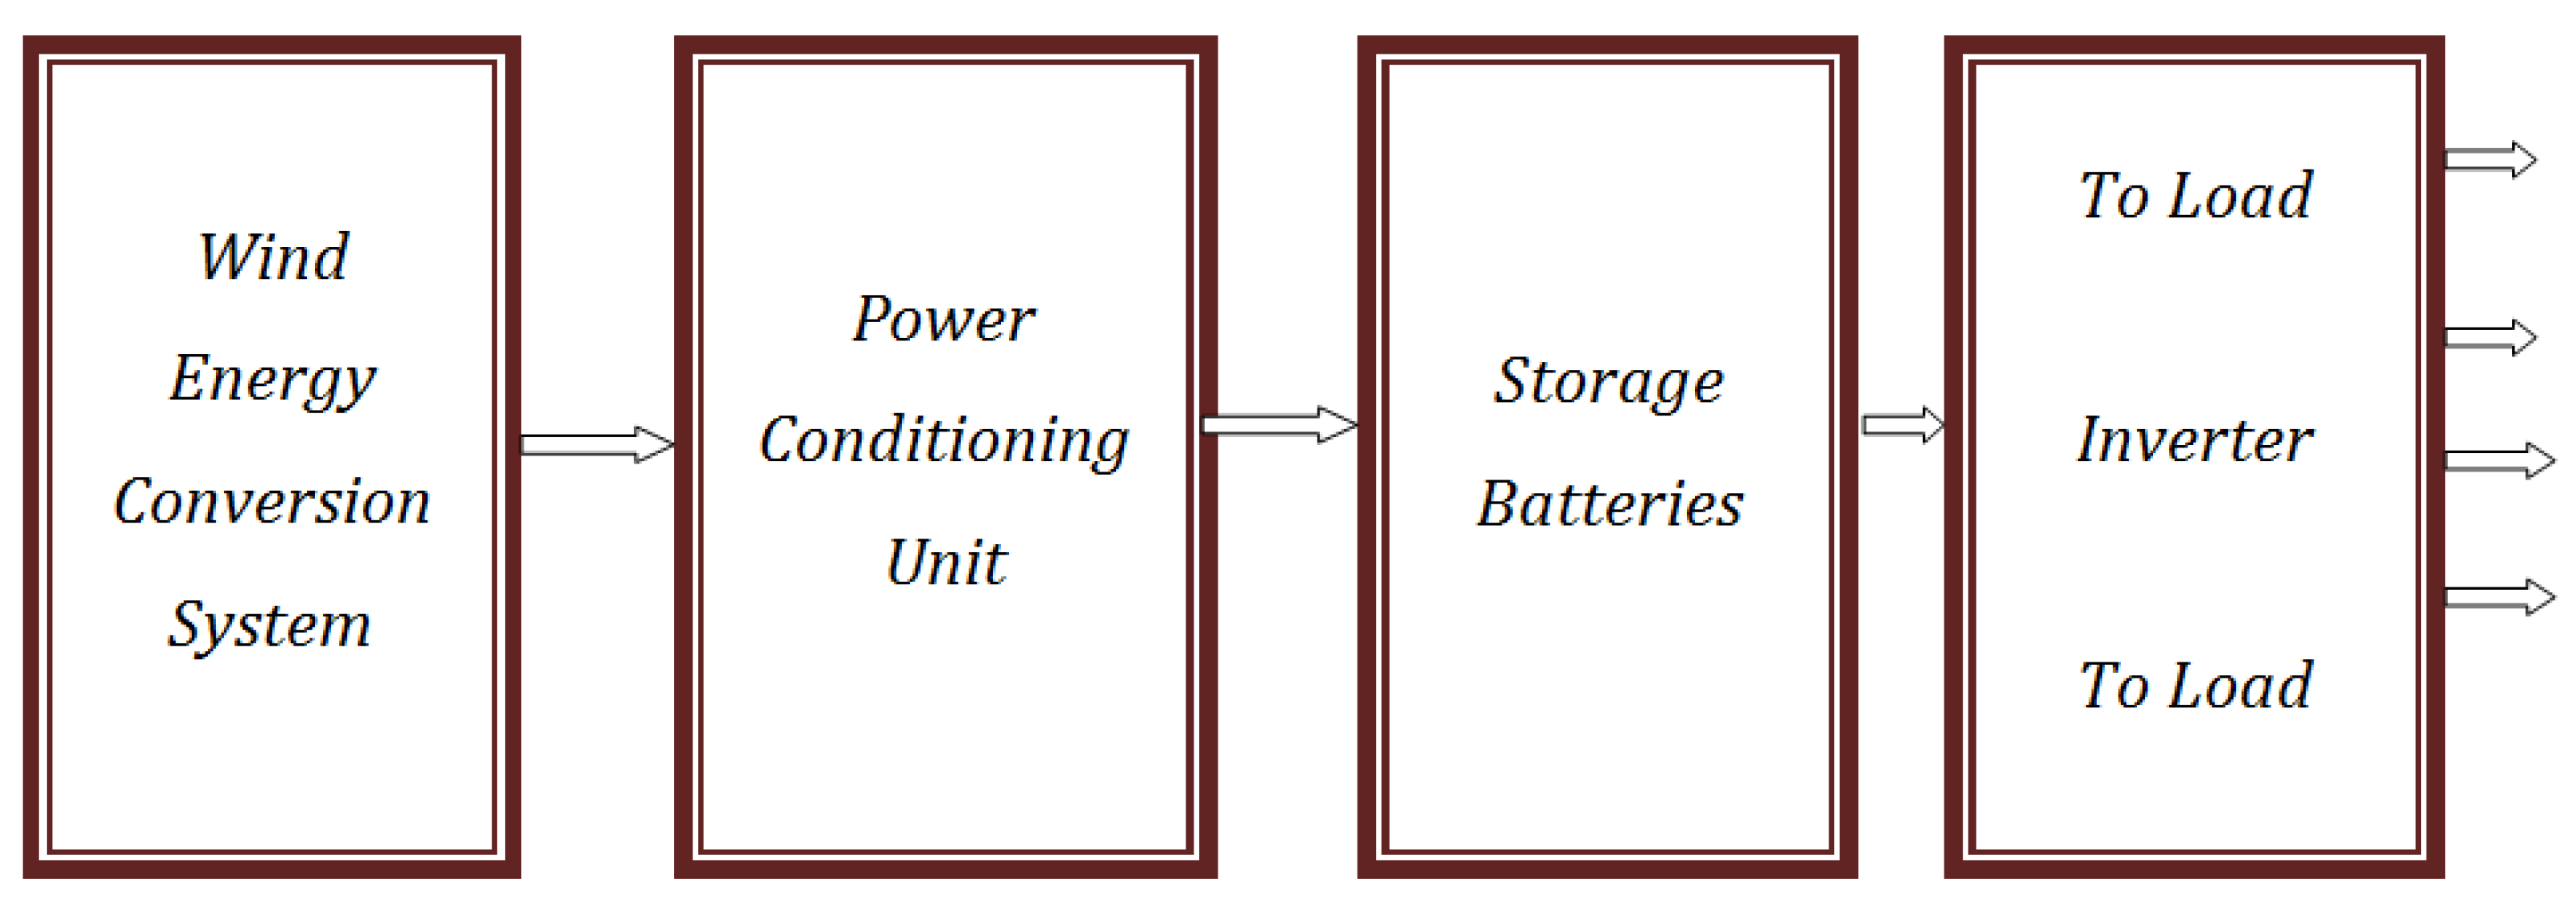
Article

Impact of Renewable Energy Sources into Multi Area Multi-Source Load Frequency Control of Interrelated Power System

by
Krishan Arora
1,2,†,
Ashok Kumar
2,
Vikram Kumar Kamboj
1,3,
Deepak Prashar
4,
Bhanu Shrestha
5,* and
Gyanendra Prasad Joshi
6,*,†
1
School of Electronics and Electrical Engineering, Lovely Professional University, Phagwara, Punjab 144411, India
2
Department of Electrical Engineering, Maharishi Markandeshwar University Mullana, Haryana 133207, India
3
Department of Electrical and Computer Engineering, Schulich School of Engineering, University of Calgary, Calgary, AB T2N 1N4, Canada
4
School of Computer Science and Engineering, Lovely Professional University, Phagwara, Punjab 144411, India
5
Department of Electronic Engineering, Kwangwoon University, Seoul 01897, Korea
6
Department of Computer Science and Engineering, Sejong University, Seoul 05006, Korea
*
Authors to whom correspondence should be addressed.
These authors contributed equally to this work.
Submission received: 21 December 2020 / Revised: 12 January 2021 / Accepted: 14 January 2021 / Published: 18 January 2021

Abstract

:
There is an increasing concentration in the influences of nonconventional power sources on power system process and management, as the application of these sources upsurges worldwide. Renewable energy technologies are one of the best technologies for generating electrical power with zero fuel cost, a clean environment, and are available almost throughout the year. Some of the widespread renewable energy sources are tidal energy, geothermal energy, wind energy, and solar energy. Among many renewable energy sources, wind and solar energy sources are more popular because they are easy to install and operate. Due to their high flexibility, wind and solar power generation units are easily integrated with conventional power generation systems. Traditional generating units primarily use synchronous generators that enable them to ensure the process during significant transient errors. If massive wind generation is faltered due to error, it may harm the power system’s operation and lead to the load frequency control issue. This work proposes binary moth flame optimizer (MFO) variants to mitigate the frequency constraint issue. Two different binary variants are implemented for improving the performance of MFO for discrete optimization problems. The proposed model was evaluated and compared with existing algorithms in terms of standard testing benchmarks and showed improved results in terms of average and standard deviation.

1. Introduction

Renewable energy sources (RESs) and especially wind technology are treated to be the most effective viable technology due to their environmental blessings, and their value of procedure and servicing have declined considerably within a few years. Hybrid plants secure the stability of supply commixture various sustainable energy resources like photovoltaic, wind generators, and even diesel generator sets (DGs) used for back-up purposes [1]. Therefore, grid connection of those together with traditional plants is adopted because of enhanced behavior with respect to effective load. It is ascertained that variation in frequency is induced because fluctuation in load is low, strengthening the insertion of inexhaustible resources. Load frequency control (LFC), in addition to the Proporional Integral Derivative (PID) controller [2,3] is suggested to overcome frequency inconsistency for a power system involving wind, hydro, and thermal units due to load and generating power variation induced due to the insertion of inexhaustible resources [4,5]. A system comprising thermal plants, hydro plants, and wind power plants will be designed with the help of MATLAB [6].
Our contributions in this paper are as follows: First, we recommend the two alternatives of binary moth flame optimizers to unravel the frequency restriction matter. We put into practice two diverse binary alternates for civilizing moth flame optimizer (MFO) behavior for distinct optimization tribulations [7]. In the primary variant, i.e., binary moth flame optimizer (BMFO1), coin flipping-based assortment probability of binary statistics is applicable. We applied the superior sigmoid transformation in the subsequent variant known as BMFO2. Along with Harris hawks optimizer (HHO) algorithms, these advanced algorithms are veteran and examined for a variety of unilateral, bilateral, and contract violation optimization problems. Secondly, Section 2 explores the impact of renewable energy sources on the load frequency control problem. Section 3 depicts the load frequency control issue’s mathematical behavior when integrated with a renewable energy source. Section 4 shows the transfer function model of the multiarea multisource power system integrated with a renewable energy source. Lastly, in Section 5, all these algorithms are estimated and evaluated in conditions of typical testing benchmarks in which the projected HHO model has superior consequences with regards to mean and standard deviation. Finally, Section 6 winds up the paper.

2. Impact of Renewable Energy Sources

Renewable energy sources (RESs) definitely disturb the vibrant performance of the power system in such a manner that may be diverse from predictable generating units. Traditional generating units primarily use synchronous generators that enable them to ensure the process during major transient errors. If, due to error, a massive amount of wind generation is faltered, then the adverse influence of that error on the power system’s operation with the LFC issue could also be expanded. High penetration of renewable energy in control arrangement may raise some reservations during the irregular procedure. It familiarizes numerous technical implications and exposes significant questions regarding what happens to LFC requirement [8,9] after the addition of various RESs to the present production system and whether the outdated mechanism methodologies are sufficient to operate in a fresh situation.
The influence on optimal flow of power, voltage, and management of frequency, power quality, and structure economics are increased due to the addition of RESs into control system grids. According to the behavior of RES power deviation, the impression on the LFC concern has involved rising research attention throughout the last era [10,11,12]. Substantial interrelated frequency fluctuations can cause over- or underfrequency transmitting and remove certain generations and loads. Under opposed situations, this may affect a dropping disappointment and miscarriage of the system. Figure 1 shows the block diagram of a wind energy generation system [13].

2.1. Advanced Optimization Methods

Optimization plays a major role in many fields of engineering. It is a path in which a suitable reaction to an exceptional matter is exposed via a search tool [14]. By means of upgradation in expertise, the novel creation of the matter fortitude optimization approach identified as metaheuristic has been used to deliberate mathematical humanity. Metaheuristic algorithms (MA) impersonate a systematic way to obtain the finest consequences for adilemma. MA act as a fantasy search for a good stipulation in an optimization concern [15]. In this paper, three advanced optimization techniques, BMFO1, BMFO2, and HHO, are considered and compared with conventional methods.

2.1.1. Binary Moth Flame Optimizer (BMFO1)

The basic MFO is a nature-inspired heuristic search technique that imitates moths’ navigational possessions about artificial lights. BMFO1 is a recently predictable metaheuristics search algorithm proposed by Mirjalili [16], which is re-energized by navigation actions of moth and their meeting close to the beam. It helps to recover the exploitation search of the moths and diminish the quantity of flames. Even if moths have a tough potential to sustain a protected loom with respect to the moon and grip a bearable assembly for traveling in a traditional scratch for broad remoteness. They are also caring in a serious/inoperative bowed pathway over a replicated source of illumination.

2.1.2. Modified SIGMOID Transformation (BMFO2)

The binary calibration of stable quest accommodation and spaces of investigating council, resolution to binary searching domicile could be obligatory for optimizing binary ecological issues such as LFC. A modified sigmoidal transfer function is assumed in the projected work, which has better presentation than any more substitute of it as shown in [17]. Basic moth flame optimizer applied with the modified sigmoidal transformation (BMFO2) is used to carry out the binary chart of actual moth value and flame location for fixing the LFC problem.

2.1.3. Harris Hawks Optimizer

HHO [17,18] is a gradient-free and population-centered algorithm containing unfair and investigative steps for wonder swoop, the fauna of prey assessment, and assorted ploy built on brutal speculation of Harris hawks.

3. LFC Model with Integration of Renewable Energy Source

When renewable energy sources are integrated into the power arrangement, a supplementary cause of the deviation is added to the arrangement’s adjustable behavior. To examine the deviations triggered by renewable energy source plants, the entire conclusion is significant, and every modification in renewable energy source output power does not requisite to be accorded with the conversion in other generating units running in the opposite way [19,20]. Sudden variations in load and renewable energy source output power might intensify each other either completely or partially. However, the sluggish renewable energy source power instability and entire average power fluctuation adversely subsidize power inequity and frequency distribution, which could be considered for the LFC arrangement. This energy variation must comprise a predictable LFC arrangement [21].
A general LFC model integrated with renewable energy source [22,23] is shown in Figure 2 in which the conforming blocks for governor dead-band, Generation Rate Constraints (GRC), and time delays are not involved. In this model, altered parametric standards are used for generator regulation and for turbine-governor to shelter the diversity of production categories in the control area. The expressed components and blocks are defined as follows: ΔPm is mechanical power, Δf is frequency deviation, ΔPL is load disturbance, ΔPC is supplementary frequency control action, DSys is equivalent damping coefficient, HSys is equivalent inertia constant, βis frequency bias, αi is participation factor, Riis drooping characteristic, ΔPP is primary frequency control action, ΔPRESis renewable energy source power fluctuation, Mi(s) is a governor-turbine model, ACEis area control error [24], and finally, ΔP′L and ΔP′tie are amplified local load alteration and tie-line power vacillation signals, respectively.
In the revised LFC structure, the efficient ACE signal must signify the influences of renewable energy on planned stream over tie-line and local power variation through area frequency. The ACE signal is conventionally described as a linear amalgamation of tie-line power and frequency fluctuations as follows [25,26]:
ACE = B Δ f + Δ P tie
In the conventional power system, ΔPtie(ΔPtieC) is a deviation between actual and scheduled energy flow over the tie-lines.
Δ P tie C = ( P tie , actual P tie , Scheduled )
The difference among the updated LFC model in Figure 2 and the conventional one provides two new signals which represent the transient behavior of RESs on tie-line power and local load variations (ΔP′L, ΔP′tie−RES):
Δ P L ( s ) = Δ P RES ( s ) Δ P L ( s )
Δ P tie RES =   ( Δ P tie RES , actual Δ P tie RES , Scheduled )
After adding a substantial amount of renewable power to the conventional power flow of tie-lines (ΔPtieC) in the power system, the updated renewable energy source power via tie-lines (ΔPtieRES) must be painstaking. Consequently, the restructured tie-line power fluctuation can be articulated as follows:
Δ P tie =   Δ P tie C +   Δ P tie RES = ( Δ P tie C , actual Δ P tie C , Scheduled ) + ( Δ P tie RES , actual Δ P tie RES , Scheduled )
The entire renewable energy source power flow modification is generally smoother as compared to fluctuation in influences from personal renewable energy source elements. Using Equations (1) and (5), the restructured ACE signal can be accomplished by Equation (6):
ACE = B Δ f + Δ P tie = B Δ f +   ( ( Δ P tie C , actual Δ P tie C , Scheduled ) + ( Δ P tie RES , actual Δ P tie RES , Scheduled ) )
where Ptie-C,actual is actual conventional tie-line, Ptie-C,scheduled is scheduled conventional tie-line, Ptie-RES,actual is actual renewable energy source tie-line, and Ptie-RES,scheduled is scheduled renewable energy source tie-line powers.
To justify the investigation part of the expected algorithm, various conventional as well as advanced optimization techniques such as Particle Swarm Optimization (PSO), MFO, BMFO1, BMFO2, and HHO were compared in terms of best value, worst value, mean and standard deviation. The different gain values for various algorithms for multiarea modal were also compared. Table 1 presents the performance of various algorithms in the proposed system and Table 2 depicts the Proportional Controller (PI) controller’s gain values for various algorithms.

4. Transfer Function Model Multi Area Multi-Source Hydro-Thermal System with Wind Power Plant

The transfer function model of the hydro and thermal generating unit has been derived. The tie-line combines them in two methods, namely two-area, which is conventional, and then multiarea with renewable energy source, a new concept. On analyzing, the thermal system, when exposed to unit step load disturbance of 0.01 per unit in Area1 alone, the area frequency and the tie-line energy oscillates and settles with offset. The offset can be removed by including a secondary controller, which varies the governor’s power reference setting. An optimal secondary controller is to be developed for the effective operation of the hydro–thermal power system integrated with renewable energy sources like wind energy.

5. Results and Discussion

Sensitivity analysis with respect to frequency variations, fault in tie-line, actual power flow, and output reaction of dissimilar generators after instant load fluctuation in the planned structure in terms of dispersion of wind under various contracts, such as unilateral, bilateral, and contract-violation case have been publicized in Figure 2.

5.1. Unilateral Transaction

The simulations with penetration of wind have been achieved to check the expected reaction of power scheme with respect to area frequency, power flow among interrelated areas, and the reaction of generating units through an unexpected load modification state in terms of expected agreements of the decontrolled electricity market as shown in Figure 3, Figure 4, Figure 5, Figure 6, Figure 7 and Figure 8.
Dynamic response of Area1 frequency with respect to time in seconds with various controllers like conventional, PSO, MFO, BMFO1, BMFO2, and HHO under unilateral contract are compared in Figure 3 and Table 3. The comparative outcomes obtained show improved results of the HHO controller with delay time 0.8633 s and settling time of 19.8 s.
Dynamic response of Area2 frequency with respect to time in seconds with various controllers like conventional, PSO, MFO, BMFO1, BMFO2, and HHO under unilateral contract are compared in Figure 4 and Table 4. The comparative outcomes obtained show improved results of the HHO controller with delay time 1.297 s and settling time of 20.86 s.
Dynamic response of deviation in actual tie-line power flow with respect to time in seconds with various controllers like conventional, PSO, MFO, BMFO1, BMFO2, and HHO under unilateral contract are compared in Figure 5 and Table 5. The comparative outcomes obtained show improved results of the HHO controller with delay time 0.162 s and settling time of 20.86 s.
Dynamic response of deviation in tie-line error with respect to time in seconds with various controllers like conventional, PSO, MFO, BMFO1, BMFO2, and HHO under unilateral contract are compared in Figure 6 and Table 6. The comparative outcomes obtained show improved results of the HHO controller with delay time 1.157 s and settling time of 19.8 s [27].
Dynamic response of Generation Companies (GENCOs) generation of Area1 with respect to time in seconds with various controllers like conventional, PSO, MFO, BMFO1, BMFO2, and HHO under unilateral contract are compared in Figure 7 and Table 7. The comparative outcomes obtained show improved results of the HHO controller with delay time 3.335 s and settling time of 20.86 s.
Dynamic response of GENCOs generation of Area2 with respect to time in seconds with various controllers like conventional, PSO, MFO, BMFO1, BMFO2, and HHO under unilateral contract are compared in Figure 8 and Table 8. The comparative outcomes obtained show improved results of the HHO controller with delay time 0.695 s and settling time of 19.8 s.

5.2. Bilateral Based Transaction

The various dynamic responses with penetration of wind in mutual areas and the tie line are shown in Figure 9, Figure 10, Figure 11, Figure 12, Figure 13 and Figure 14.
Dynamic response of Area1 frequency with respect to time in seconds with various controllers like conventional, PSO, MFO, BMFO1, BMFO2, and HHO under bilateral contract are compared in Figure 9 and Table 9. The comparative outcomes obtained show improved results of the HHO controller with delay time −0.835 s and settling time of 20.86 s.
Dynamic response of Area2 frequency with respect to time in seconds with various controllers like conventional, PSO, MFO, BMFO1, BMFO2, and HHO under Bilateral Contract are compared in Figure 10 and Table 10. The comparative outcomes obtained show improved results of the HHO controller with delay time = 0.0023 s and settling time of 20.86 s.
Dynamic response of deviation in actual tie-line power flow with respect to time in seconds with various controllers like Conventional, PSO, MFO, BMFO1, BMFO2, and HHO under Bilateral Contract are compared in Figure 11 and Table 11. The comparative outcomes obtained show improved results of the HHO controller with delay time 0.0029 s and settling time of 20.86 s.
Dynamic response of Deviation in tie-line error with respect to time in seconds with various controllers like Conventional, PSO, MFO, BMFO1, BMFO2, and HHO under Bilateral Contract are compared in Figure 12 and Table 12. The comparative outcomes obtained show improved results of the HHO controller with delay time 1.276 s and settling time of 19.8 s.
Dynamic response of GENCOs to DISCOs generation of Area-1 with respect to time in seconds with various controllers like Conventional, PSO, MFO, BMFO1, BMFO2, and HHO under Bilateral Contract are compared in Figure 13 and Table 13a. The comparative outcomes obtained show improved results of the HHO controller with delay time 3.006 s and settling time of 20.86 s.
Dynamic response of Distribution Companies (DISCOs) to GENCOs generation of Area1 with respect to time in seconds with various controllers like conventional, PSO, MFO, BMFO1, BMFO2, and HHO under bilateral contract are compared in Figure 13 and Table 13b. The comparative outcomes obtained show improved results of the HHO controller with delay time 4.224 s and settling time of 19.8 s.
Dynamic response of GENCOs to DISCOs generation of Area2 with respect to time in seconds with various controllers like conventional, PSO, MFO, BMFO1, BMFO2, and HHO under bilateral contract are compared in Figure 14 and Table 14a. The comparative outcomes obtained show improved results of the HHO controller with delay time 2.506 s and settling time of 20.86 s.
Dynamic response of DISCOs to GENCOs generation of Area2 with respect to time in seconds with various controllers like conventional, PSO, MFO, BMFO1, BMFO2, and HHO under bilateral contract are compared in Figure 14 and Table 14b. The comparative outcomes obtained show improved results of the HHO controller with delay time 5.564 s and settling time of 19.8 s.

5.3. Contract Violation Case

The various dynamic responses with penetration of wind energy in two areas and the tie-line are represented in Figure 15, Figure 16, Figure 17, Figure 18, Figure 19 and Figure 20.
Dynamic response of Area1 frequency with respect to time in seconds with various controllers like conventional, PSO, MFO, BMFO1, BMFO2, and HHO under contract violation case are compared in Figure 15 and Table 15. The comparative outcomes obtained show improved results of the HHO controller with delay time −0.835 s and settling time of 20.86 s.
Dynamic response of Area2 frequency with respect to time in seconds with various controllers like conventional, PSO, MFO, BMFO1, BMFO2, and HHO under contract violation case are compared in Figure 16 and Table 16. The comparative outcomes obtained show improved results of the HHO controller with delay time 0.0023 s and settling time of 20.86 s.
Dynamic response of deviation in actual tie-line power flow with respect to time in seconds with various controllers like conventional, PSO, MFO, BMFO1, BMFO2, and HHO under contract violation case are compared in Figure 17 and Table 17. The comparative outcomes obtained show improved results of the HHO controller with delay time 0.0029 s and settling time of 20.86 s.
Dynamic response of deviation in tie-line error with respect to time in seconds with various controllers like conventional, PSO, MFO, BMFO1, BMFO2, and HHO under contract violation case are compared in Figure 18 and Table 18. The comparative outcomes obtained show improved results of the HHO controller with delay time 1.276 s and settling time of 19.8 s.
Dynamic response of GENCOs to DISCOs generation of Area1 with respect to time in seconds with various controllers like conventional, PSO, MFO, BMFO1, BMFO2, and HHO under contract violation case are compared in Figure 19 and Table 19a. The comparative outcomes obtained show improved results of the HHO controller with delay time 3.006 s and settling time of 20.86 s.
Dynamic response of DISCOs to GENCOs generation of Area1 with respect to time in seconds with various controllers like conventional, PSO, MFO, BMFO1, BMFO2, and HHO under contract violation case are compared in Figure 19 and Table 19b. The comparative outcomes obtained show improved results of the HHO controller with delay time 4.224 s and settling time of 19.8 s.
Dynamic response of GENCOs to DISCOs generation of Area1 with respect to time in seconds with various controllers like conventional, PSO, MFO, BMFO1, BMFO2, and HHO under contract violation case are compared in Figure 20 and Table 20a. The comparative outcomes obtained show improved results of the HHO controller with delay time 2.506 s and settling time of 20.86 s.
Dynamic response of DISCOs to GENCOs generation of Area1 with respect to time in seconds with various controllers like conventional, PSO, MFO, BMFO1, BMFO2, and HHO under contract violation case are compared in Figure 20 and Table 20b. The comparative outcomes obtained show improved results of the HHO controller with delay time 5.564 s and settling time of 19.8 s.
The relative resultsillustrate that an HHO-based PI controller fabricated finer conclusions when compared with structures including conventional PSO, MFO, BMFO1, and BMFO2-centered PI controllers. The peaks’ overshoot/undershoot and settling period were compact and perturbations were quickly covered in the structure having a HHO-focused PI controller [28].

6. Conclusions

The power system’s consistent operation necessitates a constant balancing of source and load as per recognized operating criteria. MFO is a very promising and interesting algorithm due to its advantages like fast searching speed and simplicity, but hasdrawbacks like getting stuck in bad local optima because it focuses on exploitation rather than exploration. Therefore, it is of great importance to research and put forward advanced optimization algorithms like BMFO1, BMFO2, and HHO with better performance to supplement the algorithm. This paper discussed major issues regarding the addition of RESs into frequency regulation power structure, which is most noticeable recently. This work briefly studied the utmost significant problems with the current accomplishments reported in the literature with different contract cases of unilateral, bilateral, and contract violation. The analysis results showed the improved consequences compared to conventional regulators with the help of modern soft computing techniques like the Harris hawks optimizer. The revised LFC model was also presented, which maintains the system frequency without any steady-state error, unlike conventional PI and moth flame optimizer. It instantaneously responds to different load disturbances and makes the system stable within a short time.

Author Contributions

Conceptualization, K.A. and A.K.; data curation, K.A., A.K. and V.K.K.; formal analysis, K.A.; investigation, V.K.K., B.S. and G.P.J.; methodology, D.P., B.S. and G.P.J.; software, A.K.; supervision, G.P.J.; validation, G.P.J.; visualization, K.A., D.P. and G.P.J.; writing—original draft, K.A.; writing—review and editing, G.P.J. All authors have read and agreed to the published version of the manuscript.

Funding

This research received no external funding.

Data Availability Statement

No new data were created or analyzed in this study. Data sharing is not applicable to this article.

Acknowledgments

We would like to thank Sudan Jha from the Department of Computer Science and Engineering, Chandigarh University, Punjab, India for his help in this work.

Conflicts of Interest

The authors declare no conflict of interest.

References

  1. García, J.; Martí, J.V.; Yepes, V. The Buttressed Walls Problem: An Application of a Hybrid Clustering Particle Swarm Optimization Algorithm. Mathematics 2020, 8, 862. [Google Scholar] [CrossRef]
  2. Ziegler, J.G.; Nichols, N.B. Optimum Settings for Automatic Controllers. J. Dyn. Syst. Meas. Control. 1993, 115, 220–222. [Google Scholar] [CrossRef]
  3. Prashar, D.; Arora, K. Design of Two Area Load Frequency Control Power System under Unilateral Contract with the Help of Conventional Controller. Int. J. Inf. Commun. Technol. Digit. Converg. 2020, 5, 22–27. [Google Scholar]
  4. Elgerd, O.I.; Fosha, C.E. Optimum Megawatt-Frequency Control of Multiarea Electric Energy Systems. IEEE Trans. Power Appar. Syst. 1970, 89, 556–563. [Google Scholar] [CrossRef]
  5. Hossein, S.; Heider, A.; Shayanfar, A.J. Multi Stage Fuzzy PID Load Frequency Controller in a Restructured Power System. J. Electr. Eng. 2007, 58, 61–70. [Google Scholar]
  6. MATLAB 9.4, Version 9.4 (R2018a); The MathWorks Inc.: Natick, MA, USA, 2018.
  7. Mirjalili, S. Moth-flame optimization algorithm: A novel nature-inspired heuristic paradigm. Knowl. Based Syst. 2015, 89, 228–249. [Google Scholar] [CrossRef]
  8. Kothari, M.L.; Kaul, B.L.; Nanda, J. Automatic Generation Control of Hydro-Thermal System. J. Inst. Eng. India 1980, 61, 85–91. [Google Scholar]
  9. Christie, R.; Bose, A. Load frequency control issues in power system operations after deregulation. IEEE Trans. Power Syst. 1996, 11, 1191–1200. [Google Scholar] [CrossRef]
  10. Pan, C.-T.; Liaw, C.-M. An adaptive controller for power system load-frequency control. IEEE Trans. Power Syst. 1989, 4, 122–128. [Google Scholar] [CrossRef]
  11. Bekhouche, N.; Feliachi, A. Decentralized estimation for the automatic generation control problem in power systems. In Proceedings of the First IEEE Conference on Control Applications, Dayton, OH, USA, 13–16 September 1992; Volume3, pp. 621–632. [Google Scholar]
  12. Bid, A.P.; Sapclt, A.T., Jr.; bzvcm, C.S. An enhanced neural network load frequency control technique. In Proceedings of the International Conference on Control ’94, Coventry, UK, 21–24 March 1994; Volume 389, pp. 409–415. [Google Scholar]
  13. Elgerd, O.I.; Happ, H.H. Electric Energy Systems Theory: An Introduction. IEEE Trans. Syst. Man Cybern. 1972, 2, 296–297. [Google Scholar] [CrossRef]
  14. Venter, G. Review of Optimization Techniques. In Encyclopedia of Aerospace Engineering; American Cancer Society: Atlanta, GA, USA, 2010. [Google Scholar]
  15. Hopper, E.; Turton, B. An empirical investigation of meta-heuristic and heuristic algorithms for a 2D packing problem. Eur. J. Oper. Res. 2001, 128, 34–57. [Google Scholar] [CrossRef]
  16. Trivedi, I.N.; Jangir, P.; Parmar, S.A.; Jangir, N. Optimal power flow with voltage stability improvement and loss reduction in power system using Moth-Flame Optimizer. Neural Comput. Appl. 2018, 30, 1889–1904. [Google Scholar] [CrossRef]
  17. Konda, S.R.; Panwar, L.K.; Panigrahi, B.; Kumar, R. Solution to unit commitment in power system operation planning using binary coded modified moth flame optimization algorithm (BMMFOA): A flame selection based computational technique. J. Comput. Sci. 2018, 25, 298–317. [Google Scholar] [CrossRef]
  18. Kamboj, V.K.; Nandi, A.; Bhadoria, A.; Sehgal, S. An intensify Harris Hawks optimizer for numerical and engineering optimization problems. Appl. Soft Comput. 2020, 89, 106018. [Google Scholar] [CrossRef]
  19. Xu, D.; Liu, J.; Yan, X.; Yan, W. A novel adaptive neural network constrained control for a multi-area interconnected power system with hybrid energy storage. IEEE Trans. Ind. Electron. 2018, 65, 6625–6634. [Google Scholar] [CrossRef]
  20. Xu, Y.; Li, C.; Wang, Z.; Zhang, N.; Peng, B. Load Frequency Control of a Novel Renewable Energy Integrated Micro-Grid Containing Pumped Hydropower Energy Storage. IEEE Access 2018, 6, 29067–29077. [Google Scholar] [CrossRef]
  21. Yan, W.; Sheng, L.; Xu, D.; Yang, W.; Liu, Q. H∞ Robust Load Frequency Control for Multi-Area Interconnected Power System with Hybrid Energy Storage System. Appl. Sci. 2018, 8, 1748. [Google Scholar] [CrossRef] [Green Version]
  22. Datta, A.; Bhattacharjee, K.; Debbarma, S.; Kar, B. Load frequency control of a renewable energy sources based hybrid system. In Proceedings of the 2015 IEEE Conference on Systems, Process and Control (ICSPC), Bandar Sunway, Malaysia, 18–20 December 2015; pp. 34–38. [Google Scholar]
  23. Mehdi, N.; Reza, H.; Shoorangiz, S.S.A.F.; Sayed, M.S.B. Comparison of Artificial Intelligence Methods for Load Frequency Control Problem. Aust. J. Basic Appl. Sci. 2010, 4, 4910–4921. [Google Scholar]
  24. Gulzar, M.M.; Rizvi, S.T.H.; Ling, Q.; Sibtain, D.; Din, R.S.U. Mitigating the Load Frequency Fluctuations of Interconnected Power Systems Using Model Predictive Controller. Electronics 2019, 8, 156. [Google Scholar] [CrossRef] [Green Version]
  25. Kennedy, J.; Ebhart, R. Particle Swarm Optimization. In Proceedings of the IEEE International Conference on Neural Networks, Perth, Australia, 27 November–1 December 1995; Volume 1, pp. 1942–1948. [Google Scholar]
  26. Swain, A.K. A Simple Fuzzy Controller for Single Area Hydropower System Considering Generation Rate Constraints. J. Inst. Eng. India Part El Electr. Eng. Div. 2006, 87, 12–17. [Google Scholar]
  27. Arora, K.; Kumar, A.; Kamboj, V.K.; Prashar, D.; Jha, S.; Shrestha, B.; Joshi, G.P. Optimization Methodologies and Testing on Standard Benchmark Functions of Load Frequency Control for Interconnected Multi Area Power System in Smart Grids. Mathematics 2020, 8, 980. [Google Scholar] [CrossRef]
  28. Alhelou, H.H.; Golshan, M.E.H.; Zamani, R.; Heydarian-Forushani, E.; Siano, P. Challenges and Opportunities of Load Frequency Control in Conventional, Modern and Future Smart Power Systems: A Comprehensive Review. Energies 2018, 11, 2497. [Google Scholar] [CrossRef] [Green Version]
Figure 1. Block diagram of a wind energy generation system.
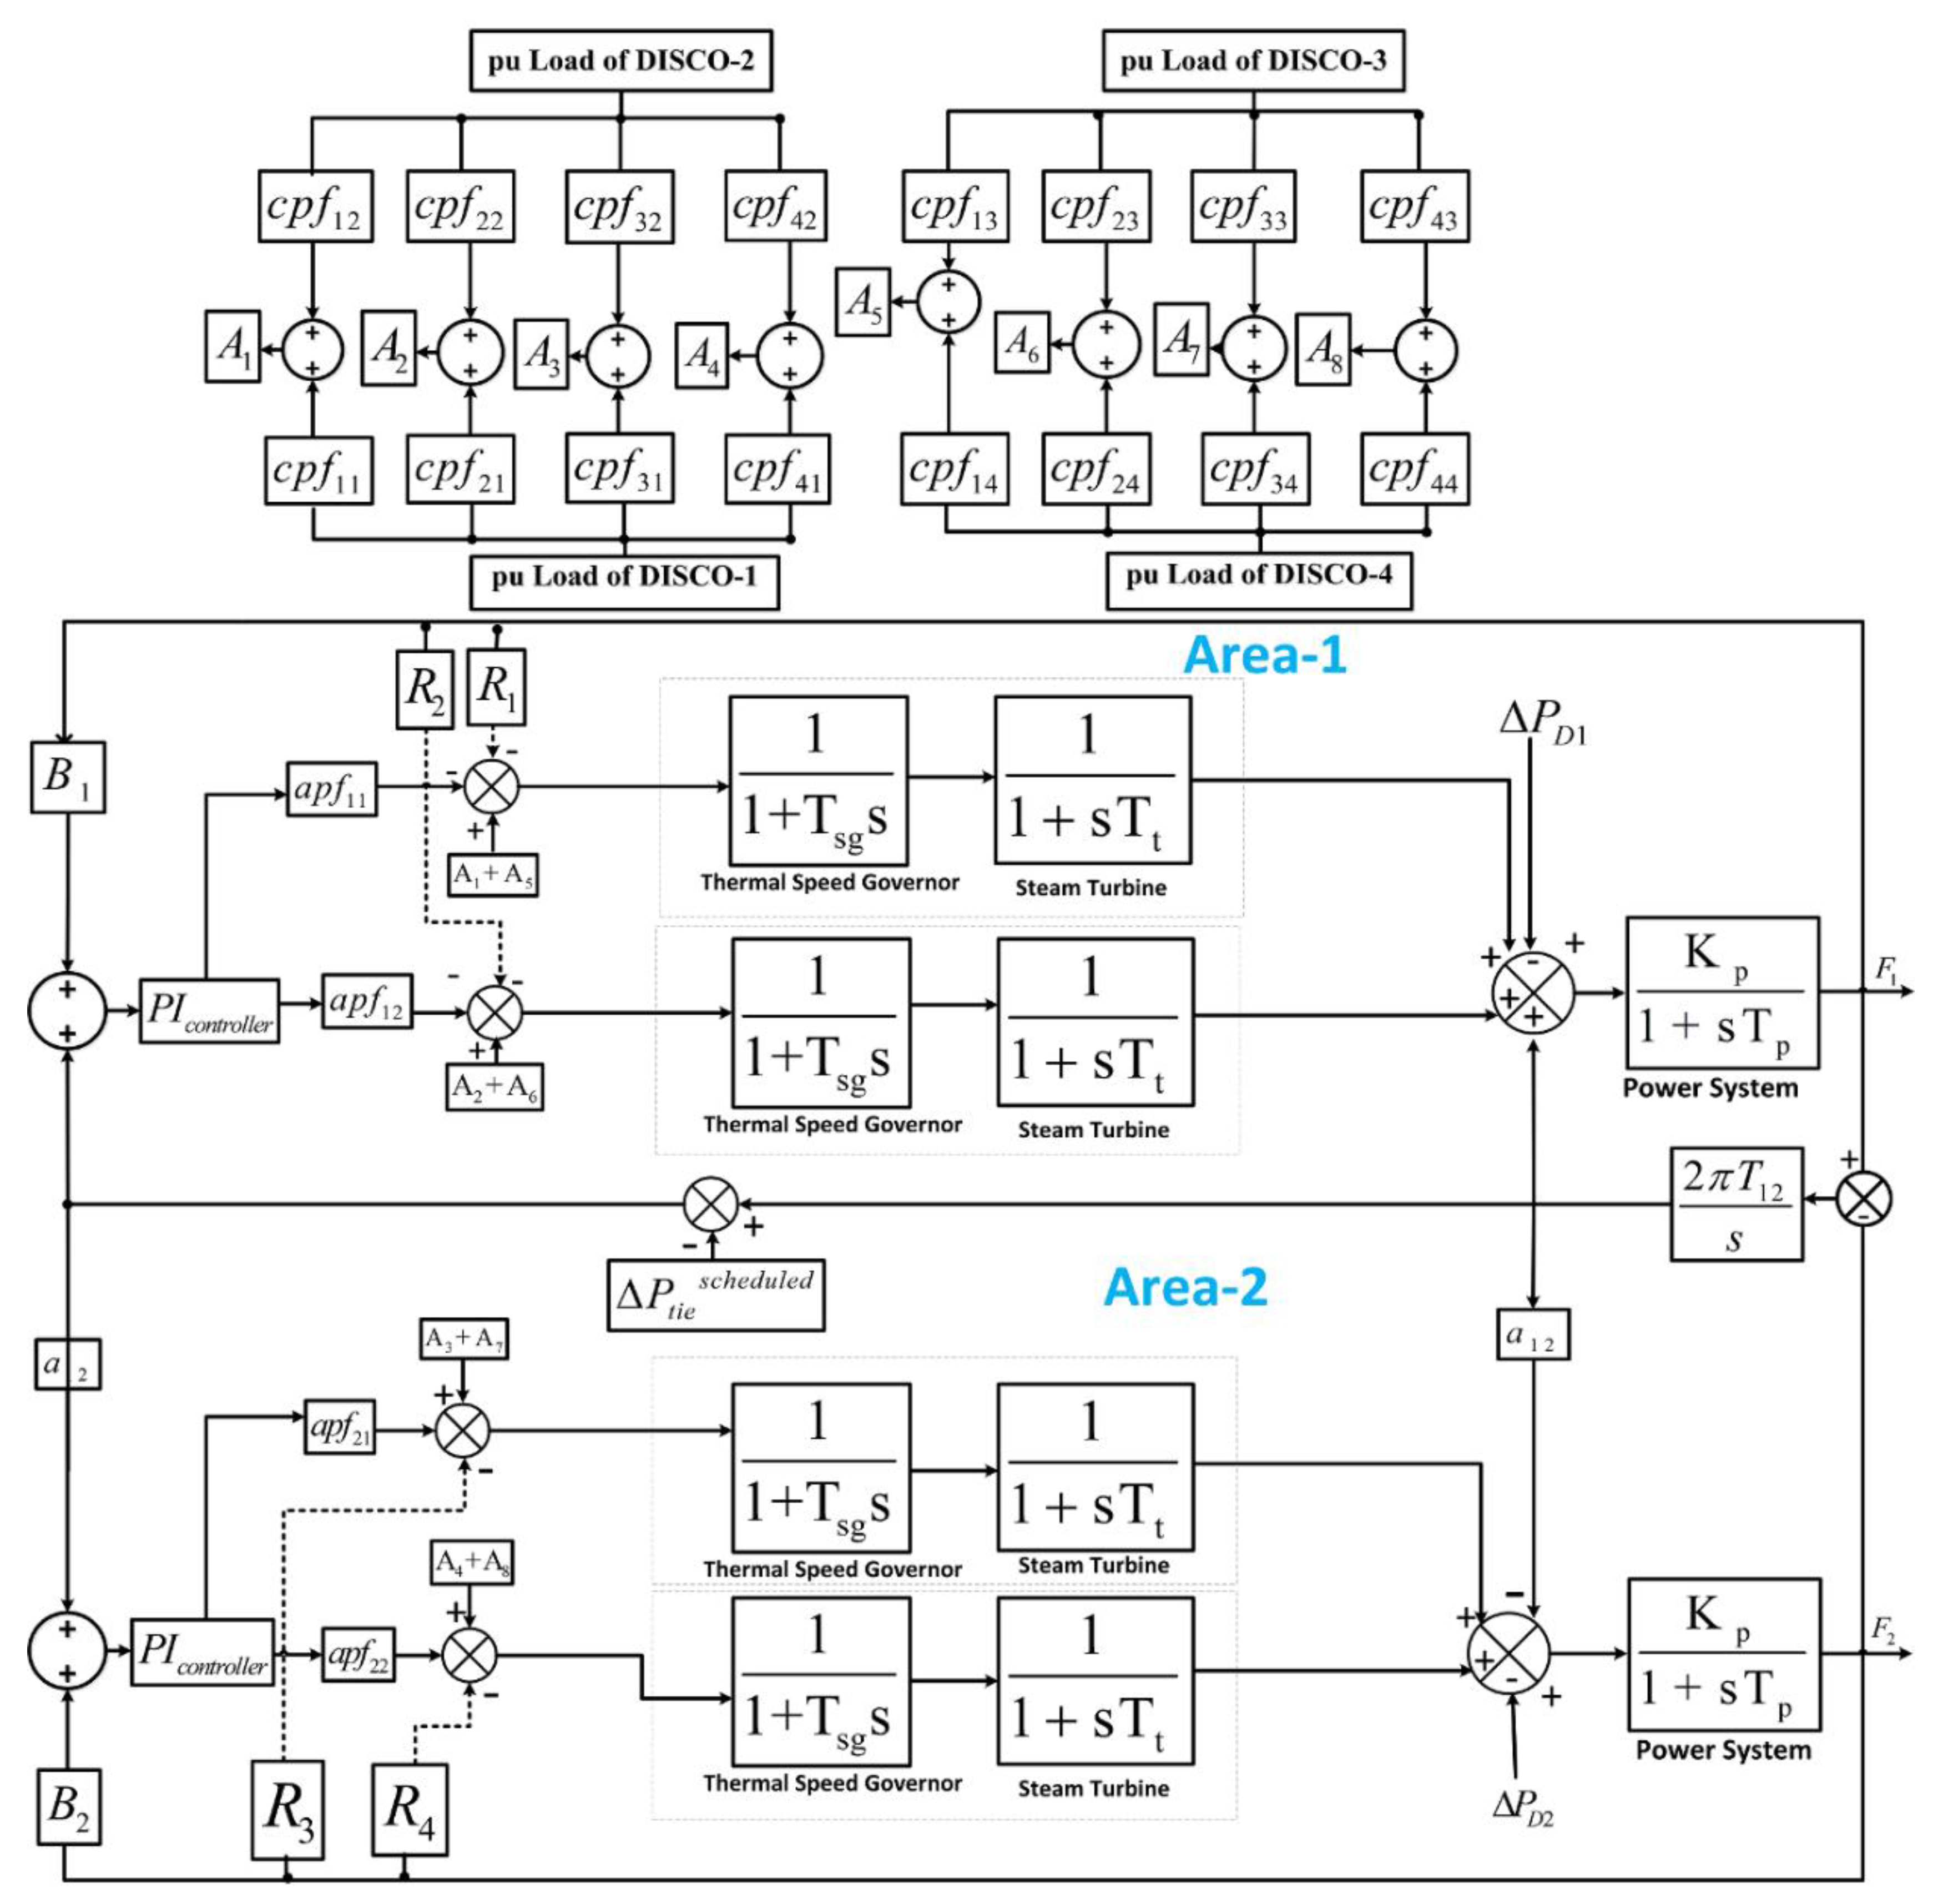
Mathematics 09 00186 g001
Figure 2. Transfer function model.
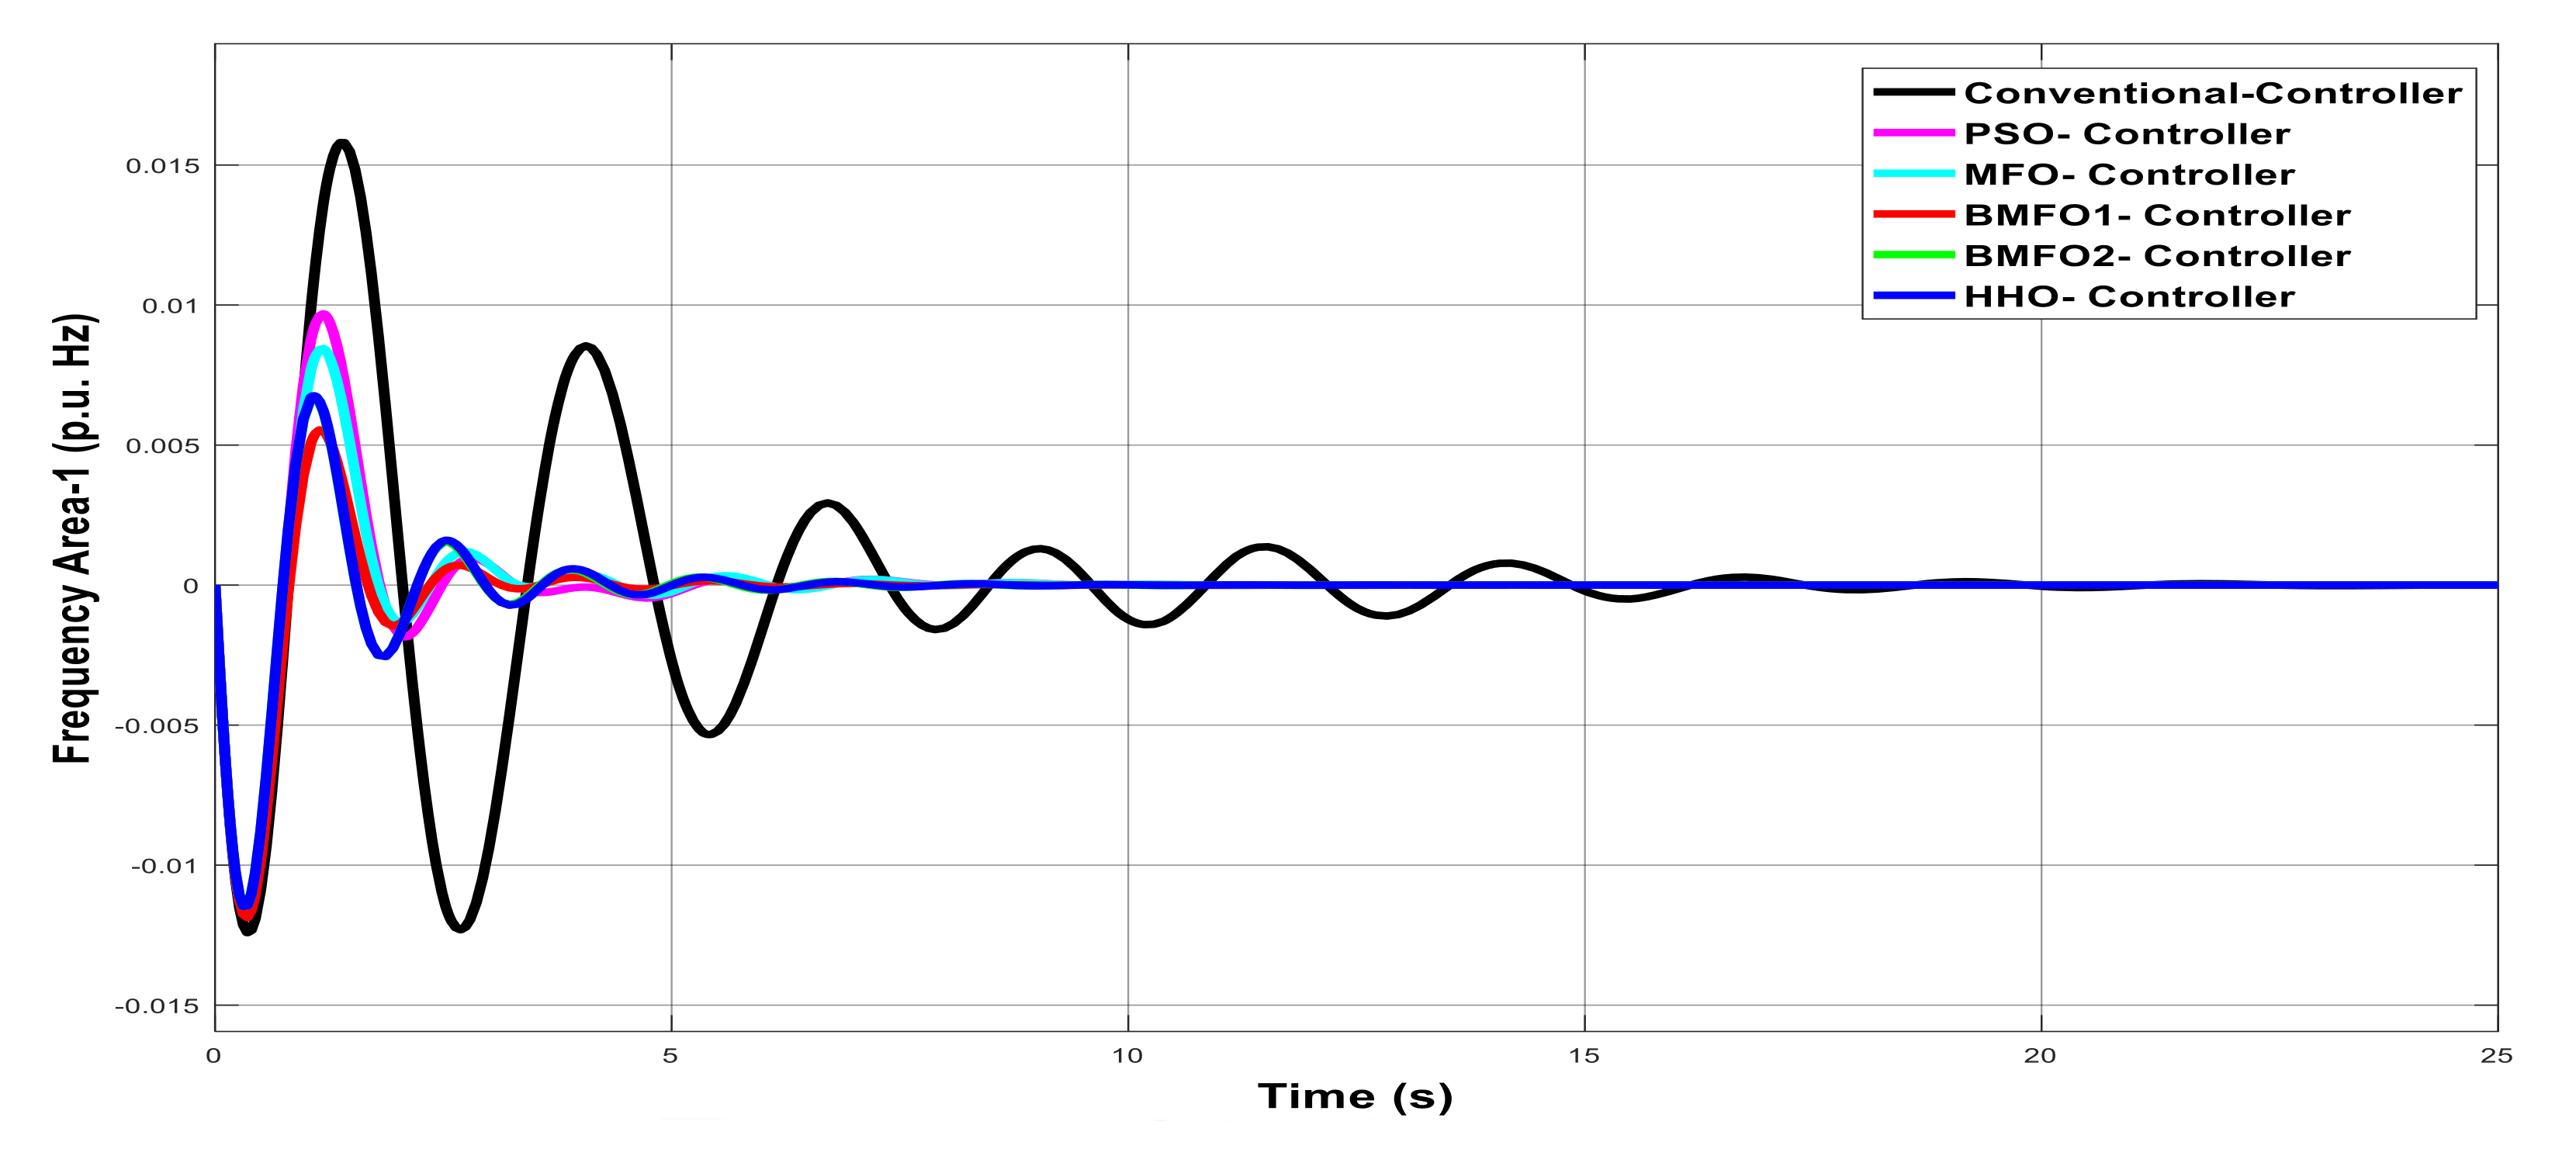
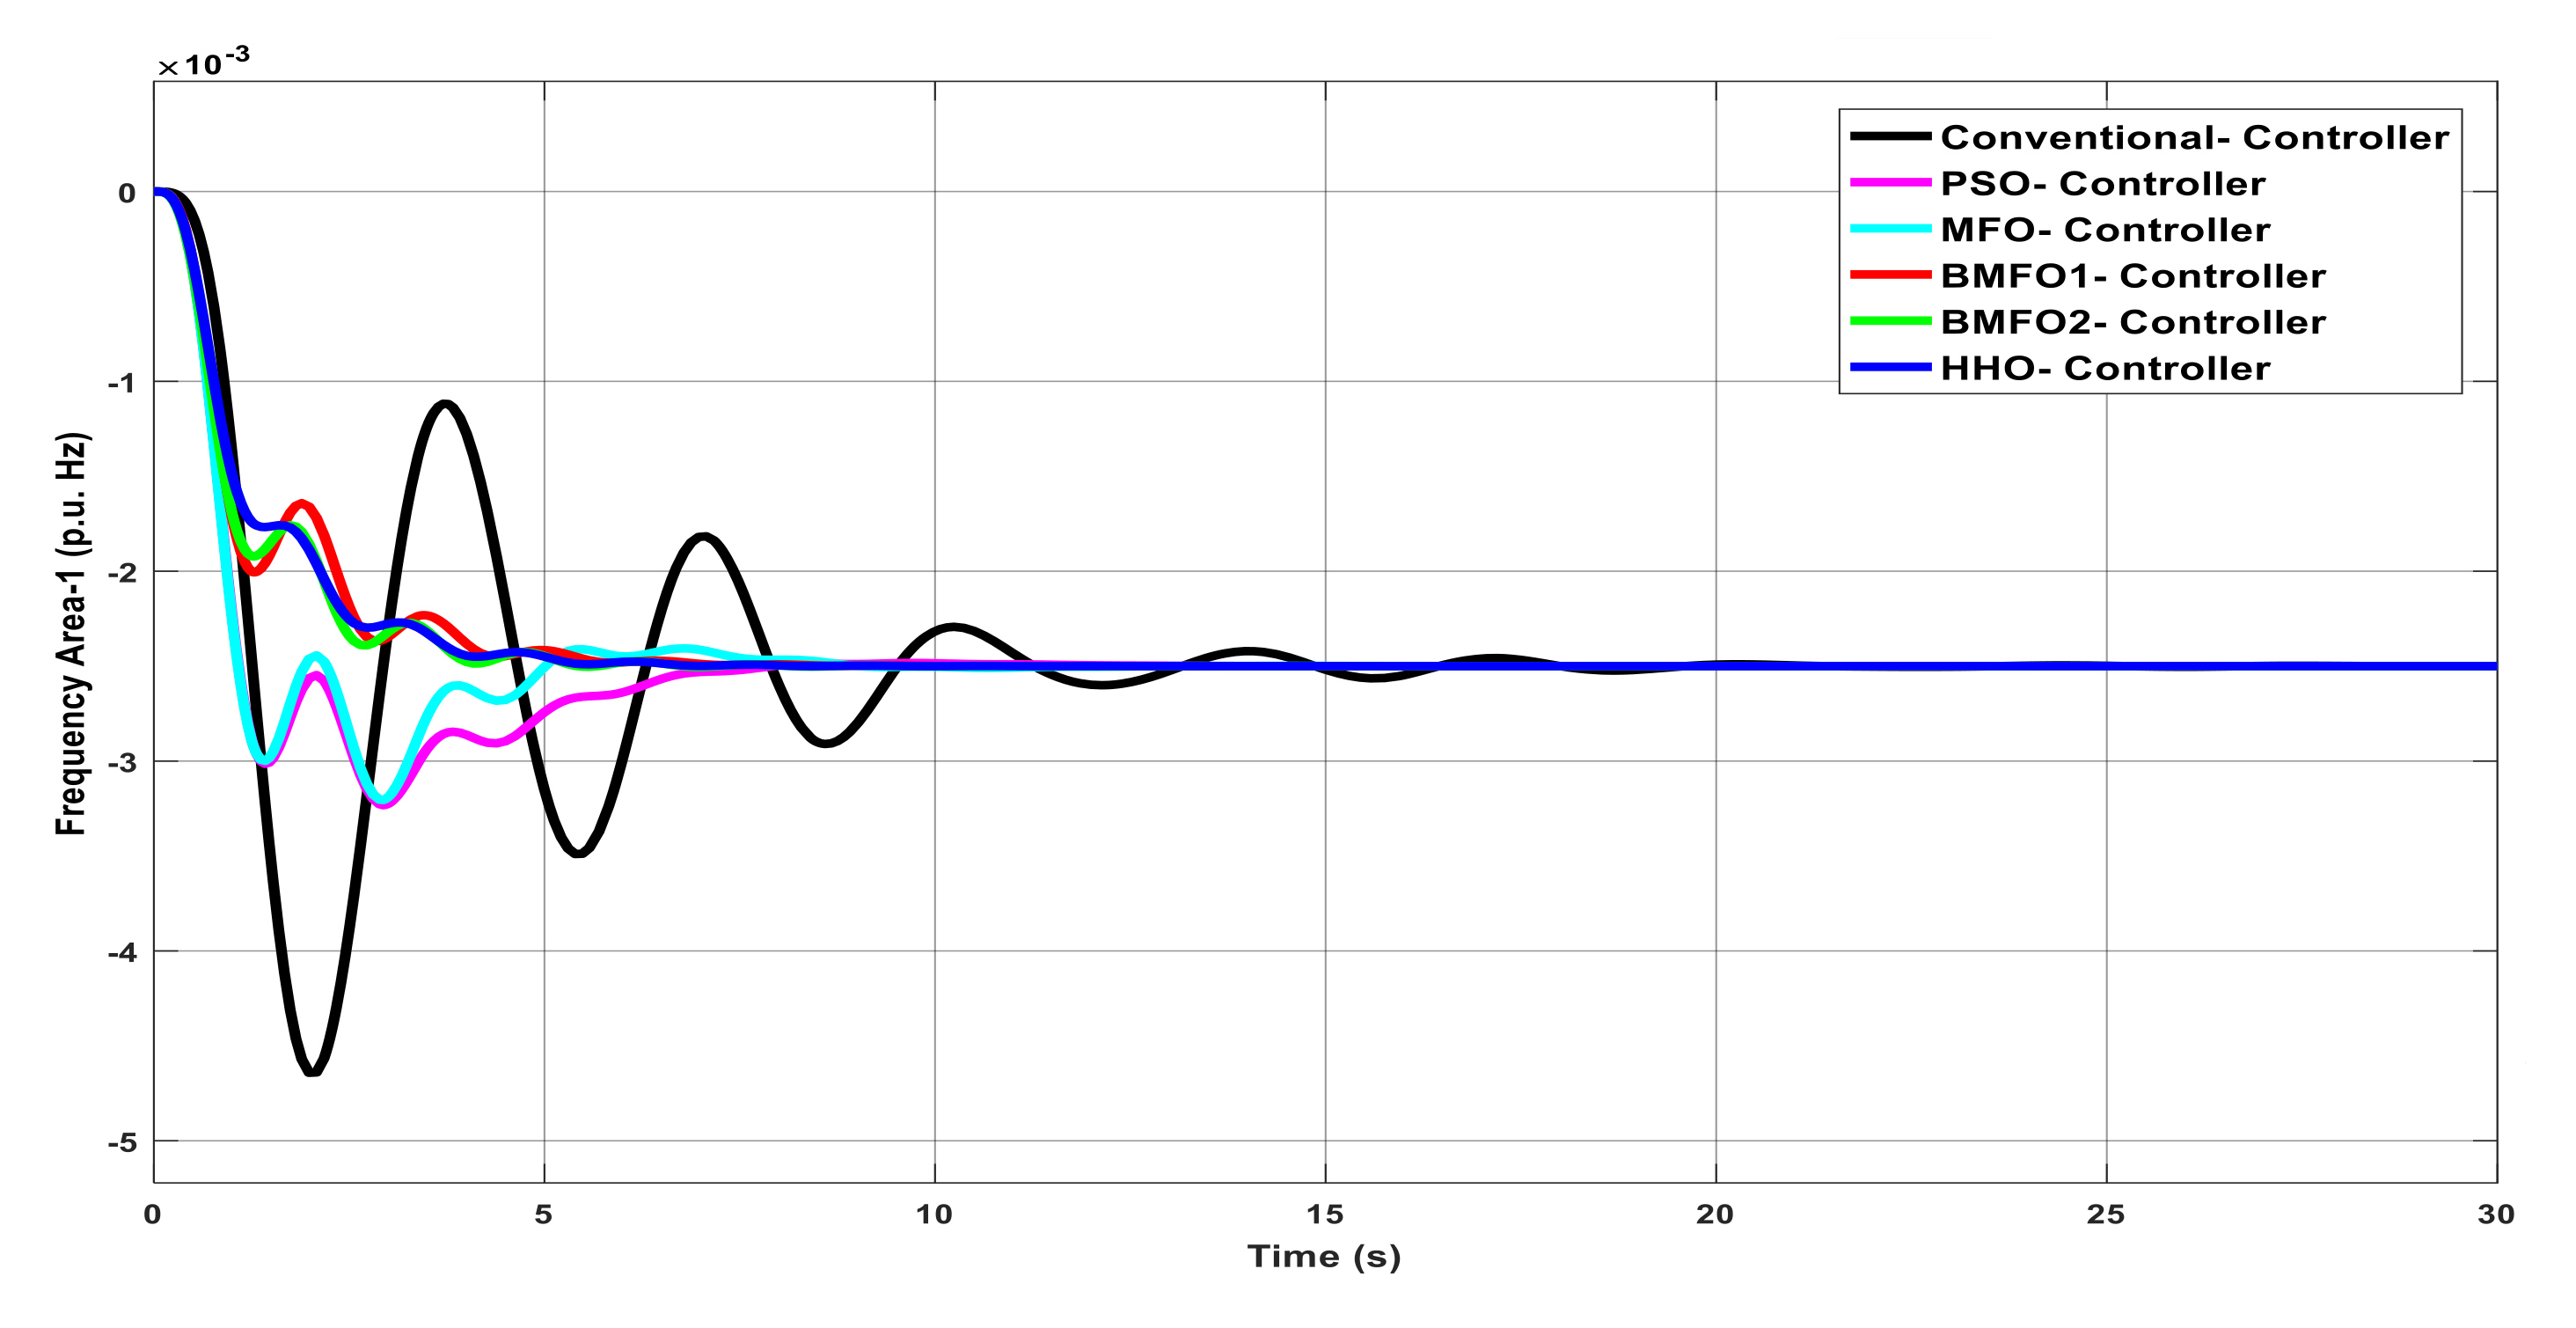
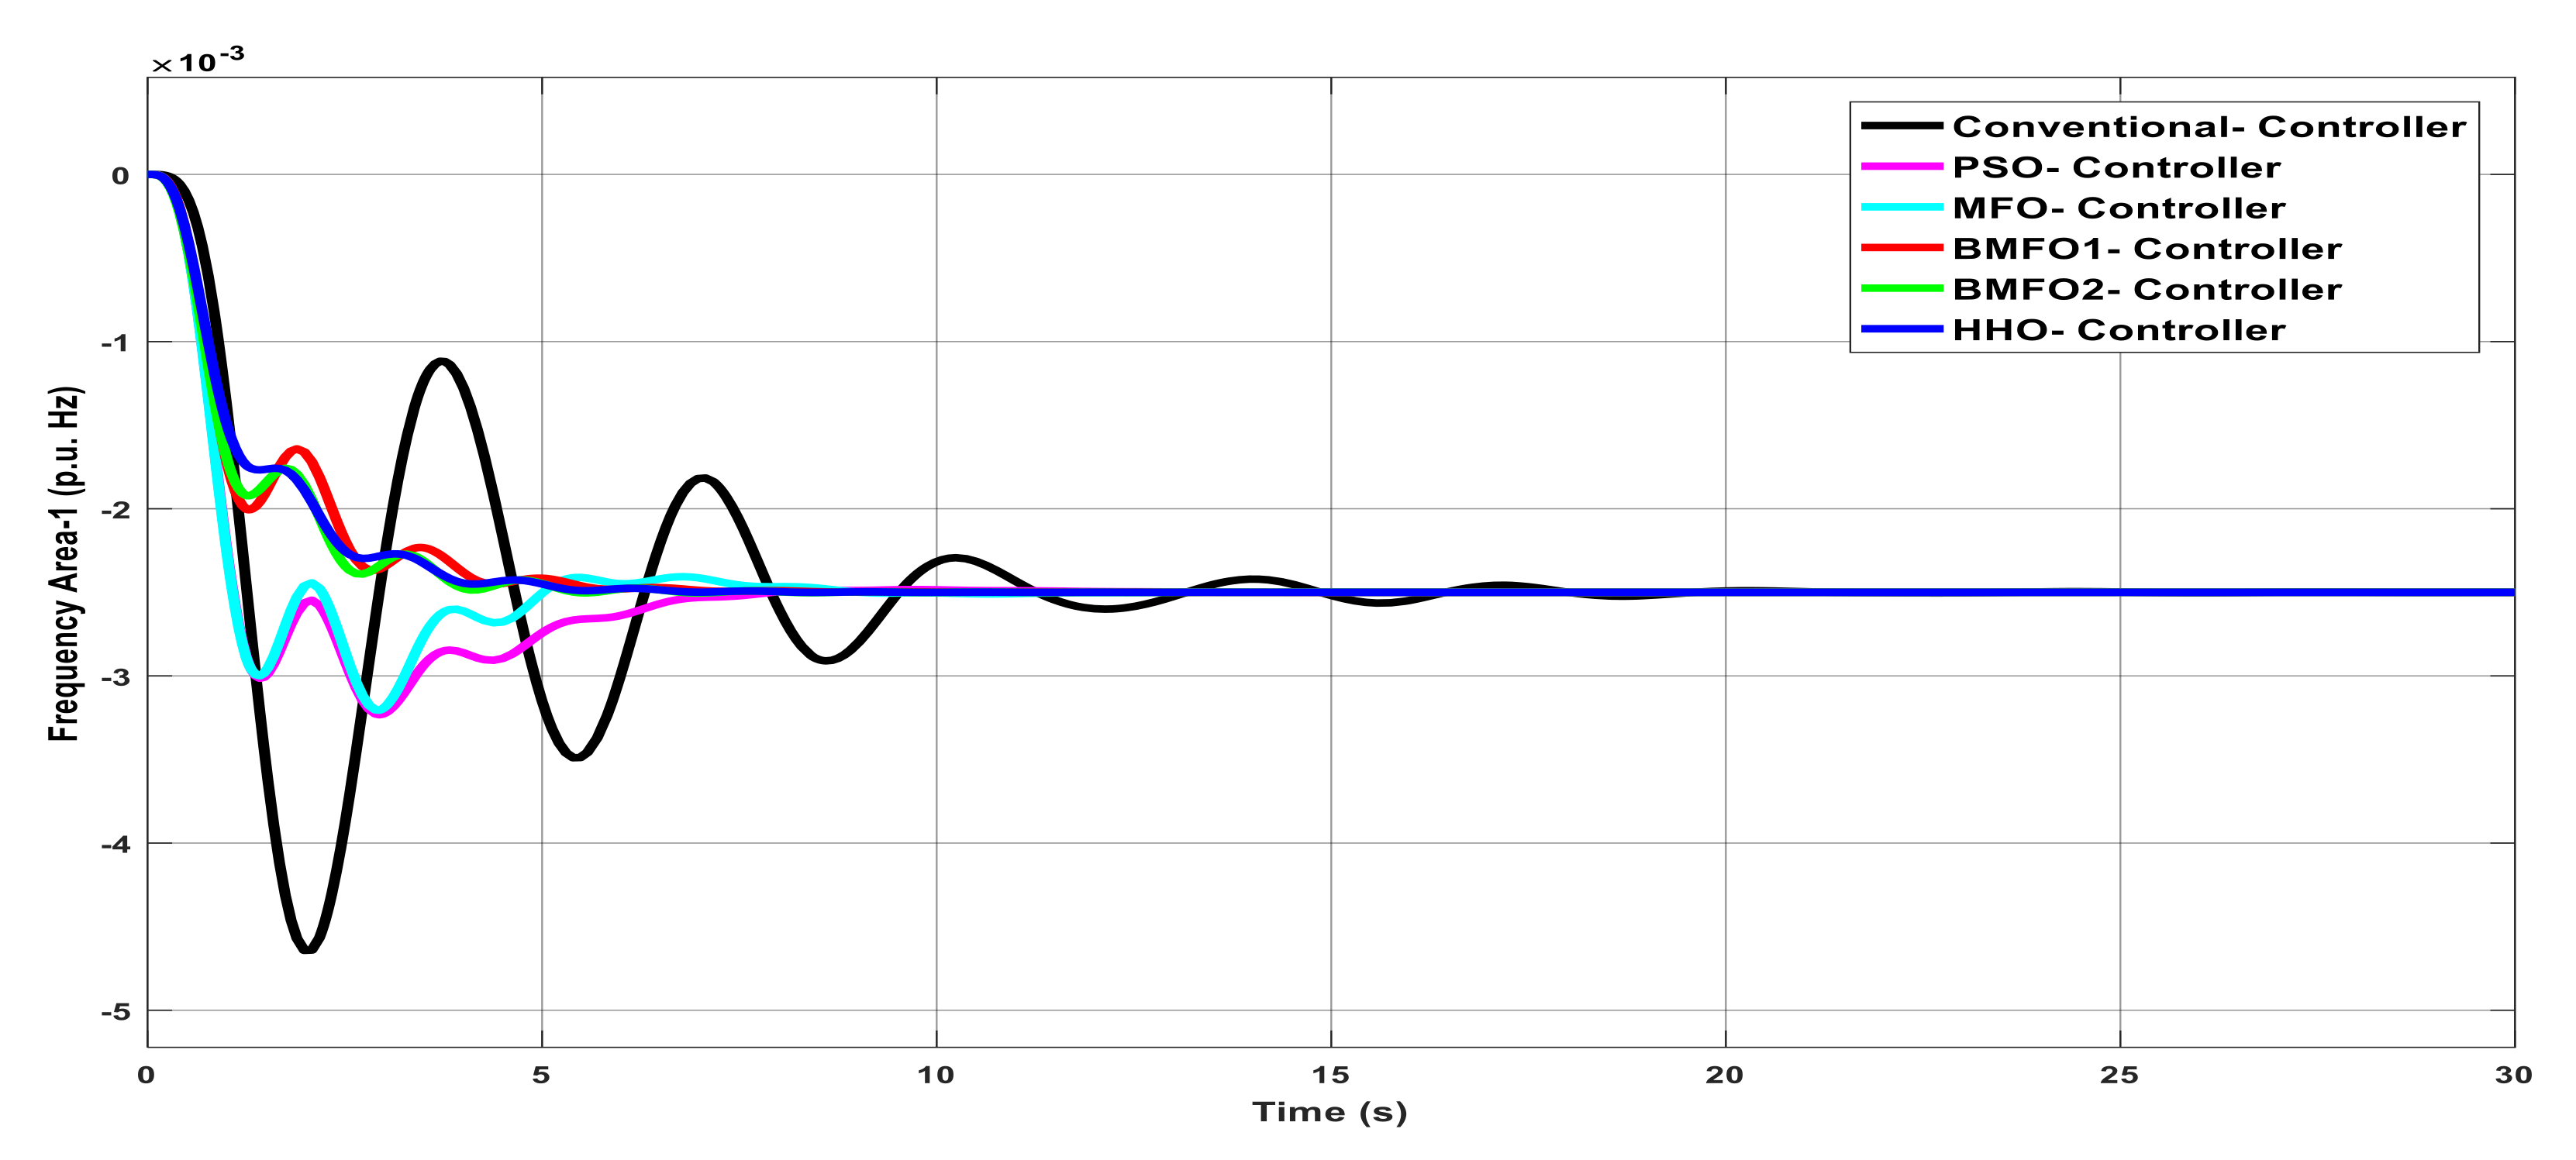
Mathematics 09 00186 g002
Figure 3. Dynamic response of Area1 frequency with various controllers under unilateral contract.
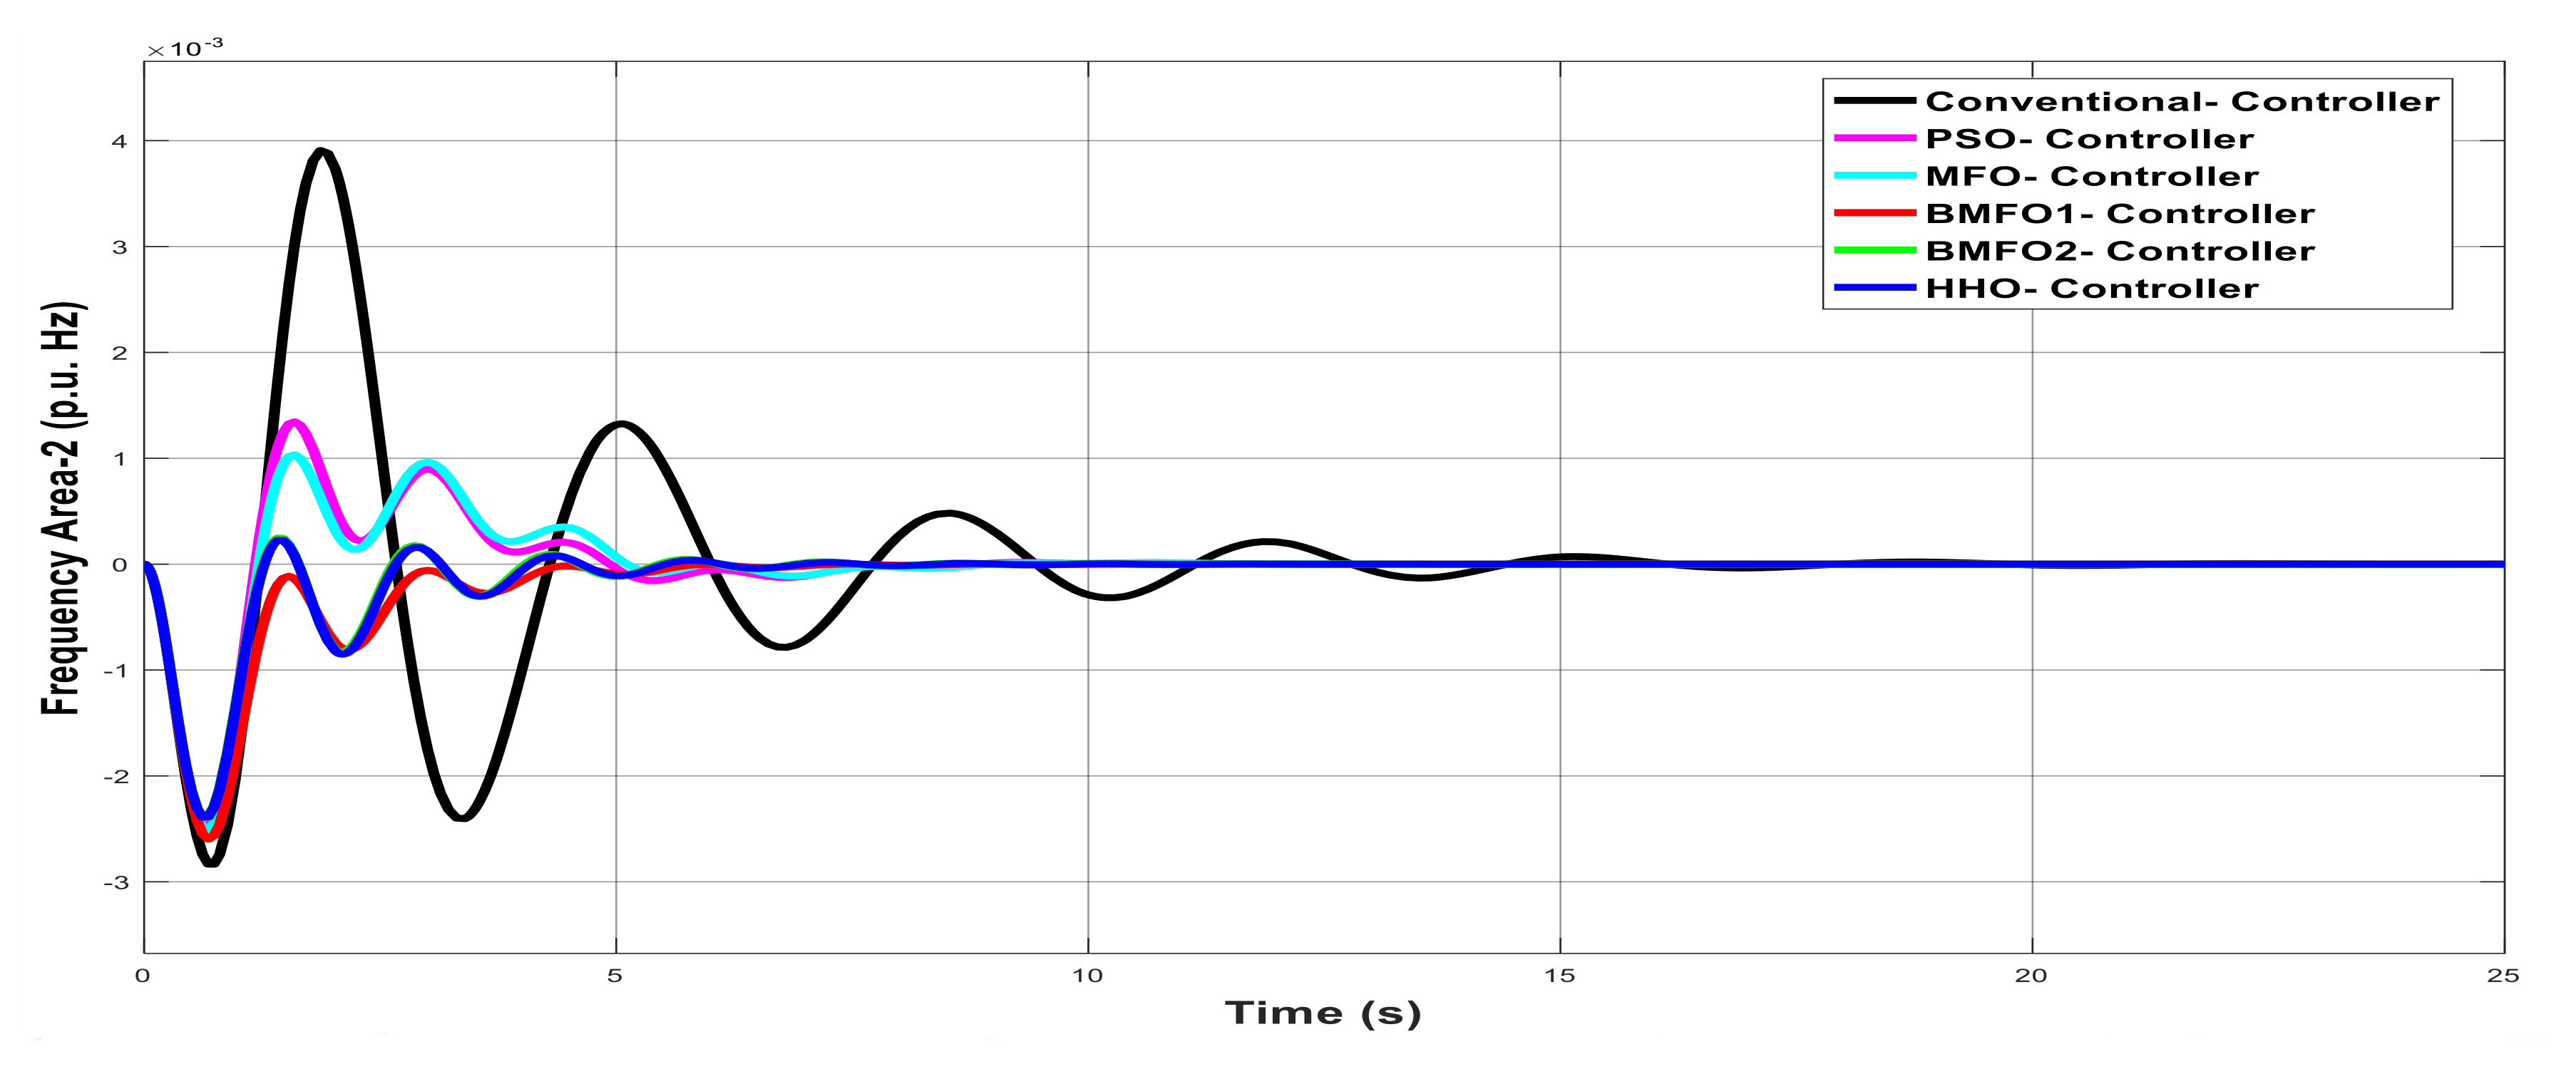
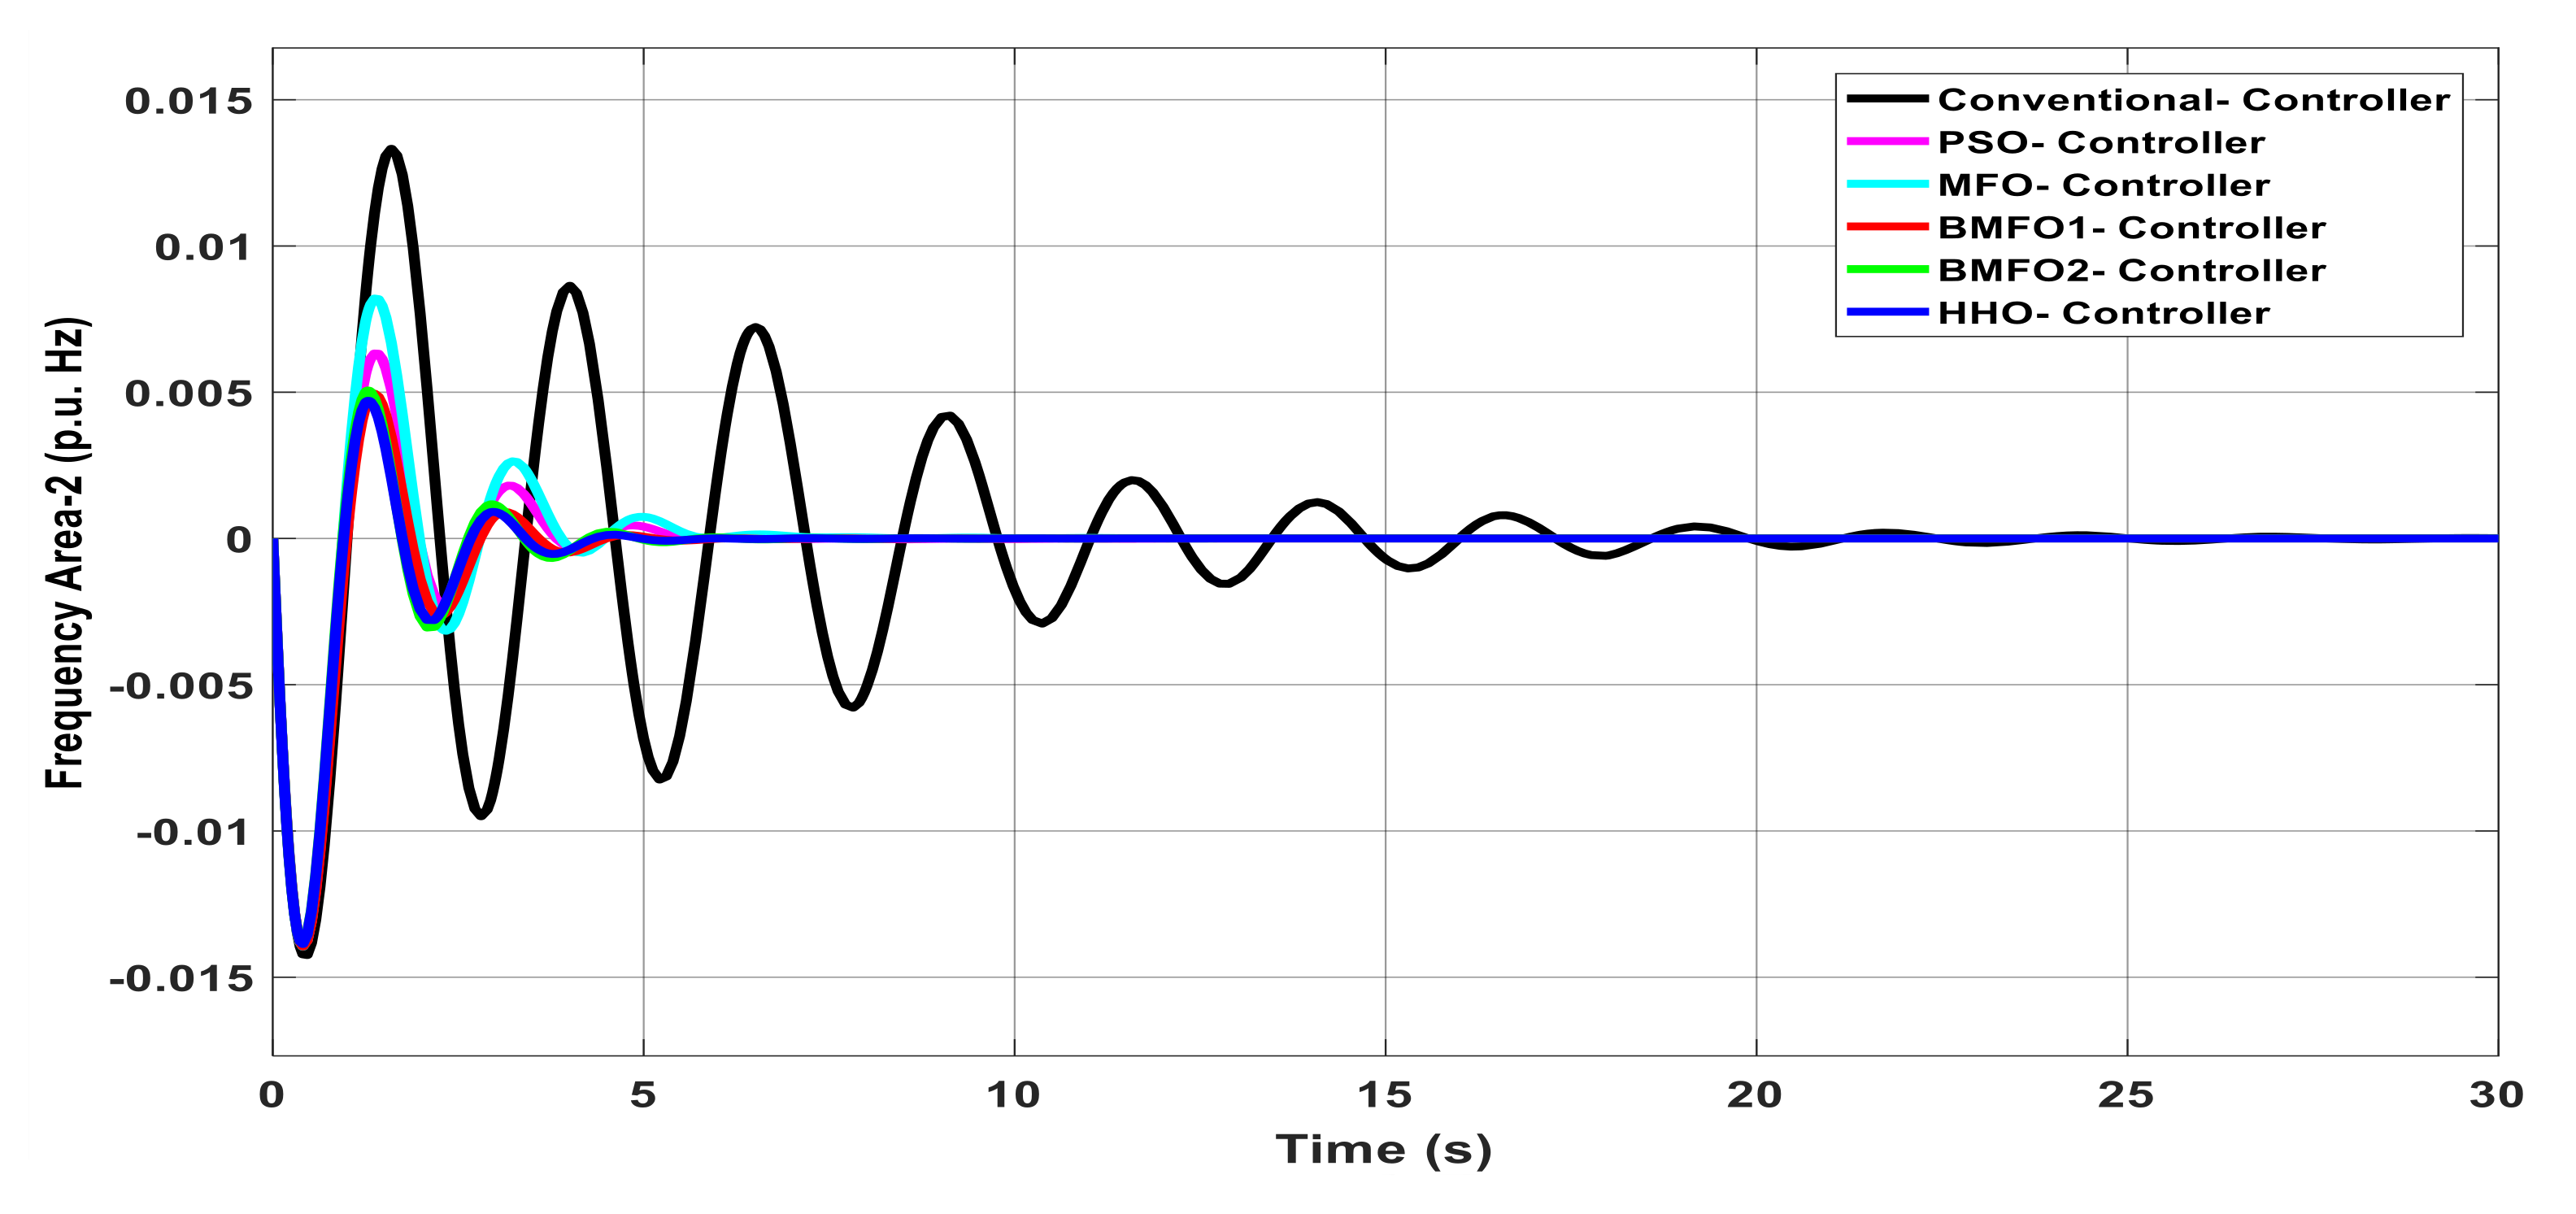
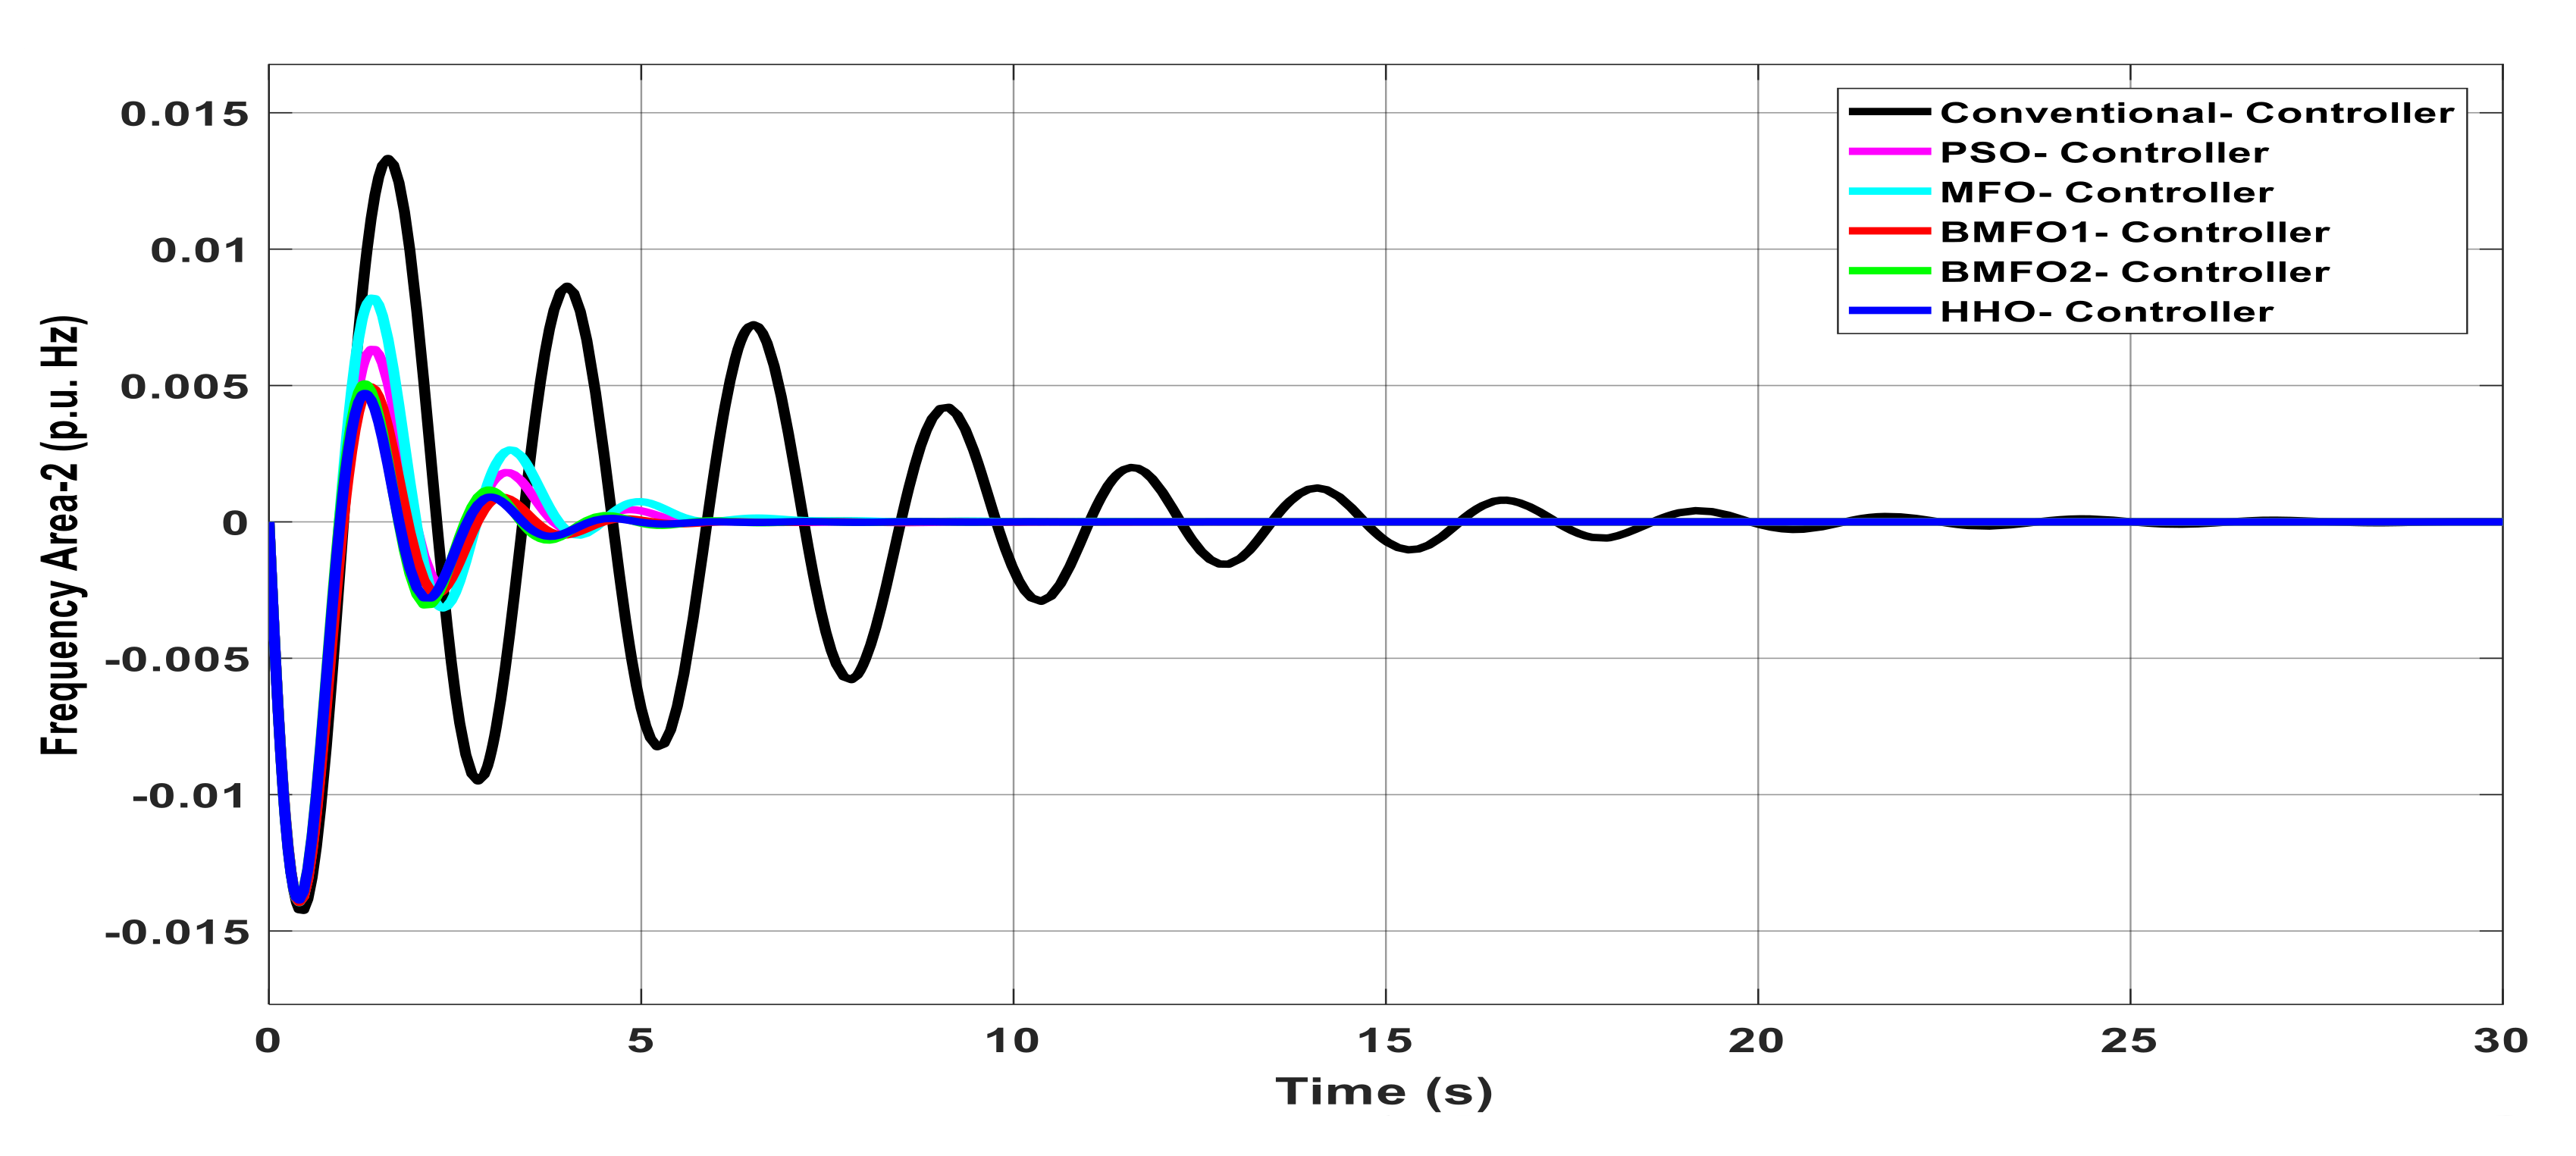
Mathematics 09 00186 g003
Figure 4. Dynamic response of Area2 frequency with various controllers under unilateral contract.
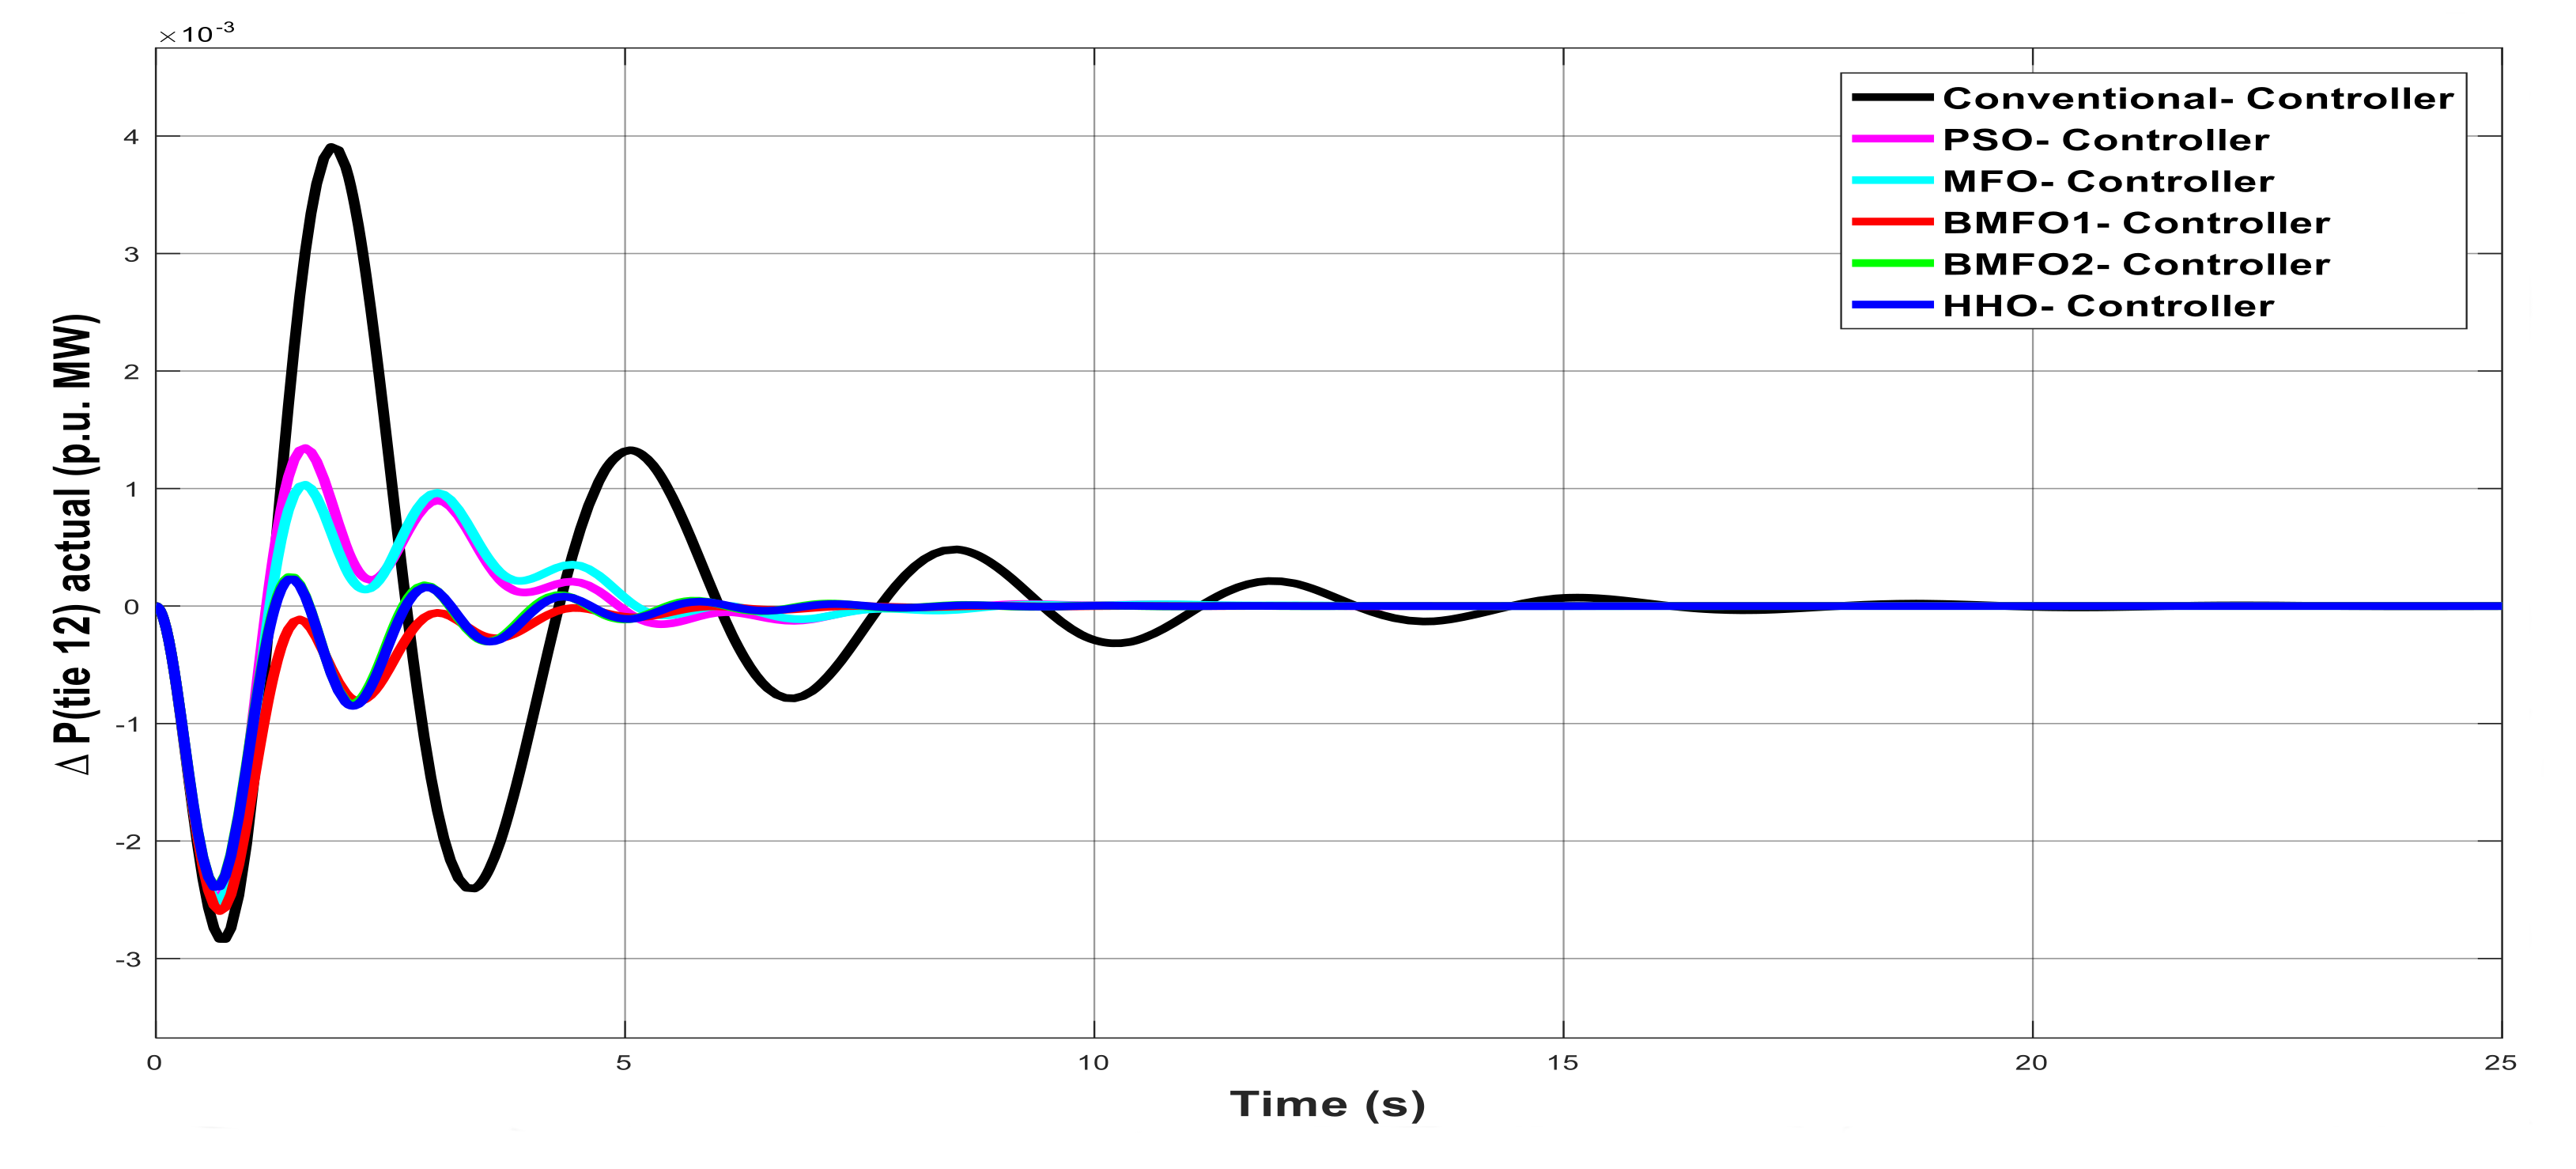
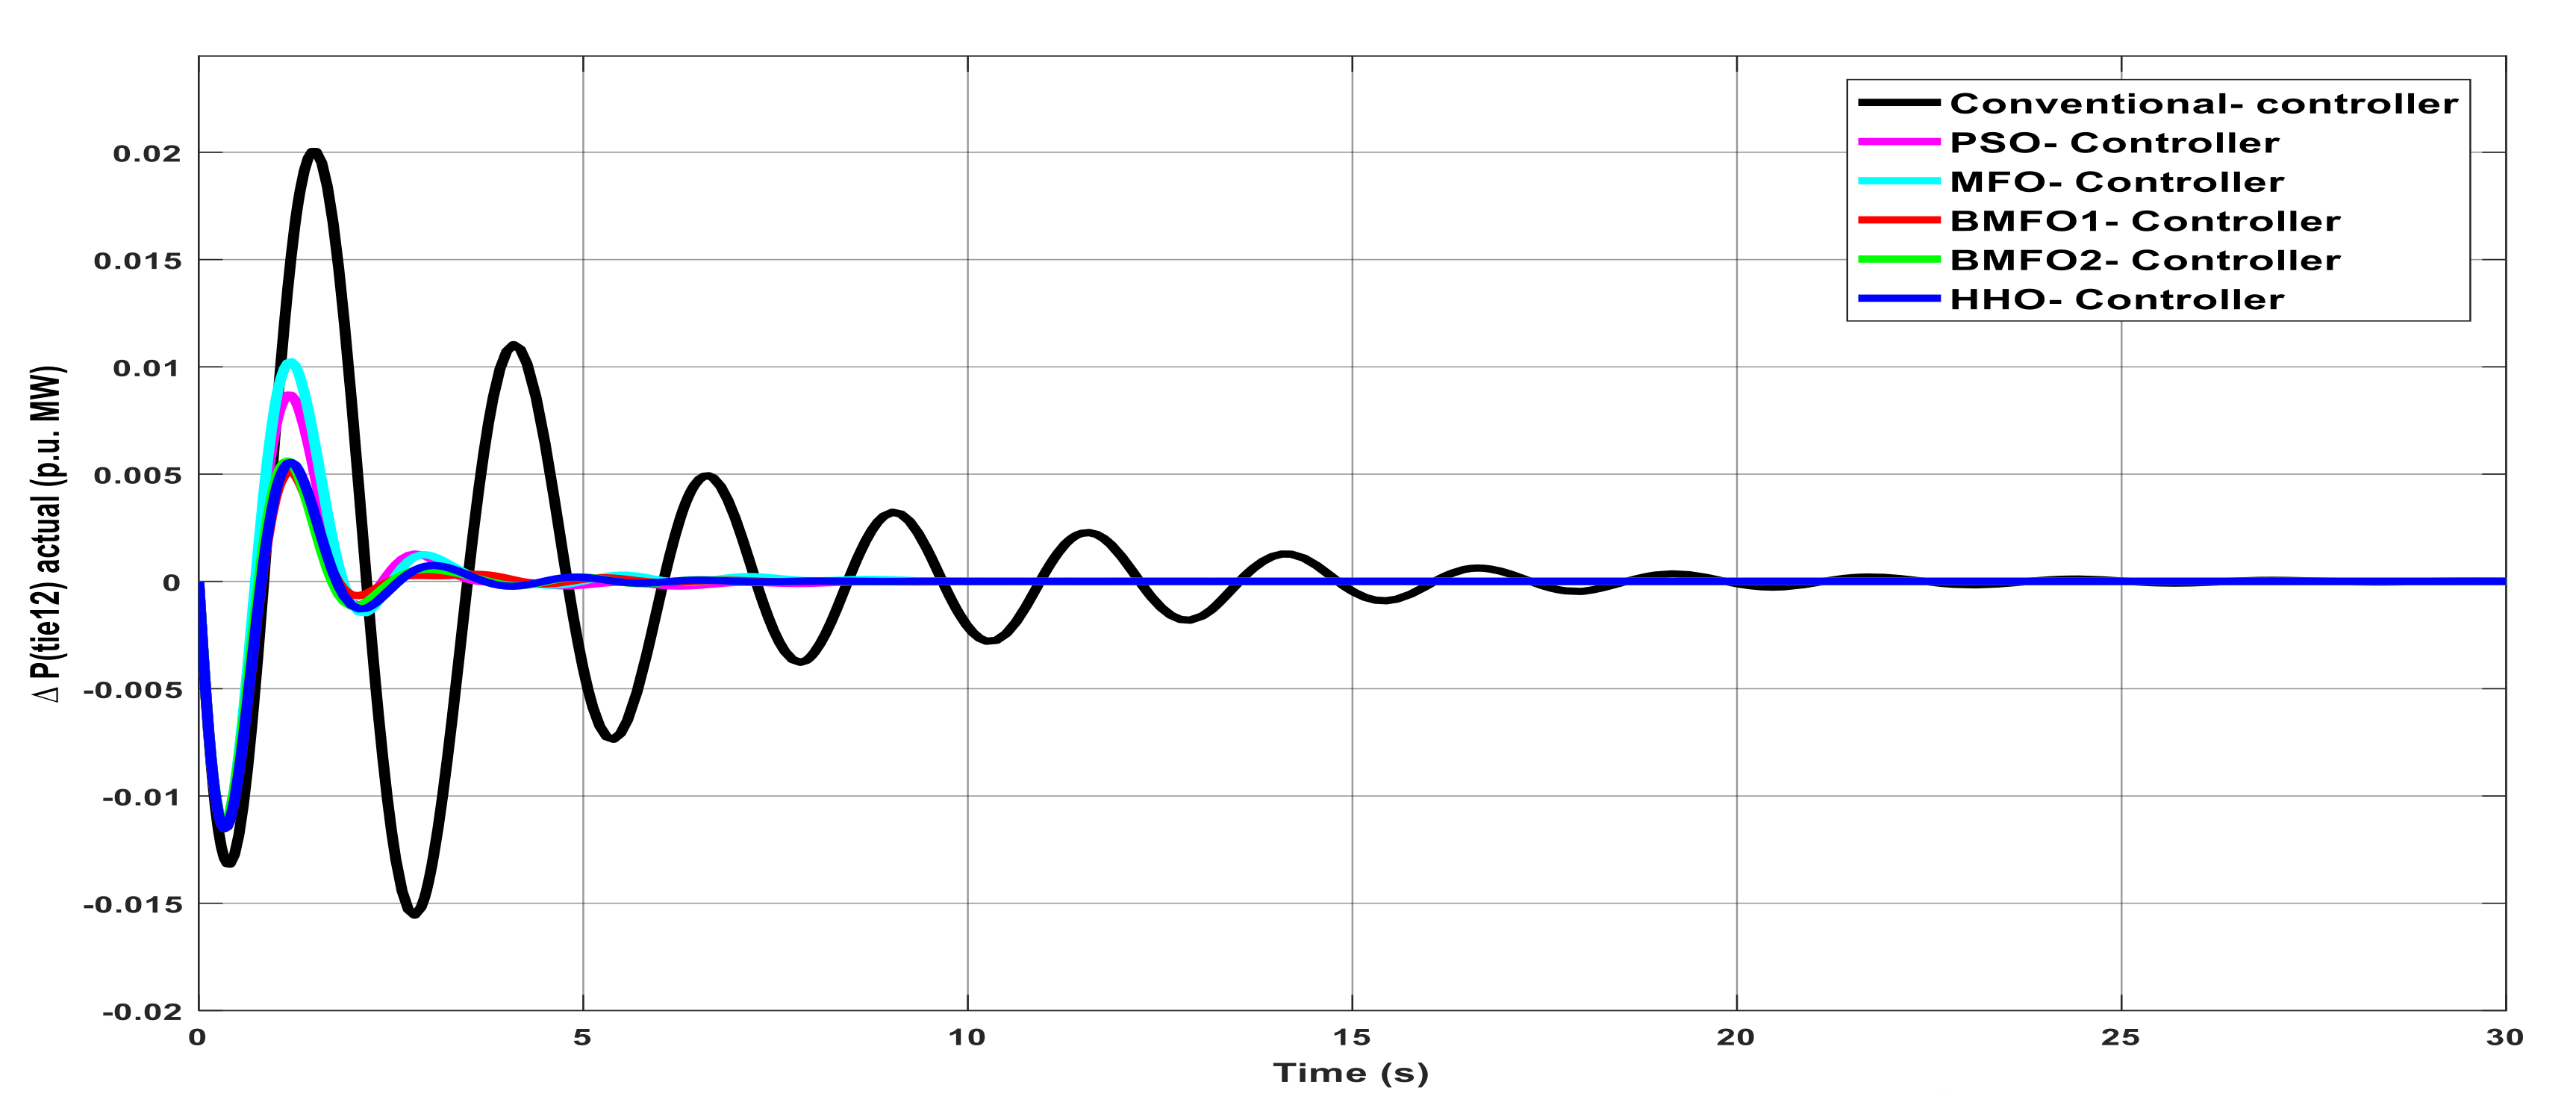
Mathematics 09 00186 g004
Figure 5. Deviation in actual tie-line power flow with various controllers under unilateral contract.
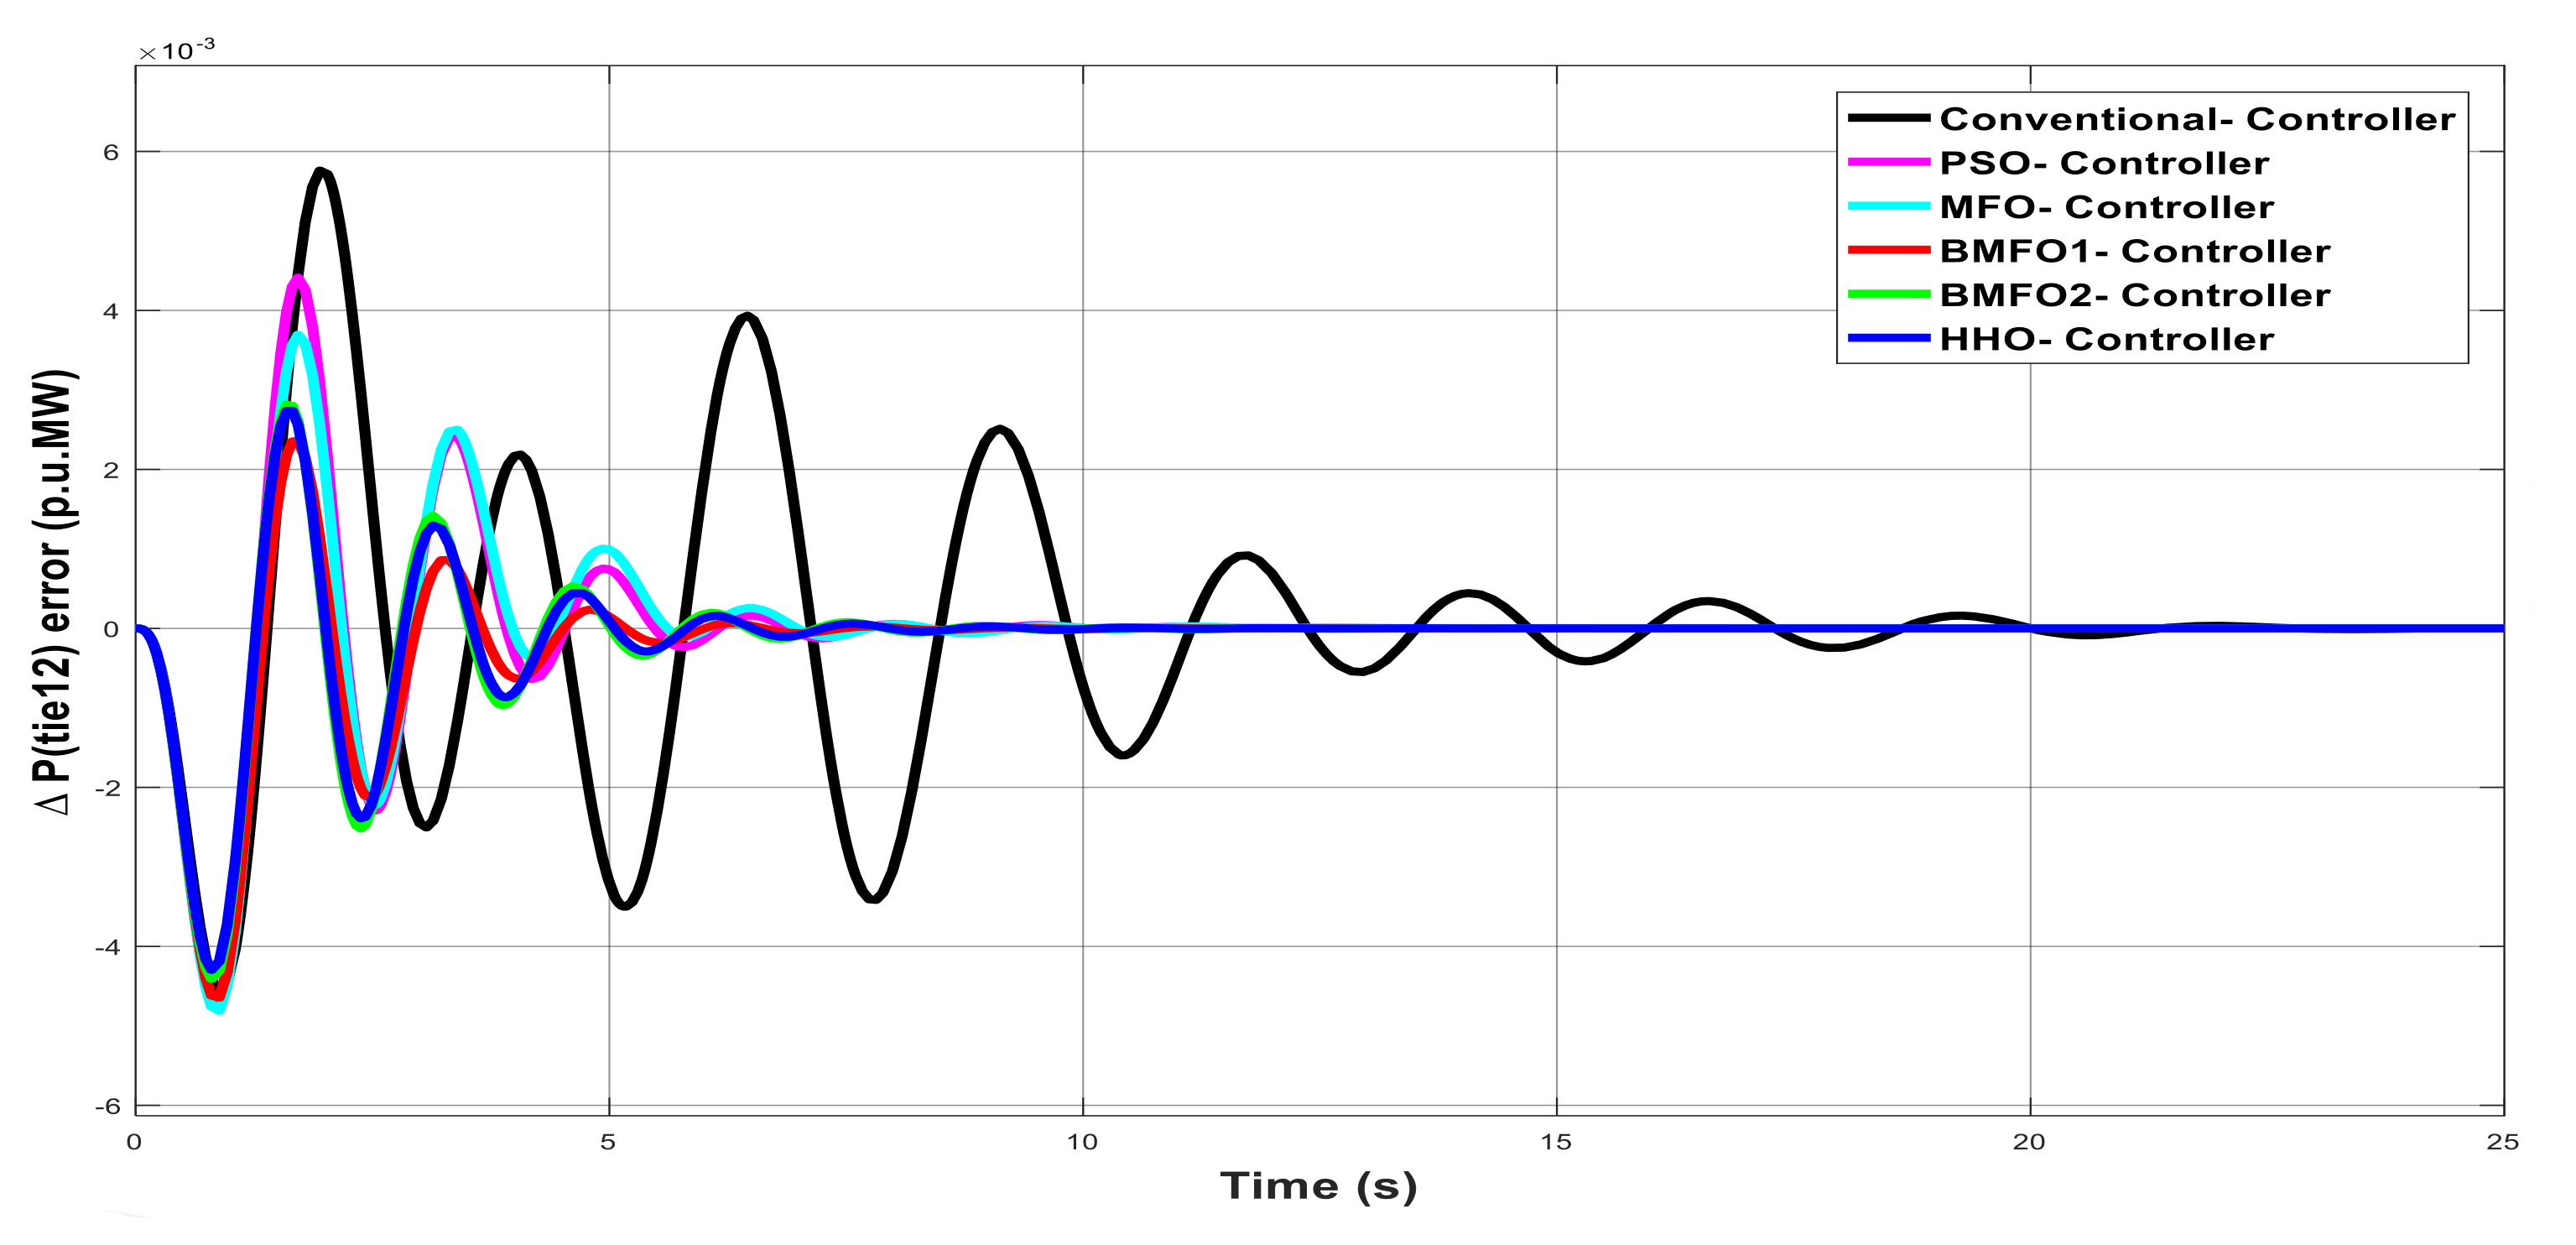
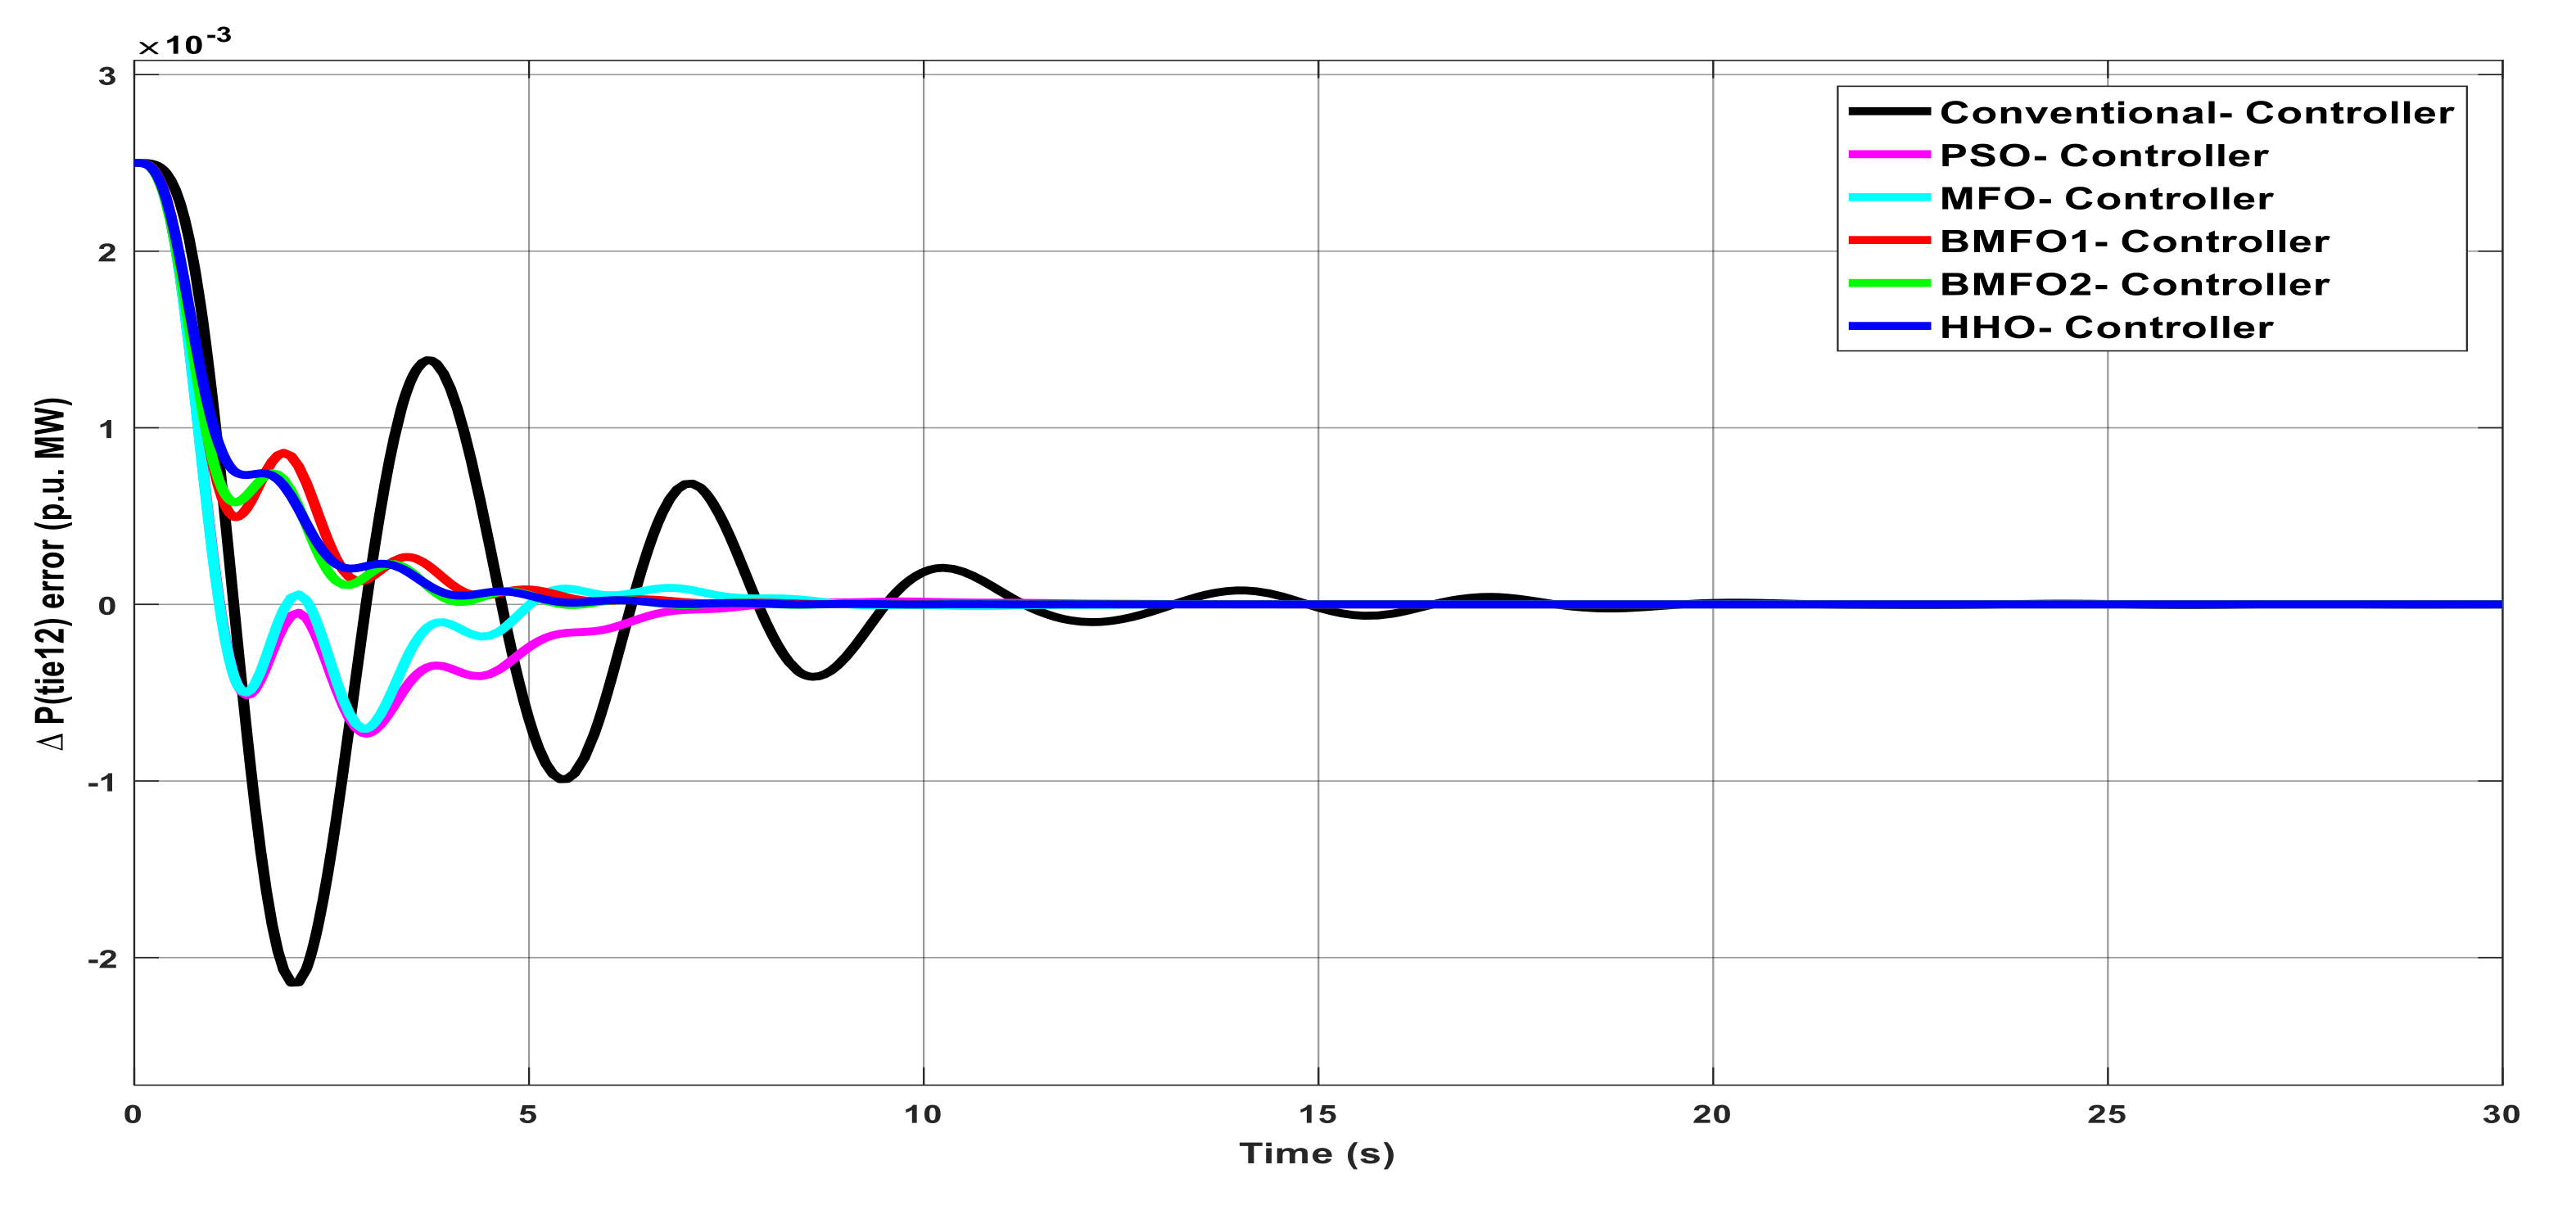
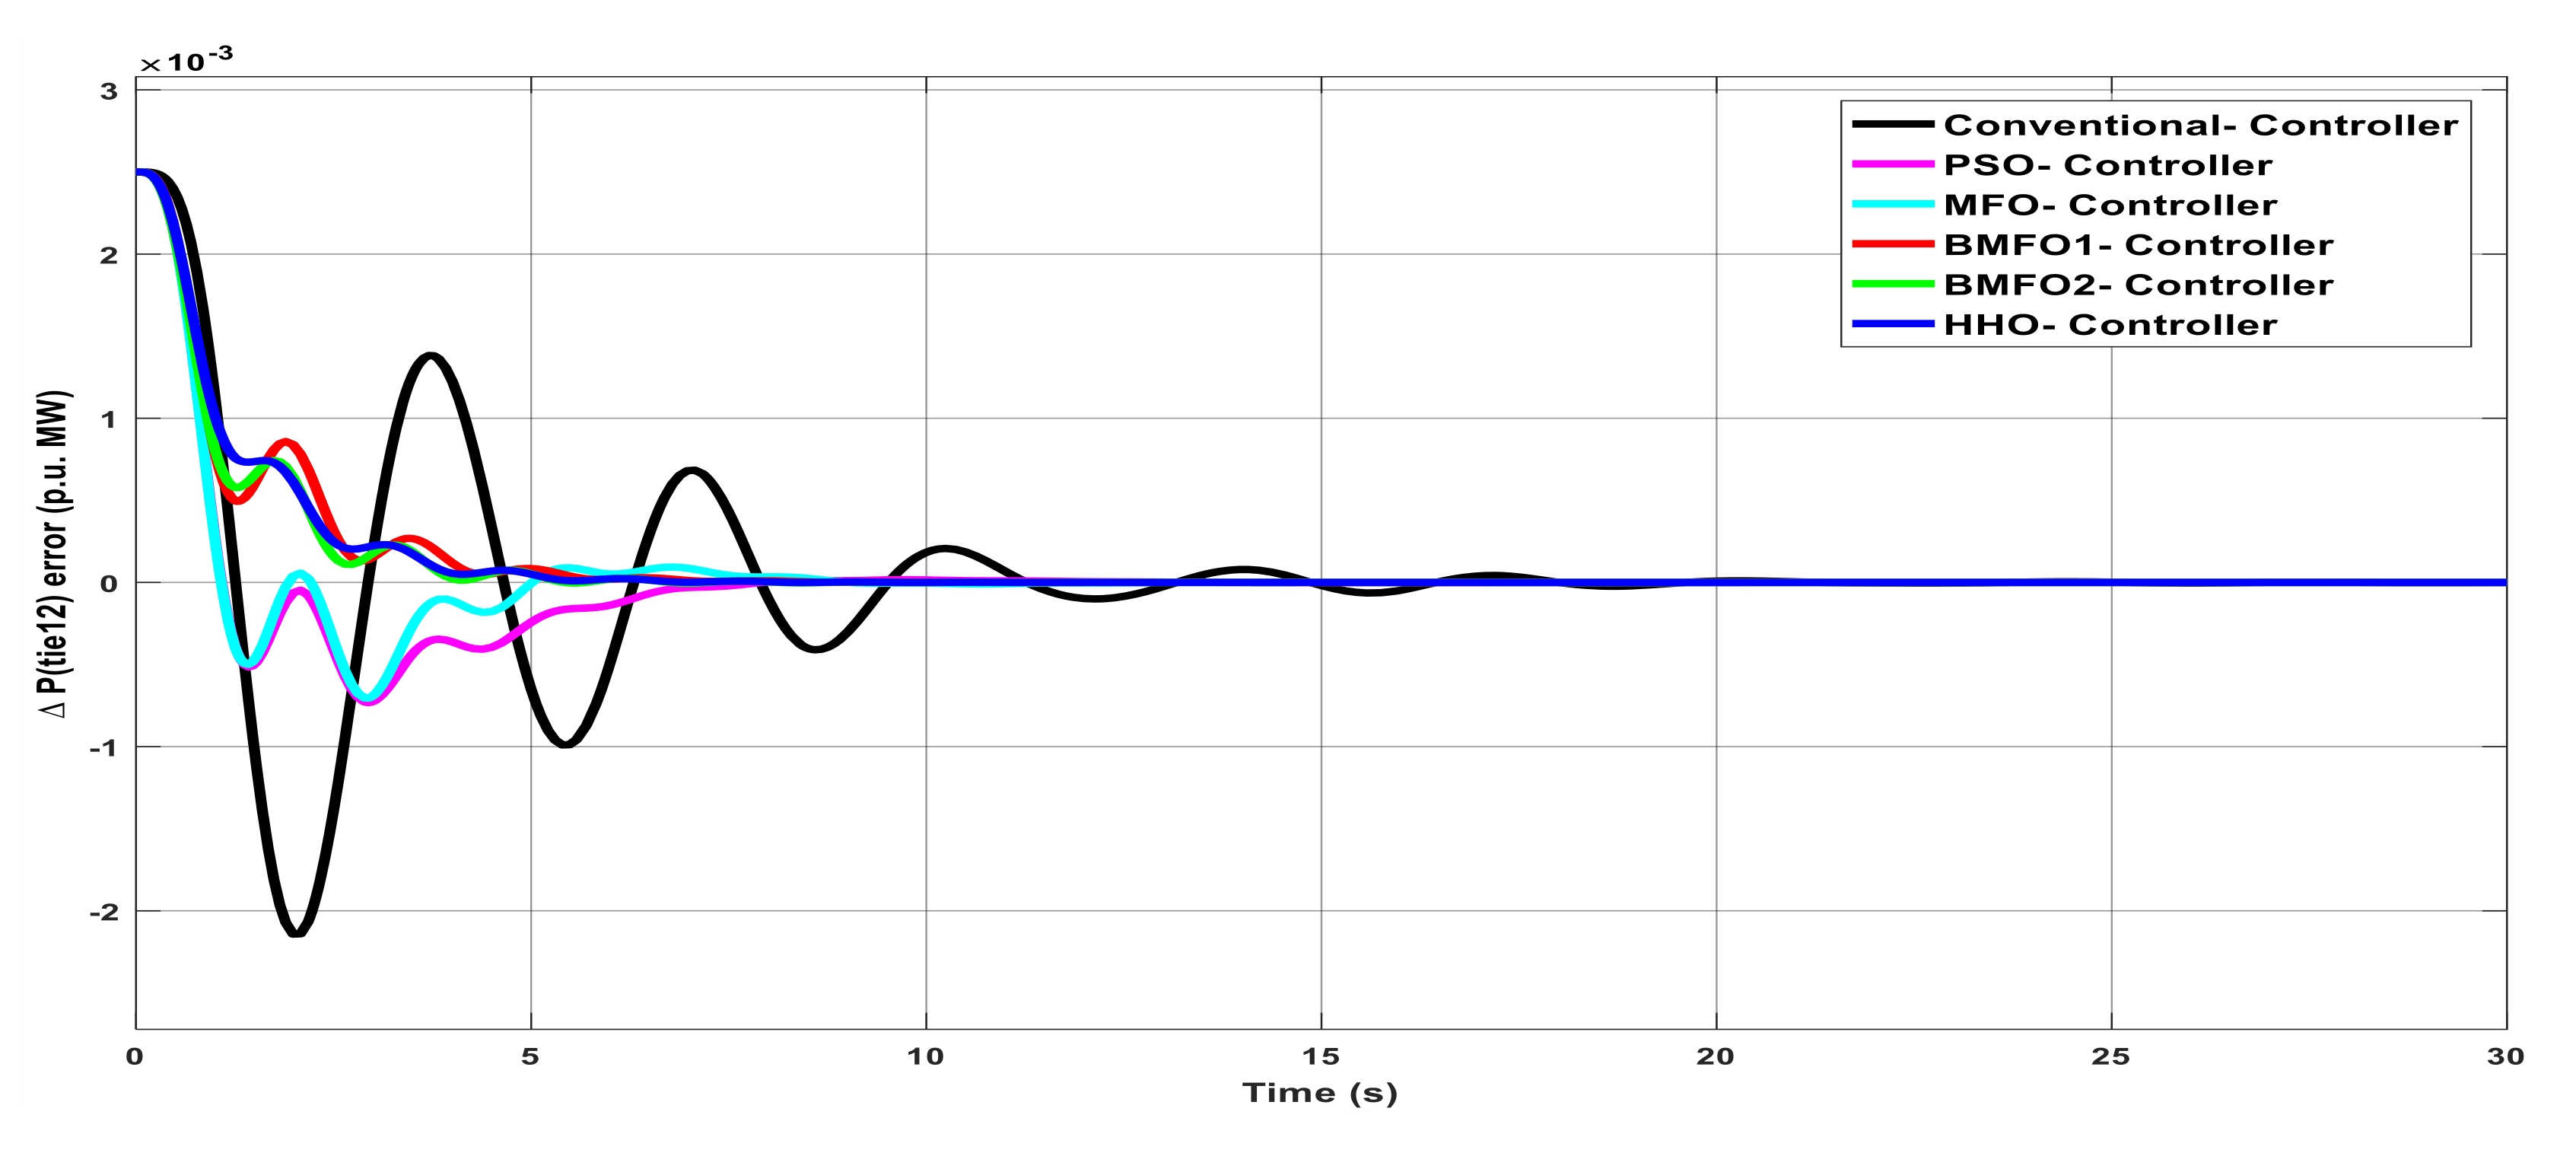
Mathematics 09 00186 g005
Figure 6. Deviation in tie-line error with various controllers under unilateral contract.
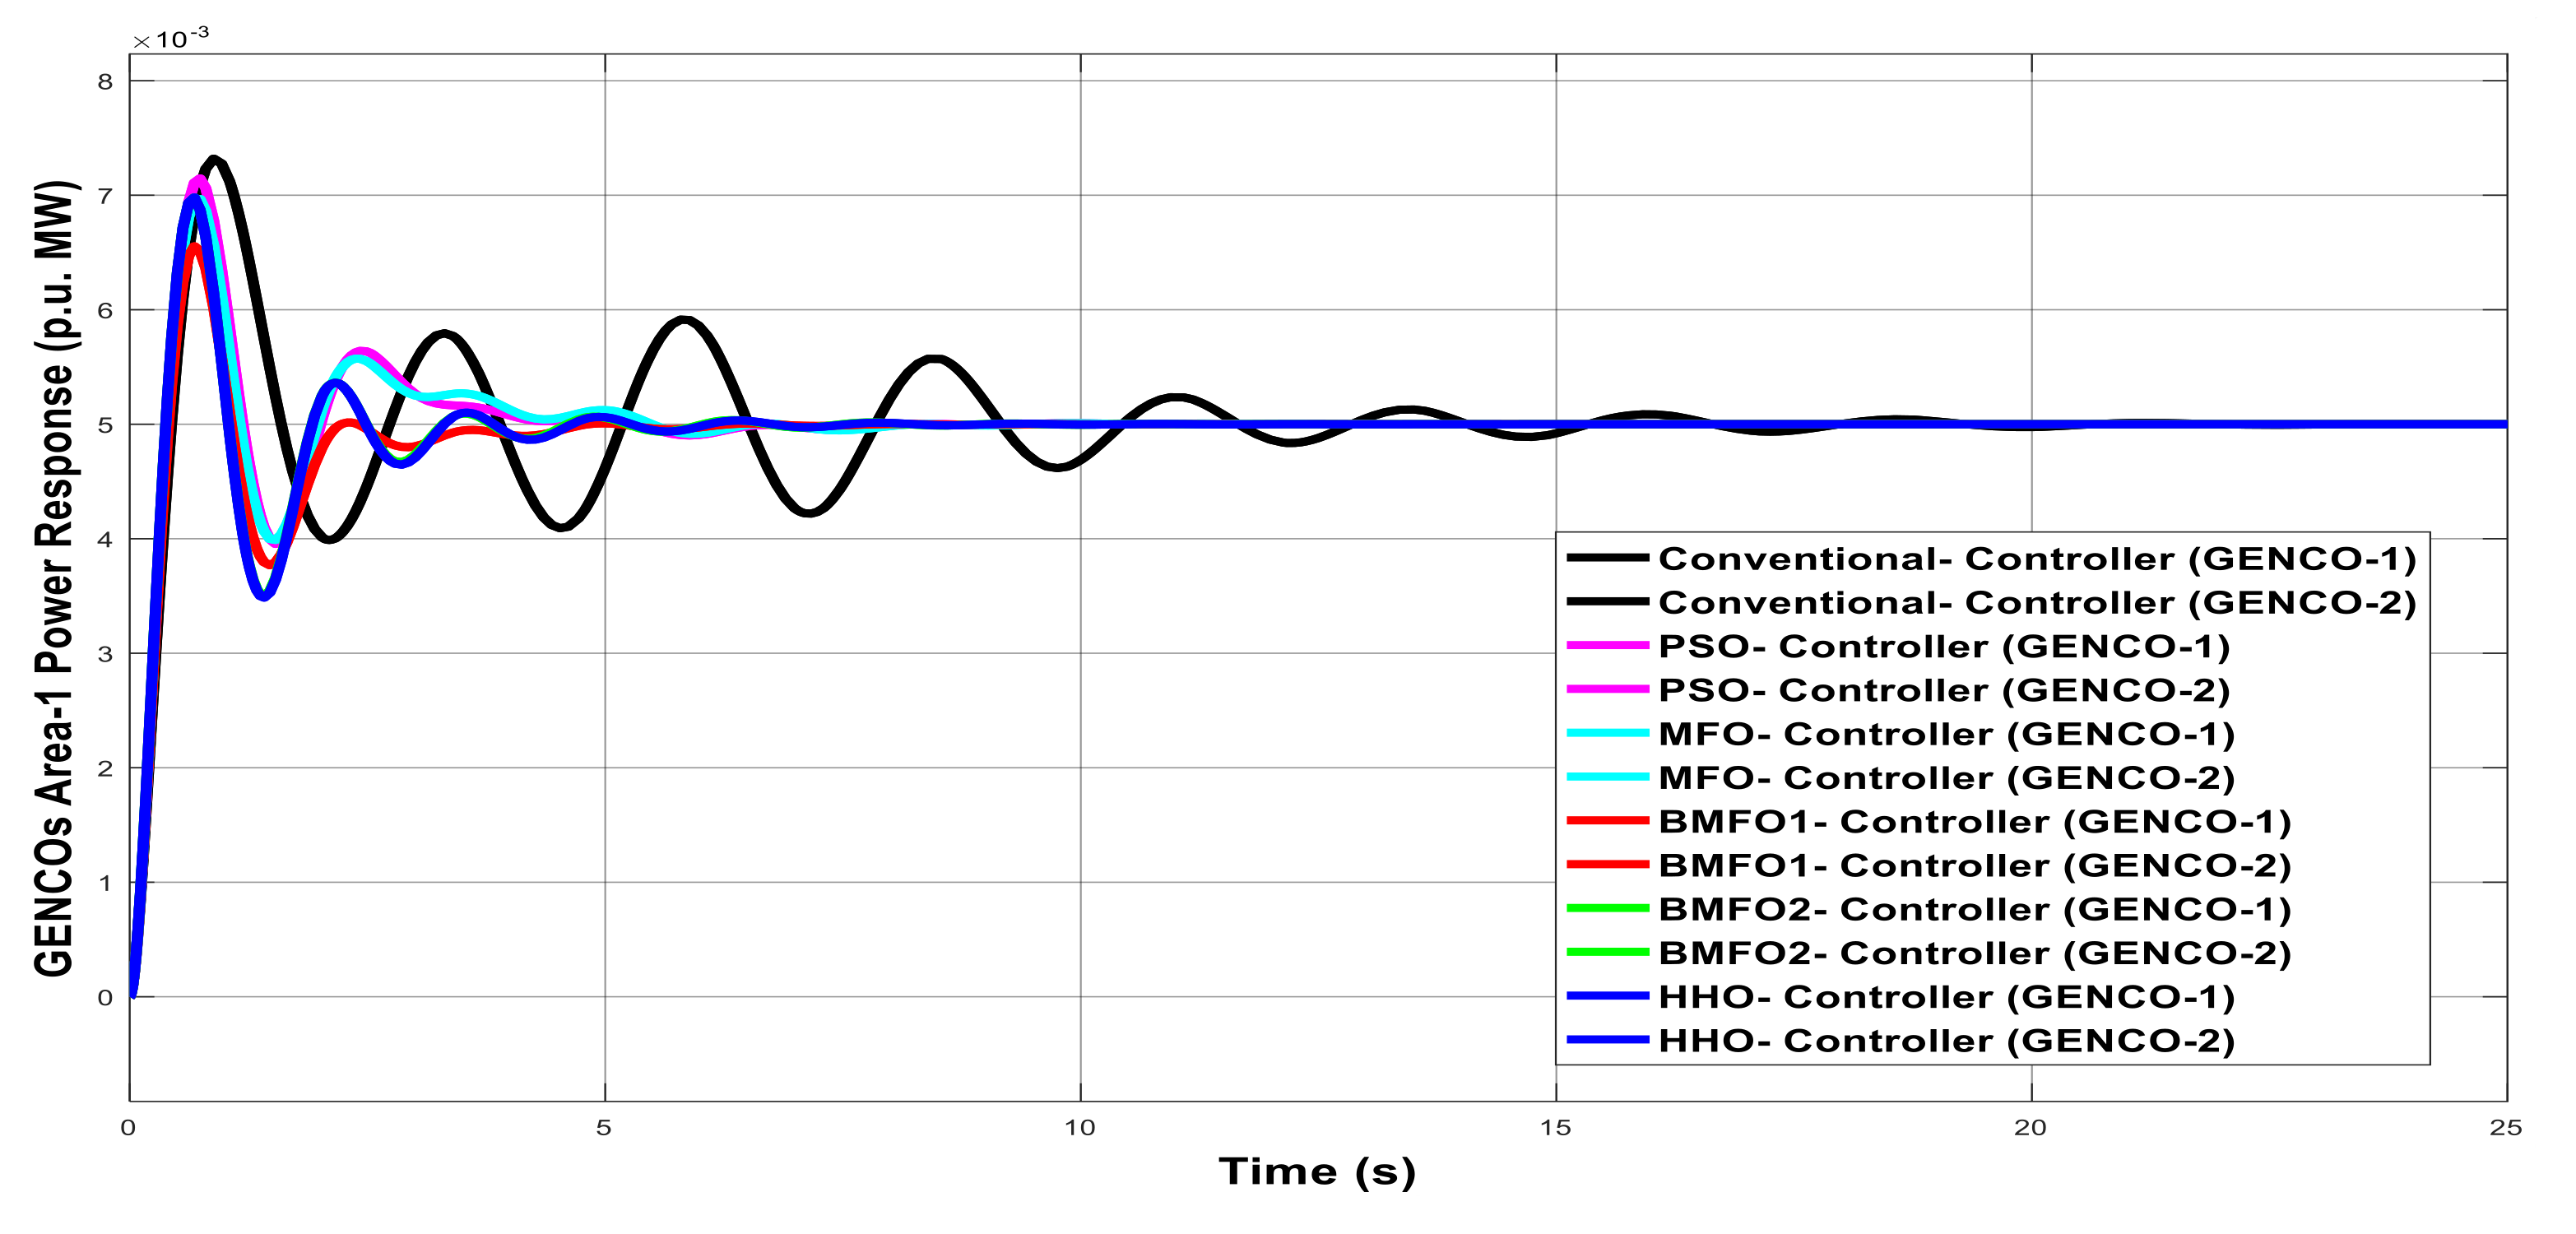
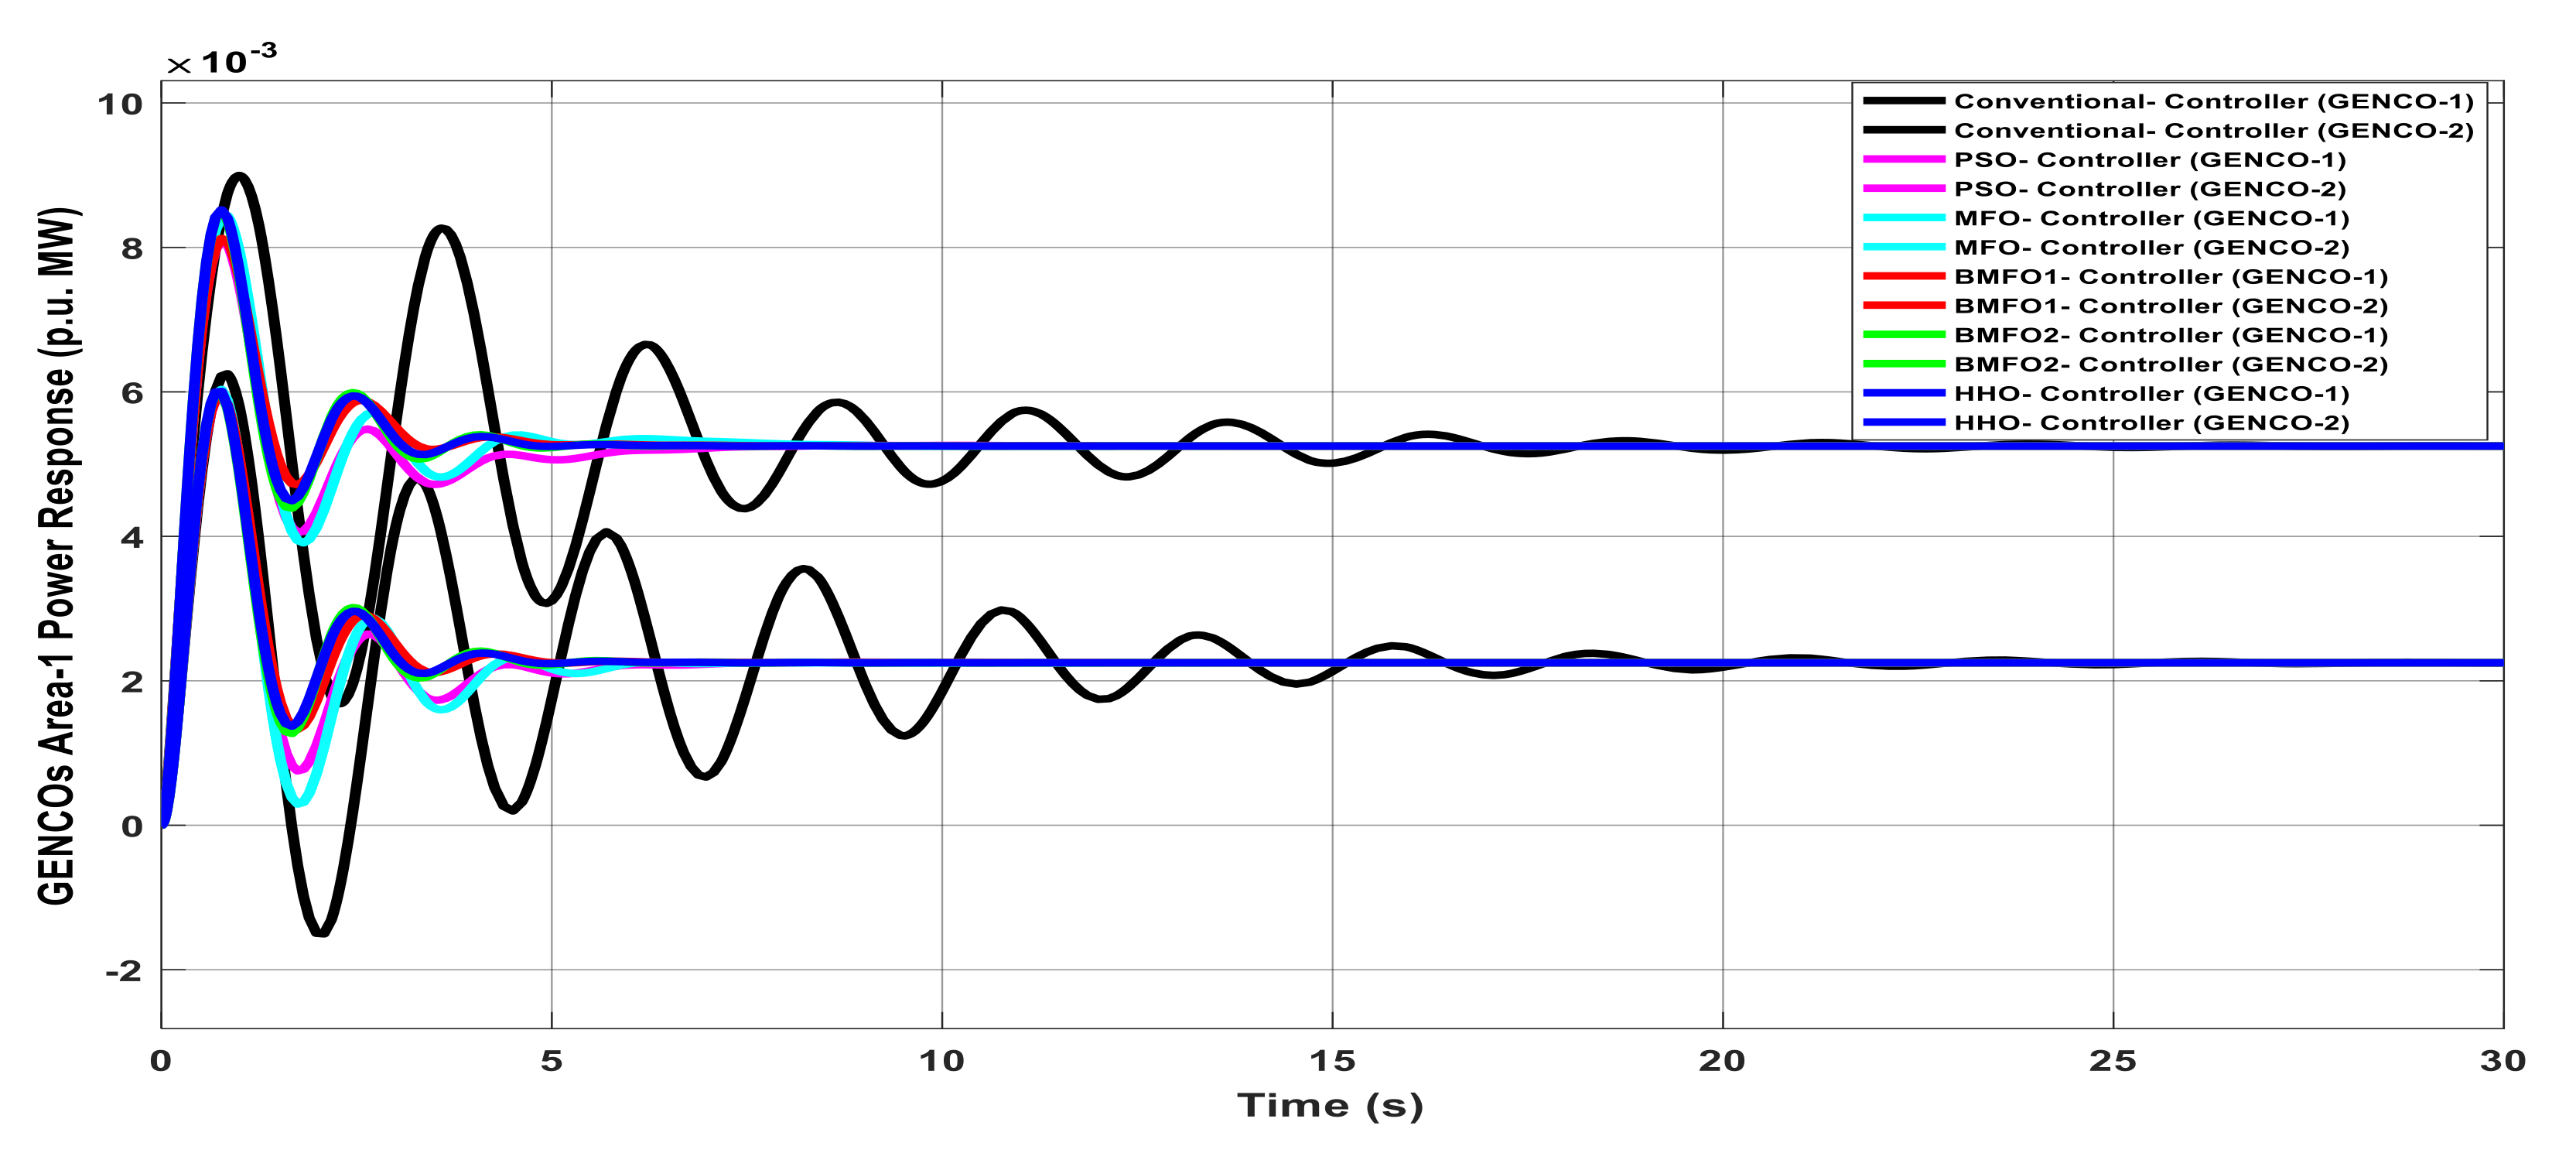
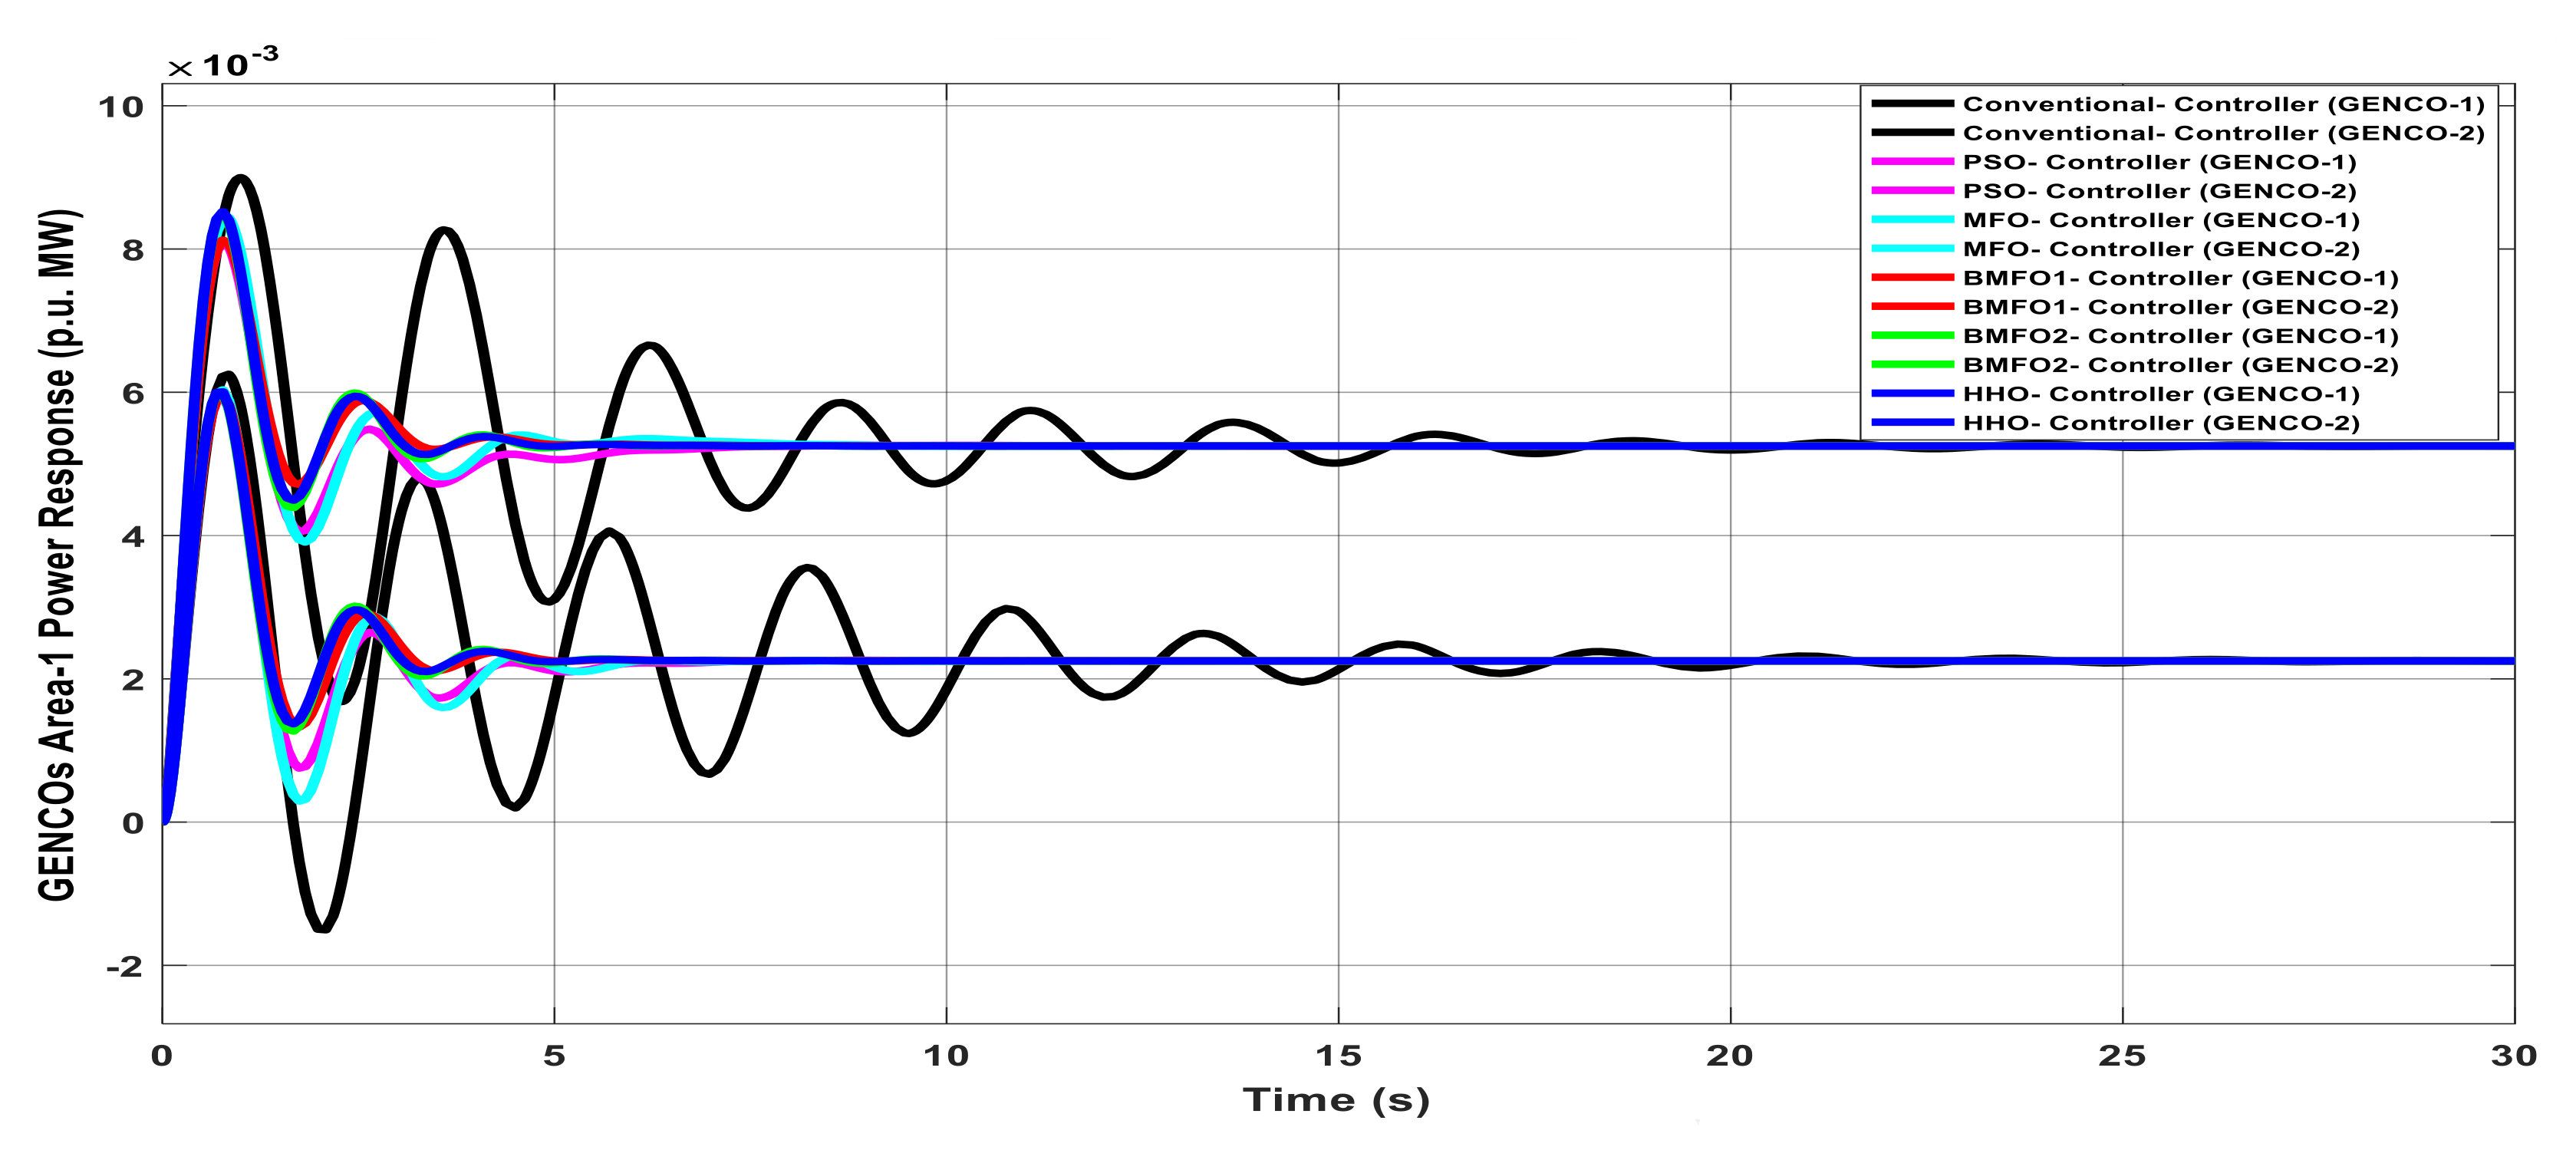
Mathematics 09 00186 g006
Figure 7. Generation Companies (GENCOs) generation response of Area1 with various controllers under unilateral contract.
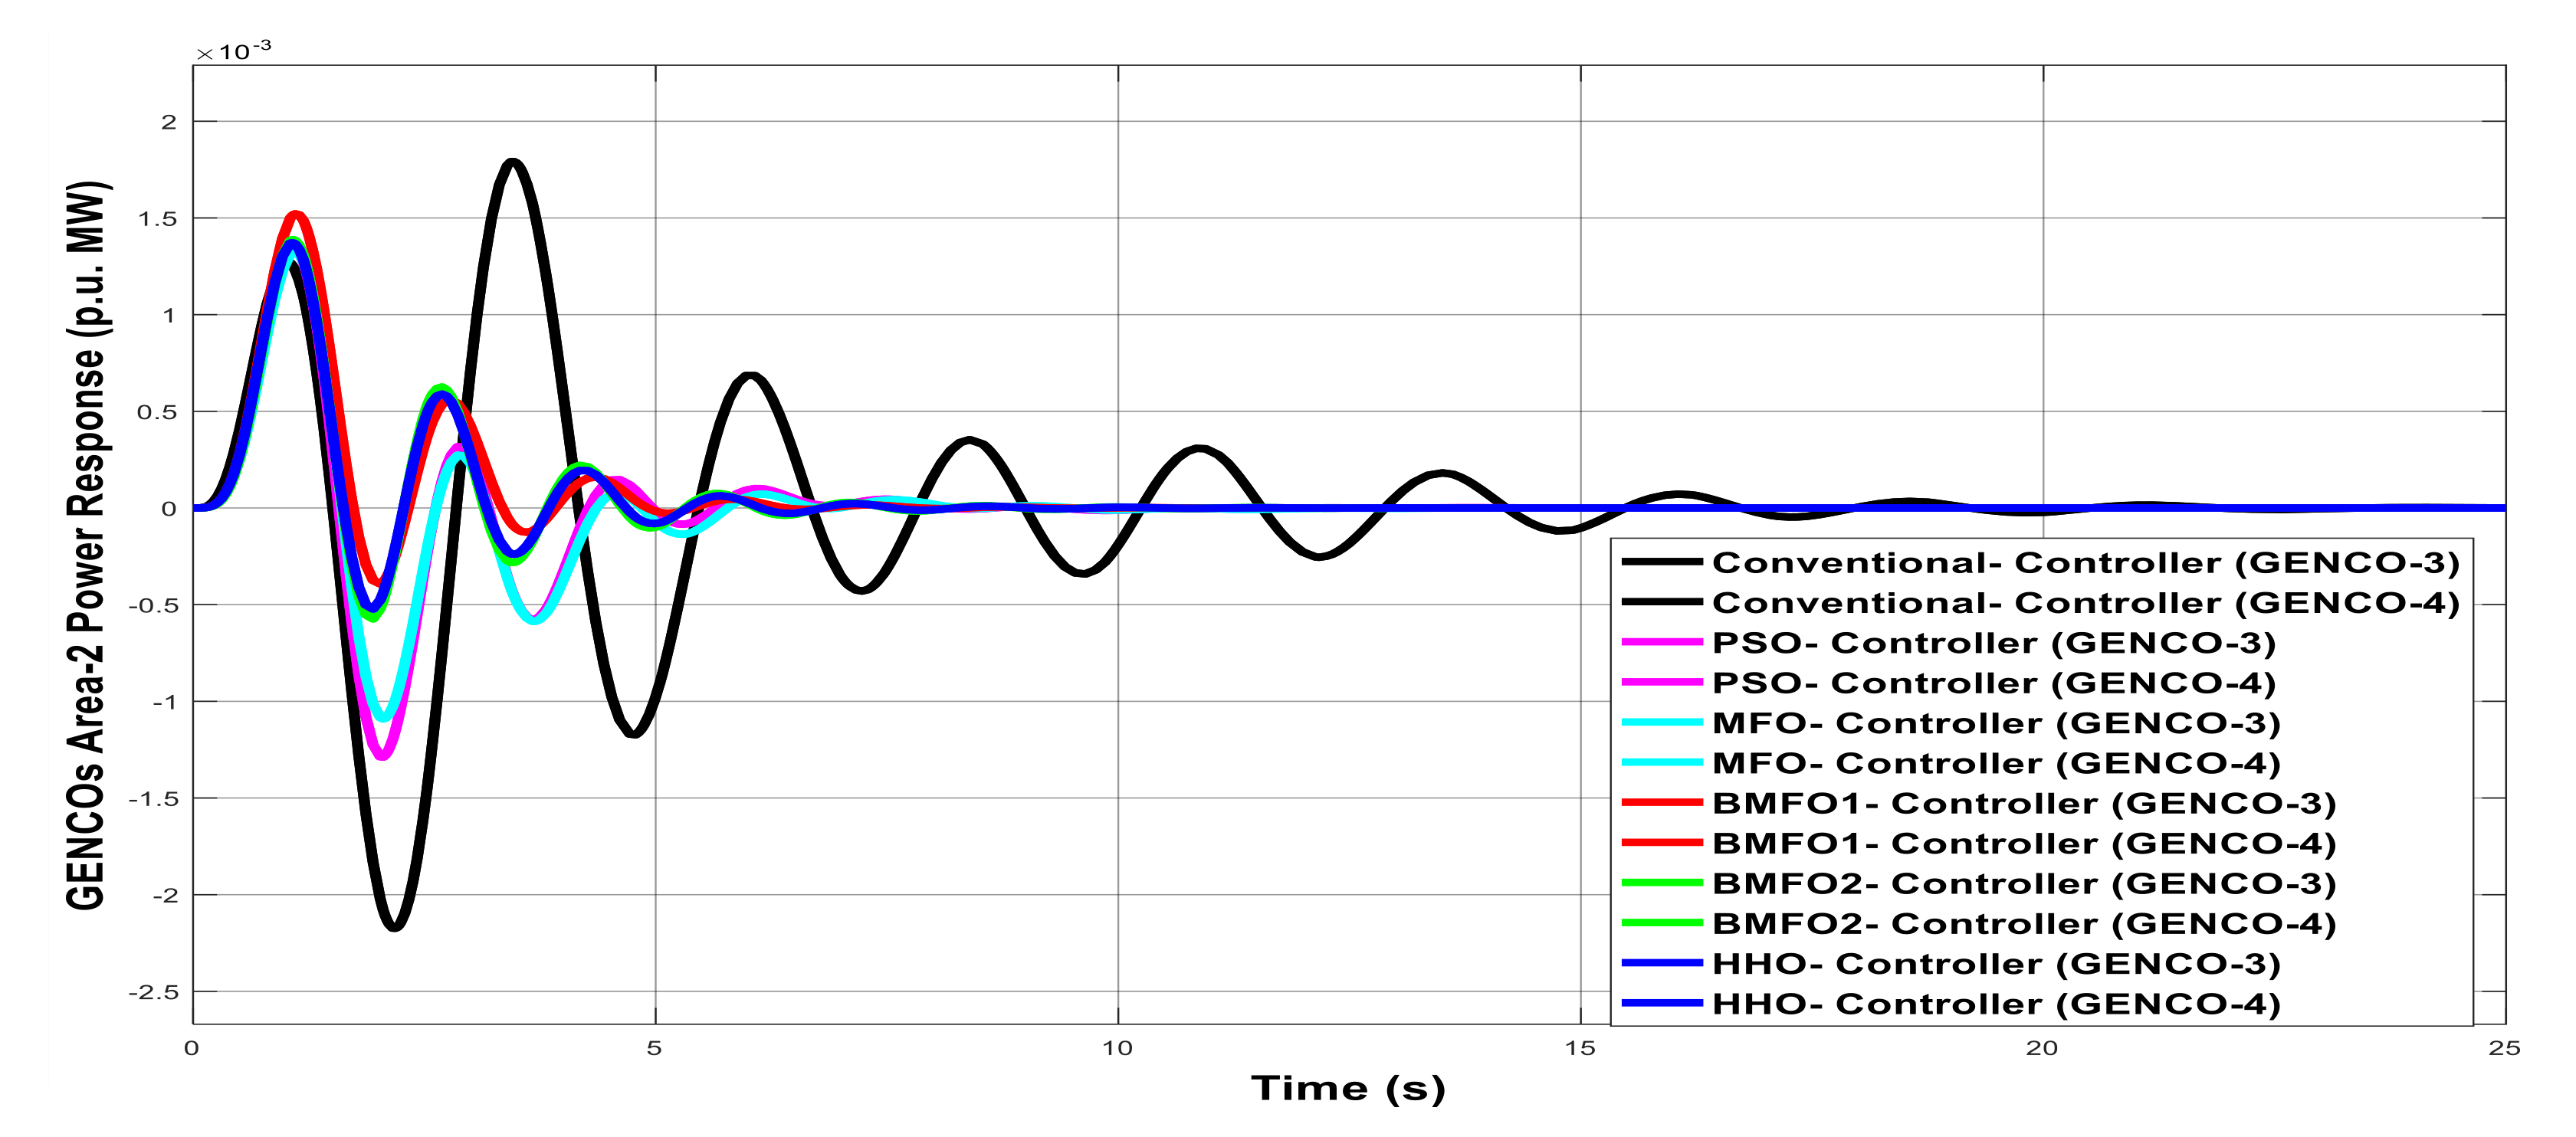
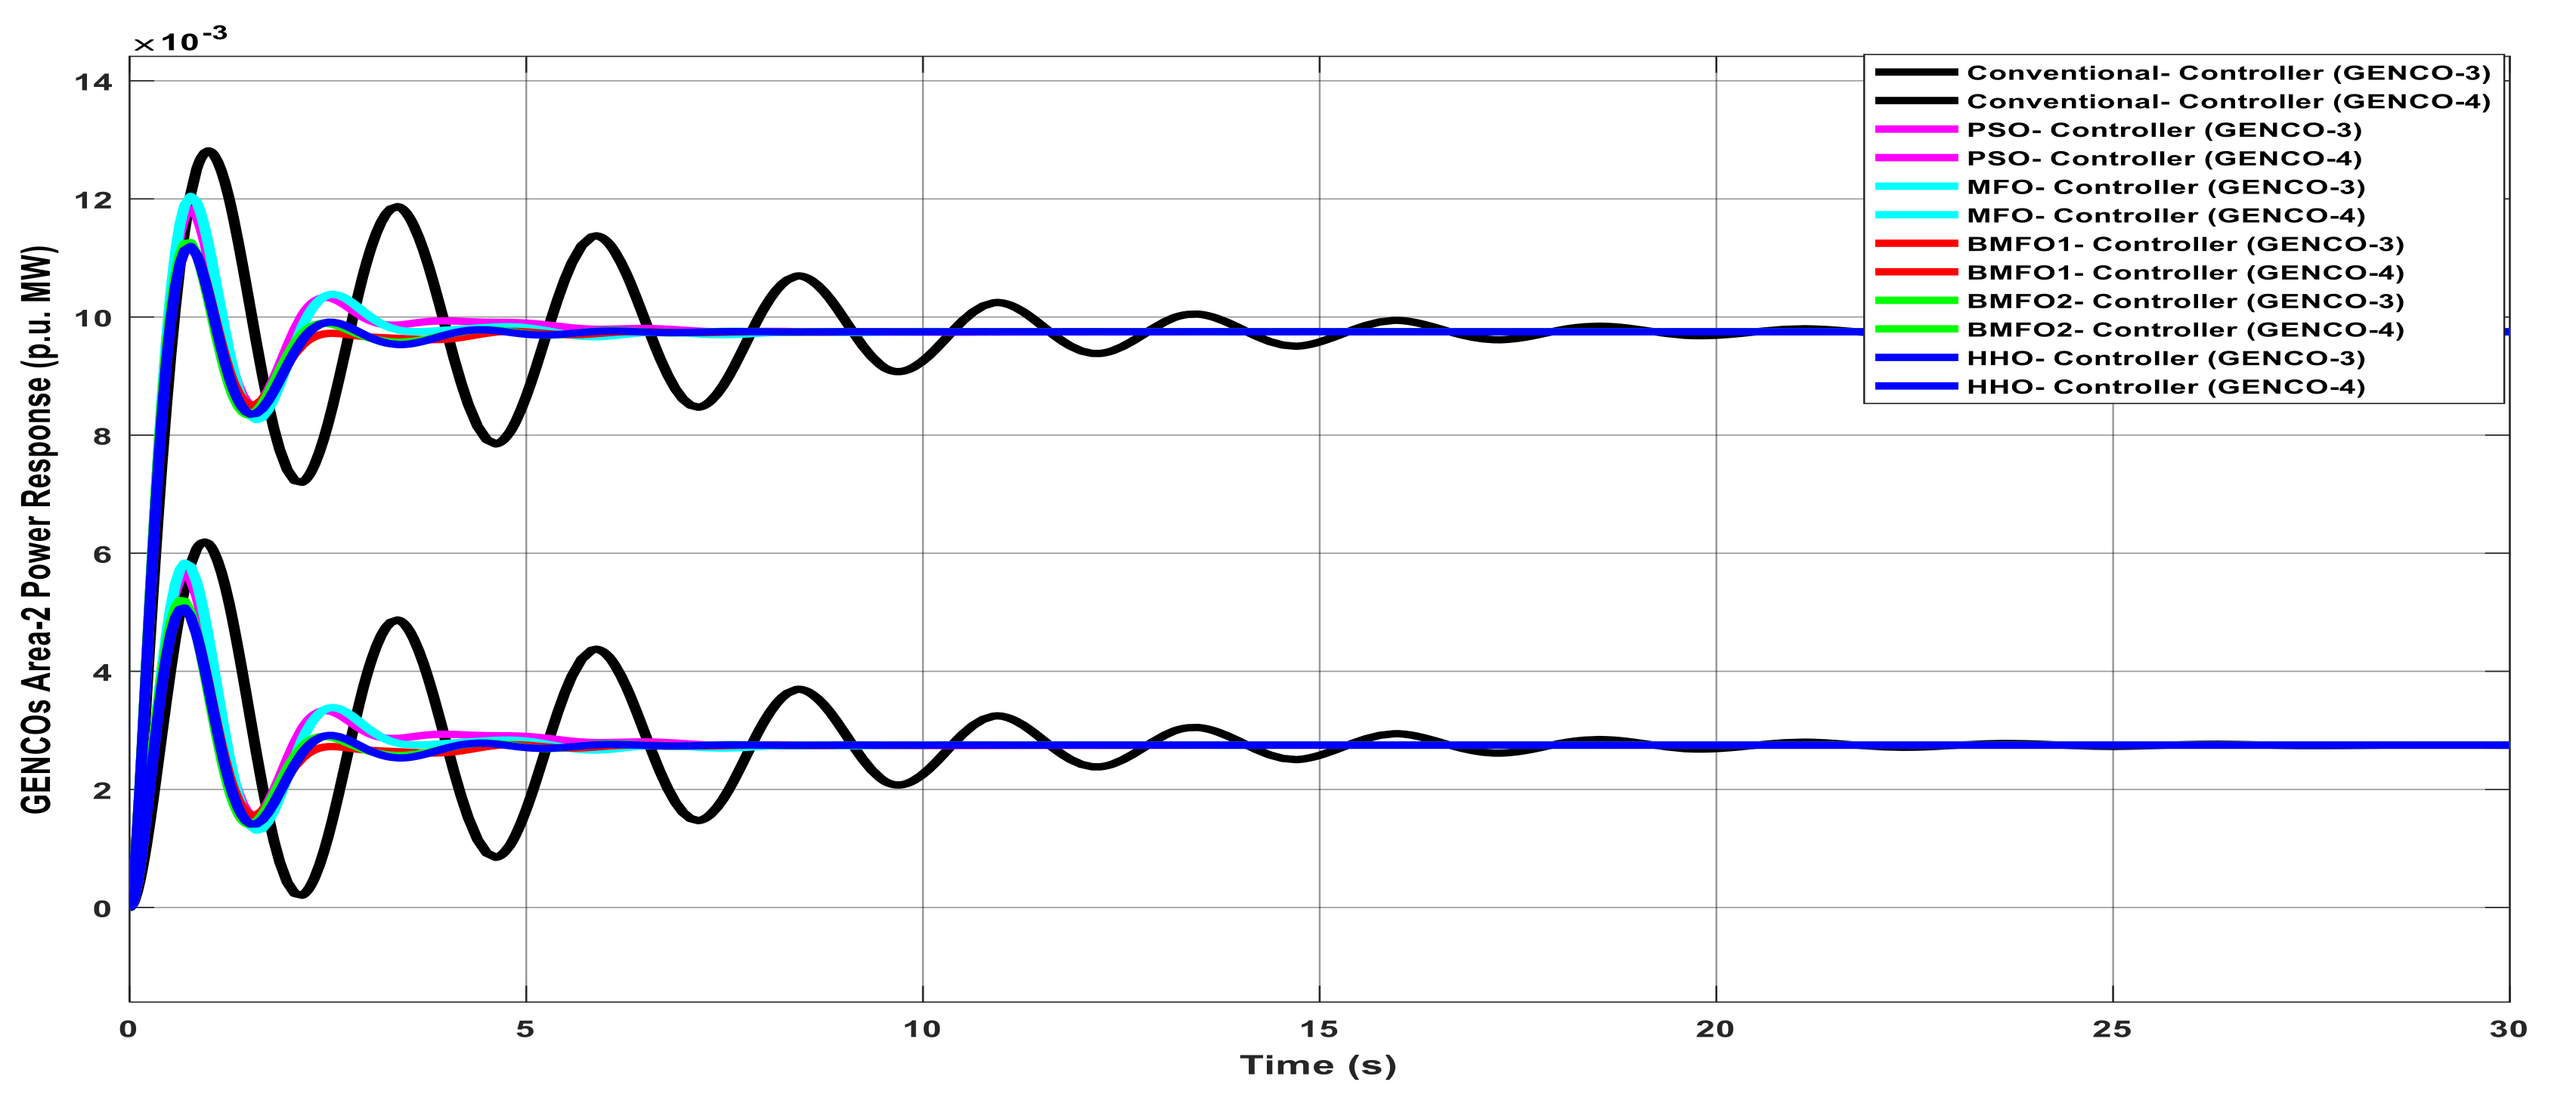
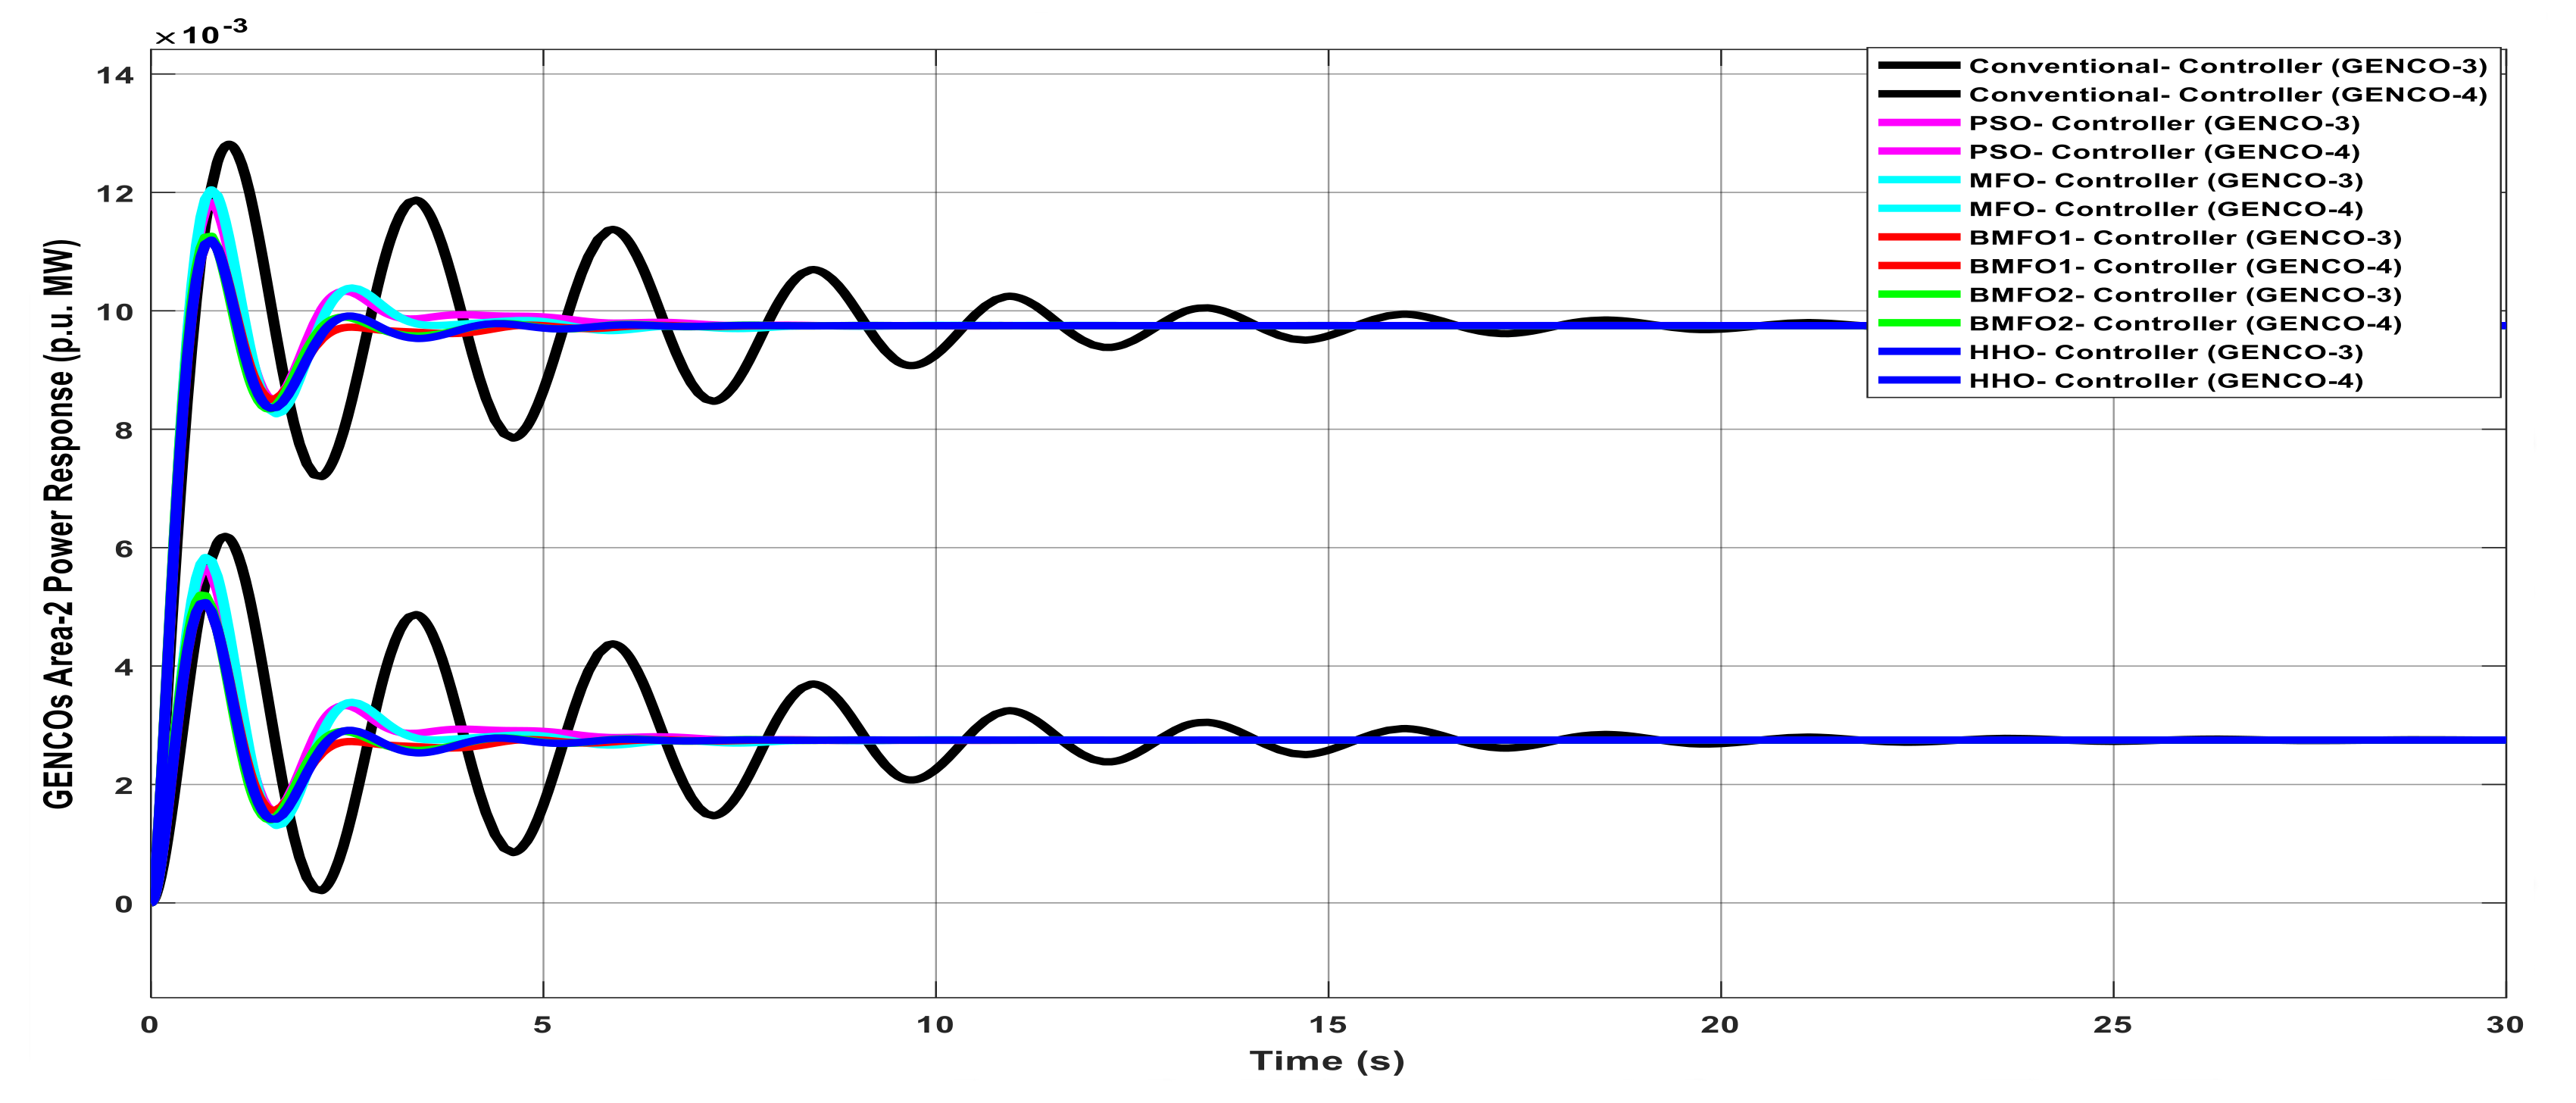
Mathematics 09 00186 g007
Figure 8. GENCOs generation response of Area2 with various controllers under unilateral contract.
Mathematics 09 00186 g008
Figure 9. Dynamic response of Area1 frequency with various controllers under bilateral contract.
Mathematics 09 00186 g009
Figure 10. Dynamic response of Area2 frequency with various controllers under bilateral contract.
Mathematics 09 00186 g010
Figure 11. Deviation in actual tie-line power flow with various controllers under bilateral contract.
Mathematics 09 00186 g011
Figure 12. Deviation in tie-line error with various controller under bilateral contract.
Mathematics 09 00186 g012
Figure 13. GENCOs generation response of Area1 with various controllers under bilateral contract.
Mathematics 09 00186 g013
Figure 14. GENCOs generation response of Area2 with various controllers under bilateral contract.
Mathematics 09 00186 g014
Figure 15. Dynamic response of Area1 frequency with various controllers under contract violation case.
Mathematics 09 00186 g015
Figure 16. Dynamic response of Area2 frequency with various controller under contract violation case.
Mathematics 09 00186 g016
Figure 17. Deviation in actual tie-line power flow with various controllers under contract violation case.
Mathematics 09 00186 g017
Figure 18. Deviation in tie-line error with various controllers under contract violation case.
Mathematics 09 00186 g018
Figure 19. GENCOs generation response of Area1 with various controllers under contract violation case.
Mathematics 09 00186 g019
Figure 20. GENCOs generation response of Area2 with various controllers under contract violation case.
Mathematics 09 00186 g020
Table 1. Performance of various algorithms in the proposed system.
ParameterNo. of TrialsMeanStandard DeviationBestWorst
PSO501.138071.008461.027741.05084
MFO500.04890.006440.028350.05073
BMFO1500.02840.000830.027450.03216
BMFO2500.02720.000110.027640.02811
HHO507.62 × 10−931.39 × 10−93 1.4 × 10−112 4.17 × 10−92
Table 2. Improved gain values of Proportional Integral (PI) controller for the expected scheme with various algorithms.
Controller TypeController Parameters
Area1Area2
K1pK1IntK2PK2Int
PSO0.53007−7.12 × 10⁻⁶ 0.28516−0.84672
MFO0.52333−0.708890.31424−0.92724
BMFO10.53126−0.00340.284359.83 × 10−6
BMFO20.55025−8.07 × 10−70.28545−1.89 × 10⁻⁶
HHO0.15025−9.059 × 10−90.18293−1.91 × 10⁻⁹
Table 3. Graph analysis of Area1 frequency with various controllers under unilateral contract.
ControllerDelay TimeRise TimePeak Overshoot TimeSettling Time
Conventional1.051.1861.37522
PSO0.88331.051.18621.430
MFO0.88331.051.14521.3
BMFO10.96671.051.14521.02
BMFO20.88331.051.08720.1
HHO0.88330.96671.0719.8
Table 4. Graph analysis of Area2 frequency with various controller under unilateral contract.
ControllerDelay TimeRise TimePeak Overshoot TimeSettling Time
Conventional1.4741.6541.86823.39
PSO1.3361.4141.59421.17
MFO1.3361.4741.59421.01
BMFO1−1.201−1.414−1.53421.43
BMFO21.2971.3751.41421.43
HHO1.2971.3751.41420.86
Table 5. Graph analysis of deviation in actual tie-line power flow with various controllers under unilateral contract.
ControllerDelay TimeRise TimePeak Overshoot TimeSettling Time
Conventional1.9353.4783.86523.39
PSO0.6641.1951.32521.17
MFO0.5350.9751.06821.01
BMFO10.435−0.778−0.86521.43
BMFO20.5350.9571.06321.43
HHO0.1620.2920.32420.86
Table 6. Graph analysis of deviation in tie-line error with various controller under unilateral contract.
ControllerDelay TimeRise TimePeak Overshoot TimeSettling Time
Conventional2.9355.2805.86522
PSO2.1183.8144.23521.430
MFO1.9553.4983.88621.3
BMFO11.1152.0022.22421.02
BMFO21.9883.5553.95020.1
HHO1.1572.0852.31519.8
Table 7. Graph analysis of GENCOs generation response of Area1 with various controllers under unilateral contract.
ControllerDelay TimeRise TimePeak Overshoot TimeSettling Time
Conventional3.6656.5957.32523.39
PSO3.5986.4787.19521.17
MFO3.5086.3157.01521.01
BMFO13.3356.0026.66821.43
BMFO23.5036.3057.00521.43
HHO3.3356.0026.66820.86
Table 8. Graph analysis of GENCOs generation response of Area2 with various controllers under unilateral contract.
ControllerDelay TimeRise TimePeak Overshoot TimeSettling Time
Conventional0.8881.5981.77522
PSO0.7251.3051.45021.430
MFO0.7341.3331.46821.3
BMFO10.7551.3551.50521.02
BMFO20.7231.3001.44520.1
HHO0.6951.2511.39019.8
Table 9. Graph analysis of Area1 frequency with various controllers under bilateral contract.
ControllerDelay TimeRise TimePeak Overshoot TimeSettling Time
Conventional−2.414−4.205−4.66823.39
PSO−1.508−2.715−3.01521.17
MFO−1.503−2.705−3.00521.01
BMFO1−1.003−1.805−2.00521.43
BMFO2−0.978−1.766−1.95521.43
HHO−0.835−1.499−1.66520.86
Table 10. Graph analysis of Area2 frequency with various controllers under bilateral contract.
ControllerDelay TimeRise TimePeak Overshoot TimeSettling Time
Conventional0.00660.01180.013123.39
PSO0.00310.00470.005221.17
MFO0.00450.00740.008221.01
BMFO10.00260.00460.005121.43
BMFO20.00270.00480.005321.43
HHO0.00230.00410.004520.86
Table 11. Graph analysis of deviation in actual tie-line power flow with various controllers under bilateral contract.
ControllerDelay TimeRise TimePeak Overshoot TimeSettling Time
Conventional0.01060.01900.021123.39
PSO0.00430.00770.008521.17
MFO0.00630.01140.012521.01
BMFO10.00330.00590.006521.43
BMFO20.00310.00550.006121.43
HHO0.00290.00530.005820.86
Table 12. Graph analysis of deviation in tie-line error with various controller under bilateral contract.
ControllerDelay TimeRise TimePeak Overshoot TimeSettling Time
Conventional1.2842.3112.56822
PSO1.2782.2992.55521.430
MFO1.2772.2982.55421.3
BMFO11.2772.2972.55321.02
BMFO21.2772.2962.55220.1
HHO1.2762.2952.55119.8
Table 13. (a). Graphanalysis of GENCOs to Distribution Companies (DISCOs) generation response of Area1 with various controllers under bilateral contract. (b). Graph analysis of DISCOs to GENCOs generation response of Area1 with various controllers under bilateral contract.
(a)
ControllerDelay TimeRise TimePeak Overshoot TimeSettling Time
Conventional3.1305.6306.25523.39
PSO3.1165.6086.23121.17
MFO3.0565.5146.11221.01
BMFO13.0565.5146.11221.43
BMFO23.0445.4786.08821.43
HHO3.0065.4116.01220.86
(b)
ControllerDelay TimeRise TimePeak Overshoot TimeSettling Time
Conventional4.5088.1149.01522
PSO4.3357.7998.66521.430
MFO4.3357.7998.66521.3
BMFO14.2587.6638.51421.02
BMFO24.2587.6638.51420.1
HHO4.2247.6008.44519.8
Table 14. (a). Graph analysis of GENCOs to DISCOs generation response of Area2 with various controllers under bilateral contract. (b). Graph analysis of DISCOs to GENCOs generation response of Area2 with various controllers under bilateral contract.
(a)
ControllerDelay TimeRise TimePeak Overshoot TimeSettling Time
Conventional3.1145.5916.21223.39
PSO2.9435.2975.88521.17
MFO2.9985.3975.99621.01
BMFO12.8575.1435.71421.43
BMFO22.6634.7925.32421.43
HHO2.5064.5115.01220.86
(b)
ControllerDelay TimeRise TimePeak Overshoot TimeSettling Time
Conventional6.43411.57912.86522
PSO6.00610.81112.01221.430
MFO6.06610.90112.11221.3
BMFO16.06610.90112.11221.02
BMFO25.88510.59511.77020.1
HHO5.56410.00111.11219.8
Table 15. Graph analysis of Area1 frequency with various controllers under contract violation case.
ControllerDelay TimeRise TimePeak Overshoot TimeSettling Time
Conventional−2.414−4.205−4.66823.39
PSO−1.508−2.715−3.01521.17
MFO−1.503−2.705−3.00521.01
BMFO1−1.003−1.805−2.00521.43
BMFO2−0.978−1.766−1.95521.43
HHO−0.835−1.499−1.66520.86
Table 16. Graph analysis of Area2 frequency with various controller under contract violation case.
ControllerDelay TimeRise TimePeak Overshoot TimeSettling Time
Conventional0.00660.01180.013123.39
PSO0.00310.00470.005221.17
MFO0.00450.00740.008221.01
BMFO10.00260.00460.005121.43
BMFO20.00270.00480.005321.43
HHO0.00230.00410.004520.86
Table 17. Graph analysis of deviation in actual tie-line power flow with various controller under contract violation case.
ControllerDelay TimeRise TimePeak Overshoot TimeSettling Time
Conventional0.01060.01900.021123.39
PSO0.00430.00770.008521.17
MFO0.00630.01140.012521.01
BMFO10.00330.00590.006521.43
BMFO20.00310.00550.006121.43
HHO0.00290.00530.005820.86
Table 18. Graph analysis of deviation in tie-line error with various controllers under contract violation case.
ControllerDelay TimeRise TimePeak Overshoot TimeSettling Time
Conventional1.2842.3112.56822
PSO1.2782.2992.55521.430
MFO1.2772.2982.55421.3
BMFO11.2772.2972.55321.02
BMFO21.2772.2962.55220.1
HHO1.2762.2952.55119.8
Table 19. (a). Graph analysis of GENCOs to DISCOs generation response of Area1 with various controllers under contract violation case. (b). Graph analysis of DISCOs to GENCOs generation response of Area1 with various controllers under contract violation case.
(a)
ControllerDelay TimeRise TimePeak Overshoot TimeSettling Time
Conventional3.1305.6306.25523.39
PSO3.1165.6086.23121.17
MFO3.0565.5146.11221.01
BMFO13.0565.5146.11221.43
BMFO23.0445.4786.08821.43
HHO3.0065.4116.01220.86
(b)
ControllerDelay TimeRise TimePeak Overshoot TimeSettling Time
Conventional4.5088.1149.01522
PSO4.3357.7998.66521.430
MFO4.3357.7998.66521.3
BMFO14.2587.6638.51421.02
BMFO24.2587.6638.51420.1
HHO4.2247.6008.44519.8
Table 20. (a). Graph analysis of GENCOs to DISCOs generation response of Area2 with various controllers under contract violation case. (b). Graph analysis of DISCOs to GENCOs generation response of Area2 with various controllers under contract violation case.
(a)
ControllerDelay TimeRise TimePeak Overshoot TimeSettling Time
Conventional3.1145.5916.21223.39
PSO2.9435.2975.88521.17
MFO2.9985.3975.99621.01
BMFO12.8575.1435.71421.43
BMFO22.6634.7925.32421.43
HHO2.5064.5115.01220.86
(b)
ControllerDelay TimeRise TimePeak Overshoot TimeSettling Time
Conventional6.43411.57912.86522
PSO6.00610.81112.01221.430
MFO6.06610.90112.11221.3
BMFO16.06610.90112.11221.02
BMFO25.88510.59511.77020.1
HHO5.56410.00111.11219.8
Publisher’s Note: MDPI stays neutral with regard to jurisdictional claims in published maps and institutional affiliations.

