Article

An Efficient Framework for Multi-Objective Risk-Informed Decision Support Systems for Drainage Rehabilitation

by
Xiatong Cai
1,*,
Abdolmajid Mohammadian
1 and
Hamidreza Shirkhani
1,2
1
Department of Civil Engineering, University of Ottawa, 161 Louis Pasteur, CBY A114, Ottawa, ON K1N 6N5, Canada
2
National Research Council Canada (NRCC), 1200 Montreal Road, Ottawa, ON K1A 0R6, Canada
*
Author to whom correspondence should be addressed.
Math. Comput. Appl. 2020, 25(4), 73; https://0-doi-org.brum.beds.ac.uk/10.3390/mca25040073
Submission received: 6 September 2020 / Revised: 18 October 2020 / Accepted: 18 October 2020 / Published: 2 November 2020
(This article belongs to the Special Issue Numerical and Evolutionary Optimization 2020)

Abstract

:
Combining multiple modules into one framework is a key step in modelling a complex system. In this study, rather than focusing on modifying a specific model, we studied the performance of different calculation structures in a multi-objective optimization framework. The Hydraulic and Risk Combined Model (HRCM) combines hydraulic performance and pipe breaking risk in a drainage system to provide optimal rehabilitation strategies. We evaluated different framework structures for the HRCM model. The results showed that the conventional framework structure used in engineering optimization research, which includes (1) constraint functions; (2) objective functions; and (3) multi-objective optimization, is inefficient for drainage rehabilitation problem. It was shown that the conventional framework can be significantly improved in terms of calculation speed and cost-effectiveness by removing the constraint function and adding more objective functions. The results indicated that the model performance improved remarkably, while the calculation speed was not changed substantially. In addition, we found that the mixed-integer optimization can decrease the optimization performance compared to using continuous variables and adding a post-processing module at the last stage to remove the unsatisfying results. This study (i) highlights the importance of the framework structure inefficiently solving engineering problems, and (ii) provides a simplified efficient framework for engineering optimization problems.

1. Introduction

Urban flooding happens when the capacity of a municipal sewerage system cannot support the amount of water that emerges in a short period of time [1]. Such a large amount of water could have either resulted from an intensified storm due to climate change [2,3,4], or freshets that amplify the stress on the sewerage system [5]. In order to release the stress of overflooding in cities, transforming the sewerage system and increasing its resilience to extreme weather can be a priority to increase the resilience of cities.
Computational simulations have been used for urban planning, including underground infrastructure design and pipe rehabilitation in recent years [6,7]. The essential idea is to build an optimization framework and apply it to modify a set of drainage system related variables such as the diameter, slope, and depth of the pipe. The framework requires the users to select applicable objective functions, which can be the system hydraulic performance or system pipe breaking risk [8,9], to maximize the performance of the system. Previous studies have focused on various aspects such as the cost of flooding damage [10], and integrated 1D/2D hydraulic modelling, where the SWMM5 was used as the 1D hydraulic model for sewer system simulations and a 2D model was employed to analyze the overflooding consequences in the drainage basin to obtain more accurate results on the damage of urban flooding [11].
In addition to the surcharge, drainage systems face more challenges, such as ageing due to natural and human impacts [12]. The threat of drainage pipes breaking cannot be ignored at locations across the world [13,14,15]. Canada’s Infrastructure Card [12], reported that nearly one-third of potable water and sewerage pipes underground are imposed to breaking risk. Due to the ageing of the pipe system, the breakage of water supply pipes and sewerage pipes can introduce secondary pollutants into potable water and threaten human health [16].
Accurate predictions of the current and future conditions of a sewerage system using available assessment data are crucial for developing appropriate strategies for ageing pipe maintenance and rehabilitation. Statistical models are used to predict the probability of pipe failure in a drainage system [17]. The advantage of statistical models is that they are easy to apply in a large system to calculate the systematical performance when the random impacts can be ignored. Some statistical models such as the homogeneous Poisson processes model, non-homogeneous Poisson process model, and zero-inflated non-homogeneous Poisson process model, which use the age (time) of a pipe to predict its failure, have good performance in practice [18,19].
Altarabsheh et al. [20,21] conducted research based on whole lifecycle assessment, genetic algorithm, and Monte Carlo simulation to maximize network condition and serviceability while minimizing network risk of failure and total lifecycle cost for the entire planning period. State transition in a Markov chain can simulate the life of a pipe and predict the whole life risk of a pipe [22]. Other methods such as evolutionary polynomial regression [23], ordinal regression model [24], and flexible fuzzy model [25] are promising methods. Researchers have also concentrated on deciding the consequences of failure, such as the analytical hierarchy process [26,27]. However, this line of research has not been applied with drainage surcharge for drainage rehabilitation and design.
Cai et al. [28] combined hydraulic performance and breaking risk via a multi-objective genetic algorithm optimization framework. By building a relationship between rehabilitation and hydraulic performance as well as pipe breaking risk, they provided a novel decision support system for drainage systems rehabilitation. In their methodology, they used the traditional three-element optimization method: (1) set constraint functions to allow the system meet basic requirements; (2) set objective functions to improve the performance of the system; and (3) use a linkage module to link different modules in the system. They used one constraint function to control the overflooding in an urban system, and used a hydraulic performance objective function to optimize the rehabilitation methods. In their paper, they used a breadth-first searching algorithm to separate the problematic system and then optimized the system by a hydraulic diagnostic model [29] from the high impact drainage chain route to the low impact drainage chain route. This method provides good results for various drainage systems. However, there are some limitations in their framework. The overflooding was solved by constraint function, which means they added many logistic judgments in their algorithm, and that will decrease the calculation speed. Second, this hydraulic diagnostic model is designed to search for a narrow pipe in a chain route in a drainage system. Therefore, it can decrease the speed when they apply this method chain by chain to search for all the narrow pipes in the drainage network. In their research, they only discussed the genetic algorithm (GA), which neglected other optimization methods, such as particle swarm optimization (PSO) that has been used in drainage rehabilitation problems [30].
In this research, we improved the three-element optimization framework, which included constraint functions, objective functions, and multi-objective optimization, and created a faster and more accurate framework for urban drainage system. We improved their first-generation rehabilitation methodology from four aspects. (1) Enlighted by a multiple-stage decision support system [31], we improved their framework to get accurate results by adding a new objective function to optimize the budget distribution. (2) We tested whether the constraint function can be removed, and the final results can be selected by a filter to increase the speed. (3) We examined whether it is accurate enough to use the overflooding index in each node for optimization. In this way, the new algorithm does not need to search the network chain by chain. (4) We tested whether particle swarm optimization can have better results than the genetic algorithm in this problem. This is because, in literatures, there is a debate on which method has a better performance in drainage systems.
This paper is organized as follows: first, the structure of our new algorithms is introduced; subsequently, we specify the new algorithms in a computational model, Hydraulics and Risk Combined Model (HRCM). Then, two scenarios are studied to verify those new methods. Finally, we provide a combined methodology to replace/rehabilitate pipes in the drainage system for urban flooding control and pipe breaking precaution.

2. Materials and Methods

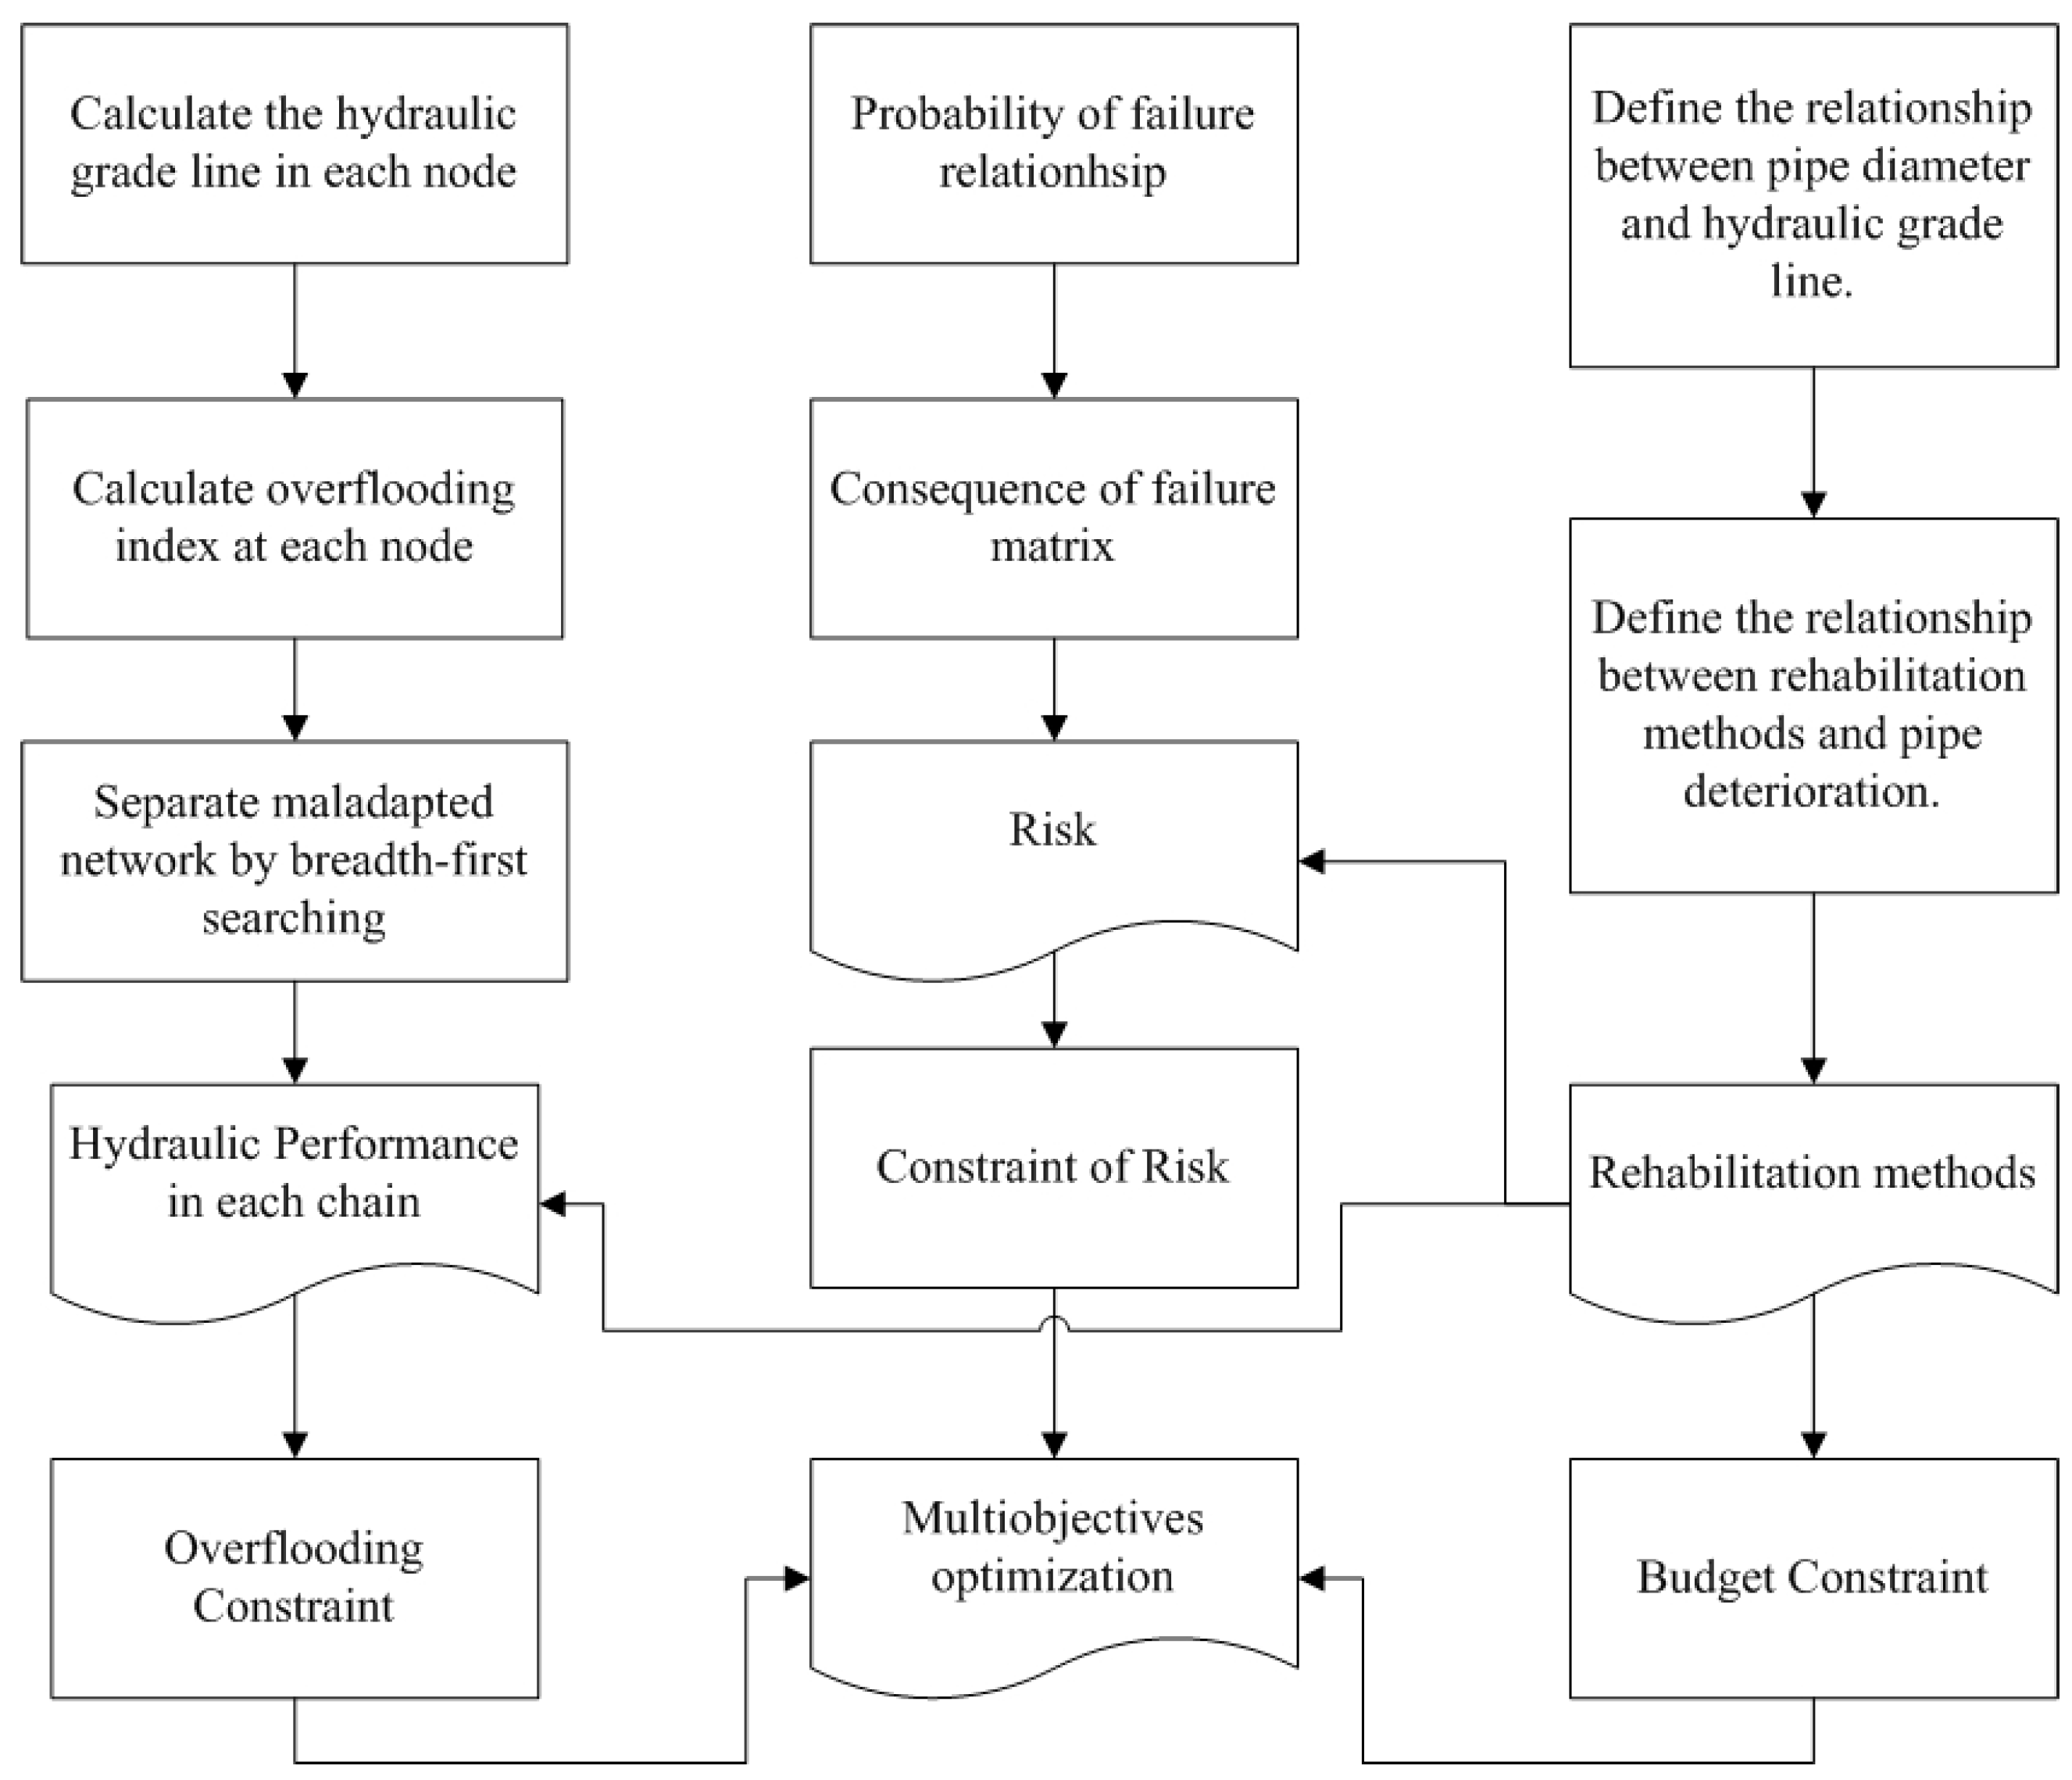
2.1. Introduction to the Hydraulics and Risk Combined Model Model

In this research, we used the Hydraulics and Risk Combined Model (HRCM) [28] to calculate the hydraulic performance, risk, and maintenance cost of a drainage system. There are five modules in the HRCM model:
(1) Hydraulic simulation module: In this module, the SWMM5 model calculates hydraulic grade line in the drainage system. Then, the hydraulic diagnostic model is applied to this system to calculate the hydraulic performance index (flooding index) for the drainage.
The GA-HRMC method has a hydraulic diagnostic model [29], which calculates the overflooding impact of a pipe to the system; Equations (1)–(3). According to this model, the hydraulic impacts of a pipe are represented by the sum of the pipe to the system (other pipes). The diagnostic model can have better performance than using the ratio of the hydraulic grade line over the depth of the manhole [32]. The system overflooding objective function N s   is calculated by the weight average value of the overflooding ratio of each pipe weighted by its length; Equation (4).
N i = 100 % × H i U S G i
N i i   =   N m i n +   ( N m a x   N m i n ) ( H i U S H i D S ) G i
N i D S = N i   N i i =   ( N m a x N m i n ) H i D S G i
N s = j , i N i j l i / i l i
where H i U S = upstream hydraulic grade line of pipe i; H i D S = downstream hydraulic grade line of pipe i; G i = height of the node i; N i i = net effect of the surcharge causes by pipe i; N i = overflooding ratio of node i; N m i n = minimum overflooding ratio of node i; N m a x   = maximum overflooding ratio of node i; N s   = system overflooding index.
(2) Risk assessment module: In the risk assessment module, the probability of failure for each pipe is calculated according to the age of each pipe. Then, a statistical exponential equation gives the probability of breaking for each pipe. The breaking probability of each pipe multiplies the consequence of failure of that pipe to get the breaking risk of that pipe. We assumed that the probability of failure for each pipe is given in Equation (5):
P ( t ) = a × e b × ( t c )
where: P(t) = the possibility of failure with time t (year). The a, b, and c are fitting parameters.
In the risk-informed model, Cai et al. [28] assumed a statistical exponential model [33] to calculate the probability of failure; and they used the consequence of failure criteria by Baah et al. [34] to calculate the weighted system pipe breaking risk index. In this study, we kept the same setting in our risk-informed model. The objective function of the system pipe breaking risk R S   is given in Equation (6):
R S =   l i C i P i   l i
where R S = the risk of the system; C i = the consequence of a failure of pipe i; P i = the possibility of failure of pipe i; l i = the length of pipe i.
(3) Rehabilitation module: In this module, different rehabilitation methods are connected to the age and diameter of a pipe. This can change the values of breaking risk index and overflooding index in a drainage system.
Six rehabilitation methods were linked to hydraulic performance (pipe diameter) and breaking risk (pipe age) (Table 1) [20]. In order to make the HRCM model recognize the cost difference among different pipe diameters, Cai et al. [28] added a pipe cost item for pipe replacement. The pipe cost C p is a function that is related to pipe diameter and pipe length. The cost to rehabilitate one pipe is the sum of the rehabilitation cost, disruption cost, and pipe cost. The cost objective function is the total cost of all the pipes.
(4) Multi-objective optimization module: There are two objective functions in this multi-objective optimization. First, a set of constraint functions on hydraulics performance, breaking risk, and budget limits the minimum requirements for rehabilitation methods. Second, they use a non-dominated sorting genetic algorithm (NSGA-II) to optimize hydraulic performance and decrease breaking risk in this system.
(5) Postprocessing filter (expert system): This module can select results from the Pareto Front according to the cost.
The structure of the HRCM model can be seen in Figure 1.

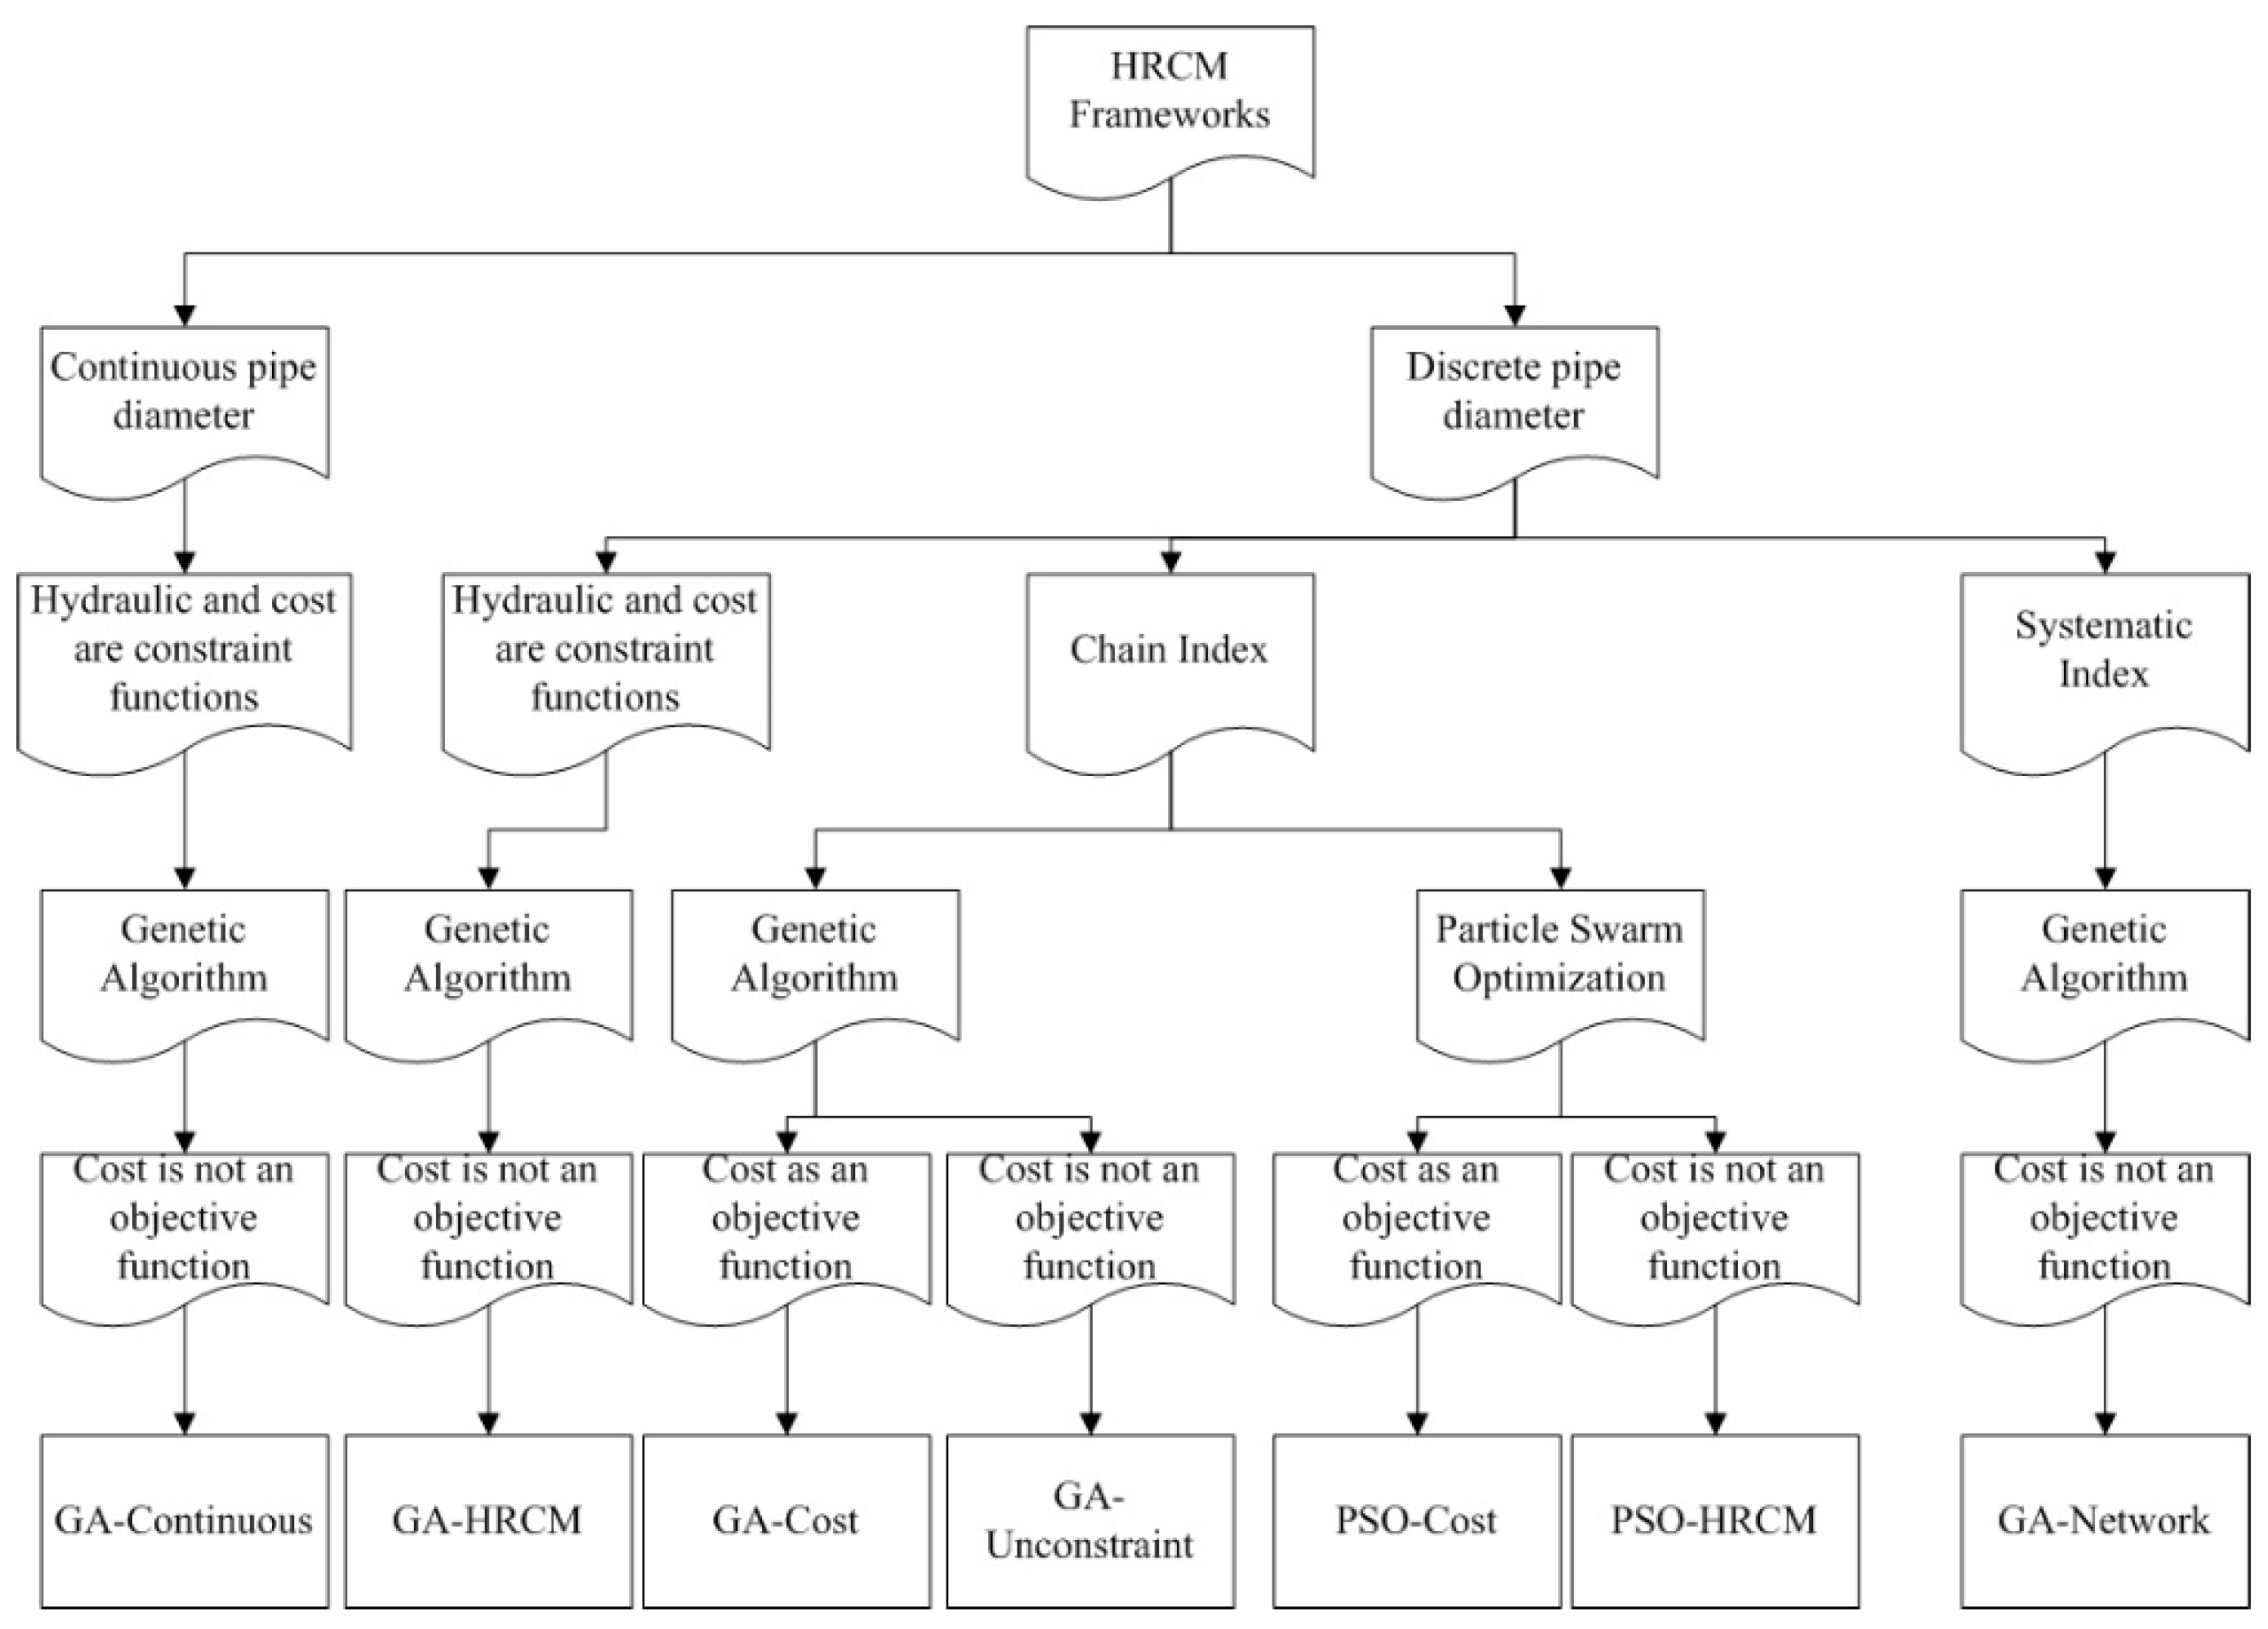
2.2. Algorithm Frameworks

HRCM Model Simulation Frameworks

We considered six alternative methodologies for HRCM calculation to compare with the method by Cai et al. [28], which we named the GA-HRCM method. We used their original framework (GA-HRCM) as our control group to compare with other methods. Explanations of other alternative algorithms, GA-Continuous, GA-Cost, GA-Unconstraint, PSO-Cost, PSO-HRCM, and GA-Network, are given in Figure 2.
The GA-HRCM method uses a discrete pipe diameter, which increases the time in each iteration to transform the continuous value to discrete value, which is a process in the GA algorithm itself. The GA-Continuous method uses a continuous diameter for pipes during optimization. In the post-processing section, the continuous pipe diameters were transformed to the nearest discrete pipe diameters, which are used in engineering, and then the overflooding index and the pipe breaking index were calculated (Table 2).
The GA-HRCM method did not use cost as an objective function, because in an engineering project, budget is seen as a constraint. GA-Cost uses rehabilitation cost as another objective function. We use this comparison to evaluate whether this can improve rehabilitation strategy results by increasing cost-effectiveness (Table 2).
The GA-HRCM method has a constraint function for both hydraulic and budget. It did not limit the breaking risk because it uses a stochastic model, so the breaking risk is an objective function rather than a constraint function. The GA-Unconstraint method removes the hydraulic constraint in rehabilitation as well as the budget constraint. The results were filtered and we only kept the results that satisfied our expectations after the optimization process (Table 2).
The particle swarm optimization (PSO) and genetic algorithm (GA) methods have been widely used in sewerage pipe design and rehabilitation [35,36] and have shown good results in predicting hydraulic performance. However, it is still unclear as to which method is suitable for drainage optimization [7,36,37,38]. We revised the code given by Yarpiz [39] in order to solve the mixed integers problem. We employed two PSO methods, PSO-HRCM and PSO-Cost, to compare their performance with the employed genetic algorithm. The PSO-HRCM method replaces the NSGA-II to non-dominant sorting PSO method. Upon this replacement, the PSO-Cost method adds cost as another objective function to the PSO-HRCM method.
A drainage system has a complex structure [40]. In their research work, Bennis et al. [29] provided a hydraulic diagnostic model. To distinguish it from other indexes, we call it the chain route index in this study. In the model, they recognized narrow pipes by calculating an index to evaluate backwater effects downstream to upstream. Their method can separate the surcharge effect into two categories: (1) surcharge caused by the pipe itself; (2) surcharge caused by the downstream narrow pipes. Therefore, a computational model can detect which pipe affects the system easily. The GA-HRCM method used this hydraulic diagnostic model to optimize the overall overflooding index. The GA-Network method tests whether this strong searching model is unnecessary to find the narrow pipe. Dion and Bennis [32] introduced a global modeling approach to evaluate hydraulic performances in a drainage system. Instead of calculating the chain route index, they directly used the hydraulic grade line in each junction to evaluate the hydraulic performance of the drainage system; Equation (7).
N s = i N i l i / i l i
To distinguish this index from the chain route one, it will be called the network index in the present study. The GA-HRCM model uses the chain route index. It has high efficiency when the drainage system is simple, but it is not efficient when the drainage system becomes complex, because this chain route index needs to calculate the index from one branch of the system to another [28]. In this research, we evaluated this speed-accuracy compromise by comparing the GA-HRCM method and the GA-Network method, using the global hydraulic index (Table 2).

2.3. Revised HRCM Method (RHRCM)
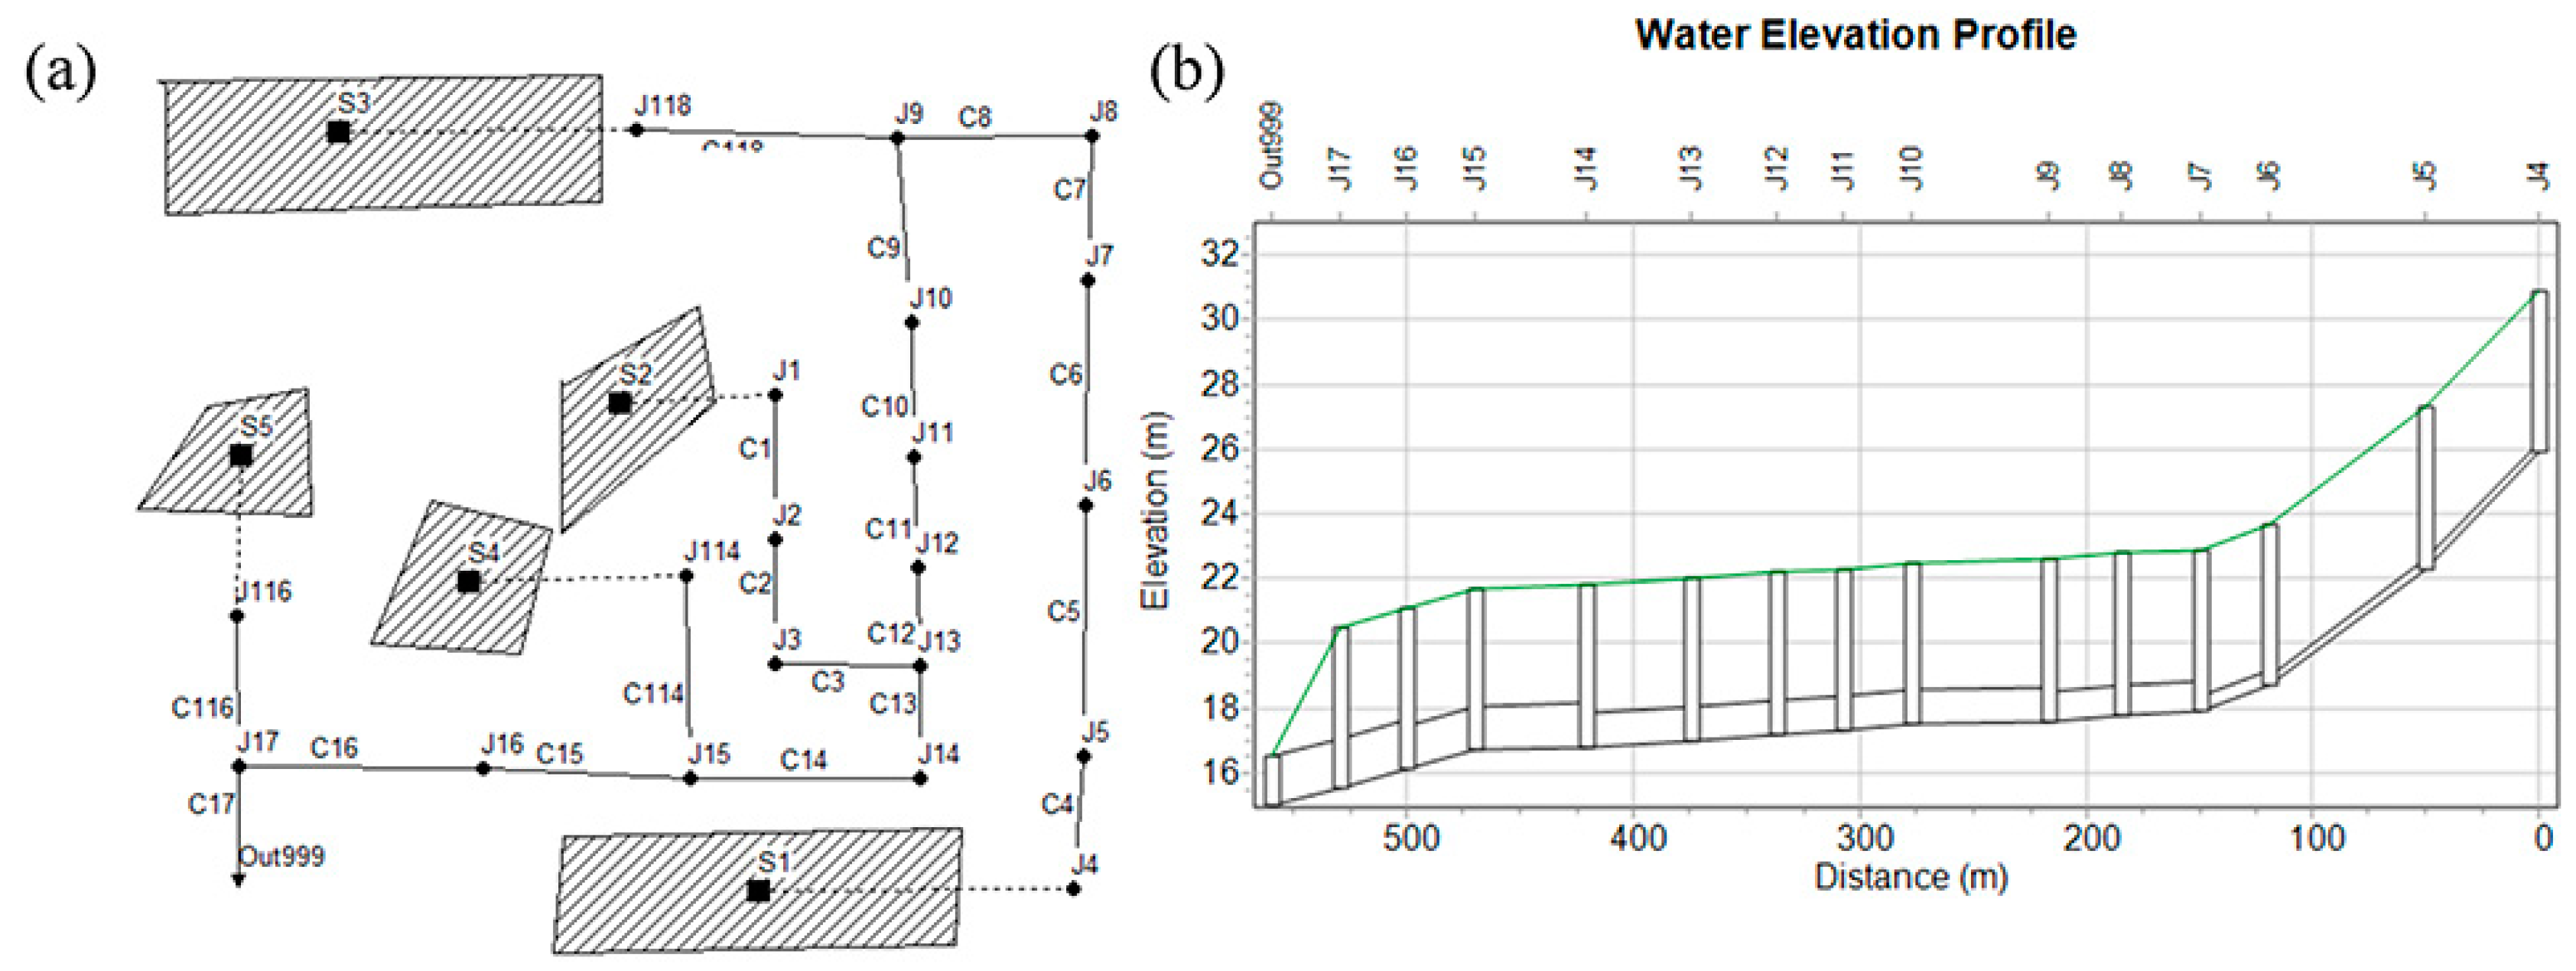
In previous sections, seven calculation methods were applied to the HRCM model to verify how they affect the framework. On comparing the performance of the seven methods, we revised the HRCM model to improve its efficiency to solve overflooding and pipe breaking combined problems.
The revised framework is presented in Figure 3. In this new framework, we simplified the three-element framework to: (1) optimization; (2) linkage; (3) post-processing. This framework can be applied to other pipe systems and solve similar problems. The method with the fastest convergence speed—GA-Continuous—was selected to improve convergence speed. The GA-Network method was selected to enhance the performance of the HRCM model on the network drainage system and improve efficiency. Besides, the GA-Continuous method and the GA-Network method can offer fewer strategies than the original HRCM method. In order to compensate for the weakness of the original HRCM inefficient budget distribution to rehabilitate each pipe, we selected the GA-Cost method to increase the accuracy of the framework. The new framework removes constraint functions and adds cost as another objective function. It also removes the hydraulic diagnostic and discrete models. Distinguished from other studies that study optimization methods directly without improving the structure of optimization, we propose to study optimization structure in each step for drainage optimization.

2.4. Case Study

Because the validation of the HRCM model was evaluated by Cai et al. [28] and the objective of this study is to compare the performance of different frameworks, we assumed two idealized scenarios in which it is easy to recognize narrow and aged pipes. Therefore, we can easily evaluate the performance of different frameworks. The configuration of the drainage system used the system proposed by Bennies et al. [29] (Figure 4).
In this paper, we considered two scenarios (Table 3) to evaluate the seven methods mentioned in Figure 2. The first scenario represented a narrow pipe scenario, and the second scenario an aged pipe scenario.
The first scenario is used to test whether these methods can choose the correct pipe and replace it with a larger one. In the first scenario, three narrow pipes were placed in the system, and all the pipes were of the same age. Among the three narrow pipes, one pipe was extremely narrow, which means that the model must find and replace it; the overflooding constraint can then be satisfied. The other pipes will affect the overflooding index but are not necessary to satisfy requirements. The second scenario includes an aged pipe and two narrow pipes. The aged pipe was severely deteriorated as compared to the other pipes, and the narrow pipes were not severely narrow. The second scenario was used to test whether these methods can find the aged pipe and use a reasonable rehabilitation method to solve the ageing problem. The drainage system was set as in Figure 4a. This is the same as that in the Cai et al. [28] study, for comparison purposes. Chicago designed rainfall is a common case for the simulation of sewerage systems [29,41,42].

2.5. Model Performance Evaluation

Sensitivity Analysis

Result accuracy can increase with an increased population size of the optimization algorithm, but the computational time will also increase. As per the functionality limitation of our computer—Intel® Core™ i7-8750H CPU @2.20GHz, 16.0 GB (RAM), we set the population size to 100, 500, 1000, 1500, 2000, and 2500 for both GA and PSO methods. We evaluated population convergence (i.e., whether the results will converge at our population setting) and time convergence (i.e., the computational time at the convergent population if the convergence exists). The evaluation criteria are: (1) computational time at the population equals to 2500; (2) how many rehabilitation solutions are given by the HRCM model at population size equal to 2500; (3) and the average cost of the total solutions at the 2500 population size (Table 4 and Table 5). It should be noted that the word ‘convergence’ in this research means the number of strategies, the overflooding index, and the pipe breaking index in strategies set for one population size, which does not change at a larger population size.
After postprocessing, the selected output results can solve the overflooding problem. Then, we compared their rehabilitative effectiveness. The cost-effectiveness analysis can quantify the rehabilitation performance of a rehabilitation strategy at per unit cost [43,44]. This method can evaluate the effectiveness of our rehabilitation method, as it provides information on which method can best improve the performance of a system under the unit cost. It is defined as the index in Equation (8) to evaluate the efficiency of each method. The original overflooding index and the risk index of scenario 1 were 29.72 and 16.24, respectively. The overflooding index and risk index of scenario 2 were 5.07 and 22.68, respectively:
C e = 1 k j ( I j p I j a ) / C j r
where C e = cost-effectiveness index; I j p = average of the difference between the original overflooding/risk index; I j a = overflooding/risk index after the rehabilitation; C j r = cost for rehabilitation; k = the total number of j.

3. Results

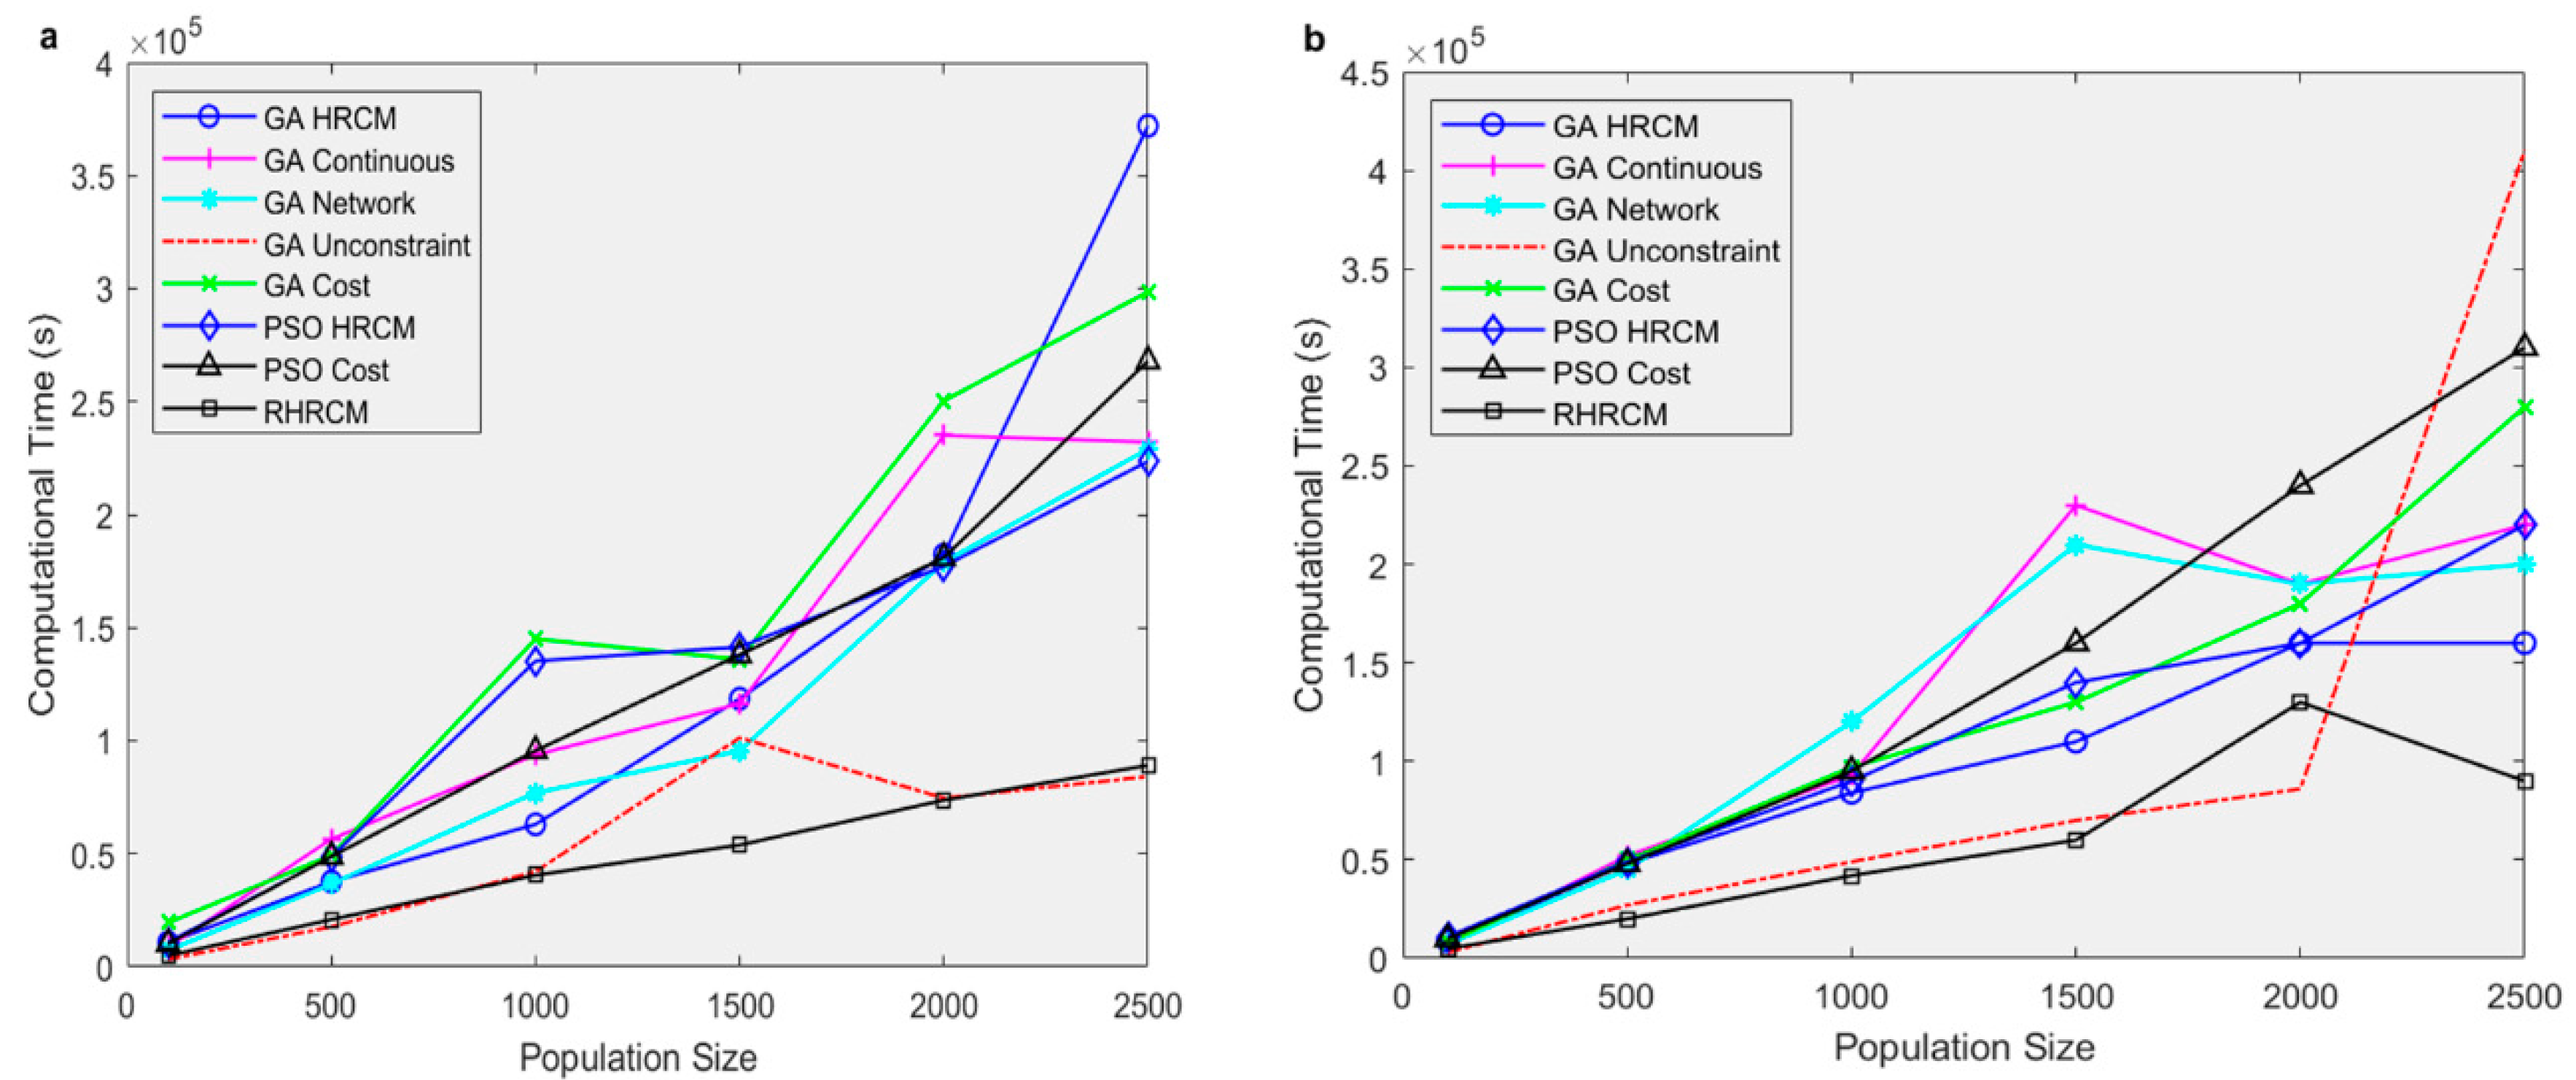
3.1. Computational Time Competition

Figure 5 shows the time competition of the seven methods. The computational time increases with an increased population. However, the trend was not monotonic.
Different methods exhibited discrepancies in calculation speed under the various scenarios. The GA-Unconstraint method had the minimum calculation time in the first scenario. There is a bump up when the population equals 2500 of GA-Unconstraint in the second scenario. We calculated two simulations for the GA-Unconstraint method with the population size being equal to 2200 and 3000, respectively. The computational times were 77,286 s and 89,393 s, respectively. Therefore, we inferred that the high computational time for the GA-Unconstraint method at the population size (equal to 2500) is because of the fluctuations of the program. The GA-Continuous method had a fast convergence speed for both scenarios. It was found that the GA-HRCM method was the slowest method (Figure 5). The computational time comparison between the RHRCM method and the other seven modified methods is presented in Figure 5. The RHRCM method exhibited the fastest speed compared to the other seven methods, and it was stable with respect to the population increase in scenario 1. This property can be also seen from the computational time comparison of scenario 2. The RHRCM method was relatively stable, compared to the GA-Unconstraint method. It showed a significant advantage over other methods in terms of computational speed.

3.2. Methods Evaluation

3.2.1. Scenario 1—Narrow Pipe

We assessed the results by evaluating the converged population, convergence time, number of solutions, and cost-effectiveness at a population of 2500 (Table 4). The cost-effectiveness value was calculated by dividing the difference between the original hydraulic/risk index and the new hydraulic/risk index by cost (million $) (Table 4).
After adding cost as another objective function, the expense of rehabilitation decreased from 0.67 million dollars to 0.3 million dollars. Compared to the GA-HRCM method, we found that it is less likely that the GA-Cost method selects fiberglass reinforcement, which is the most expensive rehabilitation method in our case (Table 1). This can reduce costs on unnecessary rehabilitation.
The GA-Network method converged at population size equals to 500, which is faster than the GA-HRCM method converged at a population of 2000 (Table 4). The GA-Network method offered four strategies, which is smaller than the six strategies obtained from the chain route index— the GA-HRCM method (Table 4). The GA-Unconstraint method has the fastest calculation speed for the same population size as the other methods (Figure 5). It was found that GA-Continuous converged at the 1500 population size, and it is faster than GA-HRCM.
PSO-based methods did not offer a significant advantage in cost-effectiveness and computational speed (Table 4), when compared to the GA-based method. Zarbaf et al. [45] compared the PSO method and the GA method for the calculation of cable tension estimate. They found that both methods can evaluate the tensioned cable, but the PSO method was more accurate. Surendar et al. [37] compared the GA and PSO methods in predicting Brazilian tensile strength. They found that even though the two methods can predict the value, PSO had better performance in fitting the result. Vasudevan and Sinha [36] showed that the PSO method had better performance in the distribution system. However, in the sewerage system, one study showed that GA methods can offer similar results as the PSO method [46]. In our research, we find that the PSO method was not as good. The PSO method uses the best values in one generation to guide the algorithm to produce the next generation. This will be efficient when searching for an optimum value in a continuous function. However, to rehabilitate drainage systems, there are many parallel solutions. For example, even though the hydraulic performance is improved when we enlarge the diameter of a pipe, after enlarging the diameter and exceeding a threshold, the results are improved. This means that in one generation, there will be many optimum values, thus impacting the performance of the PSO method in searching for the optimum value.
The RHRCM method can combine the strengths of previous frameworks. We found that the RHRCM method has one advantage offered by the GA-Unconstraint method—it took 89,182 s for the 2500 population; it is also more stable (Figure 5). Besides, the RHRCM achieved maximum cost-effectiveness as compared to the other methods. The cost-effectiveness of overflooding rehabilitation was found to be 177.29, and the pipe breaking rehabilitation cost-effectiveness was 87.82 (Table 4). Besides, the RHRCM offered 10 rehabilitation strategies, which is acceptable (Table 4). These strategies simplified those provided by the GA-Cost method.

3.2.2. Scenario 2—Ageing Pipe

Previous studies, such as Kleiner et al. [47] considered age of the pipe as a Fuzzy variable. Scenario 2 includes an aged pipe; its results are presented in Table 5. Among the seven methods, GA-Cost showed high cost-effectiveness of system overflooding and pipe breaking risk—13.92 and 129.5, respectively. The hydraulic cost-effectiveness value (11.7) is higher than that of the RHRCM method. The RHRCM method gave the highest risk cost-effective of 137.31, which shows that it is compatible with the risk scenario.

4. Discussion

4.1. Advantage and Limitation of RHRCM Method

The refined HRCM model is faster because unnecessary parts in the original HRCM model are removed. We also acquired a higher cost-effectiveness by adding cost as another objective function, as it can remove the parallel solutions.
We believe that there is a convergence of optimum value in an optimum question because the Pareto Front is the set of optimum values. However, are there optimum strategies in a rehabilitation problem? The answer is no. The reason for this is because the two types of situations can result in the same value on the Pareto Front with different strategies. First, if there are two pipes which have the same breaking risk and hydraulic performance in this network, one will have the same result when replacing the first pipe or the second pipe. That means that one will have two solutions offering the same result on the Pareto Front; furthermore, both are optimum solutions. The second type is that if one can replace a pipe to a diameter of 0.305 m to 1 m, it may solve the surcharge problem; however when one changes the dimeter to 2 m, it can get the same surcharge index at that junction. This means that every pipe has a threshold; when the diameter of the pipe goes beyond that threshold, all of the rehabilitation strategies are the same in the optimization program. In the HRCM model, we used a post-processing strategy to select solutions from the set of rehabilitation plans. In the RHRCM model, the new dimension (cost) can help to partly solve the parallel results problem because different diameters have different costs. This can improve the performance of an optimization method. However, this method does not increase the search speed for hydraulic performance and breaking risk. How to solve the parallel solution problem and increase the searching speed can be a topic for future study.

4.2. Discrete Versus Continuous Data

In engineering, certain parameters are not continuous. For example, the diameter of the pipe in a real case should be a discrete value, based on manufacturing standards. Therefore, although the mixed-integer optimization method is widely used in many engineering problems, there should be a discussion on whether mixed-integer is better than continuous optimization. In our research, we found the GA-Continuous has a faster convergence speed in scenario 1 than GA-HRCM. However, GA-Continuous is slower than GA-HRCM in scenario 2. We found that both continuous and discrete methods can solve the problem well. Therefore, mixed-integer optimization is not always better than continuous optimization. In the context of optimization algorithms, the continuous optimization method can have a higher sensitivity to variables that are changed continuously, and they do not have a process to transform a continuous number to an integer. However, it may be easy to obtain the local optimum value. Thus, it is a competition between these two situations, and we should adjust it according to different situations.

4.3. Parallel Results Problem

The slow convergence speed can be attributed to the parallel results problem; in network optimization, it is defined as having multiple solutions with the same performance. For example, consider a case in which there is a pipe in a drainage system leading to a surcharge, such as C8 in Figure 4b, and the critical diameter is δ (which is enough to solve the surcharge). When the model assigns diameter values larger than δ, they can get the same results for the overflooding index. This means that even though there are limited points on the Pareto Front, there are many strategies that can have the exact same values on the Pareto Front. Therefore, this seriously affects the convergence speed of optimization. The parallel results problem may explain this non-convergence in the framework. This motivated us to study how to evaluate the performance of optimization for rehabilitation problems in the future.
In this study, we use the GA and PSO methods because they are the most widely used in engineering. Many kinds of optimization algorithms, such as ant colony optimization algorithm [45], random forest [25], cellular automata [48], hanging gardens algorithm [49], and whale optimization [50] should be tested in the future to see whether they are more suitable for this framework.
We found that when we add the cost into our framework our program can have better results. That provided the initial idea to solve the parallel solution problem. We can add more parameters to this system. The GA-Unconstraint and RHRCM show that there is no significant difference in the calculation speed when we have two or three objective functions. The GA-Cost and GA-HRCM showed that the case of three objective functions needs more time for calculation. This means that when we remove the constraint function, the calculation time will not increase significantly even though we add more objective functions. Therefore, we can add more parameters to this framework to make it more resistant to the parallel solutions. Besides, we believe, this framework can have a higher calculation speed when we use parallel computing.

4.4. Framework

Distinguishing our research from other studies, and improving the performance of an optimization model by using different optimization methods, we studied whether the simplified calculation framework can improve performance. In our research, we found that with our new framework, the calculation speed and cost-effectiveness of the HRCM model were significantly improved. The computational speed of RHRCM was increased four times, and cost-effectiveness increased three times as compared to the GA-HRCM method, by changing the computational framework. This emphasizes the importance of studying how to improve the calculation methodology of an optimization question. A multi-objective optimization model is a complex system, because it has a multifaceted calculation structure and involves many modules to solve one question. Therefore, current optimization methods should be simplified to achieve a higher performance. Research on framework structure thus needs to be paid more attention.

5. Conclusions

Developing rehabilitation strategies in order to obtain maximum benefit for solving urban flooding and reducing pipe breaking risk at the same time is an important issue in urban drainage systems. In this paper, seven potential frameworks were compared. The results showed that calculation speed and accuracy were improved when continuous variables are used and constraint functions are removed. A post-processing filter was added at the end to transform pipe diameter to a discrete value and remove the unsatisfying strategies that result in a high overflooding index or breaking risk index. Multi-objective optimization was found to be adequate in finding a solution. Furthermore, calculation accuracy can increase when cost is selected as an objective function. We also found that the GA algorithm had a better performance than the PSO method in drainage optimization problems. Simulation results showed that these methods can significantly improve the decision support system for drainage rehabilitation. A new method was proposed (RHRCM), which exhibited a remarkably higher computational speed (four times faster than the original HRCM model) and was able to obtain results with a higher cost-effectiveness (three times higher than the original HRCM model). We found that a simplified framework can significantly improve the calculation performance of the original model; therefore, further research should focus on study of the framework structure.

Author Contributions

Conceptualization, A.M., H.S. and X.C.; methodology, X.C. and H.S.; software, X.C.; investigation, X.C. and H.S.; resources, A.M. and H.S.; writing—original draft preparation, X.C.; writing—review and editing, A.M., H.S. and X.C.; supervision, A.M. and H.S. All authors have read and agreed to the published version of the manuscript.

Funding

This research received no external funding.

Acknowledgments

We extend our acknowledgements to Colin Rennie, Hossein Bonakdari, and Chengxi Li.

Conflicts of Interest

The authors declare no conflict of interest.

References

  1. Jegatheesan, V. Urban Stormwater and Flood Management: Enhancing the Liveability of Cities; Springer: New York, NY, USA, 2019; ISBN 978-3-030-11817-4. [Google Scholar]
  2. Adamowski, J.; Adamowski, K.; Bougadis, J. Influence of Trend on Short Duration Design Storms. Water Resour. Manag. 2010, 24, 401–413. [Google Scholar] [CrossRef]
  3. Buttle, J.M.; Allen, D.M.; Caissie, D.; Davison, B.; Hayashi, M.; Peters, D.L.; Pomeroy, J.W.; Simonovic, S.; St-Hilaire, A.; Whitfield, P.H. Flood processes in Canada: Regional and special aspects. Can. Water Resour. J. Rev. Can. Ressour. Hydr. 2016, 41, 7–30. [Google Scholar] [CrossRef]
  4. Buttle, J.M.; Lafleur, P.M. Anatomy of an Extreme Event: The July 14–15, 2004 Peterborough Rainstorm. Can. Water Resour. J. 2007, 32, 59–74. [Google Scholar] [CrossRef]
  5. Government of Canada. Causes of Flooding. 2013. Available online: https://www.canada.ca/en/environment-climate-change/services/water-overview/quantity/causes-of-flooding.html (accessed on 19 October 2020).
  6. Ogidan, O.; Giacomoni, M. Multiobjective Genetic Optimization Approach to Identify Pipe Segment Replacements and Inline Storages to Reduce Sanitary Sewer Overflows. Water Resour. Manag. 2016, 30, 3707–3722. [Google Scholar] [CrossRef]
  7. Yazdi, J.; Sadollah, A.; Lee, E.H.; Yoo, D.G.; Kim, J.H. Application of multi-objective evolutionary algorithms for the rehabilitation of storm sewer pipe networks: Comparison of MOEAs. J. Flood Risk Manag. 2017, 10, 326–338. [Google Scholar] [CrossRef]
  8. Moussavi, A.; Samani, H.M.V.; Haghighi, A. A framework for optimal reliability-based storm sewer network design in flat areas. Can. J. Civ. Eng. 2017, 44, 139–150. [Google Scholar] [CrossRef]
  9. Shao, Z.; Zhang, X.; Li, S.; Deng, S.; Chai, H. A Novel SWMM Based Algorithm Application to Storm Sewer Network Design. Water 2017, 9, 747. [Google Scholar] [CrossRef] [Green Version]
  10. Barreto, W.; Vojinovic, Z.; Price, R.; Solomatine, D. Multiobjective Evolutionary Approach to Rehabilitation of Urban Drainage Systems. J. Water Resour. Plan. Manag. 2010, 136, 547–554. [Google Scholar] [CrossRef]
  11. Vojinovic, Z.; Sahlu, S.; Torres, A.S.; Seyoum, S.D.; Anvarifar, F.; Matungulu, H.; Barreto, W.; Savic, D.; Kapelan, Z. Multi-objective rehabilitation of urban drainage systems under uncertainties. J. Hydroinf. 2014, 16, 1044–1061. [Google Scholar] [CrossRef]
  12. CIRC. Canada Infrastructure Report Card. 2019. Available online: http://canadianinfrastructure.ca/en/index.html (accessed on 19 October 2020).
  13. Dawson, R.J.; Speight, L.; Hall, J.W.; Djordjevic, S.; Savic, D.; Leandro, J. Attribution of flood risk in urban areas. J. Hydroinf. 2008, 10, 275–288. [Google Scholar] [CrossRef] [Green Version]
  14. Elsawah, H.; Bakry, I.; Moselhi, O. Decision Support Model for Integrated Risk Assessment and Prioritization of Intervention Plans of Municipal Infrastructure. J. Pipeline Syst. Eng. Pract. 2016, 7, 04016010. [Google Scholar] [CrossRef]
  15. Huang, D.; Liu, X.; Jiang, S.; Wang, H.; Wang, J.; Zhang, Y. Current state and future perspectives of sewer networks in urban China. Front. Environ. Sci. Eng. 2018, 12, 2. [Google Scholar] [CrossRef]
  16. Haller, L.; Hutton, G.; Bartram, J. Estimating the costs and health benefits of water and sanitation improvements at global level. J. Water Health 2007, 5, 467–480. [Google Scholar] [CrossRef] [PubMed] [Green Version]
  17. Del Giudice, G.; Padulano, R.; Siciliano, D. Multivariate probability distribution for sewer system vulnerability assessment under data-limited conditions. Water Sci. Technol. 2016, 73, 751–760. [Google Scholar] [CrossRef] [PubMed]
  18. Santos, P.; Amado, C.; Coelho, S.T.; Leitão, J.P. Stochastic data mining tools for pipe blockage failure prediction. Urban Water J. 2017, 14, 343–353. [Google Scholar] [CrossRef]
  19. Ana, E.V.; Bauwens, W. Modeling the structural deterioration of urban drainage pipes: The state-of-the-art in statistical methods. Urban Water J. 2010, 7, 47–59. [Google Scholar] [CrossRef]
  20. Altarabsheh, A.; Kandil, A.; Ventresca, M. New Multiobjective Optimization Approach to Rehabilitate and Maintain Sewer Networks Based on Whole Lifecycle Behavior. J. Comput. Civil. Eng. 2018, 32, 04017069. [Google Scholar] [CrossRef]
  21. Altarabsheh, A.; Ventresca, M.; Kandil, A. New Approach for Critical Pipe Prioritization in Wastewater Asset Management Planning. J. Comput. Civil. Eng. 2018, 32, 04018044. [Google Scholar] [CrossRef]
  22. Baik, H.-S.; Jeong, H.S.; Abraham, D.M.; Director, A. Estimating Transition Probabilities in Markov Chain-Based Deterioration Models for Management of Wastewater Systems. J. Water Resour. Plan. Manag. 2006, 123, 15–24. [Google Scholar] [CrossRef]
  23. Berardi, L.; Giustolisi, O.; Kapelan, Z.; Savic, D.A. Development of pipe deterioration models for water distribution systems using EPR. J. Hydroinf. 2008, 14, 113–126. [Google Scholar] [CrossRef] [Green Version]
  24. Younis, R.; Knight, M.A. Continuation ratio model for the performance behavior of wastewater collection networks. Tunn. Undergr. Sp. Technol. 2010, 25, 660–669. [Google Scholar] [CrossRef]
  25. Hosseini, S.M.; Ghasemi, A. Hydraulic performance analysis of sewer systems with uncertain parameters. J. Hydroinf. 2012, 14, 682–696. [Google Scholar] [CrossRef] [Green Version]
  26. Rudiono, J. Priority Scale of Drainage Rehabilitation of Cilacap City. IOP Conf. Ser. Mater. Sci. Eng. 2018, 333, 012111. [Google Scholar] [CrossRef]
  27. Tarigan, A.P.M.; Rahmad, D.; Sembiring, R.A.; Iskandar, R. An application of the AHP in water resources management: A case study on urban drainage rehabilitation in Medan City. IOP Conf. Ser. Mater. Sci. Eng. 2018, 309, 012096. [Google Scholar] [CrossRef]
  28. Cai, X.; Shirkhani, H.; Mohammadian, A. Risk-Informed Framework for Sewerage Flooding and Ageing Rehabilitation Management. J. Pipeline Syst. Eng. Pract. 2020. Accepted. [Google Scholar]
  29. Bennis, S.; Bengassem, J.; Lamarre, P. Hydraulic Performance Index of a Sewer Network. J. Hydraul. Eng. 2003, 129, 504–510. [Google Scholar] [CrossRef]
  30. Sabzkouhi, A.M.; Haghighi, A. Uncertainty Analysis of Pipe-Network Hydraulics Using a Many-Objective Particle Swarm Optimization. J. Hydraul. Eng. 2016, 142, 04016030. [Google Scholar] [CrossRef]
  31. Amador, L.; Mohammadi, A.; Abu-Samra, S.; Maghsoudi, R. Resilient storm pipes: A multi-stage decision support system. Struct. Infrastruct. Eng. 2020, 16, 847–859. [Google Scholar] [CrossRef]
  32. Dion, Y.; Bennis, S. A global modeling approach to the hydraulic performance evaluation of a sewer network. Can. J. Civ. Eng. 2010, 37, 1432–1436. [Google Scholar] [CrossRef]
  33. Duchesne, S.; Beardsell, G.; Villeneuve, J.-P.; Toumbou, B.; Bouchard, K. A Survival Analysis Model for Sewer Pipe Structural Deterioration: A sewer deterioration model. Comput. Aided Civil. Infrastruct. Eng. 2013, 28, 146–160. [Google Scholar] [CrossRef]
  34. Baah, K.; Dubey, B.; Harvey, R.; McBean, E. A risk-based approach to sanitary sewer pipe asset management. Sci. Total Environ. 2015, 505, 1011–1017. [Google Scholar] [CrossRef]
  35. Afshar, M.H.; Afshar, A.; Mariño, M.A.; Darbandi, A.A.S. Hydrograph-based storm sewer design optimization by genetic algorithm. Can. J. Civ. Eng. 2006, 33, 319–325. [Google Scholar] [CrossRef]
  36. Vasudevan, B.; Sinha, A.K. Reliability improvement of reconfigurable distribution system using GA and PSO. Electr. Eng. 2018, 100, 1263–1275. [Google Scholar] [CrossRef]
  37. Surendar, A.; Kuzichkin, O.R.; Kanagarajan, S.; Hashemi, M.H.; Khorami, M. Applying two optimization techniques in evaluating tensile strength of granitic samples. Eng. Comput. 2019, 35, 985–992. [Google Scholar] [CrossRef]
  38. Yazdi, J.; Yoo, D.G.; Kim, J.H. Comparative study of multi-objective evolutionary algorithms for hydraulic rehabilitation of urban drainage networks. Urban Water J. 2017, 14, 483–492. [Google Scholar] [CrossRef]
  39. Yarpiz. Multi-Objective Particle Swarm Optimization. Available online: https://yarpiz.com/59/ypea121-mopso (accessed on 18 October 2020).
  40. Haghighi, A. Loop-by-Loop Cutting Algorithm to Generate Layouts for Urban Drainage Systems. J. Water Resour. Plan. Manag. 2013, 139, 693–703. [Google Scholar] [CrossRef]
  41. Akan, A.O.; Houghtalen, R.J. Urban Hydrology, Hydraulics, and Stormwater Quality; Wiley: Hoboken, NJ, USA, 2003. [Google Scholar]
  42. Watt, E.; Marsalek, J. Critical review of the evolution of the design storm event concept. Can. J. Civ. Eng. 2013, 40, 105–113. [Google Scholar] [CrossRef]
  43. Irfan, M.; Khurshid, M.B.; Labi, S.; Flora, W. Evaluating the Cost Effectiveness of Flexible Rehabilitation Treatments Using Different Performance Criteria. J. Transp. Eng. 2009, 135, 753–763. [Google Scholar] [CrossRef]
  44. Yao, L.; Dong, Q.; Ni, F.; Jiang, J.; Lu, X.; Du, Y. Effectiveness and Cost-Effectiveness Evaluation of Pavement Treatments Using Life-Cycle Cost Analysis. J. Transp. Eng. Part B Pavements 2019, 145, 04019006. [Google Scholar] [CrossRef]
  45. Haji Agha Mohammad Zarbaf, S.E.; Norouzi, M.; Allemang, R.J.; Hunt, V.J.; Helmicki, A. Stay Cable Tension Estimation of Cable-Stayed Bridges Using Genetic Algorithm and Particle Swarm Optimization. J. Bridge Eng. 2017, 22, 05017008. [Google Scholar] [CrossRef]
  46. Kumar, S.; Kaushal, D.R.; Gosain, A.K. Evaluation of evolutionary algorithms for the optimization of storm water drainage network for an urbanized area. Acta Geophys. 2019, 67, 149–165. [Google Scholar] [CrossRef]
  47. Kleiner, Y.; Sadiq, R.; Rajani, B. Modelling the deterioration of buried infrastructure as a fuzzy Markov process. J. Water Supply Res.Technol. Aqua. 2006, 55, 67–80. [Google Scholar] [CrossRef] [Green Version]
  48. Afshar, M.H.; Shahidi, M.; Rohani, M.; Sargolzaei, M. Application of cellular automata to sewer network optimization problems. Sci. Iran. 2011, 18, 304–312. [Google Scholar] [CrossRef] [Green Version]
  49. Bakhshipour, A.E.; Bakhshizadeh, M.; Dittmer, U.; Haghighi, A.; Nowak, W. Hanging Gardens Algorithm to Generate Decentralized Layouts for the Optimization of Urban Drainage Systems. J. Water Resour. Plan. Manag. 2019, 145, 04019034. [Google Scholar] [CrossRef]
  50. Mirjalili, S.; Lewis, A. The Whale Optimization Algorithm. Adv. Eng. Softw. 2016, 95, 51–67. [Google Scholar] [CrossRef]
Figure 1. Structure of the HRCM model.
Mca 25 00073 g001
Figure 2. Flowchart of different optimization algorithms.
Mca 25 00073 g002
Figure 3. Diagram of the revised framework (RHRCM).
Mca 25 00073 g003
Figure 4. Drainage system configuration: (a) structure of the drainage system; (b) schematic view of the pipe diameter, length, and depth (Data from Bennis et al. and Cat et al. [28,29]).
Mca 25 00073 g004
Figure 5. The time competition for seven methods: (a) scenario 1; (b) scenario 2.
Mca 25 00073 g005
Table 1. The rehabilitation matrix [20,28].
Rehabilitation
Number
ActionRehabilitation Cost ($/m)Disruption Cost ($/m)Pipe Cost ($/m)Benefit (Year)
1Do nothing000-
2Routine cleaning160010
3Shotcrete6560020
4Cured-in-place pipe15580050
5Reinforced fiberglass sliplining223100100
6Dig and replace with concrete pipe1148656 C p 150
1 C p = f ( d i , l i ) pipe cost function. In this research, we assumed C p = d × l .
Table 2. Parameter setting of different HRCM methods.
NameDiscrete PipeConstraint Functions 1Diagnostic Model 2Network Index 3Objective CostGA
GA-HRCM
GA-Continuous
GA-Cost
GA-Unconstrainted
GA-Network
PSO-HRCM
PSO-Cost
RHRCM
1 Constraint functions of cost and hydraulic overflooding. 2 The system overflooding index in Equation (4). 3 The system overflooding index in Equation (7).
Table 3. The simulation scenarios.
ClassificationScenarioDescriptionFunction
Hydraulic1A system with one narrow pipe (poor hydraulic performance) at the chain route. The diameter of pipe (C8) is replaced to 0.1 m. The age of all the pipes is zero.In this simulation, it was tested whether the method can detect the narrow pipe.
Ageing risk2A system with a pipe at high risk but there is no hydraulic risk. The diameters of pipes are presented in Figure 4b. The age of pipe C9 was 60, and other pipes ages are zero.In this simulation, it was tested whether the method can detect an aged pipe.
Table 4. The summarized results of the seven methods with scenario 1.
MethodConvergent PopulationConvergent Time (s)2500 Time (s)2500 Number of Solutions2500 Average Cost (million $)2500 Cost Effectiveness
Hydro 1Risk 2
GA-HRCM2000182,334372,03560.6754.8131.36
GA-Continuous1500116,374232,12250.4462.6533.60
GA-CostN/AN/A298,599340.30138.2673.92
GA-Network50036696229,00640.7043.9723.82
GA-UnconstraintN/AN/A84,15780.7847.8124.64
PSO-HRCMN/AN/A223,59151.0328.1613.99
PSO-CostN/AN/A268,340130.6145.2422.18
RHRCMN/AN/A89,182100.30177.2987.82
1 Hydro is the cost-effectiveness of the overflooding index. 2 Risk is the cost-effectiveness of the breaking index.
Table 5. The summarized results of seven methods with scenario 2.
MethodConvergent PopulationConvergent Time (s)2500 Time (s)2500 Number of Solutions2500 Average Cost (million$)2500 Cost Effectiveness
Hydro 1Risk 2
GA-HRCMN/AN/A163,51960.654.4640.77
GA-Continuous1500232,415222,53660.673.6439.66
GA-CostN/AN/A277,206400.2413.92129.50
GA-NetworkN/AN/A196,28160.663.6941.07
GA-Unconstraint200086,322406,36160.734.4036.62
PSO-HRCMN/AN/A219,88851.003.3019.87
PSO-CostN/AN/A309,305330.634.2927.17
RHRCMN/AN/A89,863300.2611.70137.31
1 Hydro is the cost-effectiveness of the overflooding index. 2 Risk is the cost-effectiveness of the breaking index.
Publisher’s Note: MDPI stays neutral with regard to jurisdictional claims in published maps and institutional affiliations.

