Specific Antiproliferative Properties of Proteinaceous Toxin Secretions from the Marine Annelid Eulalia sp. onto Ovarian Cancer Cells

 , , , , and
Abstract
:1. Introduction
2. Results
2.1. Protein Identification
2.2. Cytotoxic Effects
2.3. Network Analysis
3. Discussion
4. Materials and Methods
4.1. Protein Extraction and Identification
4.1.1. Animal Collection
4.1.2. Protein Collection and Purification
4.1.3. Protein Separation
4.1.4. Protein Identification by LC-MS/MS
4.1.5. Protein Identification by RNA-Seq
4.2. Network Analysis
4.3. Cell-Based Assays
4.3.1. Cell Viability
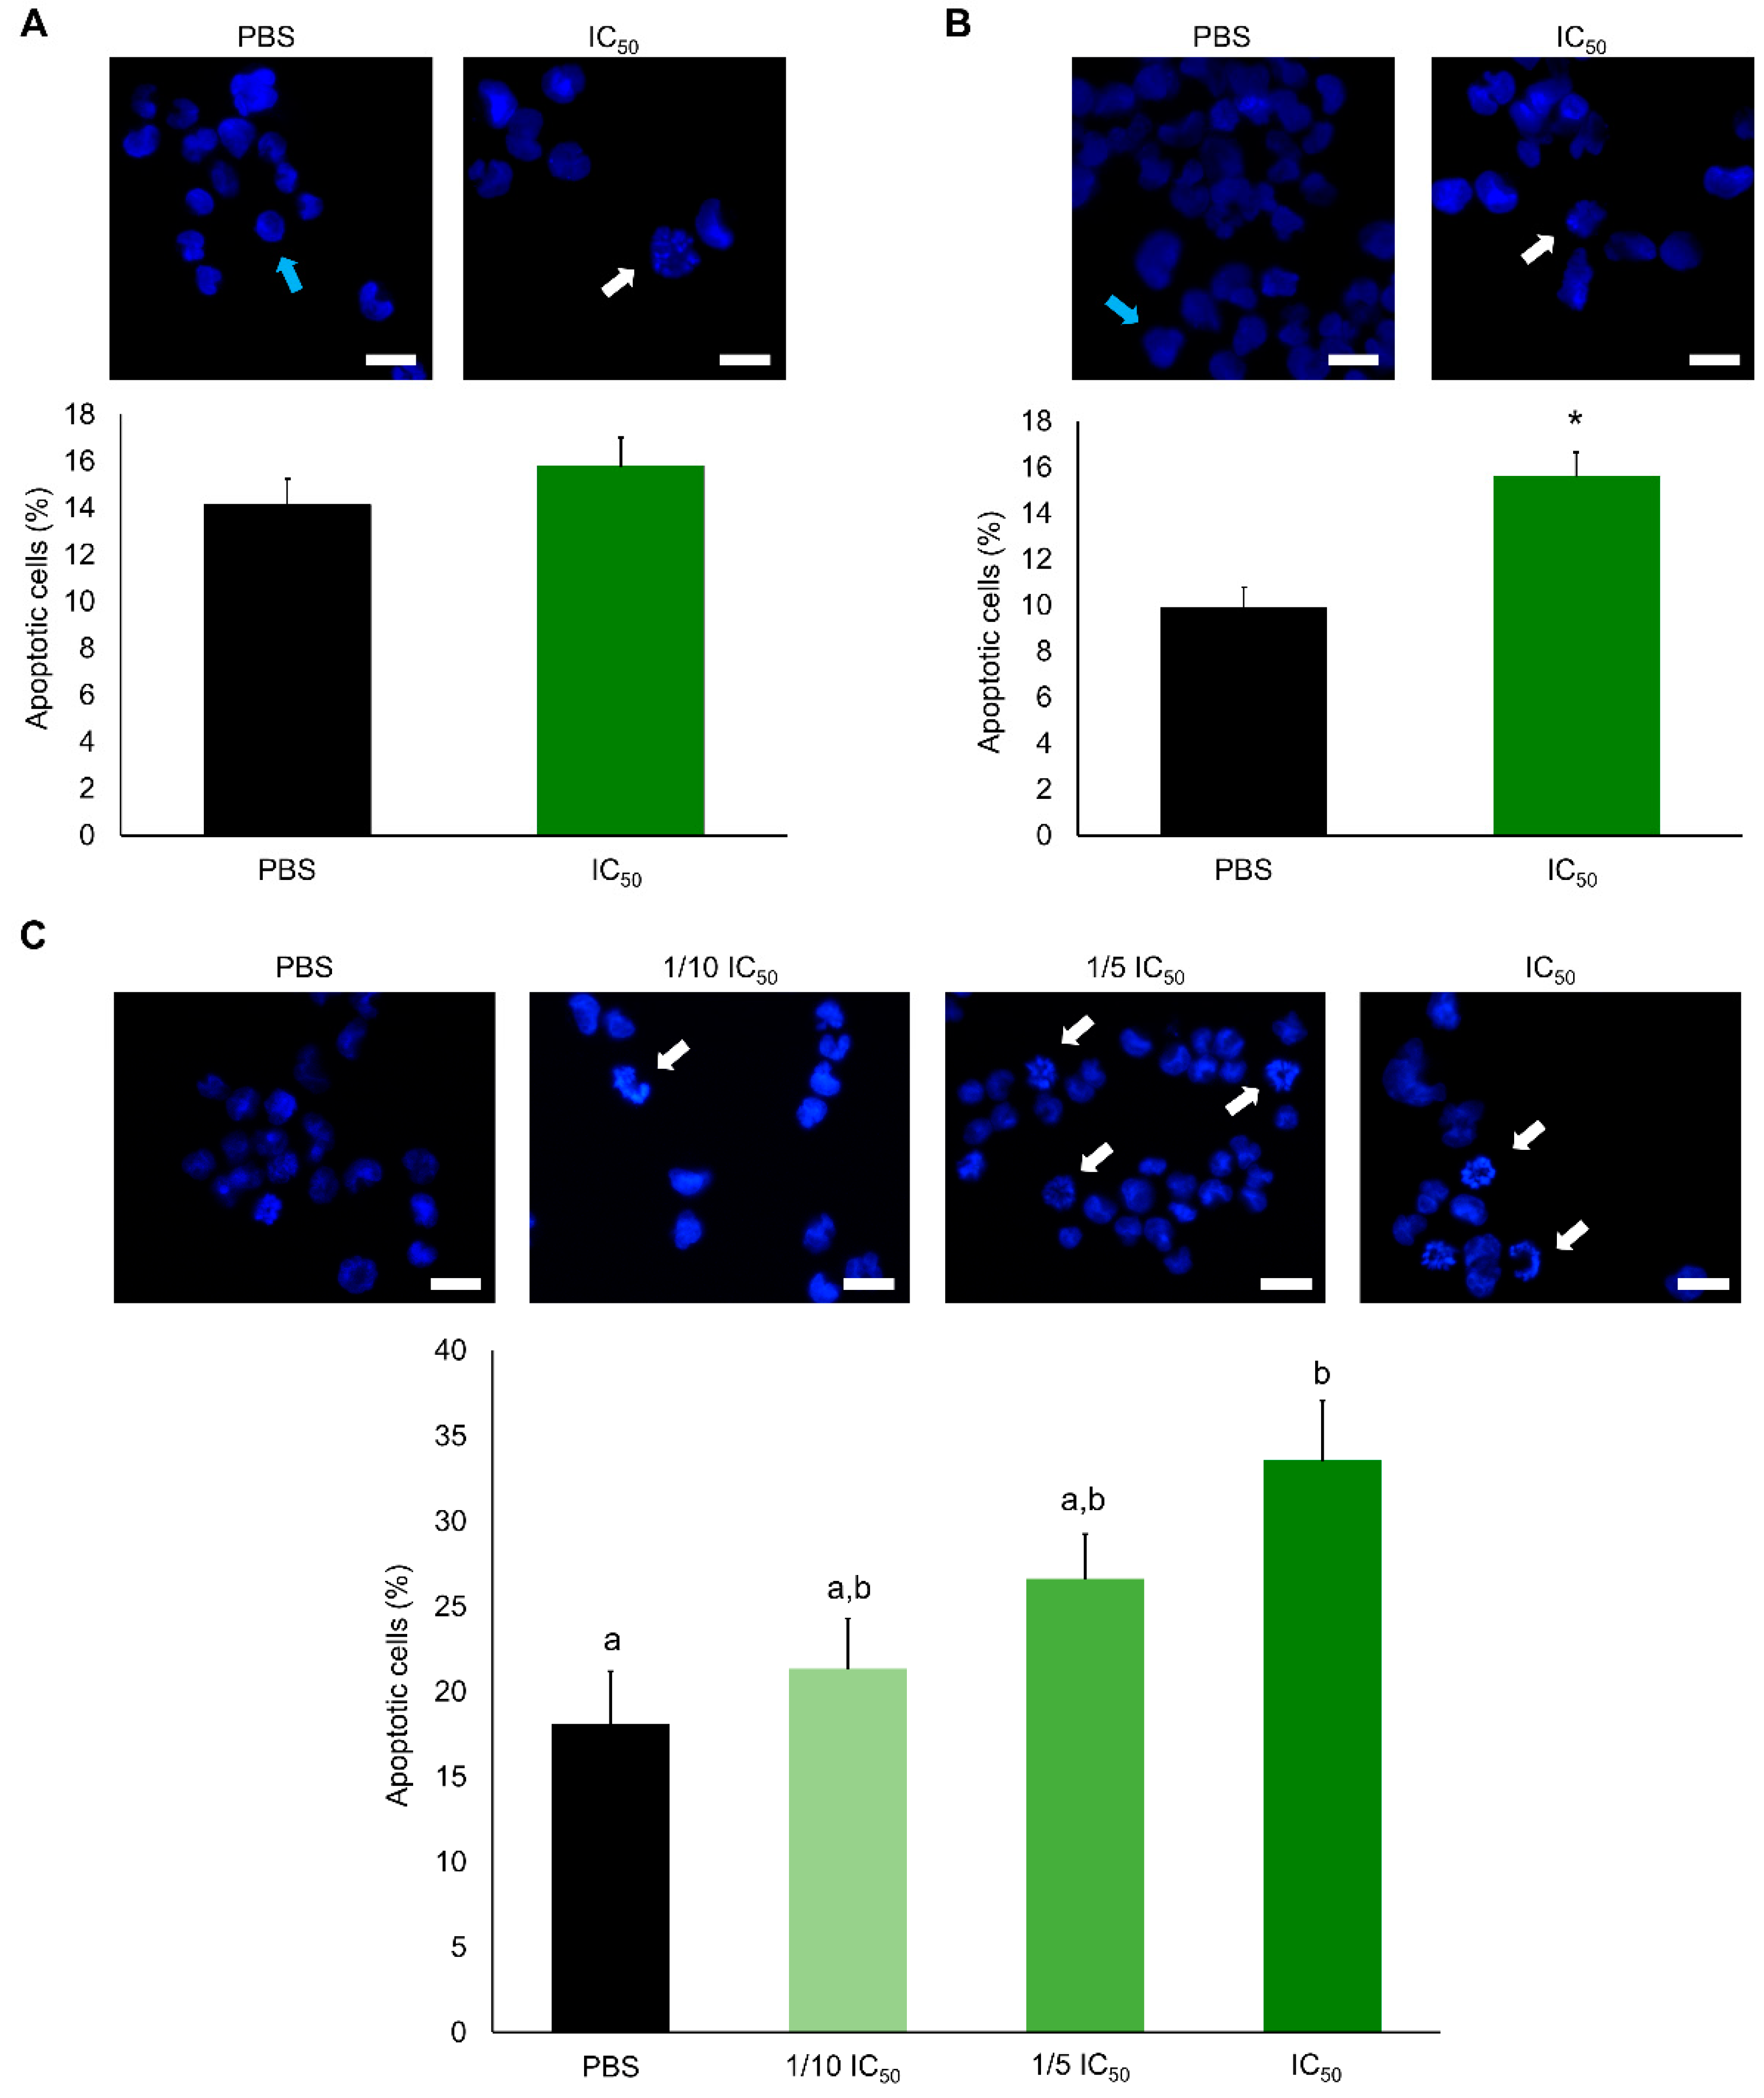
4.3.2. Apoptosis
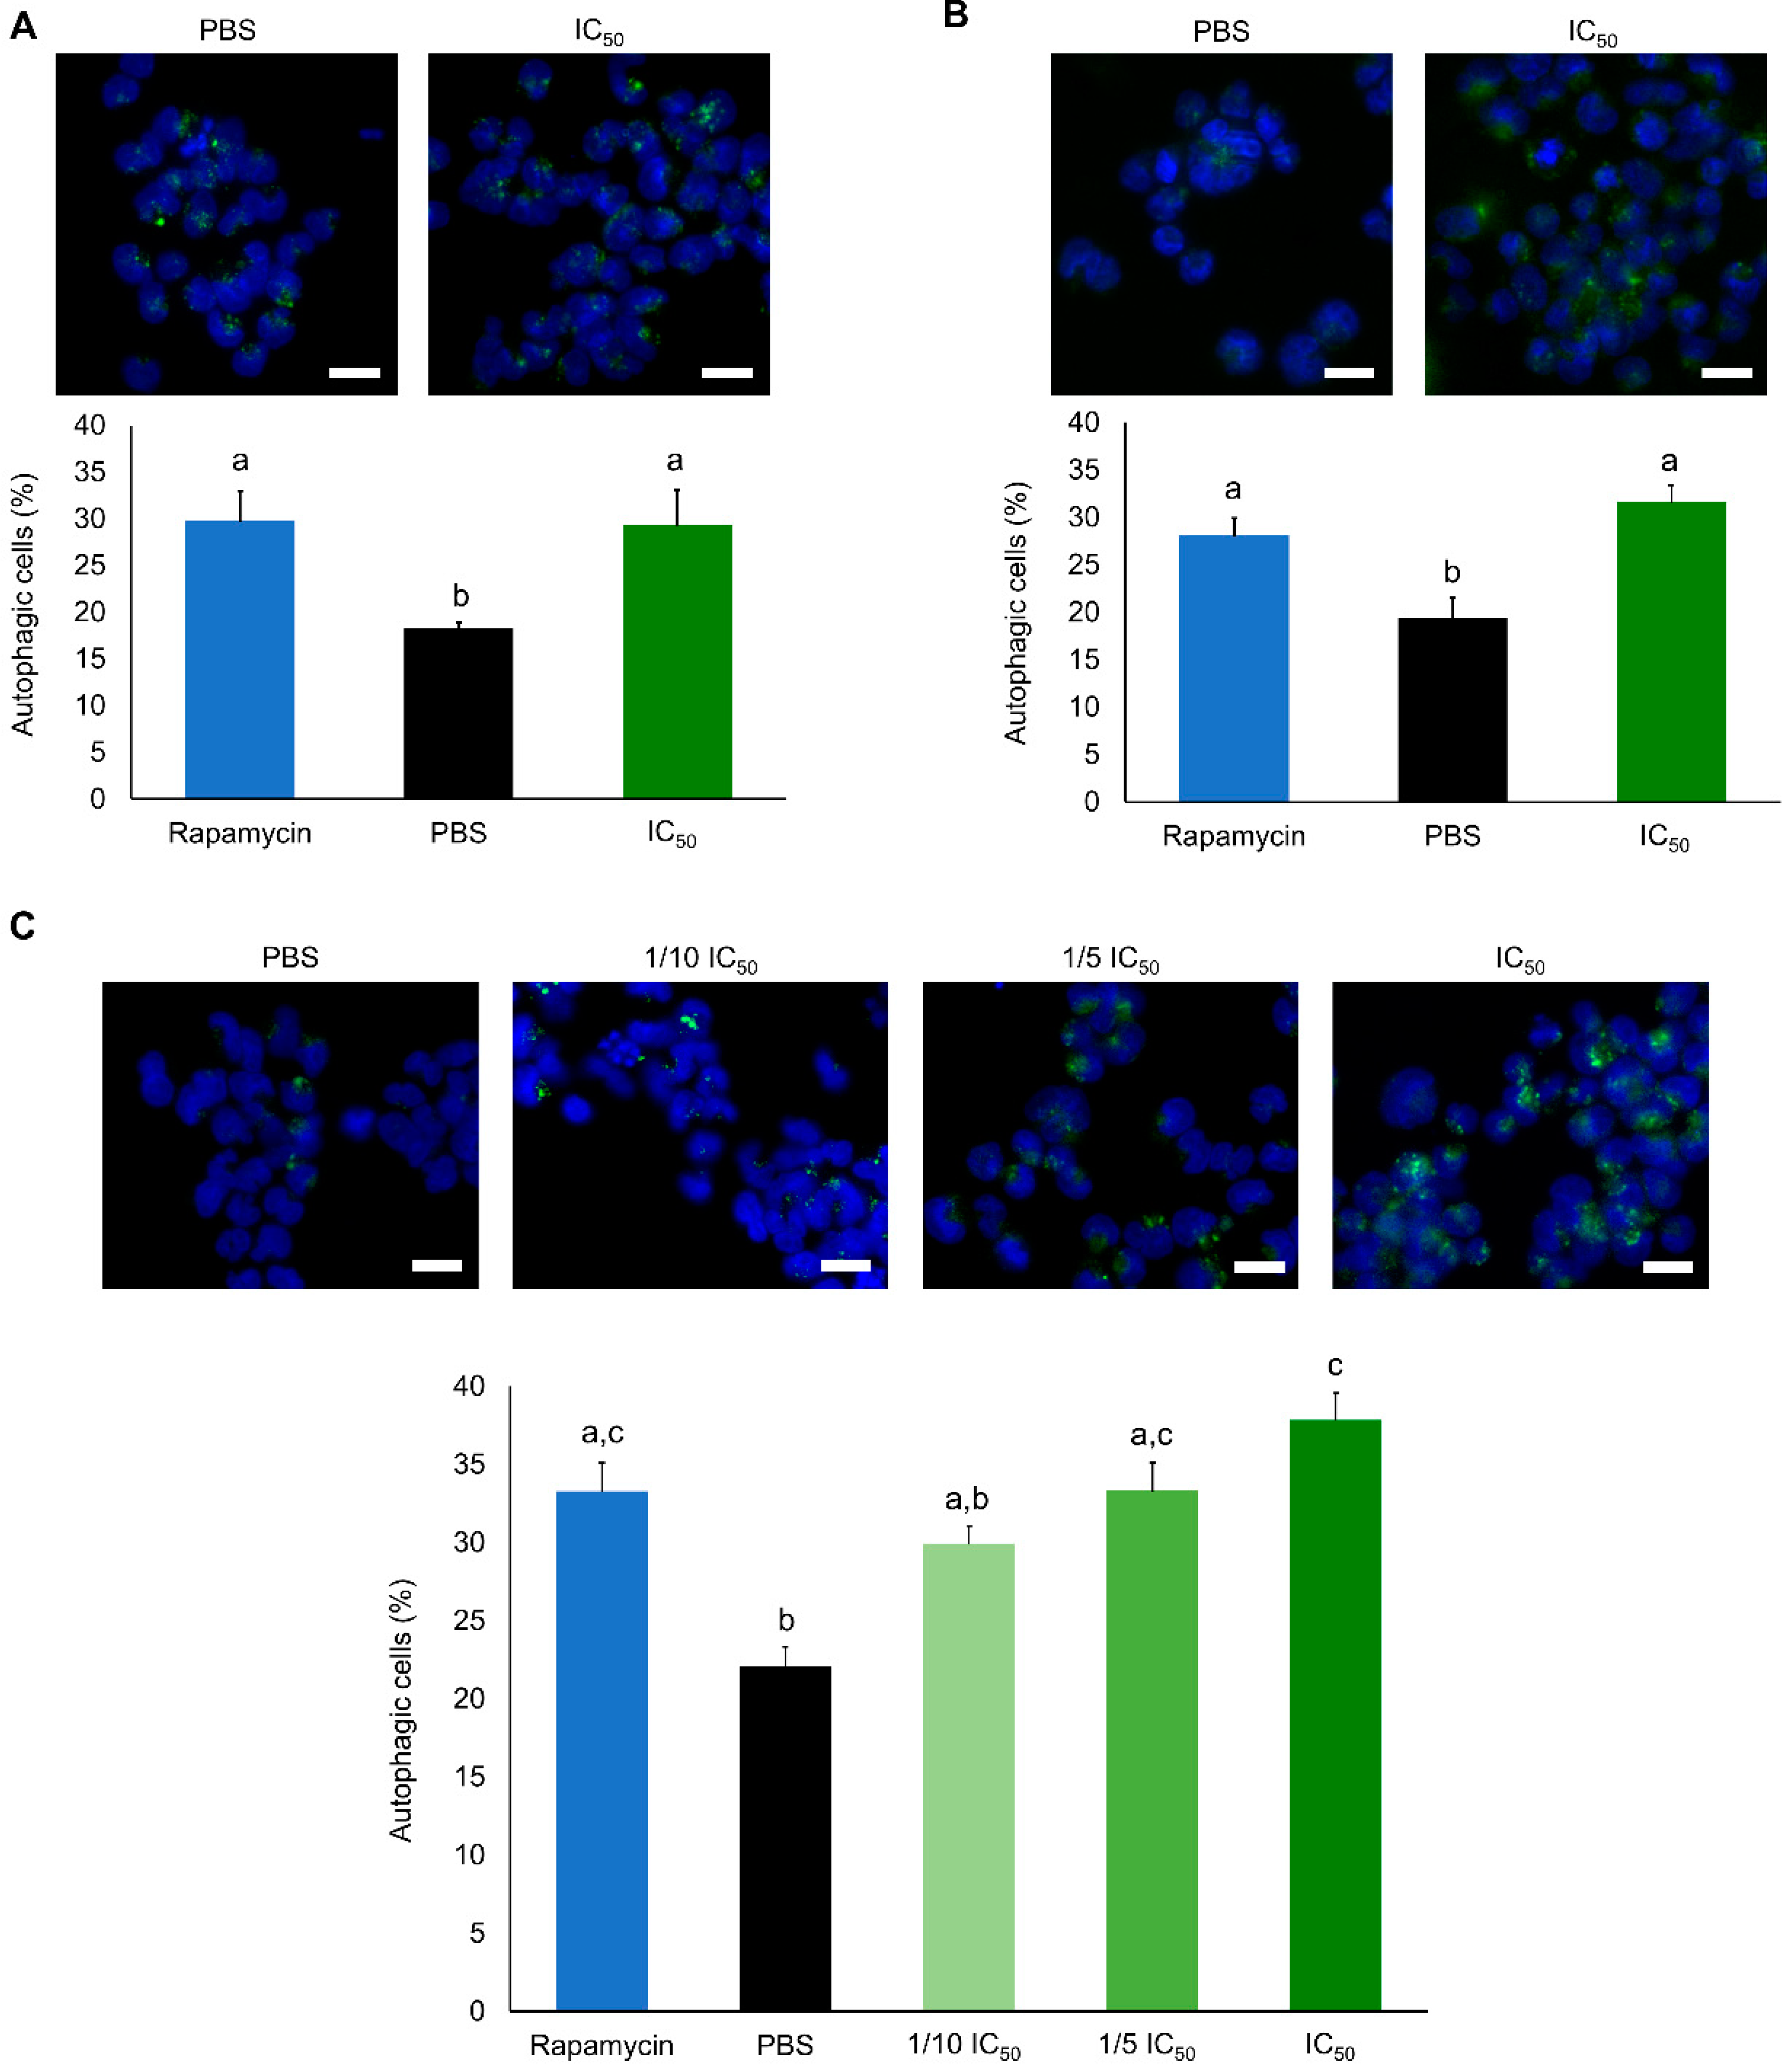
4.3.3. Autophagy
4.3.4. Caspase 8 Assay
4.3.5. Detection of Reactive Oxygen Species
4.3.6. Mitochondrial Transmembrane Potential
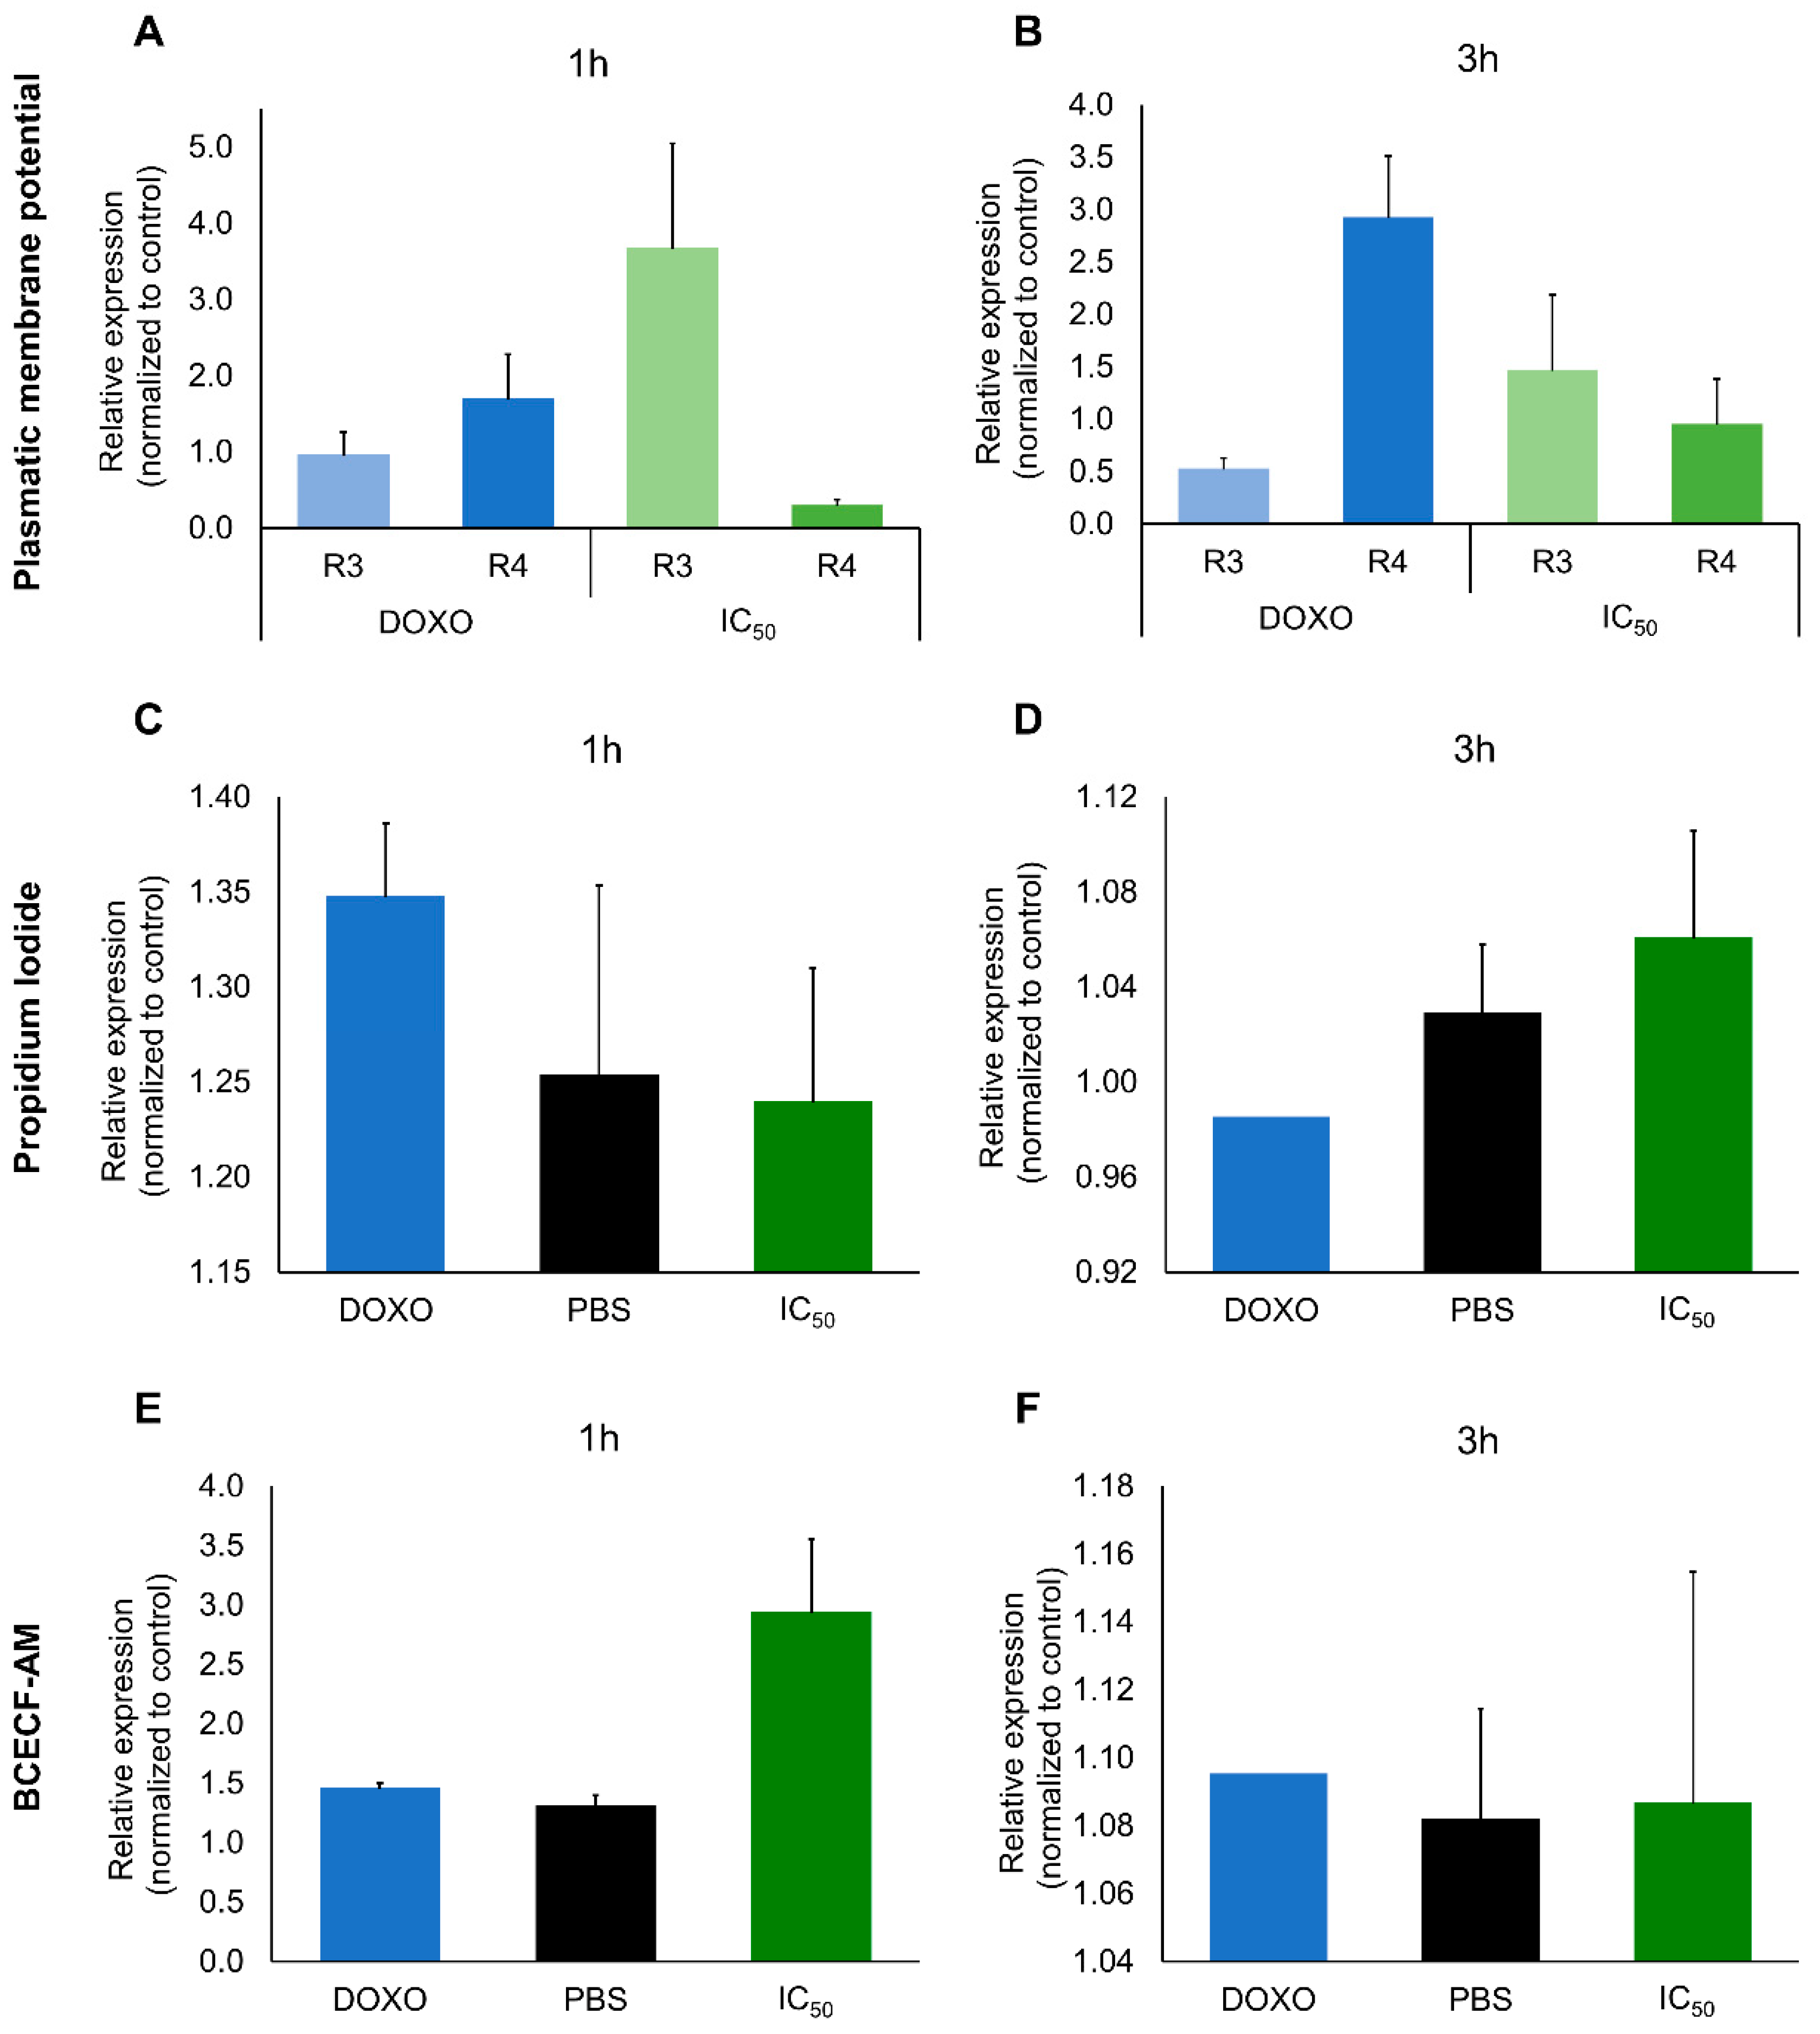
4.3.7. Plasmatic Transmembrane Potential
4.3.8. Interference of Cellular pH or Membrane Integrity
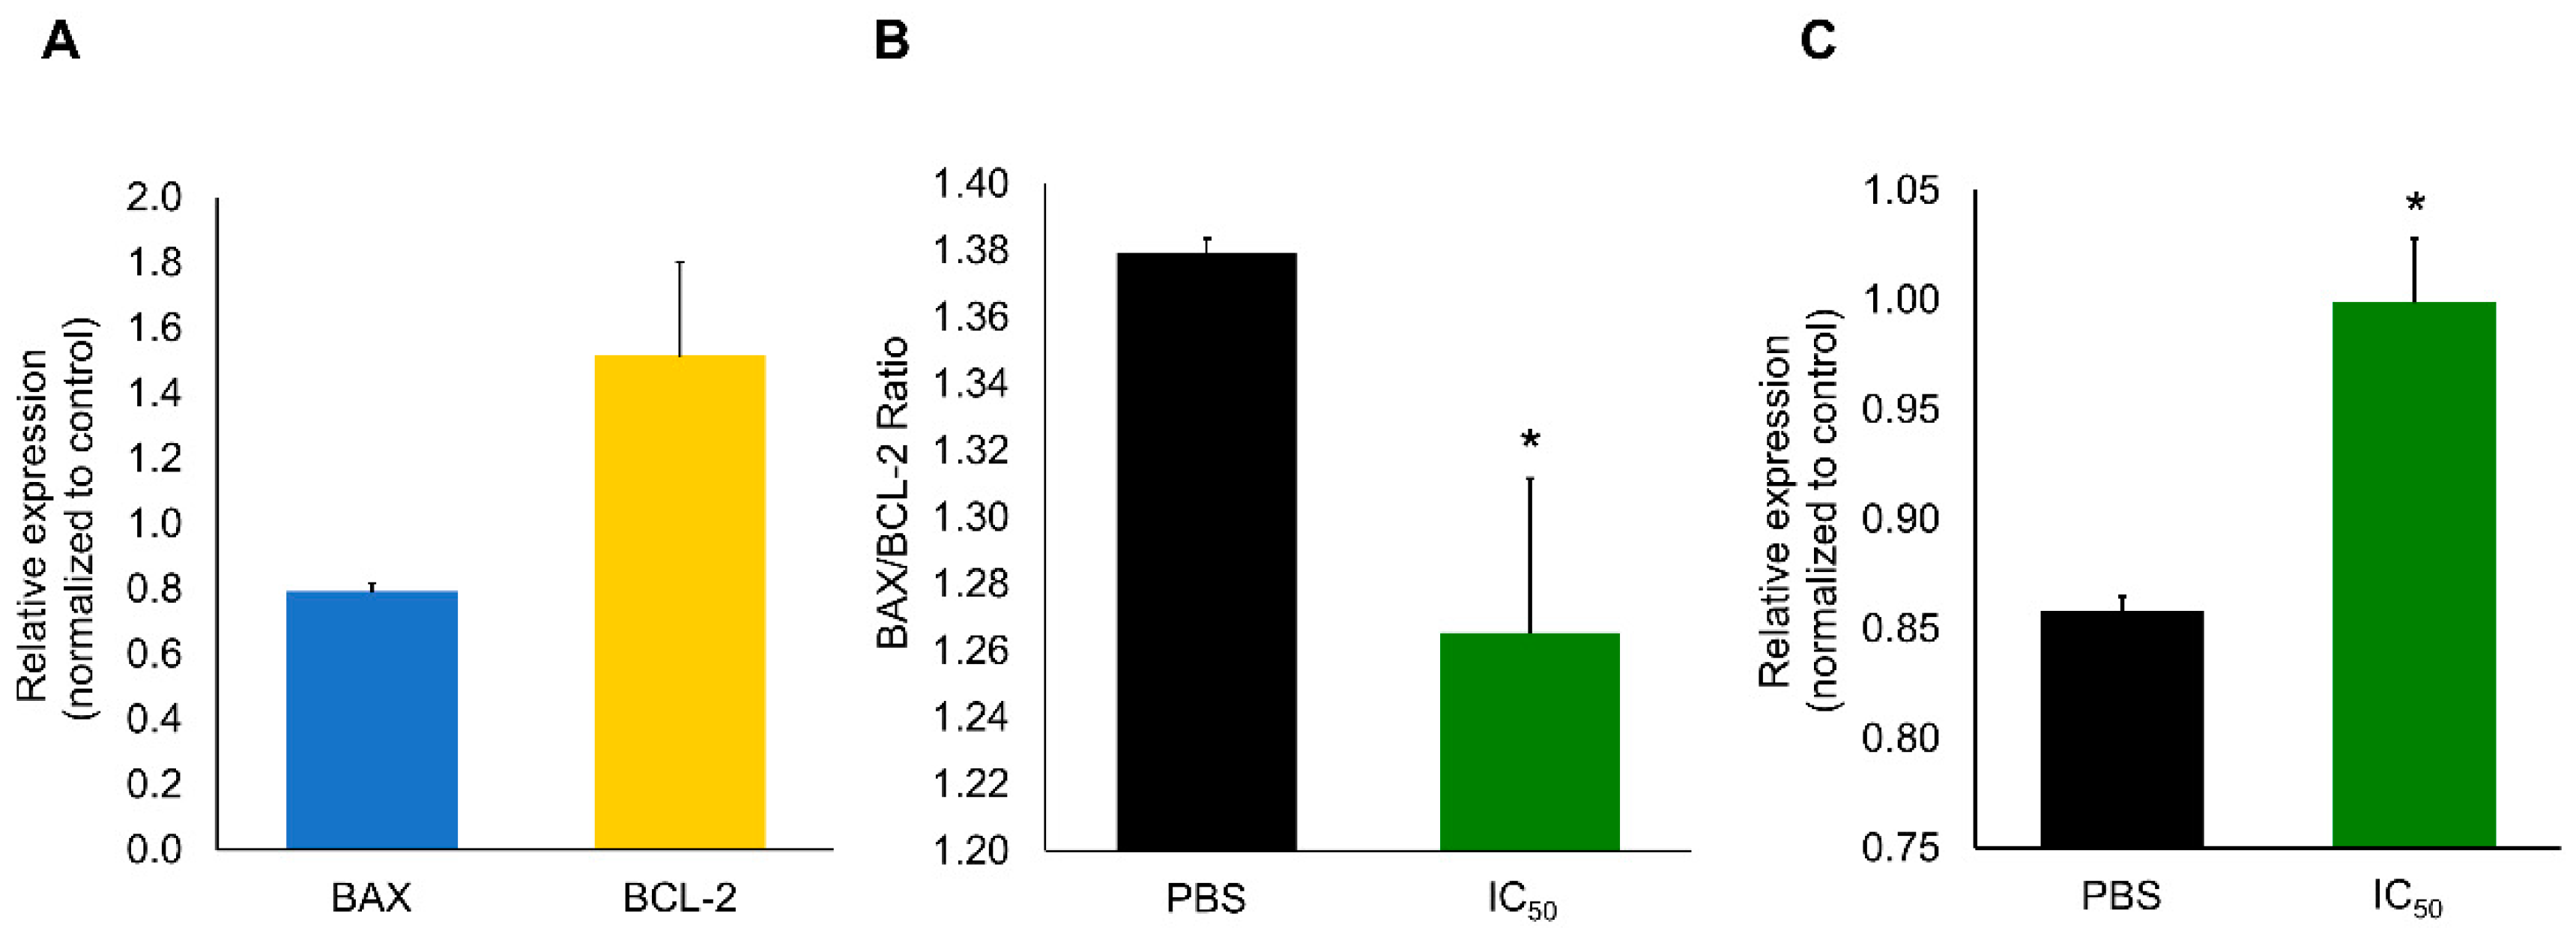
4.3.9. Western-Blot
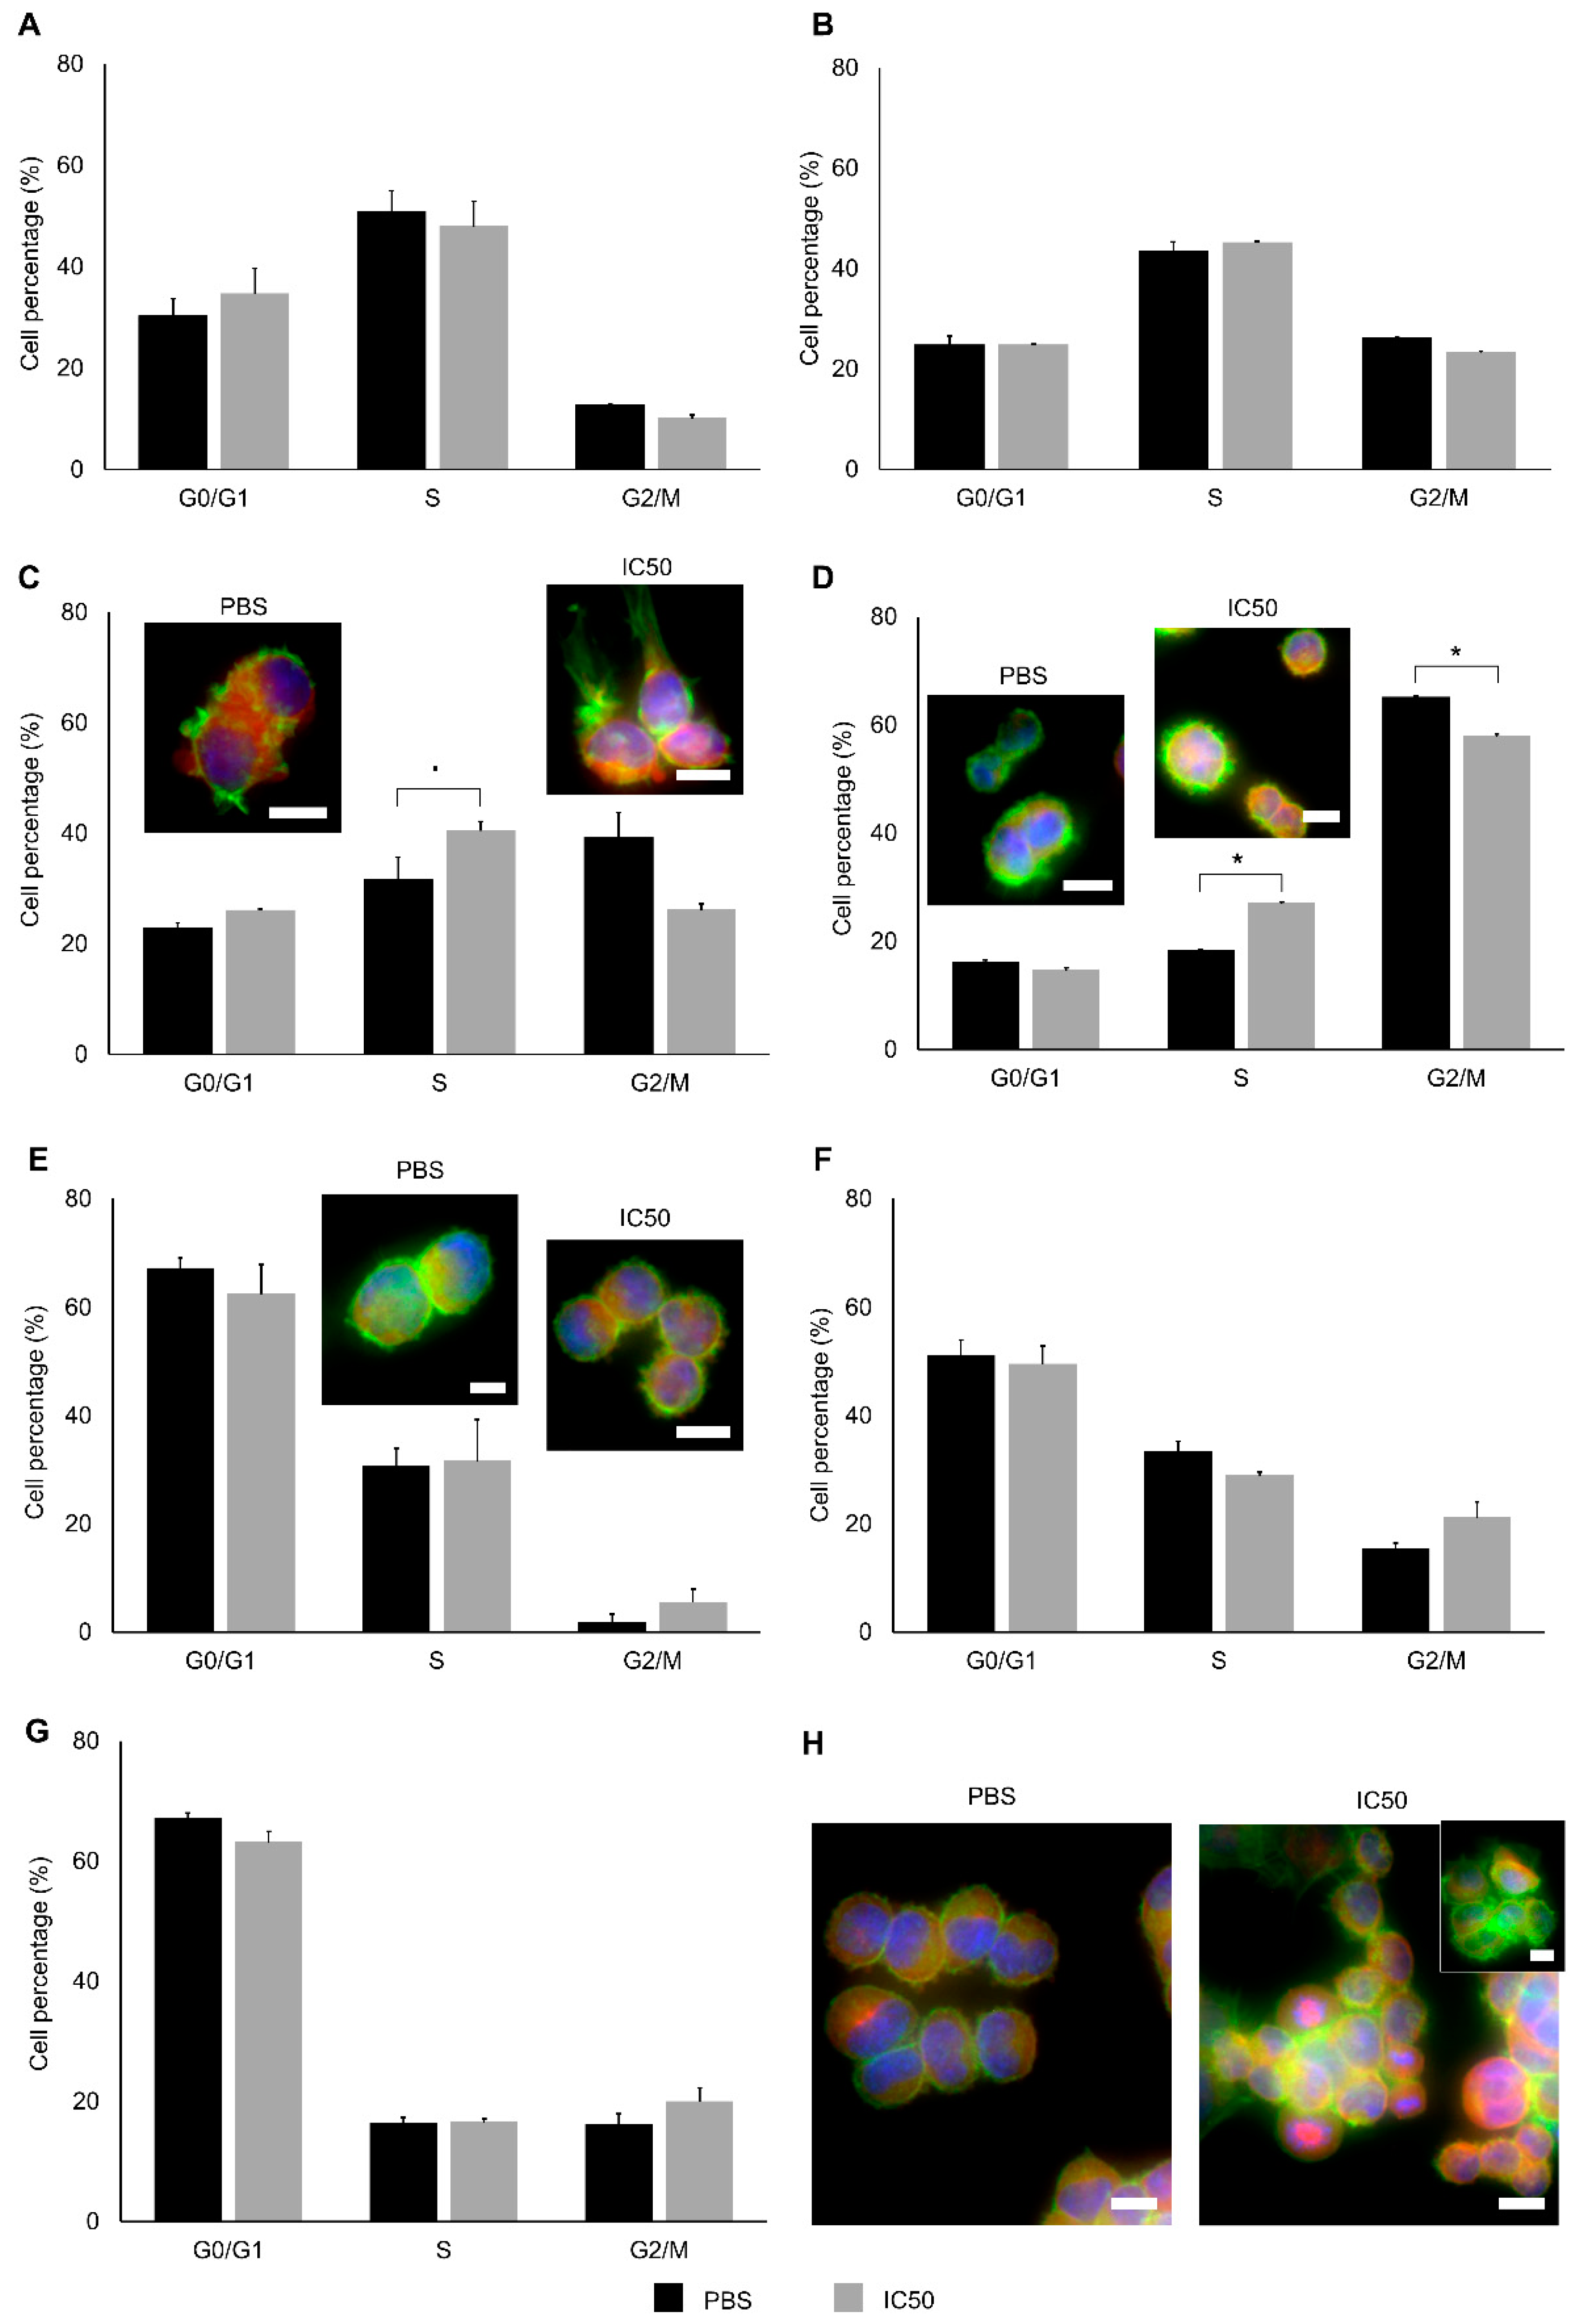
4.3.10. Cell-Cycle Analysis
4.3.11. Determination of Cytoskeletal Alterations
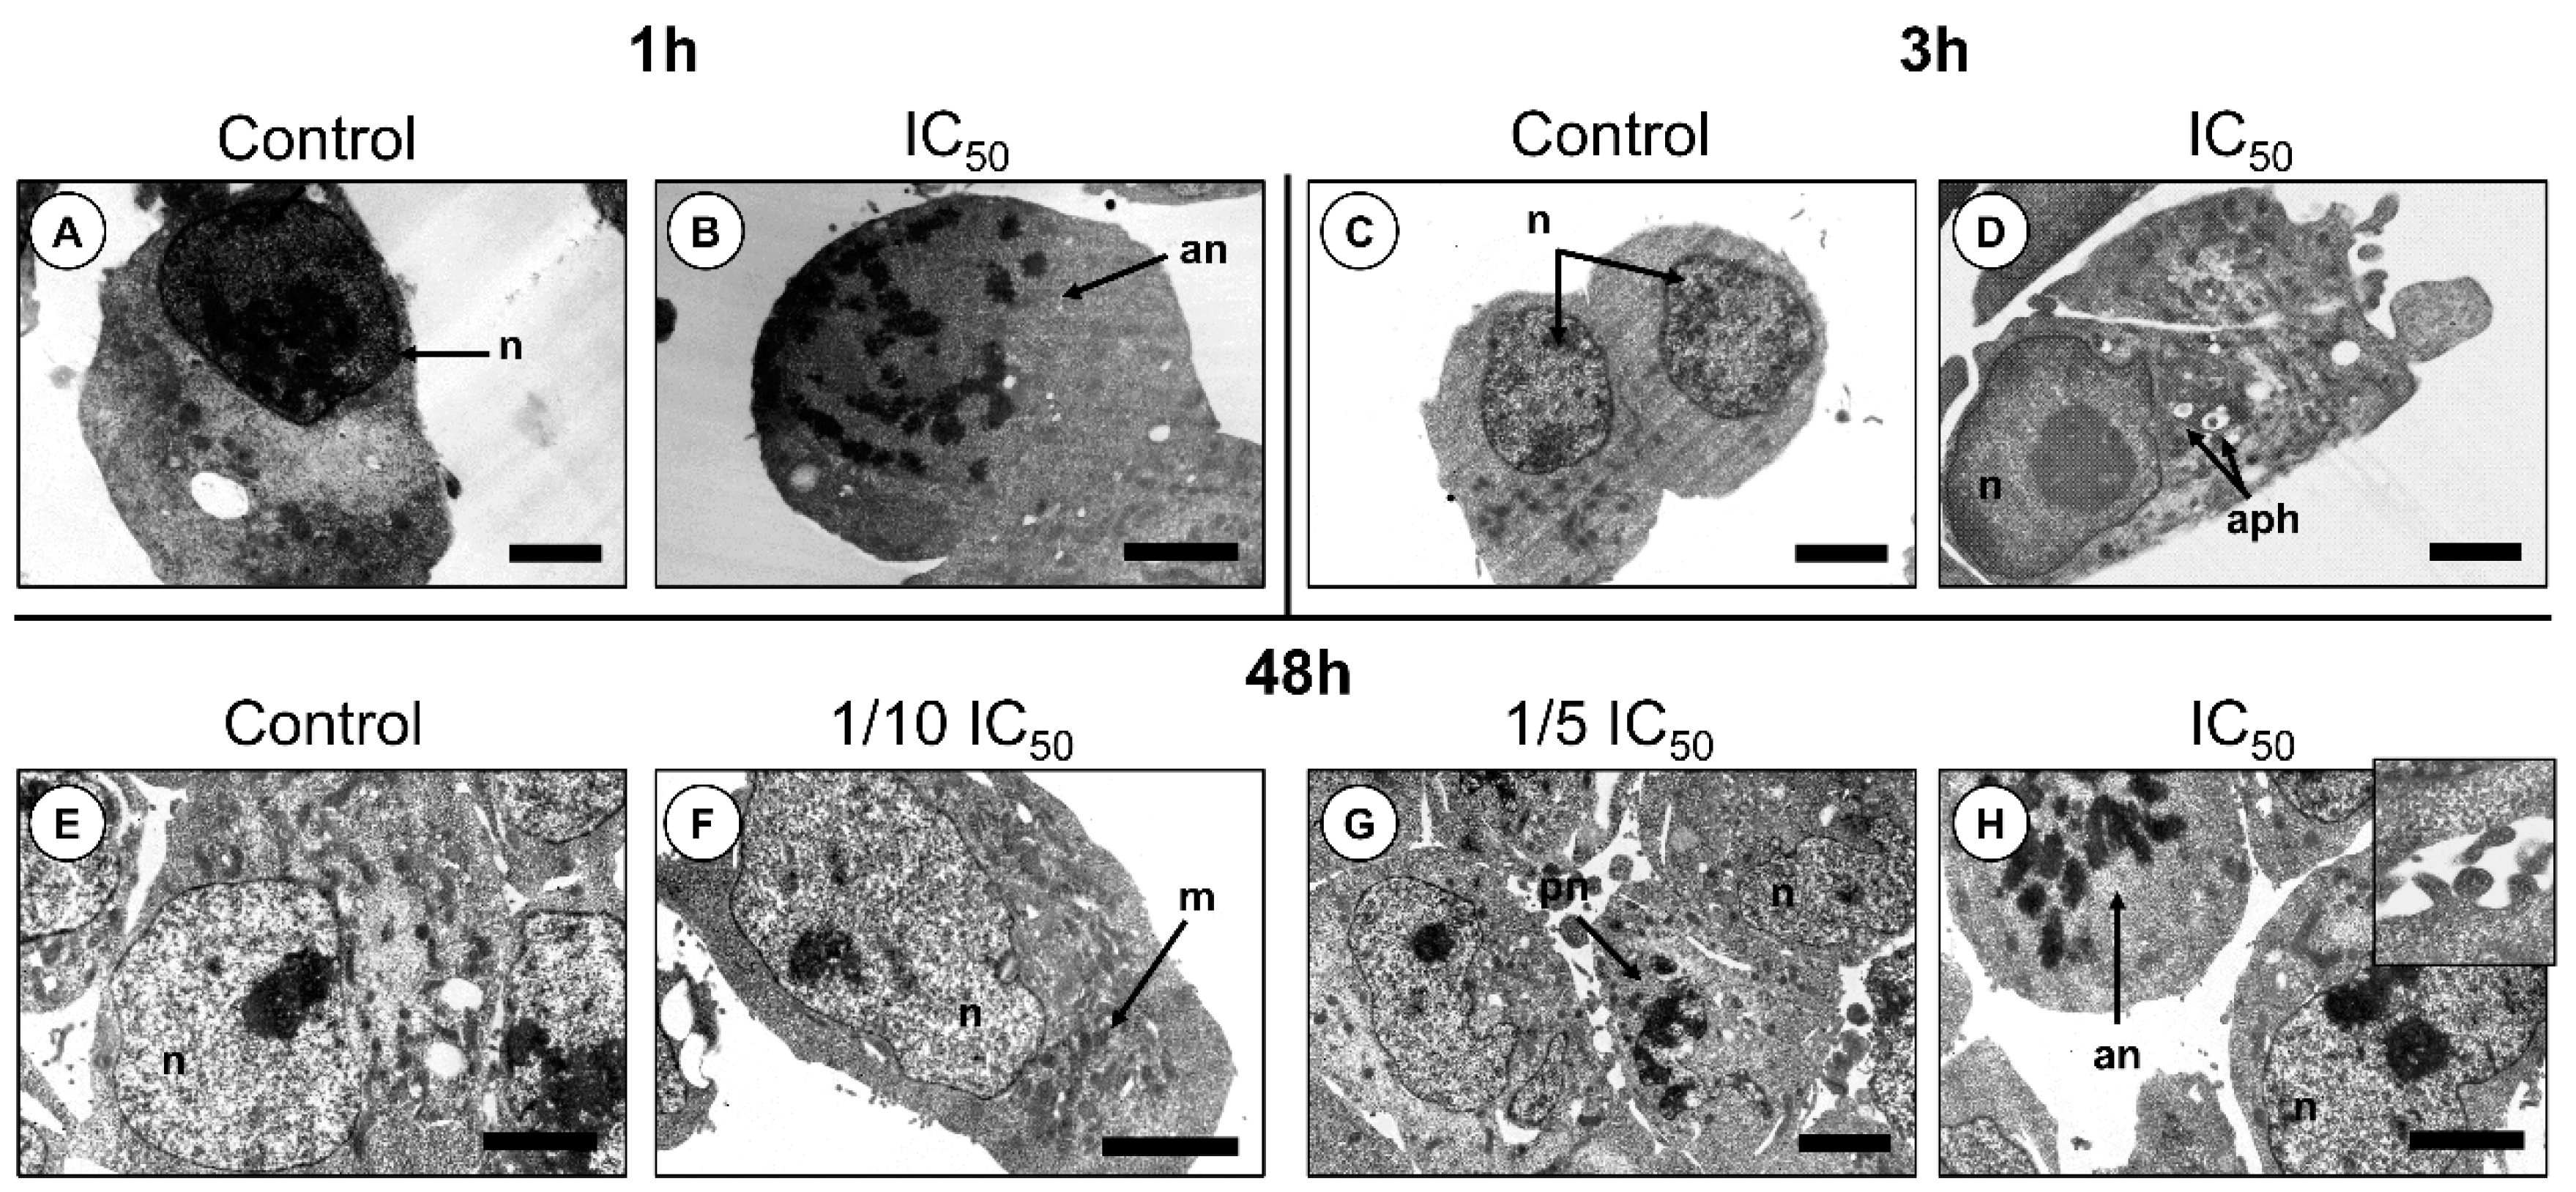
4.3.12. Cytology
4.3.13. Statistical Analysis
5. Conclusions
Supplementary Materials
Author Contributions
Funding
Institutional Review Board Statement
Informed Consent Statement
Data Availability Statement
Conflicts of Interest
References
- Das, K.; Beyene, B.B.; Datta, A.; Garribba, E.; Roma-Rodrigues, C.; Silva, A.; Fernandes, A.R.; Hung, C.H. EPR and electrochemical interpretation of bispyrazolylacetate anchored Ni(ii) and Mn(ii) complexes: Cytotoxicity and anti-proliferative activity towards human cancer cell lines. New J. Chem. 2018, 42, 9126–9139. [Google Scholar] [CrossRef]
- Ferlay, J.; Colombet, M.; Soerjomataram, I.; Dyba, T.; Randi, G.; Bettio, M.; Gavin, A.; Visser, O.; Bray, F. Cancer incidence and mortality patterns in Europe: Estimates for 40 countries and 25 major cancers in 2018. Eur. J. Cancer 2018, 103, 356–387. [Google Scholar] [CrossRef]
- Beaufort, C.M.; Helmijr, J.C.A.; Piskorz, A.M.; Hoogstraat, M.; Ruigrok-Ritstier, K.; Besselink, N.; Murtaza, M.; Van IJcken, W.F.J.; Heine, A.A.J.; Smid, M.; et al. Ovarian cancer cell line panel (OCCP): Clinical importance of in vitro morphological subtypes. PLoS ONE 2014, 9, e0103988. [Google Scholar] [CrossRef]
- Lalwani, N.; Prasad, S.R.; Vikram, R.; Shanbhogue, A.K.; Huettner, P.C.; Fasih, N. Histologic, molecular, and cytogenetic features of ovarian cancers: Implications for diagnosis and treatment. Radiographics 2011, 31, 625–646. [Google Scholar] [CrossRef] [PubMed]
- Anglesio, M.S.; Wiegand, K.C.; Melnyk, N.; Chow, C.; Salamanca, C.; Prentice, L.M.; Senz, J.; Yang, W.; Spillman, M.A.; Cochrane, D.R.; et al. Type-specific cell line models for type-specific ovarian cancer research. PLoS ONE 2013, 8, e0072162. [Google Scholar] [CrossRef]
- Hallas-Potts, A.; Dawson, J.C.; Herrington, C.S. Ovarian cancer cell lines derived from non-serous carcinomas migrate and invade more aggressively than those derived from high-grade serous carcinomas. Sci. Rep. 2019, 9, 1–10. [Google Scholar] [CrossRef] [PubMed]
- Mann, J. Natural products in cancer chemotherapy: Past, present and future. Nat. Rev. Cancer 2002, 2, 143–148. [Google Scholar] [CrossRef]
- Roberts, P.J.; Der, C.J. Targeting the Raf-MEK-ERK mitogen-activated protein kinase cascade for the treatment of cancer. Oncogene 2007, 26, 3291–3310. [Google Scholar] [CrossRef] [Green Version]
- Leal, M.C.; Anaya-Rojas, J.M.; Munro, M.H.G.; Blunt, J.W.; Melian, C.J.; Calado, R.; Lürig, M.D. Fifty years of capacity building in the search for new marine natural products. Proc. Natl. Acad. Sci. USA 2020, 117, 202007610. [Google Scholar] [CrossRef]
- Hu, Y.; Chen, J.; Hu, G.; Yu, J.; Zhu, X.; Lin, Y.; Chen, S.; Yuan, J. Statistical research on the bioactivity of new marine natural products discovered during the 28 years from 1985 to 2012. Mar. Drugs 2015, 13, 202–221. [Google Scholar] [CrossRef]
- Khalifa, S.A.M.; Elias, N.; Farag, M.A.; Chen, L.; Saeed, A.; Hegazy, M.E.F.; Moustafa, M.S.; El-Wahed, A.A.; Al-Mousawi, S.M.; Musharraf, S.G.; et al. Marine natural products: A source of novel anticancer drugs. Mar. Drugs 2019, 17, 491. [Google Scholar] [CrossRef] [PubMed] [Green Version]
- Cuevas, C.; Francesch, A. Development of Yondelis® (trabectedin, ET-743). A semisynthetic process solves the supply problem. Nat. Prod. Rep. 2009, 26, 322–337. [Google Scholar] [CrossRef] [PubMed]
- Chernikov, O.; Kuzmich, A.; Chikalovets, I.; Molchanova, V.; Hua, K.F. Lectin CGL from the sea mussel Crenomytilus grayanus induces Burkitt’s lymphoma cells death via interaction with surface glycan. Int. J. Biol. Macromol. 2017, 104, 508–514. [Google Scholar] [CrossRef] [PubMed]
- Figuerola, B.; Avila, C. The phylum bryozoa as a promising source of anticancer drugs. Mar. Drugs 2019, 17, 477. [Google Scholar] [CrossRef] [Green Version]
- Do Nascimento-Neto, L.G.; Cabral, M.G.; Carneiro, R.F.; Silva, Z.; Arruda, F.V.S.; Nagano, C.S.; Fernandes, A.R.; Sampaio, A.H.; Teixeira, E.H.; Videira, P.A. Halilectin-3, a lectin from the marine sponge Haliclona caerulea, induces apoptosis and autophagy in human breast cancer MCF7 cells through caspase-9 pathway and LC3-II protein expression. Anticancer. Agents Med. Chem. 2018, 18, 521–528. [Google Scholar] [CrossRef]
- Rodrigo, A.P.; Costa, P.M. The hidden biotechnological potential of marine invertebrates: The Polychaeta case study. Environ. Res. 2019, 173, 270–280. [Google Scholar] [CrossRef]
- Cuevas, N.; Martins, M.; Rodrigo, A.P.; Martins, C.; Costa, P.M. Explorations on the ecological role of toxin secretion and delivery in jawless predatory Polychaeta. Sci. Rep. 2018, 8, 7635. [Google Scholar] [CrossRef]
- Rodrigo, A.P.; Martins, C.; Costa, M.H.; Alves de Matos, A.P.; Costa, P.M. A morphoanatomical approach to the adaptive features of the epidermis and proboscis of a marine Polychaeta: Eulalia viridis (Phyllodocida: Phyllodocidae). J. Anat. 2018, 233, 567–579. [Google Scholar] [CrossRef]
- Rodrigo, A.P.; Grosso, A.R.; Baptista, P.V.; Fernandes, A.R.; Costa, P.M. A transcriptomic approach to the recruitment of venom proteins in a marine Polychaeta. 2020; 1–22, submitted. [Google Scholar]
- Oršolić, N. Bee venom in cancer therapy. Cancer Metastasis Rev. 2012, 31, 173–194. [Google Scholar] [CrossRef]
- Marcinkiewicz, C. Applications of snake venom components to modulate integrin activities in cell-matrix interactions. Int. J. Biochem. Cell Biol. 2013, 45, 1974–1986. [Google Scholar] [CrossRef] [Green Version]
- Calderon, L.A.; Sobrinho, J.C.; Zaqueo, K.D.; Moura, A.A.D.; Grabner, A.N.; Mazzi, M.V.; Marcussi, S.; Nomizo, A.; Fernandes, C.F.C.; Zuliani, J.P.; et al. Antitumoral activities of snake venom proteins: New trends in cancer therapy. BioMed Res. Int. 2014, 2014, 1–19. [Google Scholar] [CrossRef] [PubMed] [Green Version]
- Simões-Silva, R.; Alfonso, J.; Gomez, A.; Holanda, R.J.; Sobrinho, J.C.; Zaqueo, K.D.; Moreira-Dill, L.S.; Kayano, A.M.; Grabner, F.P.; da Silva, S.L.; et al. Snake venom, a natural library of new potential therapeutic molecules: Challenges and current perspectives. Curr. Pharm. Biotechnol. 2018, 19, 308–335. [Google Scholar] [CrossRef] [PubMed]
- Antolikova, N.R.; Kello, M.; Zigova, M.; Tischlerova, V.; Petrilla, V.; Pirnik, Z.; Mojzisova, G.; Mojzis, J. Naja asheiz venom induces mitochondria-mediated apoptosis in human colorectal cancer cells. Acta Biochim. Pol. 2019, 66, 207–213. [Google Scholar] [CrossRef] [Green Version]
- Okada, M.; Ortiz, E.; Corzo, G.; Possani, L.D. Pore-forming spider venom peptides show cytotoxicity to hyperpolarized cancer cells expressing K+ channels: A lentiviral vector approach. PLoS ONE 2019, 14, e0215391. [Google Scholar] [CrossRef]
- Matsui, T.; Fujimura, Y.; Titani, K. Snake venom proteases affecting hemostasis and thrombosis. Biochim. Biophys. Acta Protein Struct. Mol. Enzymol. 2000, 1477, 146–156. [Google Scholar] [CrossRef]
- Nok, A.J.; Abubakar, M.S.; Adaudi, A.; Balogun, E. Aryl sulfatase from Naja nigricolis venom: Characterization and possible contribution in the pathology of snake poisoning. J. Biochem. Mol. Toxicol. 2003, 17, 59–66. [Google Scholar] [CrossRef]
- Pesentseva, M.S.; Sova, V.V.; Silchenko, A.S.; Kicha, A.A.; Silchenko, A.S.; Haertle, T.; Zvyagintseva, T.N. A new arylsulfatase from the marine mollusk Turbo chrysostomus. Chem. Nat. Compd. 2012, 48, 853–859. [Google Scholar] [CrossRef]
- Diez-Roux, G.; Ballabio, A. Sulfatases and human disease. Annu. Rev. Genomics Hum. Genet. 2005, 6, 355–379. [Google Scholar] [CrossRef]
- De Graaf, D.C.; Aerts, M.; Brunain, M.; Desjardins, C.A.; Jacobs, F.J.; Werren, J.H.; Devreese, B. Insights into the venom composition of the ectoparasitoid wasp Nasonia vitripennis from bioinformatic and proteomic studies. Insect Mol. Biol. 2010, 19, 11–26. [Google Scholar] [CrossRef] [Green Version]
- Fricke, E.R.; Hartmann, F. Connective Tissues: Biochemistry and Pathophysiology; Springer: Berlin/Heidelberg, Germany; New York, NY, USA, 1974; ISBN 9783642619342. [Google Scholar]
- Bhattacharyya, S.; Kotlo, K.; Danziger, R.; Tobacman, J.K. Arylsulfatase B regulates interaction of chondroitin-4-sulfate and kininogen in renal epithelial cells. Biochim. Biophys. Acta Mol. Basis Dis. 2010, 1802, 472–477. [Google Scholar] [CrossRef] [Green Version]
- Zucker-franklin, D.; Grusky, G.; Yang, J. Arylsulfatase in natural killer cells: Its possible role in cytotoxicity. Proc. Natl. Acad. Sci. USA 1983, 80, 6977–6981. [Google Scholar] [CrossRef] [PubMed] [Green Version]
- Bose, U.; Wang, T.; Zhao, M.; Motti, C.A.; Hall, M.R.; Cummins, S.F. Multiomics analysis of the giant triton snail salivary gland, a crown-of-thorns starfish predator. Sci. Rep. 2017, 7, 1–14. [Google Scholar] [CrossRef] [PubMed] [Green Version]
- Page, M.J.; Di Cera, E. Evolution of peptidase diversity. J. Biol. Chem. 2008, 283, 30010–30014. [Google Scholar] [CrossRef] [PubMed] [Green Version]
- Amorim, F.G.; Menaldo, D.L.; Carone, S.E.I.; Silva, T.A.; Sartim, M.A.; De Pauw, E.; Quinton, L.; Sampaio, S.V. New insights on moojase, a thrombin-like serine protease from Bothrops moojeni snake venom. Toxins 2018, 10, 500. [Google Scholar] [CrossRef] [PubMed] [Green Version]
- Carone, S.E.I.; Menaldo, D.L.; Sartim, M.A.; Bernardes, C.P.; Caetano, R.C.; da Silva, R.R.; Cabral, H.; Barraviera, B.; Ferreira Junior, R.S.; Sampaio, S.V. BjSP, a novel serine protease from Bothrops jararaca snake venom that degrades fibrinogen without forming fibrin clots. Toxicol. Appl. Pharmacol. 2018, 357, 50–61. [Google Scholar] [CrossRef] [Green Version]
- Choo, Y.M.; Lee, K.S.; Yoon, H.J.; Kim, B.Y.; Sohn, M.R.; Roh, J.Y.; Je, Y.H.; Kim, N.J.; Kim, I.; Woo, S.D.; et al. Dual function of a bee venom serine protease: Prophenoloxidase-activating factor in arthropods and fibrin(ogen)olytic enzyme in mammals. PLoS ONE 2010, 5, e0010393. [Google Scholar] [CrossRef]
- Jee, H. Size dependent classification of heat shock proteins: A mini-review. J. Exerc. Rehabil. 2016, 12, 255–259. [Google Scholar] [CrossRef] [Green Version]
- Schlüter, O.M.; Khvotchev, M.; Jahn, R.; Südhof, T.C. Localization versus function of Rab3 proteins: Evidence for a common regulatory role in controlling fusion. J. Biol. Chem. 2002, 277, 40919–40929. [Google Scholar] [CrossRef] [Green Version]
- Schwartz, S.L.; Cao, C.; Pylypenko, O.; Rak, A.; Wandinger-Ness, A. Rab GTPases at a glance. J. Cell Sci. 2008, 120, 3905–3910. [Google Scholar] [CrossRef] [Green Version]
- Van Vlijmen, T.; Vleugel, M.; Evers, M.; Mohammed, S.; Wulf, P.S.; Heck, A.J.R.; Hoogenraad, C.C.; van der Sluijs, P. A unique residue in rab3c determines the interaction with novel binding protein Zwint-1. FEBS Lett. 2008, 582, 2838–2842. [Google Scholar] [CrossRef] [Green Version]
- Xu, Z.; Zhou, Y.; Cao, Y.; Dinh, T.L.A.; Wan, J.; Zhao, M. Identification of candidate biomarkers and analysis of prognostic values in ovarian cancer by integrated bioinformatics analysis. Med. Oncol. 2016, 33. [Google Scholar] [CrossRef] [PubMed]
- Van Hemert, M.J.; Yde Steensma, H.; Van Paul, G. 14-3-3 Proteins: Key regulators of cell division, signalling and apoptosis. BioEssays 2001, 23, 936–946. [Google Scholar] [CrossRef] [PubMed]
- Takayama, S.; Bimston, D.N.; Matsuzawa, S.I.; Freeman, B.C.; Aime-Sempe, C.; Xie, Z.; Morimoto, R.I.; Reed, J.C. BAG-1 modulates the chaperone activity of Hsp70/Hsc70. EMBO J. 1997, 16, 4887–4896. [Google Scholar] [CrossRef] [PubMed] [Green Version]
- Reed, J.C. Double identity for proteins of the Bcl-2 family. Nature 1997, 387, 773–776. [Google Scholar] [CrossRef]
- Maurer, G.; Tarkowski, B.; Baccarini, M. Raf kinases in cancer-roles and therapeutic opportunities. Oncogene 2011, 30, 3477–3488. [Google Scholar] [CrossRef] [Green Version]
- Grammatikakis, N.; Lin, J.-H.; Grammatikakis, A.; Tsichlis, P.N.; Cochran, B.H. p50cdc37 acting in concert with Hsp90 is Required for Raf-1 function. Mol. Cell. Biol. 1999, 19, 1661–1672. [Google Scholar] [CrossRef] [Green Version]
- Huang, Y.; Guo, X.-X.; Han, B.; Zhang, X.-M.; An, S.; Zhang, X.-Y.; Yang, Y.; Liu, Y.; Hao, Q.; Xu, T.-R. Decoding the full picture of Raf1 function based on its interacting proteins. Oncotarget 2017, 8, 68329–68337. [Google Scholar] [CrossRef] [Green Version]
- Jaumot, M.; Hancock, J.F. Protein phosphatases 1 and 2A promote Raf-1 activation by regulating 14-3-3 interactions. Oncogene 2001, 20, 3949–3958. [Google Scholar] [CrossRef]
- Mils, V.; Baldin, V.; Goubin, F.; Pinta, I.; Papin, C.; Waye, M.; Eychene, A.; Ducommun, B. Specific interaction between 14-3-3 isoforms and the human CDC25B phosphatase. Oncogene 2000, 19, 1257–1265. [Google Scholar] [CrossRef] [Green Version]
- Ferguson, A.T.; Evron, E.; Umbricht, C.B.; Pandita, T.K.; Chan, T.A.; Hermeking, H.; Marks, J.R.; Lambers, A.R.; Futreal, P.A.; Stampfer, M.R.; et al. High frequency of hypermethylation at the 14-3-3 σ locus leads to gene silencing in breast cancer. Proc. Natl. Acad. Sci. USA 2000, 97, 6049–6054. [Google Scholar] [CrossRef] [Green Version]
- MacFarlane, S.N.; Sontheimer, H. Changes in ion channel expression accompany cell cycle progression of spinal cord astrocytes. Glia 2000, 30, 39–48. [Google Scholar] [CrossRef]
- Goloubinoff, P. Editorial: The HSP70 molecular chaperone machines. Front. Mol. Biosci. 2017, 4, 1–4. [Google Scholar] [CrossRef] [PubMed] [Green Version]
- Eustace, B.K.; Sakurai, T.; Stewart, J.K.; Yimlamai, D.; Unger, C.; Zehetmeier, C.; Lain, B.; Torella, C.; Henning, S.W.; Beste, G.; et al. Functional proteomic screens reveal an essential extracellular role for hsp90α in cancer cell invasiveness. Nat. Cell Biol. 2004, 6, 507–514. [Google Scholar] [CrossRef] [PubMed]
- Cho, H.S.; Shimazu, T.; Toyokawa, G.; Daigo, Y.; Maehara, Y.; Hayami, S.; Ito, A.; Masuda, K.; Ikawa, N.; Field, H.I.; et al. Enhanced HSP70 lysine methylation promotes proliferation of cancer cells through activation of Aurora kinase B. Nat. Commun. 2012, 3. [Google Scholar] [CrossRef]
- Kovacs, Z.; Jung, I.; Gurzu, S. Arylsulfatases A and B: From normal tissues to malignant tumors. Pathol. Res. Pract. 2019, 215, 152516. [Google Scholar] [CrossRef]
- Feferman, L.; Bhattacharyya, S.; Deaton, R.; Gann, P.; Guzman, G.; Kajdacsy-Balla, A.; Tobacman, J.K. Arylsulfatase B (N-acetylgalactosamine-4-sulfatase): Potential role as a biomarker in prostate cancer. Prostate Cancer Prostatic Dis. 2013, 16, 277–284. [Google Scholar] [CrossRef] [Green Version]
- Bhattacharyya, S.; Feferman, L.; Han, X.; Ouyang, Y.; Zhang, F.; Linhardt, R.J.; Tobacman, J.K. Decline in arylsulfatase B expression increases EGFR expression by inhibiting the protein-tyrosine phosphatase SHP2 and activating JNK in prostate cells. J. Biol. Chem. 2018, 293, 11076–11087. [Google Scholar] [CrossRef] [Green Version]
- Lenis-Rojas, O.A.; Fernandes, A.R.; Roma-Rodrigues, C.; Baptista, P.V.; Marques, F.; Pérez-Fernández, D.; Guerra-Varela, J.; Sánchez, L.; Vázquez-García, D.; Torres, M.L.; et al. Heteroleptic mononuclear compounds of ruthenium(II): Synthesis, structural analyses, in vitro antitumor activity and in vivo toxicity on zebrafish embryos. Dalt. Trans. 2016, 45, 19127–19140. [Google Scholar] [CrossRef]
- Choroba, K.; MacHura, B.; Raposo, L.R.; Małecki, J.G.; Kula, S.; Pajak, M.; Erfurt, K.; Maroń, A.M.; Fernandes, A.R. Platinum(II) complexes showing high cytotoxicity toward A2780 ovarian carcinoma cells. Dalt. Trans. 2019, 48, 13081–13093. [Google Scholar] [CrossRef]
- González-Polo, R.A.; Boya, P.; Pauleau, A.L.; Jalil, A.; Larochette, N.; Souquère, S.; Eskelinen, E.L.; Pierron, G.; Saftig, P.; Kroemer, G. The apoptosis/autophagy paradox: Autophagic vacuolization before apoptotic death. J. Cell Sci. 2005, 118, 3091–3102. [Google Scholar] [CrossRef] [Green Version]
- Malyarenko, T.V.; Malyarenko, O.S.; Kicha, A.A.; Ivanchina, N.V.; Kalinovsky, A.I.; Dmitrenok, P.S.; Ermakova, S.P.; Stonik, V.A. In vitro anticancer and proapoptotic activities of steroidal glycosides from the starfish Anthenea aspera. Mar. Drugs 2018, 16, 420. [Google Scholar] [CrossRef] [PubMed] [Green Version]
- Gomes, S.E.; Pereira, D.M.; Roma-rodrigues, C.; Rodrigues, M.P.; Fernandes, R.; Borralho, P.M. Convergence of miR-143 overexpression, oxidative stress and cell death in HCT116 human colon cancer cells. PLoS ONE 2018, 13, e0191607. [Google Scholar] [CrossRef] [PubMed]
- Laemmli, U.K. Cleavage of structural proteins during the assembly of the head of bacteriophage T4. Nature 1970, 227, 680–685. [Google Scholar] [CrossRef] [PubMed]
- Hames, B.D. Gel Electrophoresis of Proteins: A Practical Approach, 3rd ed.; Oxford University Press: New York, NY, USA, 1998. [Google Scholar]
- Altschul, S.F.; Gish, W.; Miller, W.; Myers, E.W.; Lipman, D.J. Basic local alignment search tool. J. Mol. Biol. 1990, 215, 403–410. [Google Scholar] [CrossRef]
- Thiel, D.; Hugenschutt, M.; Meyer, H.; Paululat, A.; Quijada-Rodriguez, A.R.; Purschke, G.; Weihrauch, D. Ammonia excretion in the marine polychaete Eurythoe complanata (Annelida). J. Exp. Biol. 2017, 220, 425–436. [Google Scholar] [CrossRef] [Green Version]
- Suzek, B.E.; Wang, Y.; Huang, H.; McGarvey, P.B.; Wu, C.H. UniRef clusters: A comprehensive and scalable alternative for improving sequence similarity searches. Bioinformatics 2015, 31, 926–932. [Google Scholar] [CrossRef] [Green Version]
- States, D.J.; Gish, W. Combined use of sequence similarity and codon bias for coding region identification. J. Comput. Biol. 1994, 1, 39–50. [Google Scholar] [CrossRef] [Green Version]
- Livak, K.J.; Schmittgen, T.D. Analysis of relative gene expression data using real-time quantitative PCR and the 2−ΔΔCT method. Methods 2001, 25, 402–408. [Google Scholar] [CrossRef]
- Szklarczyk, D.; Gable, A.L.; Lyon, D.; Junge, A.; Wyder, S.; Huerta-Cepas, J.; Simonovic, M.; Doncheva, N.T.; Morris, J.H.; Bork, P.; et al. STRING v11: Protein-protein association networks with increased coverage, supporting functional discovery in genome-wide experimental datasets. Nucleic Acids Res. 2019, 47, D607–D613. [Google Scholar] [CrossRef] [Green Version]
- Czerwińska, K.; Machura, B.; Kula, S.; Krompiec, S.; Erfurt, K.; Roma-Rodrigues, C.; Fernandes, A.R.; Shul’Pina, L.S.; Ikonnikov, N.S.; Shul’Pin, G.B. Copper(II) complexes of functionalized 2,2′:6′,2″-terpyridines and 2,6-di(thiazol-2-yl)pyridine: Structure, spectroscopy, cytotoxicity and catalytic activity. Dalt. Trans. 2017, 46, 9591–9604. [Google Scholar] [CrossRef] [Green Version]
- Almeida, J.; Roma-Rodrigues, C.; Mahmoud, A.G.; Guedes da Silva, M.F.C.; Pombeiro, A.J.L.; Martins, L.M.D.R.S.; Baptista, P.V.; Fernandes, A.R. Structural characterization and biological properties of silver(I) tris(pyrazolyl)methane sulfonate. J. Inorg. Biochem. 2019, 199, 110789. [Google Scholar] [CrossRef] [PubMed]
- Ma, Z.; Zhang, B.; Guedes Da Silva, M.F.C.; Silva, J.; Mendo, A.S.; Baptista, P.V.; Fernandes, A.R.; Pombeiro, A.J.L. Synthesis, characterization, thermal properties and antiproliferative potential of copper (II) 4′-phenyl-terpyridine compounds. Dalt. Trans. 2016, 45, 5339–5355. [Google Scholar] [CrossRef] [PubMed]
- Schneider, C.A.; Rasband, W.S.; Eliceiri, K.W. NIH Image to ImageJ: 25 years of image analysis. Nat. Methods 2012, 9, 671–675. [Google Scholar] [CrossRef] [PubMed]
- Vinhas, R.; Fernandes, A.R.; Baptista, P.V. Gold nanoparticles for BCR-ABL1 gene silencing: Improving tyrosine kinase inhibitor efficacy in chronic myeloid leukemia. Mol. Ther. Nucleic Acids 2017, 7, 408–416. [Google Scholar] [CrossRef] [Green Version]
- Schindelin, J.; Arganda-Carrera, I.; Frise, E.; Verena, K.; Mark, L.; Tobias, P.; Stephan, P.; Curtis, R.; Stephan, S.; Benjamin, S.; et al. Fiji—An open platform for biological image analysis. Nat. Methods 2009, 9, 241. [Google Scholar] [CrossRef] [Green Version]
- Vogt, C.; Pernemalm, M.; Kohonen, P.; Laurent, S.; Hultenby, K.; Vahter, M.; Lehtiö, J.; Toprak, M.S.; Fadeel, B. Proteomics analysis reveals distinct corona composition on magnetic nanoparticles with different surface coatings: Implications for interactions with primary human macrophages. PLoS ONE 2015, 10, e0129008. [Google Scholar] [CrossRef] [Green Version]
- Venable, J.H.; Coggeshall, R. A simplified lead citrate stain for use in electron microscopy. J. Cell Biol. 1965, 25, 407–408. [Google Scholar] [CrossRef] [Green Version]
- Ihaka, R.; Gentleman, R. R: A language for data analysis and graphics. J. Comput. Graph. Stat. 1996, 5, 299–314. [Google Scholar] [CrossRef]


| Protein | Method | logFC | Conserved Domain (Pfam) | Protein Match | e-Value (Blastp) |
|---|---|---|---|---|---|
| SP | RNAseq | 11.85 | Trypsin-like serine protease | Serine protease 33-like (Orbicella faveolata) | 6 × 10−54 |
| MS/MS | - | Serine protease (Protobothrops flavoviridis) | 6 × 10⁻⁵ | ||
| MS/MS | - | Transmembrane protease serine 7 (Ophiophagus hannah) | 7.8 | ||
| ARSB | RNAseq | 5.08 | ALP P like superfamily | Arylsulfatase B (Penaeus vannamei) | 2 × 10−83 |
| MS/MS | - | N-acetylgalactosamine 6-sulfate sulfatase (Candidatus Moranbacteria bacterium) | 19 | ||
| RAB3 | RNAseq | 3.96 | Rab GTPase family 3 | Rab3 (Doryteuthis pealeii) | 2.00 × 10−147 |
| MS/MS | Rab GTPase family 3 | Ras family protein (Trichuris suis) | 1.00 × 10−06 | ||
| MS/MS | - | Ras-related protein Rab-3 (Melipona quadrifasciata) | 0.45 | ||
| 14-3-3 | RNAseq | 1.53 | 14-3-3 superfamily | 14-3-3 zeta (Pristionchus pacificus) (38kDa) | 2.00 × 10−121 |
| MS/MS | - | 14-3-3-like protein 4 (Pseudotsuga menziesii) | 0.21 | ||
| HSP70 | RNAseq | 1.09 | Heat shock 70 kDa protein | HSPA8 protein (Homo sapiens) | 0 |
| MS/MS | HSP70 | Heat shock cognate 71 kDa protein (Cricetulus griseus) | 3.00 × 10⁻¹⁵ |
| Cells | IC50 ± SEE (µg. µL−1) |
|---|---|
| A2780 | 0.08 ± 0.01 |
| HCT116 | 0.24 ± 4.00 |
| A549 | 0.46 ± 0.05 |
| MCF7 | 0.15 ± 0.04 |
| K562 | 0.37 ± 0.04 |
| Fibroblasts | 0.29 ± 0.02 |
Publisher’s Note: MDPI stays neutral with regard to jurisdictional claims in published maps and institutional affiliations. |
© 2021 by the authors. Licensee MDPI, Basel, Switzerland. This article is an open access article distributed under the terms and conditions of the Creative Commons Attribution (CC BY) license (http://creativecommons.org/licenses/by/4.0/).
Share and Cite
Rodrigo, A.P.; Mendes, V.M.; Manadas, B.; Grosso, A.R.; Alves de Matos, A.P.; Baptista, P.V.; Costa, P.M.; Fernandes, A.R. Specific Antiproliferative Properties of Proteinaceous Toxin Secretions from the Marine Annelid Eulalia sp. onto Ovarian Cancer Cells. Mar. Drugs 2021, 19, 31. https://0-doi-org.brum.beds.ac.uk/10.3390/md19010031
Rodrigo AP, Mendes VM, Manadas B, Grosso AR, Alves de Matos AP, Baptista PV, Costa PM, Fernandes AR. Specific Antiproliferative Properties of Proteinaceous Toxin Secretions from the Marine Annelid Eulalia sp. onto Ovarian Cancer Cells. Marine Drugs. 2021; 19(1):31. https://0-doi-org.brum.beds.ac.uk/10.3390/md19010031
Chicago/Turabian StyleRodrigo, Ana P., Vera M. Mendes, Bruno Manadas, Ana R. Grosso, António P. Alves de Matos, Pedro V. Baptista, Pedro M. Costa, and Alexandra R. Fernandes. 2021. "Specific Antiproliferative Properties of Proteinaceous Toxin Secretions from the Marine Annelid Eulalia sp. onto Ovarian Cancer Cells" Marine Drugs 19, no. 1: 31. https://0-doi-org.brum.beds.ac.uk/10.3390/md19010031