What Does HR Manage? Workforce Measurement and Control

Psychology Department, Towson University, Towson, MD 21252, USA
Merits 2021, 1(1), 16-33; https://0-doi-org.brum.beds.ac.uk/10.3390/merits1010004
Submission received: 1 April 2021
/
Revised: 21 May 2021
/
Accepted: 24 May 2021
/
Published: 28 May 2021
Abstract
:According to the long-standing axiom of management, one cannot manage what cannot be measured. Two questions emerge that are applicable to the Human Resource (HR) function. What does it manage? What should it measure? Prior answers recommend that HR should manage its functional activities, the organization’s human capital, or certain strategically important factors in a balanced scorecare, none of which are fully satisfactory. This paper argues that the HR function should manage the organization’s workforce. To do that, one must measure aspects of that workforce. This paper provides a generic framework of measures for that purpose. The foundation measures focus on the structure of jobs in the organization, the demographic characteristics of the workforce, their attitudes, the flow of personnel, and certain moderating variables. Measures for special segments of the workforce, such as sales and service personnel and leaders, are also noted.
1. What Does HR Manage? Workforce Measurement and Control
A fundamental principle of management is that one cannot manage what one does not measure [1]. A derivative principle is that whatever gets measured gets done. This principle also highlights how performance can be improved and managed by the basic act of measurement. Management itself is the fundamental process of guiding and correcting–controlling performance towards reaching a desired goal. In his classic definition, management professor Eric Flamholtz [2] (p. 51) defined management organizational control systems as “a set of mechanisms designed to increase the probability that people will behave in ways that lead to the attainment of organizational objectives.” He adds that one essential component of such a system is “a method of measurement for monitoring the performance” of the workforce (p. 53). In order to manage something effectively, however, one must first know its status and trends. This means in turn measuring and tracking what is happening to it and within it. This principle applies to any management task, from managing body weight to managing a global corporation, a government agency, or a military force. It also applies to the human resource management (HRM) function of any organization; specifically, to manage human resources, one must measure human resources.
Two basic questions emerge, however, in this context. (1) What exactly is meant by “human resources”? (2) What about “human resources” should be measured? The purpose of this article is to propose answers to these two fundamental questions. The underlying issue becomes—what kind of information should HRM professionals collect on a systematic and regular basis that will enable them to take a leading role in managing their domain of responsibility to yield the best outcome? That is, a primary responsibility for anyone in a position of HRM is to establish and use an effective system of measurement and control. Here, a generic blueprint for the kind of measurement and control system that should be in place to manage human resources (HR) is proposed. The use of a measurement control system is a necessary but not sufficient basis for managing human resources. The complete HRM process of guidance and correction occurs through effective HR policies and practices whose effectiveness depends upon a good measurement process. There are many recommendations as to what that control system should have been, although, they are not always consistent, as will be reviewed in the next section. After examining the various proposals for an HRM management control system, the focus of this paper outlines a generic system of metrics for managing an organization’s human resources.
2. Human Resources: What Is it that HRM Agents Manage?
In the agency theory of contracting, ‘owners’ establish contracts with certain individuals—who then become their ‘agents’—to manage the organization to best meet the goals and needs of the owner(s) [3]. While usually restricted to the top-most executive group, the basic principle can be applied to the next tier and beyond of managers who are delegated the responsibility of managing for the best outcomes of the organization’s owners. In this context, HR managers can be considered agents, but the question is—what exactly are they responsible for managing? The long, albeit inconsistent, history of answers to this question goes back years [4,5,6,7,8,9] Across these various models, there are certain commonly recommended metrics. Organizational performance in the guise of productivity, quality, speed, process improvement, or customer ratings is one [10,11,12]. Other suggested metrics include profitability [12]; employee commitment [13]; and diversity and fair treatment [11].
From this variety, several specific approaches to the measurement problem can be noted. One internally focused approach recommends managing the HR function as an operating process. Work by Becker, Huselid, and Ulrich [14] and Huselid, Becker, and Beatty [15] have provided detailed models for monitoring the performance of the HR function. Indeed, both volumes are replete with suggested metrics, both basic (cost per hire) and more complex (“percentage of new material in training programs each year”). Metrics of HR operations are important items to use for managing HR operations and their main point—that an HR measurement and control system should be custom-designed to support organizational strategy—is well taken. Yet, such measures are measures of HR activity, and functional efficiency and effectiveness of HR transactions and activities. While useful for managing an HR department, these metrics speak more about what HR does and how well it does things than about the larger issues of organizational performance. A highly efficient HRM function counts for little in a failing organization. Ultimately, what matters most is the quality and effectiveness of the workforce, not HR’s activities. In the final analysis, an HR professional who only measures the performance of the HR department is not managing the organization’s human resources.
Boudreau and Ramstad [16] provided a second framework for moving beyond HR function metrics, by comparing HR with two other staff functions—Marketing and Finance. Historically, these functions emerged to manage assets and conditions critical to organizational survival and success, both having a relatively clearly defined domain of organizational jurisdiction (the customer relationship, financial assets) for which they are responsible. Both professions have and apply a set of well-established principles for deciding on and managing their domains. The specific expertise of marketers and finance managers means that, in many cases, other executives in the organization defer to their judgments and recommendations. Finally, neither function could do its job if it did not regularly collect and use vital information about its domains of responsibility. Thus, at any point in time, the Finance function should be able to say what the financial condition of the organization is, such as its liquidity, how much is owed and when it is due, what the accounts receivable balance is, and so on. In the same way, Marketing should be able to report on customer segments, market penetration, and customer loyalty or repeat buying habits.
What is the counterpart domain for which an HR should be responsible? Again, monitoring HR’s performance of its classical tasks of recruitment and selection, payroll, benefits, and more only reveal HRM performance efficiencies. By focusing on human capital issues, however, Boudreau and Ramstad [16] recommended that the domain of HR responsibility should be the supply of “talentship” to the organization. Yet talent in the form of human capital, represents a subset of the organization’s total workforce. That is, all organizations have human resources (employees), yet not all employees are human capital (or employees with very high levels of education, background, and skills). For some organizations, the percentage of human capital positions among all employees can be high (e.g., professional legal or accounting firms), but in many other organizations, the percentage of human capital workers would be small (as in “big box” retailing chains with few professional positions outside headquarters). For the workforce positions that must be filled with people with high levels of preparation and experience (the prototype of human capital positions), talent metrics are vital but partial.
Yet, a third perspective here is found in the Balanced Scorecard model developed by Kaplan and Norton [15,17]. They observed that the monthly financial budget reporting system typically used in running an organization is like trying to drive a car by looking in the rearview mirror. That is, what executives and managers see when they look at monthly accounting reports is the record of what happened last month. To manage effectively, it is better to have a comprehensive set of measures that include leading indicators. In this context, they developed the balanced scorecard as a measurement and control system. The balanced scorecard includes four sets of measures—the lagging indicator of financial information; measures of customer loyalty and satisfaction; measures of work process efficiency; and finally, leading indicators that invariably involve measures of human resources. Dumitrana et al. [18] provided a typology of four main sets of HR workforce measures that would feed into a balanced scorecard framework—life quality and ethics metrics correspond to the foundation and moderator variables noted here, while economic and societal/environment measures refer to organizational performance indicators. Schay et al. [19] reported on efforts to develop and apply a complete balanced scorecard framework to the United States federal government agencies and identified three “learning and growth” metrics—employee job satisfaction, employee skills assessment, and turnover. The exact measures to be used in a balanced scorecard for a specific organization have to be custom-designed and derived from the larger strategy of the organization. Like the human capital or talentship approach, the balanced scorecard measures of leading HR indicators may be narrowly focused on a few specific “learning and growth” measures, consequently slighting attention to the full set of all workforce metrics, however. That being said, it would undoubtedly be the case that the balanced scorecard HR measures should be part of the larger workforce measurements reviewed below.
As presented here, the domain of HR focus and responsibility—what HR should be responsible for managing—is the organization’s workforce or the census of all people working for the organization, and HR agents should be able to report on the relevant status or characteristics of that workforce. In turn, HR must collect data about that workforce on a regular basis. In the plainest terms, the HR function should (and in some cases, must) have a system of metrics that collects data about its workforce on a regular basis and reports that information for regular review and action. Just as the financial status of an organization is depicted on monthly and annual accounting reports, so should there be monthly and annual HR reports about the workforce.
Overall, several lessons can be drawn from the literature. First, there is a legitimate organizational domain—the workforce—which is the distinctive province of the HR function and for which it should have primary (but not exclusive) responsibility. Second, measuring the performance efficiencies of the HR function does not speak to the quality and dynamics of a workforce. Third, workforce metrics are positioned to be leading indicators and levers of organizational performance. Fourth, important measures of the workforce can be identified and data about those indicators should be collected and reported on a regular basis in order to enable better management of the workforce. Finally, the specific workforce measurement system used by an organization needs to be custom-designed to align with and support its specific business strategy and operating practices [20,21,22]. Based on their sample of executives at large corporations in the United States, Lingle and Schiemann [23] (p. 58f) concluded that “employee measurement is the biggest single measurement area that separates successful from less successful firms. Knowing workforce values, morale, productivity and competencies appears to be a significant advantage for these successful firms”.
3. A Framework for Workforce Measures
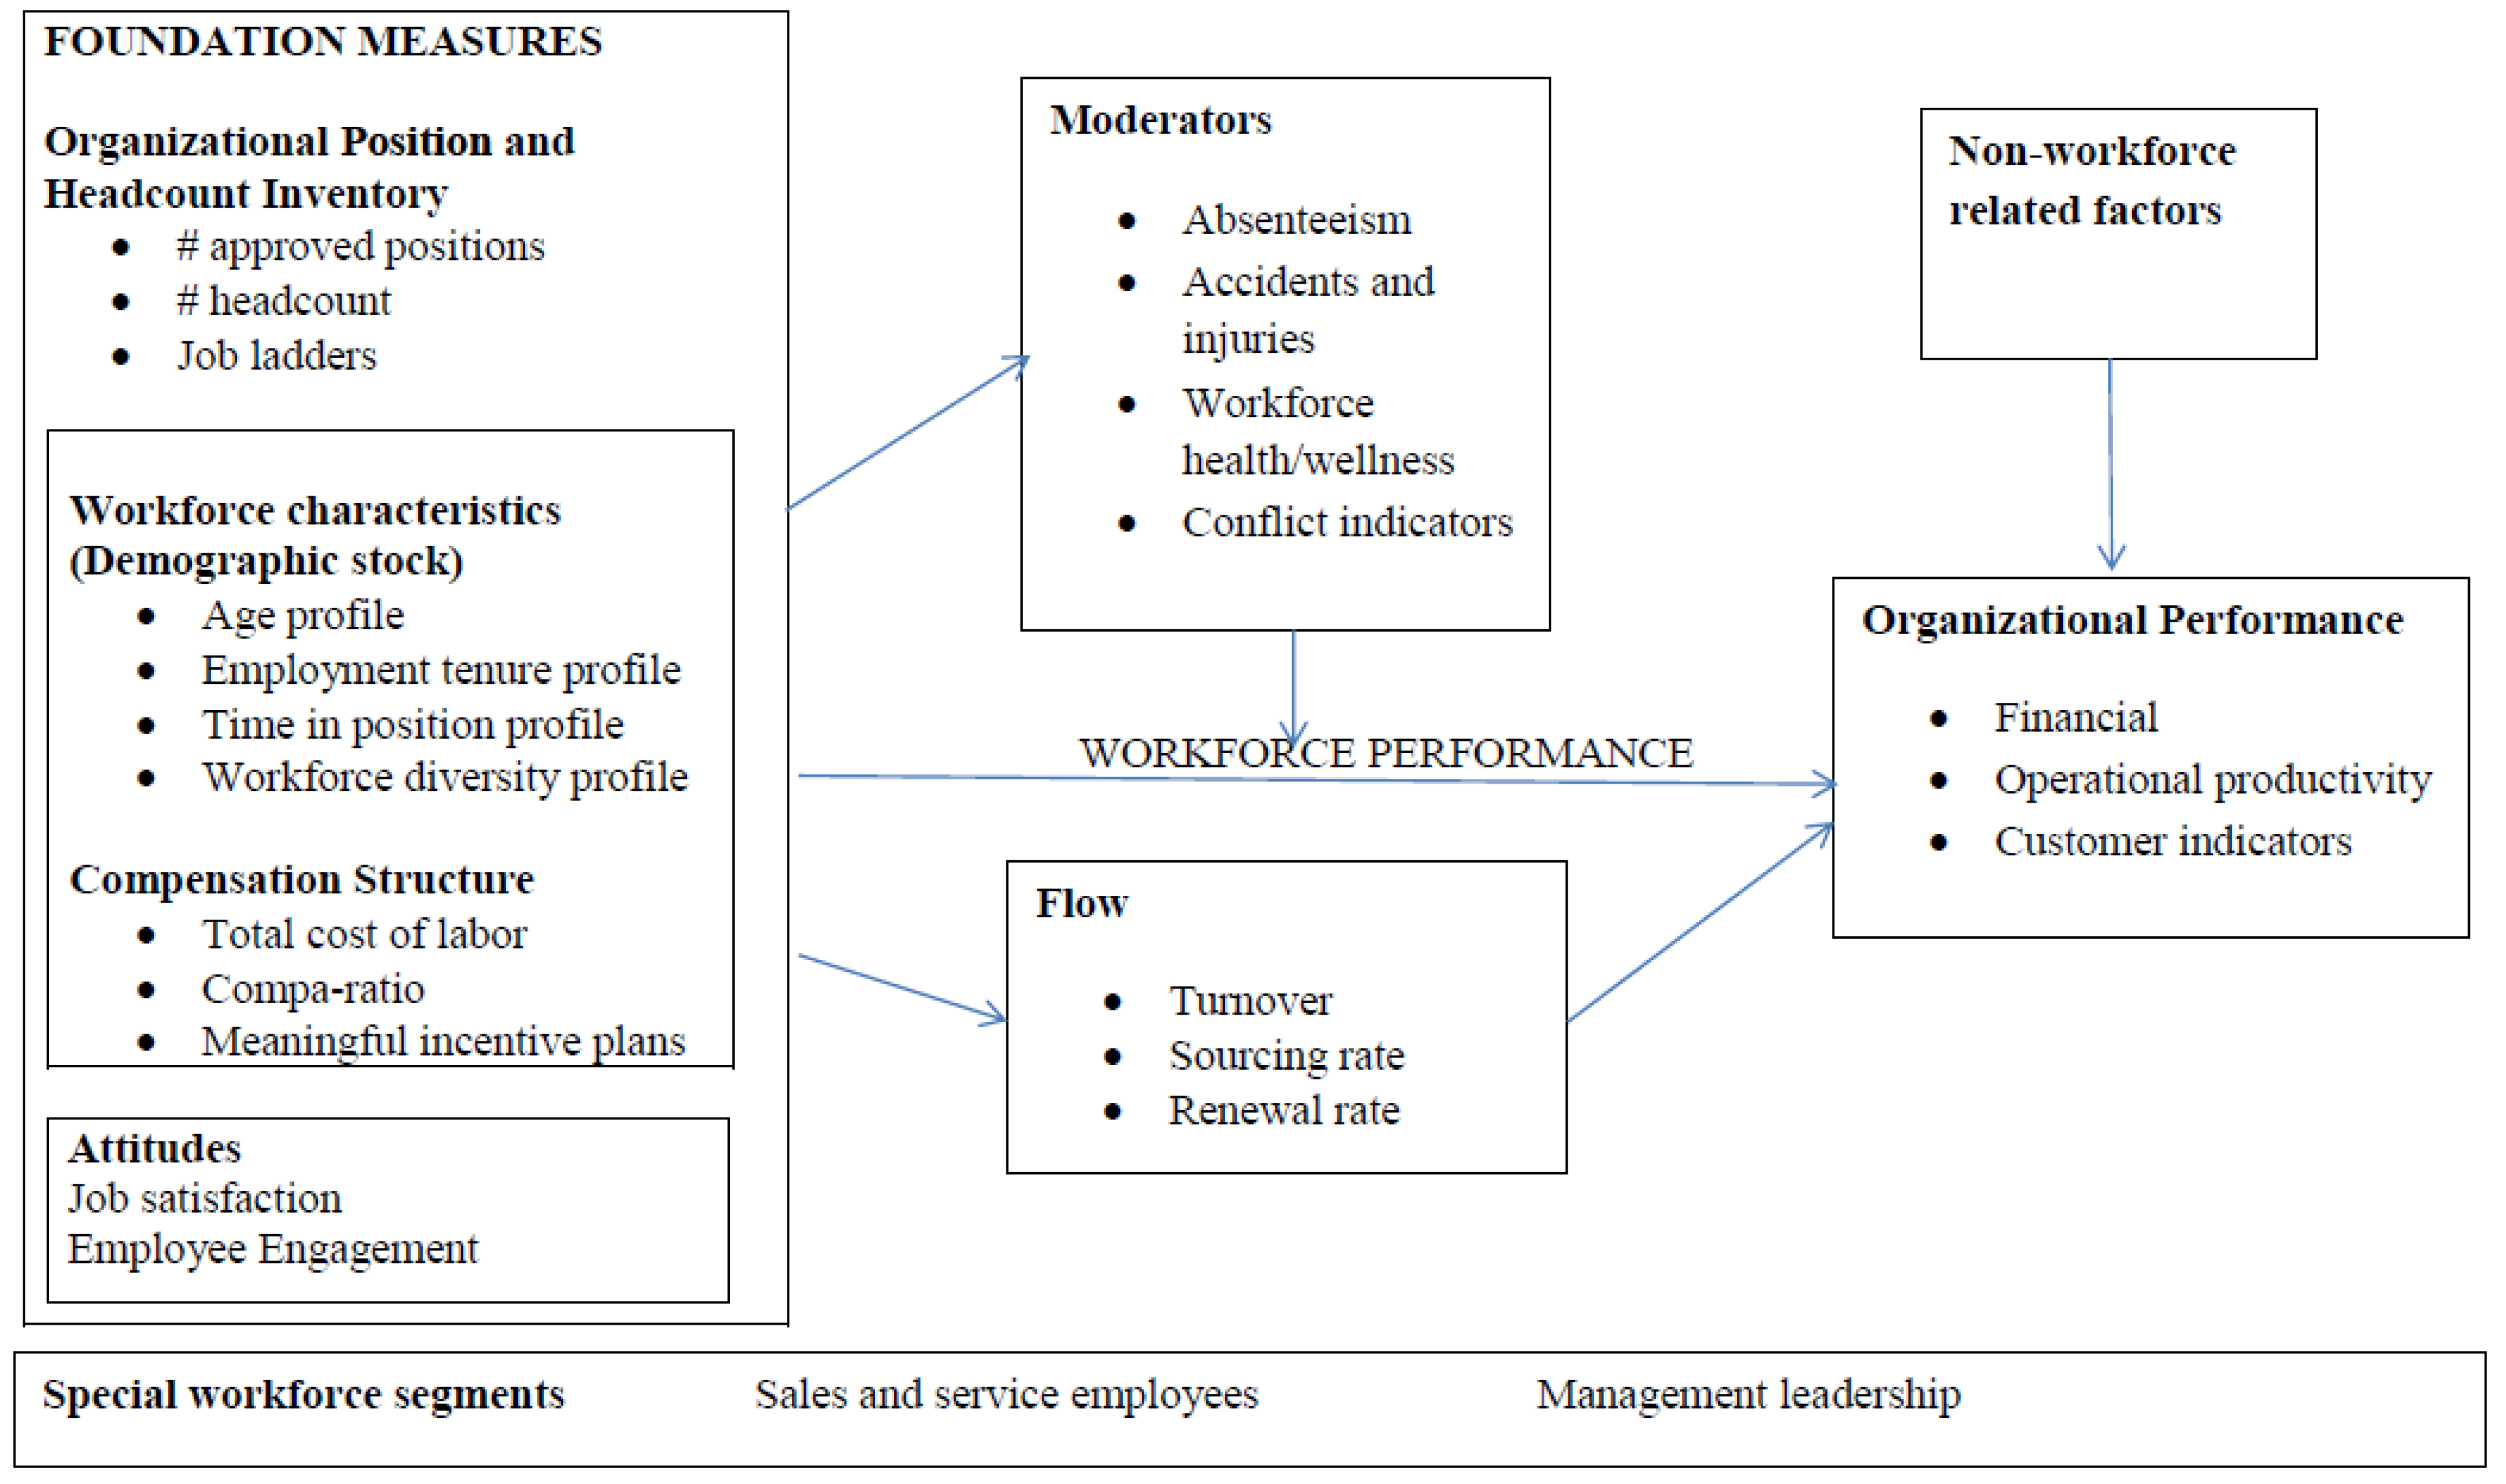
The framework presented here (Figure 1) for workforce measures attempts to integrate and expand prior work in this field, creating a generic roadmap of the metrics that are fundamental to a management and control system of an organization’s workforce. The model shown begins with a basic inventory of jobs and people in those jobs. In this context, important demographic characteristics of the workforce (its stock) can be monitored, along with the compensation structure of that workforce. The other critical aspect of the workforce involves employee attitudes and beliefs about working at the organization. These qualities and characteristics will have a direct effect on important organizational performance criteria. The flow of people into and from the organization is influenced by these various workforce characteristics, and flow by itself will also directly affect performance outcomes [8,24]. There are several other workforce factors that will moderate (by amplifying or detracting from) the effectiveness of workforce performance. Organizational performance is the ultimate outcome variable of interest, and the performance of the workforce is one of a variety of other factors that shape that performance. Finally, two distinctive subsets of workforce positions—sales and service employees, and management—may require their own distinctive measurement framework due to their critical importance.
The balance of this paper will examine this model and its variables in more detail.
4. Foundation Workforce Metrics
Four main classes of foundation measures of an organization’s workforce form the basis for any basic HR measurement system. The first involves measures of the organization’s structure of jobs and people; this is the Organization Position and Headcount Inventory. Second, there are the demographic characteristics of the workforce, and third, its compensation structure. Fourth, there are relevant attitudes of the workforce.
4.1. Organization Position and Headcount Inventory
Organizational structure identifies jobs and how they are grouped together horizontally (into divisions, departments, workgroups, and so on) and arranged vertically (as reporting relationships). In effect, the organizational structure is the skeletal framework of an organization. The basic building blocks of organizational structure are jobs (or formally defined positions or roles) [25]. The structure of jobs can be counted regardless of whether or not a position is currently filled. Given this focus, there are two primary measures of organizational staffing structure—(1) the number of approved positions in the organization in total and (2) the number of people working in the organization (headcount). Headcount would simply be the number of people on the payroll during a given reporting period. With this basic accounting of positions and people, several additional useful metrics of organizational structure can also be applied, such as the number of part-time or contingent positions.
Two other properties of organizational structures can also be assessed. First, span of control indicates the number of direct reports to each manager or supervisor [26]. Both very low levels (1 or 2 direct reports) and very high levels (30 or more, say) could indicate potential higher cost or lower performance issues. The second, job ladders or development paths, is connected to an organization’s internal labor market. This is the pool of existing employees who could be used to fill open positions; in effect, the internal labor pool of employees can compete with non-employees for job openings [27]. Typically, job ladders mean that sets of jobs are grouped into families that share and build upon core knowledge and skills, duties, or customers. These jobs are in a sequence of progressively higher levels of background, duties, and skills, so that the next higher job depends and builds on the experience and talents developed in the previous lower job. There can be multiple ladders in an organization. White [28] used the term vacancy chains to describe structured connections between jobs so that when an upper-level position opens up (creates a vacancy), it will draw up a replacement from among employees at lower-levels. There are definite recruiting and selection advantages to filling jobs with current employees, and so, organizations may use career development programs in that regard [29,30].
Knowing about the existence and nature of job ladders for the internal labor market is thus a valuable insight into an organization’s structure of jobs. Job ladders can be described using the following metrics. First, what are the number of ladders in the organization and their location(s)? Second, what is ladder structure (such as its height orthe number of jobs in a ladder; its spanor the number of feeder jobs channeling people into a ladder, and its breadth orthe number of functional areas covered)? Third, what are ladder dynamics or the usual amount of time it takes to ascend a ladder (its velocity) and the average amount of time people spend in a given position (tenure)?
In general, these various metrics are based on the characteristics of the structure of jobs in the organization. Since organizational structure implies some degree of steadiness and continuity, its measures should also be reasonably stable. That being said, stability is not an inherent feature of organizational structure. In its halcyon days in the 1990’s, the U.S. corporation ENRON was known for its free-wheeling, high-flying culture. In this climate, organizational and departmental structures changed frequently, sometimes daily. In response, the HR department required new charts to be time-stamped [31].
4.2. Workforce Characteristics
Beyond the metrics of organizational structure, there are certain measures that provide aggregated data, based on the essential features and conditions of the workforce. Unlike the people-less measures of structure, these measures focus on the characteristics of the people in the workforce. The intention of all these measures is to describe the characteristics of the workforce as a whole. When these measures are made on a regular basis (say, monthly for turnover or annually for employee attitudes), trends relating to important features of that workforce can be detected, showing whether the workforce is getting better or worse and in what ways. There are three main sets of workforce characteristics of particular importance—(1) measures of demographic stock of the workforce, (2) its compensation structure, and (3) employee attitudes.
4.2.1. Workforce Demographics
Four demographic dimensions of a workforce’s stock are worth tracking.
1. Age. The age profile of a workforce, such as the percentages of employees in various cohort groupings (such as under 20, 20–29, 30–39, etc.), can point to at least one major area of concern for managing a workforce. Specifically, by focusing on the percentage of employees that are age 55, 60, or older, one can get a leading estimate of possible expected losses due to retirement. Such losses could portend substantial losses to the accumulated “job savvy” and expertise of the organization. An illustration here is the projected retirements of a significant portion of the United States federal government’s workforce, making the projected loss of human capital a significant risk to government operations [32].
2. Employee tenure (time employed by the organization). What is the breakdown of the workforce in terms of how long employees have been employed by the organization? Fast-food restaurants might show that 95% of their workforce has been employed for three months or less, in contrast to government agencies, where 95% have been there 20 years or more. Knowing the relative proportions of long-term versus newer employees can say much about the strength of organizational traditions, the capacity of the organization to change, and the absorption or infusion of new ideas, styles, and information into the organization [33].
3. Employee skill or talent. Because of its obvious importance, the competence of the workforce is a critical factor to assess [13,16]. Competence is typically seen as the combination of the appropriate and sufficient amount of knowledge, skills, attitude, and abilities that enable successful job performance. Workforce competence can be measured in various ways. One metric is how long employees have been in their current position. While crude, this could be the easiest measure of workforce skill or talent levels in that, presumably, the longer the time in a position, the greater the skill in doing the job. More focused measures could be the distribution of performance appraisal ratings or the number of employees rated as excellent, good, and so on. However, this metric only becomes useful if there is high confidence in the accuracy of the appraisals; for various reasons, this is often not a good assumption [34]. An even more focused measure would be specific knowledge or skills assessment (see the section about advanced, specialized metrics.).
Over the past 20 years or so, the importance of employee competence has been expressed by an emphasis on human capital. In Becker’s [35] formulation, human capital was treated as the investment made by individuals or organizations in increasing their knowledge and skills by education and training. This understanding has expanded since then to encompass a broad range of intellectual, cognitive, attitudinal, personality, and interpersonal capabilities [36]. This literature now includes a number of specific metrics for registering workforce skill levels as talent and human capital [6,14,15,16,37]. A related concept is knowledge capital. A standard typology [38] uses intellectual capital as the umbrella concept subdivided into two categories—human capital and structural capital. Structural capital is in turn subdivided into customer and organizational capital. There have been a number of consolidating reviews of the large variety of proposed measures for these different forms of capital [39,40].
4. Workforce diversity. A key principle of various ecological, evolutionary, and system theories is that, to be sustainable, the population of a system should have at least as much internal diversity as exists in the environment in which it functions. For example, consider the likely future of an organization whose decision-makers and operating personnel are almost exclusively white males but which operates in an environment of consumers, suppliers, and others that increasingly come from different backgrounds, traditions, ethnicities, outlooks, and gender. In addition, many employers in the United States must produce annual reports about the diversity of their workforces. The Equal Employment Opportunity Report describes the basic features of its workforce; an affirmative action plan compares the diversity of employees in various occupational categories against the demographic diversity of the environment [25]. Indeed, Mehri, Giampetro-Meyer, and Rumels [41] recommended that corporations be required to provide a “diversity report card” alongside other regular financial reports. In short, tracking workforce diversity not only yields valuable insight but may also be required.
4.2.2. Workforce Compensation Structure
All organizations that pay for work to be done (through wages, salaries, incentives or contractual fees, not to mention benefits costs) have an inevitable compensation structure to its workforce. The total cost of the workforce is often the largest component of operating expenses, averaging around 70% of that total [42]. This compensation structure can in turn be analyzed in additional ways to provide important insight into that dimension of a workforce. Three relevant measures are useful in this context.
1. Total cost of labor. What is the total cost of labor in a reporting period? While data on the cost of direct compensation can be taken from payroll records, it is probably more accurate to use the “fully loaded” cost of compensation which includes the costs of benefits provided during that period to the total direct compensation cost.
2. Compa-ratio. A compa-ratio is a measure of the average rate of pay to employees, against the average rate of pay for comparable jobs in the local or relevant labor market [25]. Such comparisons are made somewhat easier if jobs are grouped into grades, and those grades have been priced (defined by a minimum, mid-point, and maximum rate of pay) against local or otherwise relevant labor market pay rates. By identifying the percentage of employees below, at, or above the average market rate, compa-ratios suggest the extent to which an organization’s workforce is being paid competitively. High percentages of employees paid below market rates for their jobs are warning signals of employee dissatisfaction and potential turnover.
3. Number of employees covered by meaningful incentive plans. Meaningful incentive plans can be significant levers or motivators of performance. Incentive plans can be keyed to individuals (e.g., piecework), to groups (e.g., branch sales), or to all employees in the organization (e.g., profit-sharing). Meaningful incentive plans offer the possibility of real and noticeable gains in compensation. The paltry and barely noticeable differences offered through traditional merit pay plans should probably not be included in this calculation.
4.2.3. Employee Attitudes
Measures of employee attitudes suggest the morale of the workforce. These attitudes both moderate and predict other important workforce metrics, particularly turnover and organizational performance outcomes. In their study of the relationship between “organizational control” practices and employee trust in their employer, Weibel et al. [43], for example, measured two kinds of employee attitudes—“goodwill trust” (about perceived employer concern for its employees and commitment to ethical values) and organizational reputation (such as the extent to which employees are proud to work for their employer and its reputation among customers and suppliers). While a number of different kinds of attitude constructs have been studied [44], job satisfaction and employee engagement seem to be particularly relevant and important to assess.
1. Job satisfaction. Job satisfaction refers to “simply how people feel about their jobs and different aspects of their jobs” [45] (p. 2). Typically, it is broken down into attitudes about the boss, coworkers, working conditions, pay, and the nature of the job itself. There are a number of instruments for measuring job satisfaction reported in the literature, of which the Job Description Index seems to be the most popular [46]. Undoubtedly, there are a number of other instruments available from commercial vendors and consultants, often under the heading of “employee opinion surveys”.
Understanding the job satisfaction levels of a workforce is important because low levels of job satisfaction have been associated with a greater likelihood of employees looking for employment elsewhere. That is, low job satisfaction is linked to higher turnover. The relationship of job satisfaction to productivity is a bit more complicated. Currently, the relationship between the two is generally found to be a moderate one. That is, organizational performance is influenced by a number of factors, of which job satisfaction is only one. For example, the productivity output rate of an assembly line is determined more by the speed of the line than worker satisfaction levels. In jobs that involve employee discretion though (for example, many customer service and professional jobs), job satisfaction is likely to be more of a factor.
Organizational Commitment (OC) is less well-known as a measure of employee attitudes. In its classic formulation, organizational commitment presumably reflects three dimensions—a strong belief in and acceptance of organizational goals and values; a willingness to exert extraordinary effort for those goals; and a strong desire to remain a member of the organization [47,48]; see Mowday [49] for a review of the organizational commitment construct. At Deutsche Bank, their measure of employee commitment was the centerpiece of their workforce metric [20]. In their meta-analysis, Harrison, Newman, and Roth [50] found that job satisfaction and organizational commitment could be combined and integrated into an “overall job attitude.” This overall attitude significantly influenced individual performance and effectiveness in several ways—it was associated with better task performance but not as much with lateness, absenteeism, and turnover.
2. Employee engagement. Since the 1990’s [51], the construct of employee engagement has emerged as a new and popular type of measure of employee attitudes. Its popularity has been driven largely by consultants championing the approach, and the term was slow to gain traction among scholars in the field. As a result, the construct has suffered from a lack of conceptual precision. Consequently, different instruments for measuring engagement may be psychometrically sound without necessarily measuring the same phenomenon space. These varying approaches to defining and understanding engagement have been documented by both Macey and Schneider [52] and Shuck, Reio, and Rocco [53].
In many ways, the relationship between measures of job satisfaction and employee engagement is reminiscent of Herzberg’s two-factor theory of motivation, whereby job satisfaction is distinct from work motivation. Macey and Schneider [52] concluded that engagement can become a viable construct reflecting employee “positive affectivity with the job and the work setting that implies or explicitly indicates feelings of persistence, vigor, energy, dedication, absorption, enthusiasm, alertness, and pride” (p. 24). Including elements of commitment, job involvement, and some elements of job satisfaction, this construct of employee engagement suggests a very desirable attitudinal state of high levels of motivation. Sysco successfully developed and used a measure of work climate satisfaction and engagement (reported in Cascio and Boudreau [54]).
In summary, measuring employee attitudes is valuable because attitudes can be leading indicators of future workforce behaviors, including turnover, absenteeism, organizational citizenship behaviors, and performance [50]. Recent scholarship in the field of employee attitudes has raised an important point—while measuring attitudes is a good thing to do, being clear about what the attitudinal constructs actually define is another thing. Dalal et al. [44], for example, found negative affectivity [55] to be a more powerful attitudinal variable than either job satisfaction or employee engagement. For the practitioner now, the best conclusion seems to be that measuring both job satisfaction and employee engagement with the best available instruments for each is a good thing to do. This is because both seem to offer incremental understanding of important attitudinal states, such as leading indicators of other workforce factors. Interestingly, incorporating measures of negative affectivity may be even more useful.
4.3. Workforce Flow
Measures of workforce flow track the loss and gain of personnel over some period of time [13], the central measure of workforce loss being turnover. Gains to the workforce can be seen in the form of rates of replacement from external and internal sources [8]. Each will be reviewed in turn.
1. Turnover. The underlying measure of turnover divides the number of people who left the organization by the average number of people on the payroll during a given period of time (e.g., a month). Turnover is a leading indicator of organizational performance, making it very important to track [56]. This basic metric has several issues and implications that need to be addressed.
- Focus—all or voluntary turnover? People may separate from their employment for either involuntary reasons (like being fired or because of downsizing), or for voluntary reasons (such as retirement, going back to school, or because they found a better job). While knowing the overall turnover rate for the workforce as a whole is important, it may be more important to identify the rate of voluntary turnover, because presumably, the organization could moderate voluntary turnover to some extent.
- Reasons for leaving. Closely related to the issue of locating the sources of turnover is the issue of understanding the reasons why employees decided to leave. Exit interviews should be a standard procedure for soliciting information from departing employees about their reasons for leaving. By compiling reasons, the HR function can take appropriate action to ameliorate those factors over which it or the organization may have some control.
- Turnover accountability. There are two main areas over which an organization has the ability to moderate conditions that could be causing voluntary turnover—human resource policies and practices (dealing with such items as compensation and benefits, working conditions, and so on), and supervision quality. To be able to focus on the latter area, turnover rates need to be linked or matched to supervisors and managers. Clearly, high levels of turnover by certain managers or supervisors would indicate the need for corrective intervention focusing on them.
- Functional or dysfunctional. Turnover is not inherently all bad because the people who leave may actually be ineffective or poor performers, providing the organization an opportunity to replace them with higher quality employees. If this were to be the case, turnover would actually be considered functional. Turnover would be dysfunctional if quality employees leave and were replaced by less capable performers. Thus, one additional characterization of turnover is in terms of its functional or dysfunctional dimensions. Deutsche Bank surveyed both recent hires as well as employees who were leaving to assess this dynamic [20].
2. Sourcing rate. Job openings can be filled in two main ways—either by hiring a new employee from the external labor market (the hire rate), or by transferring or promoting an existing employee from internal sources (promotion rate). The external sourcing rate measures the total number of new hires that come in from the external labor market during the reporting period. Pinfield and Morishma [8] recommend using employee headcount (either at the start or the end of the reporting period, respectively) as the denominator. The alternative proposed here is a more limited denominator—the total number of openings during the period. By allowing a third category of “not filled,” the result will show the relative proportions of external hires, internal “hires”, and unfilled positions, providing a more finely tuned understanding of the inflow rates and sources. This measure reflects the amount of “new blood” entering the organization. The reciprocal metric is the ‘internal’ sourcing rate or the percentage of open positions filled from the organization’s internal labor market.
3. Workforce renewal rate. The total number of new external hires and internal moves, divided by the average headcount during the same period, provides a measure of the percentage of employees in the workforce who have experienced a change in their job status (new hire, promotion, or lateral move).
4.4. Behaviors Moderating Workforce Performance
There are certain metrics that reveal systemic sources of drag on or support of a workforce’s performance. Since these sources can be controlled to some extent by HR policies and programs [57,58], there should be separate measures of each.
(a) Absenteeism. Employees may not come to work without prior notice or approval for various reasons. People may miss half a day, a full day, or more; they may tend to be out on Mondays or Fridays, or other days during the week. Regardless, absenteeism occurs when employees do not report to work as expected, and as a result, there are fewer labor hours available. In turn, all else being equal, fewer widgets are going to be made, or the employees who are there will have to work longer and harder to make the same amount of widgets. Either way, productivity will likely decline because of less output or more costly input, in order to maintain the same level of production.
The general formula for the absenteeism rate is the number of employees who do not report to work during a period, divided by the average number of employees on the payroll per month. However, this is a rather crude measure, because it treats the employee who misses one hour with the employee who misses one week. A better measure is the percent of expected labor hours missed on an unplanned or unscheduled basis of the total planned labor hours (e.g., Company A has 100 employees working a 40-h work week, which equals a total to 4000 planned labor hours). A more precise formula involves calculating the total hours missed during the reporting period divided by the total expected hours for the same period (e.g., five Company A employees lost 40 h in total during a week, therefore its absenteeism rate is 1%.)
(b) Accidents and injuries. Tracking work-based accidentsand illnesses, and their lost time effects, is particularly important to monitor in workplaces where risks of either or both are high. Work-related injuries and illnesses reduce organizational performance while increasing costs. The Occupational Safety and Health Administration in the United States requires employers to report “work-related injuries and illnesses that result in days away from work, restricted work or transfer to another job, loss of consciousness or medical treatment beyond first aid” as well as professionally diagnosed work-related injuries or illnesses, even if there is no lost time or medical care beyond first aid [59]. Identifying and then eliminating the causes of these problems becomes an important risk management and revenue enhancement process that depends upon accurate measurement of these events.
(c). Workforce health or wellness. Employees who are sick or debilitated, apart from any job-related injury, often do not come to work. This leads to increased costs due to lost productivity or the use of medical services; if medical insurance is involved, the premium costs may also rise. Regardless, as costs increase, productivity declines. An unhealthy workforce, thus, is not only less than fully productive but is also more costly than a healthy workforce. An analogy here is useful. During the 1980’s, one American quality thought leader claimed that quality is free [60]; its only when there are quality problems, he argued, that incremental costs over and above the expected costs of production go up. That same logic could be applied here—a healthy workforce is free; it is only when it is not healthy that the organization assumes more incremental costs of loss and recovery). An estimate by Stewart et al. [61] found productivity losses due to wellness problems alone averaged more than US$1500 per employee annually.
Thus, a critical dimension of a workforce is to consider its overall health or wellness. In many ways, the health of a workforce is a leading indicator of performance and productivity, and a contributing cause to marginally significant costs of various benefits (in particular, sick leave, health insurance, and possibly life insurance [62]. Work by Goetzel, Pickens, and Kowlessar [63] produced a Workplace Wellness Index (WWI), based on eight risk factors—body mass index, blood pressure, cholesterol, blood glucose levels, tobacco use, alcohol consumption, stress, and amount of exercise. After collecting this information from employees, a workforce is rated in the aggregate in terms of its degree of wellness on a scale from 1–100, with a higher the score representing a healthier workforce.
(d) Conflict indicators. Conflict between people, groups, levels, functions, and more is an ever-present possibility in every organization. To the extent that conflict occurs, there are certain typical outcomes—reduced cooperation between parties, imputing negative motives to others, stereotyping, heightened polarization, and time lost in sustaining and dealing with the conflict (as opposed to productive work) [64,65]. Thus, it is useful to understand the extent to which active or joined conflict is present in the workforce. While conflict metrics appear to lack the consistency of other important workforce characteristics, the following metrics might be useful.
- Number of employees on formal disciplinary status. A common practice is for organizations to have some kind of progressive disciplinary process, which usually means that at some point, employees with persistent, uncorrected problems are put on a formal or written warning. HR should be aware of these formal actions, which can be counted to reveal the number of such conditions, during any reporting period.
- Number of grievances. By contrast, grievances represent worker complaints about their treatment, management practices, or other workers, and do not include management complaints about workers. Non-unionized organizations may have grievance systems, but even if not, they might still have employee voice options (like hotlines, particularly as might be used for dealing with ethical issues) through which employees can raise issues. Unionized operations most certainly will have grievance proceedings that could include other processing procedures like mediation and arbitration. The nature and extent of active complaints and grievances can be measured.
4.5. Organizational Performance
People are employed to get work done, be it for a private enterprise, a non-profit agency, or a government institution. Thus, the ultimate rationale of a workforce is to contribute to organizational performance. Yet, organizational performance results from the influence of any number of factors, such as technology used, costs of materials, marketing practices, product features, and so on, not to mention workforce quality and effort. In turn, workforce quality depends heavily on the quality of HRM policies and practices. Over the last generation or so, a substantial literature has emerged focused on the relationship between HRM policies and practices and workforce quality, variously considered under the guise of “high performance work systems” and “strategic human resource management” [13,15,16,66,67,68,69,70,71,72,73]. These models posit that certain well-defined HRM practices in compensation, staffing, training, job design, and so on, function both individually and in a synergistic manner to create a top quality workforce. The measurement framework here compliments this basic approach by registering the status and conditions of the workforce factors, which would be most responsive to HRM policies and practices. In effect, organizational performance is the result against which HR efforts can be both directed and assessed.
Three issues relating to the use of organizational performance as the outcome variable for analysis need to be addressed. First, performance can be defined operationally and measured in different ways, in a large part based on the organization’s mission or strategy. Several obvious versions of “performance” would include financial measures (revenue or profit, e.g.), customer metrics or service transactions ratings, or production output. Other, more customized or specialized metrics are also possible. Further, indicators could be measured in terms of monetary units (like dollars), by numerical counts of units created, delivered or served, by quality judgments, or waste or error rates (such as immediate results as scrap, rework or rejected pieces, or delayed effects of returns, warranty claims and repairs; service errors would show up as lost or non-repeat customers, or poor customer satisfaction ratings). Greenberg [74] has a classic primer on the intricacies of productivity measurement [75].
Second, organizational performance is the result of a multitude of factors, labor being but one of four classes of inputs that impact both cost and process of performance. The other three are physical and financial capital assets, raw materials, and energy. While the contribution or cost of each can be summed together as part of a total productivity calculation, a partial measure using only labor input cost would be the more relevant measure in the HRM context. Such a metric would isolate the workforce effect from other influences on performance.
Third, workforce productivity is essentially a simple measure dividing some measure of an organization’s output (in dollars, units, or ratings of some kind) against some measure of input. Labor input can be identified in at least three ways—by a count of units created, by the amount of labor time required, or labor cost. Depending on the specific metric selected, one can identify the number of widgets produced (in a reporting period) for one hour of labor, or how much it costs to produce each US$1 of revenue. Other variations are possible. For example, Bryan [76] recommended tracking profit per employee. By monitoring this figure over time, trends as to whether the workforce is becoming more or less productive are shown.
One other issue to consider in this context is the level of aggregation that should be used; specifically, should the cost of the workforce in total be used or just a segment? In the case of a manufacturing plant, for example, should all employees (from production workers to bookkeepers, security staff, and office help) be counted or only those directly involved in production?
5. Specialized Measures
The measurement framework just outlined is for an organization’s total workforce. However, there are two subsets of the workforce that may deserve dedicated measurement, given their potential outsized importance to overall organizational performance. These include sales and service or customer-facing employees, and management leadership staff. While the measurement framework outlined above would still apply, metrics specially developed for these segments can help focus attention on the critical aspects of these segments.
Sales and service or customer-facing employees. Organizations that are particularly dependent on regular sales or service operations may be dependent on their customer-facing, sales, and service employees (SSEs) to a great extent. The positions in the organization having significant sales or service duties in dealing with external customers could be flagged, creating a sub-list of all positions in the organization that spend, say, 30%, 40%, 50%, or more of their time in direct customer contact. In these cases, understanding critical aspects of that workforce segment becomes a vital workforce metric. However, what aspects should be monitored and measured? From the literature in this field [77,78,79,80], two distinct measurement foci can be recommended—the performance capability of the SSE workforce and the SSE workforce productivity.
5.1. SSE Workforce Performance Capability
SSE workforce capability refers to its capacity to perform its sales and service duties at a high level. Capability depends on three main factors—SSE experience-levels, SSE attitudes, and SSE knowledge.
1. Experience is a composite measure of the average tenure levels of personnel in SSE positions (shown as a distribution). Essentially, experience levels are measures of SSE retention and a crude measure of skills.
2. Knowledge. To be most effective, SSE’s need sufficient knowledge and skill about a variety of matters. Obviously, they need strong knowledge of their firm’s products or services. In addition, they may need to know about the competitive positioning of those products. Do they have appropriate knowledge of the firm’s customers or of the firm’s competitors? Do they know how to complete various sales and service routines? To what extent do they understand the firm’s business strategy and objectives?
3. Attitudes. There are various attitudes that SSE’s may have about their work that could influence on their performance. For example, if they know what the strategy is, do they accept and support it? Such a measure indicates the extent to which individuals have integrated organizational goals into their work motivations; such a metric has a long pedigree [13,16]. Huselid, Becker, and Beatty [15] refer to this as the extent to which organizational members have a “shared mind-set.” In addition, what are their attitudes about the organization’s products and services? What kinds of attitudes do they have about customer segments? What are their attitudes about sales and service as work responsibilities? One other important attitude to consider is their assessment of the top management’s commitment to providing superior customer value.
The point here is that it may be very important to periodically survey the SSE workforce on various aspects of their attitudes, knowledge, and beliefs about their work. Periodically retesting existing employees on critical aspects of their job performance is not without precedence. For example, in the United States, pilots must periodically undergo “flight reviews” to certify their continued piloting proficiency [81]. The results of these assessments can be useful for training needs assessment purposes. Further, this information could be indicative of the organization’s culture, with regards to sales and service.
5.2. SSE Workforce Productivity
The productivity of the SSE workforce involves a specialized set of metrics, specifically focusing on sales or service transactions. Examples include sales volume per labor costs for a reporting period, or in terms of externally-based metrics, such as assessments of customer satisfaction or mystery shopper scores. It is likely that the measures of performance would need to be custom-designed.
Management leadership positions. Leadership roles would be all positions from team leaders, supervisors, or line forepersons upwards who have responsibility and authority for managing others. The people in these leadership roles play a very important role in influencing organizational performance for better or worse, depending on their quality and skill in executing their role. For Hall [82], the acid test of an organization’s leadership cadre is whether the annual quality of performance is getting better or not. Therefore, monitoring certain characteristics of this segment of the workforce is distinctly important and warrants its own measurement framework. A report by the Society for Human Resource Management in the United States [83] noted two dimensions of leadership that can and should be measured and reported. (1. Leadership depth refers to the extent to which the organization has the capability in terms of “bench strength” to replace any existing manager for either planned or unplanned reasons. This metric involves identifying the percentage of leadership positions that have at least one or more qualified and available successors in place now. Such information should come directly from an organization’s management succession planning process. As Friedman [84] found in his study of 235 firms, succession systems contribute to improved organizational reputation and financial performance, especially when the process is taken seriously and supported by involvement of the Chief Executive Officer in terms of active participation, time devoted, and organizational resources committed.
2. Leadership quality involves the extent to which the organization’s population of managers and leaders are skilled and effective. The SHRM/ANSI report recommended using special employee survey assessments of leader effectiveness, composed of items that have been correlated with important business or organizational outcomes.
6. General Issues in Workforce Measurements
Given this measurement framework, three important issues in workforce measurement need attention. First, how frequently should the measures be taken? Some measures, such as workforce experience levels, turnover, or organizational performance can be gathered regularly from available records and would not require intrusive surveys or testing. Other assessments of job satisfaction, health, or leadership quality that require self-reporting or subjective assessments are intrusive by nature and would caution against frequent collection. The real issue here is the “half-life” of the data; that is, at what point is the existing information no longer reliable? There is no hard and fast rule for answering this question. Instead, the frequency of surveys and testing would no doubt depend on the degree of stress impacting the organization (e.g., threats of takeover or restructuring) or the volatility of the workforce (like high levels of turnover or rapid morale swings). For workforces with high volatility or stress, it is likely that survey results would remain accurate for a shorter period.
For surveys of any kind, a second issue is that of sample size. That is, should all employees be included or just a sample? With in-house network sites, there are no technical reasons why all employees could not be surveyed regularly. Robinson [85] provides a primer on how to design and administer survey instruments for HRM uses. The danger in frequent surveying of all employees, though, is that of introducing a testing threat to the internal validity [86]. For example, knowing that job satisfaction is being assessed, employees could learn to game the system by reporting lower scores in order to seek out more favorable management action. The alternative is to sample only a portion of the workforce. In this way, more frequent reporting of some metrics is possible while mitigating the testing threat.
Third, one important ambition of this entire workforce management process is to provide detailed information not only to HR but to all management personnel to allow them to improve their workforce responsibilities. In turn, this means sharing the data with the lowest administrative or management operating levels as possible. This goal must be balanced against the need for confidentiality in employee responses—if employees fear being identified for their honest responses, they will either avoid providing the information or provide faulty answers, thereby compromising both the data and the exercise. Thus, confidentiality provisions in survey data collection must be clear and enforced.
7. HR Metrics as a Management System
In summary, HR as an agent is advised to establish a workforce management and control system composed of a variety of metrics or indicators of the status of that workforce. When conducted repeatedly, these measures can indicate whether the quality of the workforce is improving, staying the same, or is worsening. The workforce metrics proposed here are summarized in Table 1. Some likely sources of data as well as possible frequency rates for collecting the data are also identified in this table.
8. Conclusions
This paper began with the premise that one cannot manage what one does not measure; in other words, if you want to manage something, you must measure it. This principle applies to the practice of HRM. While measuring the efficiency and effectiveness of HR practices and activities is important, the focus here is on measuring important aspects of the domain that should be the HR’s responsibility—the organization’s workforce. A quality workforce—staffed, skilled, motivated, and productive—is the ultimate deliverable for which HR should play a leading role.
To manage a workforce to these ends, the HR agent must measure that workforce and certain core metrics recommended here. These metrics include measures of the following categories—organization position and headcount inventory, workforce stock in terms of demographic characteristics, compensation structure, and employee attitudes, flow of personnel into and out of the organization, moderating variables, and organizational performance. The implication is that HR professionals cannot adequately fulfill their basic management charge—delivering a quality workforce—without these core measures being in place; if they do not exist, the HR professional should design and implement a management control system for providing necessary information on a regular basis. Such a management control system would not conflict with—indeed, it could fit in and support—a balanced scorecard framework. By reporting key measures of workforce characteristics on a regular basis, HR management becomes a critical element in executive strategic discussions.
Finally, there are several theoretical and research issues posed by the framework presented here. First, while the component measurement factors of the workforce have a long history of use in industrial psychology [26] and HRM research, the model shown in Figure 1 can be tested further and refined. Second, while the importance of employee attitudes in general is well-established, creating a single integrated instrument for measuring all applicable attitudes awaits development. In the same way, identifying a usable template for measuring various forms of conflict would also be helpful. Third, in some cases, knowing the typical “half-life” of collected data would be helpful to know; such information would help determine optimal frequencies for—and minimize redundant—data collection. Finally, a comprehensive theory of organizational performance measures would help in identifying what associations there might be between financial, customer, and production metrics, and whether some input variables affect one more than another.
Funding
This study received no external funding.
Institutional Review Board Statement
Not applicable.
Informed Consent Statement
Not applicable.
Data Availability Statement
Not applicable.
Conflicts of Interest
The author declares no conflict of interest.
References
- Cascio, W.F.; Boudreau, J.W. Investing in People, Financial Impact of Human Resource Initiatives; Pearson Education: Upper Saddle River, NJ, USA, 2008. [Google Scholar]
- Flamholtz, E. Organizational control systems as a managemerial tool. Calif. Manag. Rev. 1979, 22, 50–59. [Google Scholar] [CrossRef]
- Jensen, M.C. Fourndations of Organizational Behavior; Harvard University Press: Cambridge, MA, USA, 1998. [Google Scholar]
- Devanna, M.A.; Frombrun, C.; Tichy, H. Human resource management: A strategic perspective. Organ. Dyn. 1981, 9, 51–67. [Google Scholar] [CrossRef]
- Hansson, R.O.; Smith, N.D.; Mancinelli, P.S. Monitoring the HR job function. HR Magazine, February 1990; 76–78. [Google Scholar]
- McGregor, E.B., Jr. Strategic Management of Human Knowledge, Skills and Abilities; Jossey Bass: San Francisco, CA, USA, 1991. [Google Scholar]
- Odiorne, G. The Strategic Management of Human Resources; Jossey Bass: San Francisco, CA, USA, 1984. [Google Scholar]
- Pinfield, L.T.; Morishima, M. Taking the measure of human resource flows. Public Pers. Manag. 1991, 20, 299–318. [Google Scholar] [CrossRef]
- Wright, P.M.; McMahon, G.C. Theoretical perspectives for strategic human resource management. J. Manag. 1992, 18, 295–320. [Google Scholar] [CrossRef]
- Evans, P. Strategic outcomes of HRM. Hum. Resour. Manag. 1986, 25, 149–167. [Google Scholar] [CrossRef]
- Guest, D.E. Human resource management and industrial relations. J. Manag. Stud. 1987, 24, 503–521. [Google Scholar] [CrossRef]
- Wallace, M.; Crandall, N.F. Winning in the age of execution: Workforce effectiveness. Am. Compens. Assoc. J. 1992, 1, 30–47. [Google Scholar]
- Beer, M.; Spector, B.; Lawrence, P.; Mills, D.Q.; Wlaton, R.E. Managing Human Assets; Free Press: New York, NY, USA, 1984. [Google Scholar]
- Becker, B.E.; Huselid, M.A.; Ulrich, D. The HR Scorecard, Linking People, Strategy and Performance; Harvard Business School Press: Boston, MA, USA, 2001. [Google Scholar]
- Huselid, M.A.; Becker, B.E.; Beatty, R.W. The Workforce Scorecard, Managing Human Capital to Execute Strategy; Harvard Business School Press: Boston, MA, USA, 2005. [Google Scholar]
- Boudreau, J.W.; Ramstad, P.M. Talentship and the new paradigm for human resource management: From professional practices to strategic talent decision science. Hum. Resour. Plan. 2005, 28, 17–26. [Google Scholar]
- Kaplan, R.S.; Norton, D.P. The Strategy-Focused Organization; Harvard Business School Press: Boston, MA, USA, 2001. [Google Scholar]
- Dumitrana, M.; Radu, G.; Glăvan, M.E.; Jinga, G. Effective and Efficient Tools in Human Resources Management Control. Pet. Gas. Univ. Ploiesti Bull. 2011, 63, 59–66. [Google Scholar]
- Schay, B.W.; Beach, M.E.; Caldwell, J.A.; LaPolice, C. Using standardized outcome measures in the federal government. Hum. Resour. Manag. 2002, 41, 355–369. [Google Scholar] [CrossRef]
- Fischer, H.; Mittorp, K.D. How HR measures support risk management: The Deutsche Bank example. Hum. Resour. Manag. 2002, 41, 477–490. [Google Scholar] [CrossRef]
- Ittner, C.D.; Larcker, D.F. Coming up short on non-financial measurement. Harv. Bus. Rev. 2003, 81, 88–95. [Google Scholar]
- Kaplan, R.S.; Norton, D.P. Alignment, Using the Balanced Scorecard to Create Corporate Strength; Harvard Business School Press: Boston, MA, USA, 2006. [Google Scholar]
- Lingle, J.H.; Schiemann, W.A. From balanced scorecard to strategic guages: Is measurement worth it? Manag. Rev. 1996, 85, 56–61. [Google Scholar]
- Ployhart, R.E.; Weekley, J.A.; Ramsey, J. The consequences of human resource stocksand flows: A longitudinal examination of unit service orietation and unit effectiveness. Acad. Manag. J. 2009, 52, 996–1015. [Google Scholar] [CrossRef]
- Noe, R.A.; Hollenbeck, J.R.; Gerhart, B.; WRight, P.M. Human Resource Management, Gaining a Competitive Edge, 8th ed.; McGraw-Hill: New York, NY, USA, 2013. [Google Scholar]
- Landy, F.J.; Conte, J.M. Work in the 21st Century, 5th ed.; Wiley: New York, NY, USA, 2016. [Google Scholar]
- Osterman, P.S. Internal labor markets: Theory and change. In Labor Economnics and Industrial Relations, Markets and Institutions; Kerr, C., Staudohar, P.D., Eds.; Harvard University Press: Cambridge, MA, USA, 1994; pp. 303–339. [Google Scholar]
- White, H.C. Chains of Opportunity, System Models of Mobility in Organizations; Harvard University Press: Cambridge, MA, USA, 1970. [Google Scholar]
- Baruch, Y.; Peiperl, M. Career management practices: An empirical survey and implications. Hum. Resour. Manag. 2000, 39, 347–366. [Google Scholar] [CrossRef]
- Hall, D.T. Career Development in Organizations; Jossey Bass: San Francisco, CA, USA, 1986. [Google Scholar]
- McLean, B.; Elkind, P. The Smartest Guys in the Room; Portfolio: New York, NY, USA, 2003. [Google Scholar]
- High Risk List; Government Accountability Office: Washington, DC, USA, 2013. Available online: http://gao.gov/highrisk/overview (accessed on 7 August 2013).
- Walsh, J.P.; Ungson, G.R. Organizational memory. Acad. Manag. Rev. 1991, 16, 57–91. [Google Scholar] [CrossRef]
- Murphy, K.R.; Cleveland, J.N. Performance Appraisal, an Organizational Perspective; Allyn and Bacon: Boston, MA, USA, 1991. [Google Scholar]
- Becker, G.S. Human Capital; Columbia University Press: New York, NY, USA, 1975. [Google Scholar]
- Bresnahan, T.F.; Brynjolfsson, E.; Hitt, L.M. Technology, organization, and the demand for skilled labor. In The New Relationship, Human Capital in the American Corporation; Blair, M.M., Kochan, T.A., Eds.; Brookings Institution Press: Washington, DC, USA, 2000; pp. 145–193. [Google Scholar]
- Adams, M.; Oleksak, M. Intangible Capital, Putting Knowledge to Work in the 21st Century Organization; Praeger: Santa Barbara, CA, USA, 2010. [Google Scholar]
- Edvinsson, L.; Malone, M.S. Intellectual Capital: Realizing Your Company’s True Value; Harper Collins: New York, NY, USA, 1997. [Google Scholar]
- Brennan, N.; Connell, B. Intellectual capital: Current issues and policy implications. J. Intellect. Cap. 2000, 1, 206–240. [Google Scholar] [CrossRef]
- Kannan, G.; Aulbur, W.G. Intellectual capital, measurement effectiveness. J. Intellect. Cap. 2004, 5, 389–413. [Google Scholar] [CrossRef]
- Mehri, C.; Giampetro-Meyer, A.; Runnels, M.B. One nation indivisible: The use of diversity report cards to promote transparency, accountability and workplace fairness. Fordham J. Corp. Financ. Law 2002, 9, 5–43. [Google Scholar]
- Higgins, J.; Cooperstein, G.N.D. Managing an Organization’s Biggest Cost: The Workforce; Human Capital Management Institute: Redondo Beach, CA, USA; Available online: www.hcmi.co (accessed on 20 March 2021).
- Weibel, A.; Den Hartog, D.N.; Gillespie, N.; Searle, R.; Six, F.; Skinner, D. How do controls impact employee trust in the employer? Hum. Resour. Manag. 2016, 55, 437–462. [Google Scholar] [CrossRef]
- Dalal, R.S.; Baysinger, M.; Brummel, B.J.; LeBreton, J.M. The relative importance of employee engagement, other job attitudes and trait affect as predictors of job performance. J. Appl. Soc. Psychol. 2012, 42, E295–E325. [Google Scholar] [CrossRef]
- Spector, P. Job Satisfaction, Application, Assessment, Causes and Consequences; Sage Publishers: Thousand Oaks, CA, USA, 1997. [Google Scholar]
- Kinicki, A.J.; McKee-Ryan, F.M.; Schriesheim, C.A.; Carson, K.P. Assessing the construct validity of the Job Description Index: A review and meta-analysis. J. Appl. Psychol. 2002, 87, 14–32. [Google Scholar] [CrossRef] [Green Version]
- Meyer, J.P.; Allen. Commitment in the Workplace; Sage: Thousand Oaks, CA, USA, 1997. [Google Scholar]
- Steers, R.; Porter, L. Employee Commitment to Organizations. In Motivation and Work Behavior, 3rd ed.; Steers, R., Porter, L., Eds.; McGraw Hill: New York, NY, USA, 1983. [Google Scholar]
- Mowday, R.T. Reflections on the study and relevance of organizational commitment. Hum. Resour. Manag. Rev. 1999, 8, 387–401. [Google Scholar] [CrossRef]
- Harrison, D.A.; Newman, D.A.; Roth, P.L. How important are job attitudes? Meta-analytic comparisons of integrative behavioral outcomes and time sequences. Acad. Manag. J. 2006, 49, 305–325. [Google Scholar] [CrossRef] [Green Version]
- Kahn, W.A. Psychological conditions of personal engagement and disengagement at work. Acad. Manag. J. 1990, 33, 692–724. [Google Scholar]
- Macey, W.H.; Schneider, B. The meaning of employee engagement. Ind. Organ. Psychol. 2008, 1, 3–30. [Google Scholar] [CrossRef]
- Shuck, B.; Reio, T.; Rocco, T. Employee engagement: An antecedent and outcome approach to model development. Hum. Resour. Dev. Int. 2011, 14, 427–445. [Google Scholar] [CrossRef] [Green Version]
- Cascio, W.F.; Boudreau, J.W. Short Introduction to Strategic Human Resource Management; Cambridge University Press: Cambridge, UK, 2012. [Google Scholar]
- Watson, D.; Clark, L.A. Negative affectivity: The disposition to experience aversive emotional states. Psychol. Bull. 1984, 96, 465–490. [Google Scholar] [CrossRef] [PubMed]
- Kacmar, K.M.; Andrews, M.C.; van Rooy, D.L.; Steilberg, R.C.; Cerrone, S. Sure, everyone can be replaced … but at what cost? Turnover as a predictor of unit-level performance. Acad. Manag. J. 2006, 49, 133–144. [Google Scholar] [CrossRef]
- Baum, J.F. Effectiveness of an attendance control policy in reducing absenteeism. Pers. Psychol. 1978, 31, 71–81. [Google Scholar] [CrossRef]
- Rhodes, S.R.; Steers, R.M. Managing Employee Absenteeism; Addison-Wesley: Reading, MA, USA, 1990. [Google Scholar]
- OSHA. Record Keeping and Reporting Requirements. 2021. Available online: www.osha.gov/recordkeeping (accessed on 12 May 2021).
- Cosby, P.B. Quality is Free; Mentor Books: New York, NY, USA, 1980. [Google Scholar]
- Steward, W.F.; Ricci, J.A.; Chee, E.; Morganstein, D. Lost productive work time costs from health conditions in the United States: Results from the American Productivity Audit. J. Occup. Environ. Med. 2003, 45, 1234–1246. [Google Scholar] [CrossRef]
- Aldana, S.G. Financial impact of health promotion programs: A comprehensive review of the literature. Am. J. Health Promot. 2001, 15, 296–320. [Google Scholar] [CrossRef]
- Goetzel, R.Z.; Pickens, G.T.; Kowlessar, N.M. The Workplace Wellness Index, a method for valuing US workers’ health. J. Occup. Environ. Med. 2013, 55, 272–279. [Google Scholar] [CrossRef]
- Clardy, A. Managing organizational conflict: Towards a comprehensive framework of outcomes, practices and competencies. Perform. Improv. 2018, 57, 10–25. [Google Scholar] [CrossRef]
- Likert, R.; Likert, J.G. New Ways of Managing Conflict; McGraw Hill: New York, NY, USA, 1976. [Google Scholar]
- Baron, J.N.; Krebs, D.M. Strategic Human Resources, Frameworks for General Managers; Wiley: New York, NY, USA, 1999. [Google Scholar]
- Bowen, D.E.; Ostroff, C. Understanding HRM-firm performance linkages: The role of the ‘strength’ of the HRM system. Acad. Manag. Rev. 2004, 29, 203–221. [Google Scholar]
- Boudreau, J.W.; Ramstad, P.M. Beyond HR, the New Science of Human Capital; Harvard Business School Press: Boston, MA, USA, 2007. [Google Scholar]
- Katz, H.C.; Kochan, T.A.; Weber, M.R. Assessing the effects of industrial relations systems and efforts to improve the quality of working life on organizational effectiveness. Acad. Manag. J. 1985, 28, 509–526. [Google Scholar]
- Koch, M.J.; McGrath, R.G. Improving labor productivity: Human resource management policies do matter. Strateg. Manag. J. 1996, 17, 335–354. [Google Scholar] [CrossRef]
- Lengnick-Hall, C.A.; Lengnick-Hall, M.L. Strategic human resource management: A review of the literature and a proposed typology. Acad. Manag. J. 1988, 13, 454–470. [Google Scholar]
- Paul, A.K.; Anantharaman, R.N. Impact of people management practices on organizational performance: Analysis of a causal model. Int. J. Hum. Resour. Manag. 2003, 14, 1246–1266. [Google Scholar] [CrossRef]
- Pfeffer, J. Competitive Advantage through People; Harvard Business School Press: Boston, MA, USA, 1994. [Google Scholar]
- Greenberg, L. A Practical Guide to Productivity Measurement; Bureau of National Affairs: Washington, DC, USA, 1973. [Google Scholar]
- Tatum, B.D.; Nebeker, D.M. A strategic approach to measuring organizational performance. In Handbook of Organizational Consulting Psychology; Lowman, R.L., Ed.; Jossey Bass: San Francisco, CA, USA, 2002; pp. 692–725. [Google Scholar]
- Bryan, L.L. The new metrics of corporate performance: Profit per employee. McKinsey Q. 2007, 1, 56–65. [Google Scholar]
- Band, W.A. Creating Value for Customers, Designing and Implementing a Total Corporate Strategy; John Wiley & Sons: New York, NY, USA, 1991. [Google Scholar]
- Davidow, W.H.; Uttal, B. Total Customer Service, the Ultimate Weapon; Harper Perennial: New York, NY, USA, 1989. [Google Scholar]
- Heskett, J.L.; Sasser, W.E., Jr.; Hart, C.W.L. Service Breakthroughs, Chaning the Rules of the Game; Free Press: New York, NY, USA, 1990. [Google Scholar]
- Lele, M.M.; Sheth, J.N. The Customer is Key; John Wiley and Sons: New York, NY, USA, 1987. [Google Scholar]
- Federal Aviation Agency. Flight Review Regulations; Federal Aviation Agency: Washington, DC, USA, 2013; Title 14, Chapter 1/D, Part 61.56. [Google Scholar]
- Hall, B.W. The New Human Capital Strategy; AMACOM: New York, NY, USA, 2008. [Google Scholar]
- SHRM/ANSI. Guidelines for Reporting Human Capital to Investors. 2012. Draft Document: ANSI-SHRM-02001.201x. Available online: www.shrm.org/about-shrm/press-room/press-releases/Pages/ANSIApprovesPerformanceManagementStandards.aspx (accessed on 2 June 2013).
- Friedman, S.D. Succession Systems in Large Corporations: Characteristics and Correlates of Performance. Hum. Resour. Manag. 1986, 25, 191–213. [Google Scholar] [CrossRef]
- Robinson, M.A. Using multi-item psychometric scales for research and practice in human resource management. Hum. Resour. Manag. 2018, 57, 739–750. [Google Scholar] [CrossRef] [Green Version]
- Clardy, A. Studying Your Workforce: Applied Research Methods and Tools for the Training and Development Practitioner; Sage Publications: Thousand Oaks, CA, USA, 1997. [Google Scholar]
Figure 1.
A model of workforce metrics.


Table 1.
Foundation Metrics of a HR Workforce Management and Control System.
| Class | Metric | Data Sources | Frequency |
|---|---|---|---|
| Position and headcount inventory | Number of approved positions, number of part-time and contingent workers, and headcount. | Organizational chart, human resource information system (HRIS), and payroll records. | On-going |
| Position and headcount inventory | Span of control; and job ladders—number, height, breadth, and penetration. | Organizational chart, and records of personnel movement. | On-going or annually |
| Workforce characteristics—demographics | Age, employment length, time in position, and diversity. | HRIS records, specialized assessments, and mandated reports. | Quarterly? Semi-annually? |
| Workforce characteristics—compensation structure | Total labor cost, compa-ratio, and percent under incentive plans. | Payroll records, market surveys, and HR records. | Monthly to annually |
| Workforce characteristics—attitudes | Job satisfaction, and employee engagement. | Survey | Depends on sampling procedure—annually to quarterly. |
| Workforce flow | Turnover, sourcing rate, and workforce renewal. | Calculations based on HR records (that may or may not be available thru HRIS). | Monthly or quarterly (depending on size of organization). |
| Moderators | Absenteeism, accidents and injuries, health and wellness conflict. | Payroll records, other HR records, specially collected and reported data. | Monthly to Annually |
| Organizational Performance | Financial customer productivity | Calculations using financial, marketing, operational, or HR data. | Monthly |
| Front-line SSE workforce | Performance capability—experience, knowledge, beliefs and attitudes, and SSE Workforce productivity. | HRIS records, special testing, and surveys. | Monthly and quarterly. |
| Management | Leadership depth, and leadership quality | Succession planning data, and employee surveys | Quarterly and semi-annually? |
Publisher’s Note: MDPI stays neutral with regard to jurisdictional claims in published maps and institutional affiliations. |
© 2021 by the author. Licensee MDPI, Basel, Switzerland. This article is an open access article distributed under the terms and conditions of the Creative Commons Attribution (CC BY) license (https://creativecommons.org/licenses/by/4.0/).
Share and Cite
MDPI and ACS Style
Clardy, A. What Does HR Manage? Workforce Measurement and Control. Merits 2021, 1, 16-33. https://0-doi-org.brum.beds.ac.uk/10.3390/merits1010004
AMA Style
Clardy A. What Does HR Manage? Workforce Measurement and Control. Merits. 2021; 1(1):16-33. https://0-doi-org.brum.beds.ac.uk/10.3390/merits1010004
Chicago/Turabian StyleClardy, Alan. 2021. "What Does HR Manage? Workforce Measurement and Control" Merits 1, no. 1: 16-33. https://0-doi-org.brum.beds.ac.uk/10.3390/merits1010004