Imperfections and Modelling of the Weld Bead Profile of Laser Butt Joints in HSLA Steel Thin Plate


1
Departamento de Ciencias de la Energía y Mecánica, Universidad de las Fuerzas Armadas-ESPE, Av. General Rumiñahui S/N, 171103 Sangolquí, Ecuador
2
Department of Mechanical Engineering, Centre for Mechanical Engineering, Materials and Processes (CEMMPRE), University of Coimbra, 3004-516 Coimbra, Portugal
3
Department of Mechanical Engineering, Polytechnic Institute of Leiria, School Tech and Management, Morro do Lena-Alto Vieiro, 2400-901 Leiria, Portugal
*
Author to whom correspondence should be addressed.
Metals 2021, 11(1), 151; https://0-doi-org.brum.beds.ac.uk/10.3390/met11010151
Submission received: 20 December 2020
/
Revised: 3 January 2021
/
Accepted: 11 January 2021
/
Published: 14 January 2021
(This article belongs to the Special Issue High-Strength Low-Alloy Steels: Current and Future Challenges)
Abstract
:In many applications that use high strength steels, structural integrity depends greatly on weld quality. Imperfections and the weld bead geometry are influencing factors on mechanical properties of the welded joints but, especially in the fatigue strength, they cause a great decrease. The proper knowledge of these two factors is important from the nominal stress approach to the fracture mechanics approaches. Studies concerning the profile and imperfections of the weld bead in laser welding for thin plates of high strength steels are scarce. In this work, these two aspects are covered for five series single and double-welded joints, butt joints in a 3 mm thick HSLA steel, welded in a small range of welding parameters. The actual profiles captured with profilometer were modeled with proposed geometric parameters achieving an adequate fit with values of the coefficient of determination ℜ2 greater than 0.9000. Description of imperfections includes the distributions of porosity and undercuts. The evaluation of the weld quality, taking as guide the ISO 13919-1 standard determined B and D levels for the welded series while based on the stress-concentrating effect, showed a greater detriment in those series with undercuts and excessive penetration. The analysis of variance validated the results of the different combinations of laser welding parameters and showed, for the factorial experimental design, a more significant effect of the welding speed.
1. Introduction
Despite the promising advantages for many applications, laser welding of high strength and low alloy (HSLA) steels still does not overcome the deterioration suffered in the mechanical properties of the base material, there being an appreciable reduction especially in fatigue strength. In two works [1,2], where the fatigue strength of welded joints formed with steels of high and low tensile strength is compared, it is found that at high-stress levels the difference is small, when the stress level decreases the difference is reduced and the welded joints can have a similar fatigue limit. One of the principal factors for behaviors like the above may be the weld quality, so that the high strength of the steels cannot be exploited due to the weld quality as showed in [3] and [4]. The weld quality is associated mainly with the imperfections of the weld bead. However, the heat input (HI) from the welding process also produces changes in the microstructure and residual stresses that may influence fatigue strength. If the objective is to understand the reduction of the fatigue strength in welded joints it is important to have complete knowledge of the imperfections and weld profile, as well as the type of joint, the materials, the welding process and a detailed analysis of the site, start and path of the fatigue failure; otherwise, partial or biased conclusions could be drawn.
Imperfections such as undercuts, excess weld metal, excessive penetration, underfill, porosity and misalignment occur frequently in laser welding and may affect the fatigue strength of welded joints. The notch effect exerted by the undercuts and excess weld at weld toe is well known. In studies, more parameters of these two imperfections are being incorporated into the relationships that evaluate their effect, although there is disagreement regarding which parameters are the most influential. Mashiri et al. reported a greater effect of the depth over the width and the radius of the undercuts, the influence of the fillet weld profile on the undercut depth and a relatively major loss of fatigue crack propagation life for thin plate than for thick plate [5]. In Cerit et al. [6], the stress concentration factor (SCF) for undercuts and weld toe reinforcement for butt joints were determined by means of finite element analysis (FEA), six parameters were used (three for each one) and it was established that the highest stresses were produced from the combination of a high ratio of depth to radius with a low reinforcement angle. Lillimäe et al. evaluated the correlation between two analytical expressions for the SCF and experimental results of fatigue strength, they found a better fit for the five-parameter formula than the three-parameter expression and also reported that the results agreed better with the mean values of weld height and flank angle than with the mean values of transition radius and the undercut depth [4]. In Liinalampi et al., the length of the undercuts has been incorporated to evaluate the effective stresses due to this factor and the results showed that the effective notch stress is overestimated in the 2D analysis if the notch is short and deep [7]. Finally, in simulations based on the fracture mechanics approach, Schork et al. [8] showed that the notch (or undercut) depth is the most influential parameter, whether considered individually or in conjunction with other parameters of the weld toe.
When reviewing the literature regarding the effect of porosity on the fatigue behavior in joints of steels and aluminum alloys, it is found that pores can decrease the load-bearing area and exert a stress-concentrating effect that reduces the fatigue strength. In [9], was reported for lap joints with pores, that these imperfections did not initiate fatigue and the fatigue strength was proportional to the actual area of the welds, while for butt joints, which were removed the excess weld and other imperfections, pores can initiate fatigue, in large pores [10,11], in small pores near to the surface [12,13], as also in small or big internal pores [14]. According to what is proposed in Wang et al. [15], fatigue life is more affected by the size than by the pore’s position. Biswal et al. [16], for titanium alloys, showed that sub-surface pores have high SCF while for isolated inner pores, the increase in SCF is small.
In the literature, other imperfections are also reported as affecting the fatigue strength: linear [17] and angular [18] misalignment, especially in slender elements and thin plates increasing the local stresses; weld ripples as sites where the fatigue can initiate when the weld toe radius is large enough [19], while in [20], the period of toe waves and the local toe geometry were designated as features that strongly influenced the fatigue crack initiation and propagation lives. However, the weld ripples are not usually part of the weld quality standards and have not been explicitly characterized by any parameter to evaluate the effect on fatigue strength, although their effect was indirectly taken into account in the study [21]. From the above revision, it is observed that the size, shape, localization, combinations and interactions between imperfections are influential and should be considered for proper analysis. For the measurement and capture of imperfections and weld profile along the weld axis various technics and procedures with variable complexity and resolutions from 1 to 100 µm are found: mechanical profilometer [3], rubber replicas [22], non-destructive replica and design software [23], laser scanner and optical 3D scans [21] and laser scanner and optical system with cameras [4].
On the other hand, avoiding imperfections in laser welding in keyhole mode via the proper setting of welding parameters has shown limitations due to the sensitivity of the welding process and even more under certain restrictions, this purpose can require a large number of trials and consumption of time. Particularly for medium and high ranges of welding parameters, e.g., for power and welding speeds from 3 to 15 kW and m/min, there are studies that show zones where there are no imperfections [24], or maps were the effect on a certain imperfection is analyzed [25]. Other studies with optimization methodologies find specific combinations of welding parameters that optimize the weld bead under an established criterion [26,27]. However, there are few studies that validate the solutions optimized within a range of parameters [28], that evaluate imperfections along the weld axis or that cover ranges of small values of the welding parameters (e.g., <3 kW and m/min). Particularly in works where notch stress and fracture mechanics approaches are applied for the assessment of the fatigue strength of welded joints [18,21,23,29], aspects such as knowledge of the variation of the weld bead profile along the weld axis, the statistical distribution of imperfections and the use of more realistic geometries and microstructures are highlighted in order to achieve a scientific approach and effective response to the concept “fitness for purpose”; therefore, it is necessary to carry out studies that cover those aspects.
This work was developed in view of overcoming the deficiencies observed in the previous review, and therefore reports in detail the weld profile and the imperfections for five series of laser butt joints welded in thin plates under a small range of welding parameters. The weld profile and various imperfections were captured by a profilometer showing that for small weld beads it is very useful and may be more advantageous compared to other methods and equipment. For all of the welded series, a simple graphic model consisting of arcs of circles and straight lines is proposed in order to model the profile of the weld beads. The distributions of porosity and undercuts are reported. The quality of the welded series was evaluated, taking as a guide the ISO 13919-1 standard [30]. Additionally, to assess the effect of the weld profile and the undercuts on fatigue strength, their corresponding stress concentrating factors were determined. The analysis of variance (ANOVA) was performed for validation of results and evaluation of the effect of the welding parameters and HI on the weld bead geometry.
2. Materials and Methods
2.1. Material and Laser Welding
Butt joints of 3 mm thickness were manufactured with the high strength low alloy steel Strenx® 700MCE. This metal is hot-rolled steel under the requirements of S700MC in EN 10149-2 [31], with the chemical composition (Table 1), tensile mechanical properties (Table 2) and microstructure fine-grained mainly composed by ferrite and bainite as reported in [32].
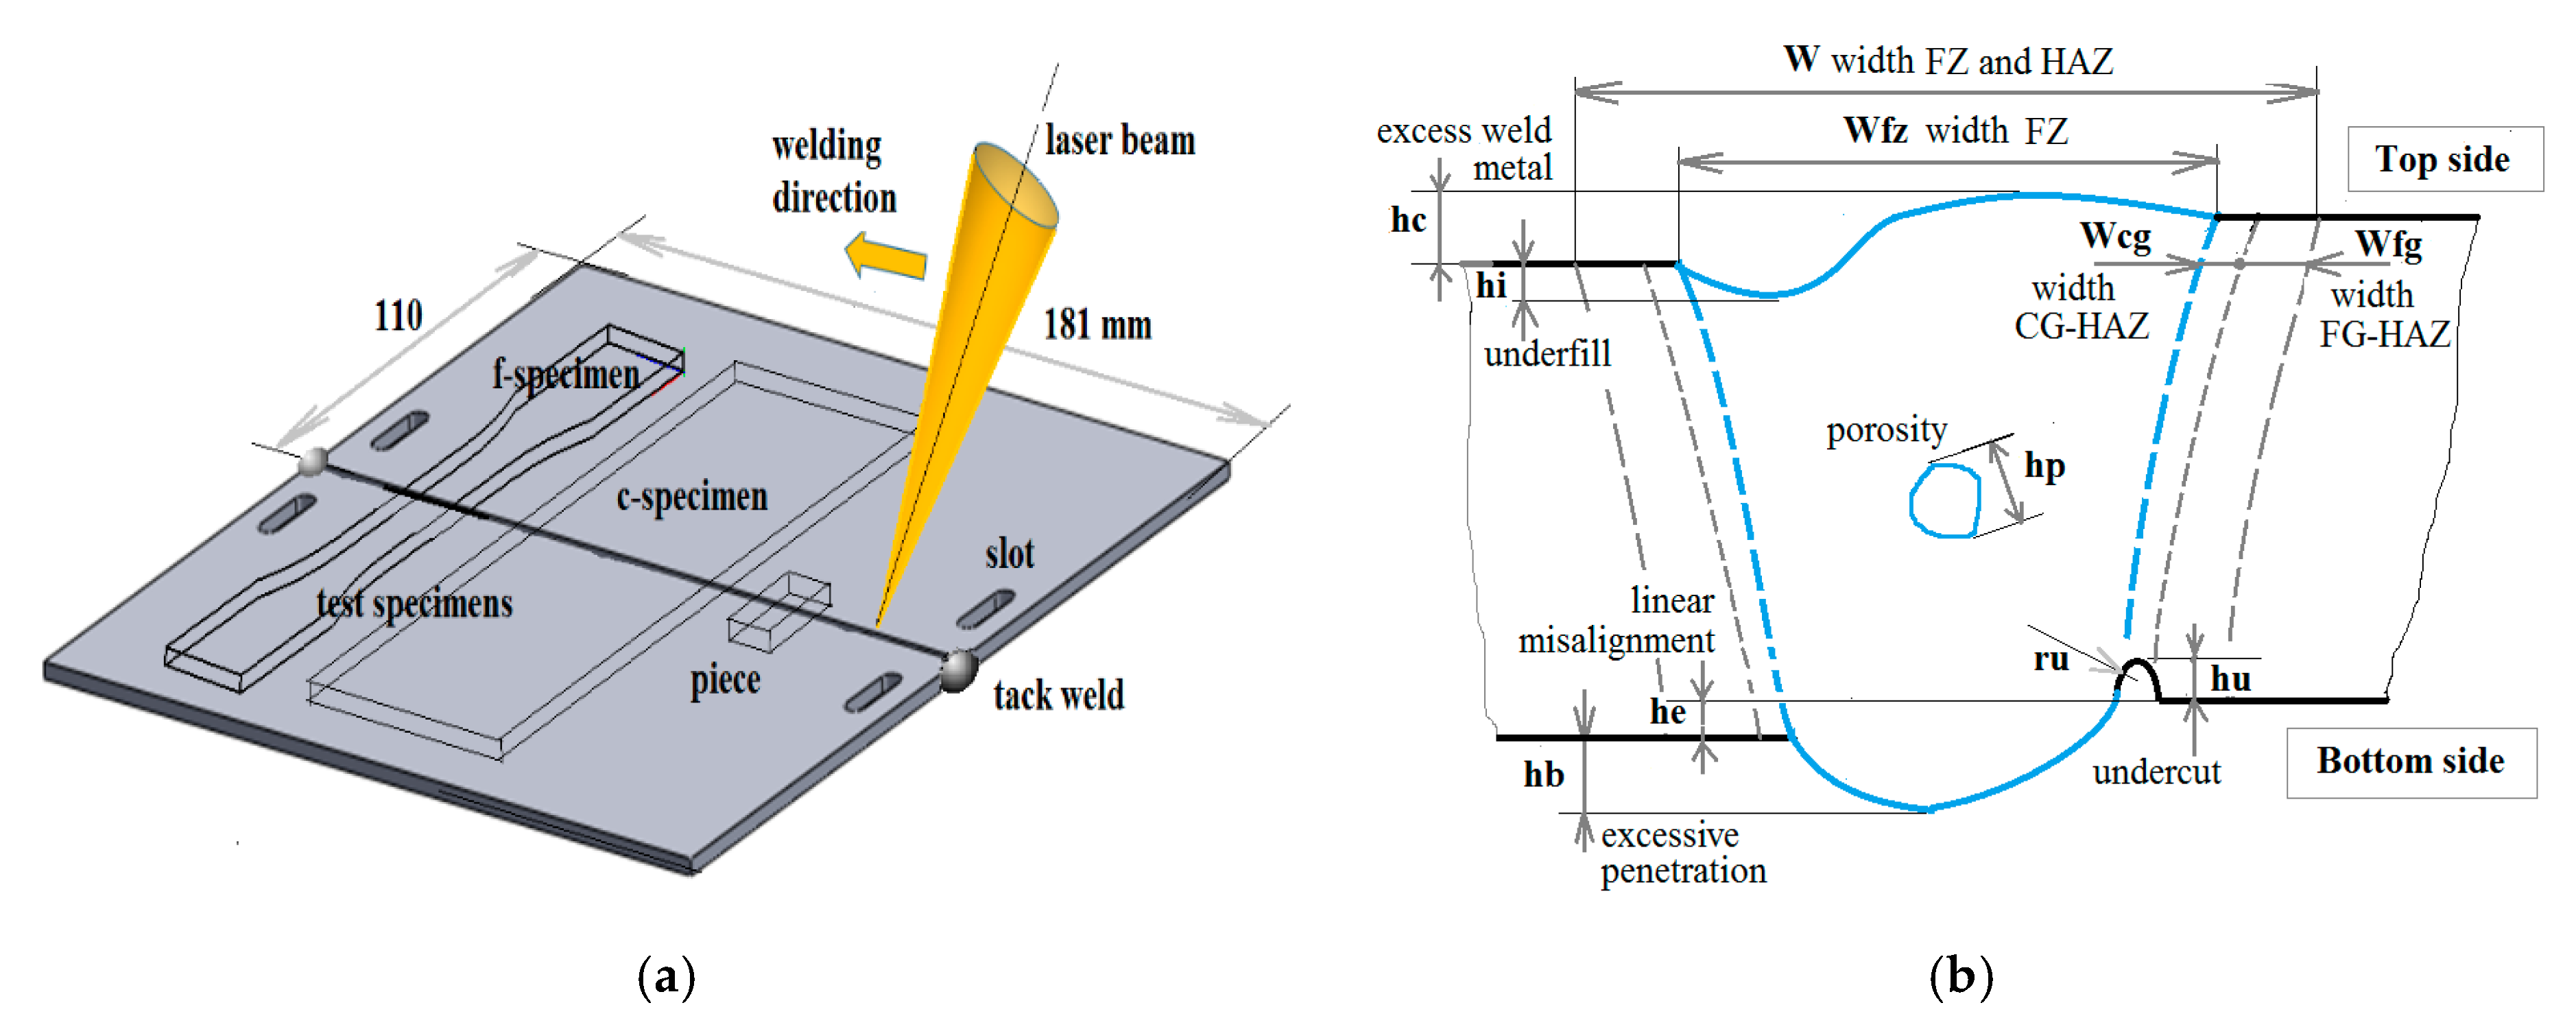
According to the results of the previous work on the same type of joints [32], low heat inputs (less than 80 J/mm) produced small sizes and less softening of the heat-affected zone (HAZ) and tensile mechanical properties similar to the base metal, although there were some imperfections in the weld beads. Therefore, for the present study, the welding parameters shown in Table 3 were chosen, on the one hand, to form a factorial design in a narrow range of welding speed and power for single-welded joints that allow partial and complete penetration with HI less than 80 J/mm, and on the other hand, to achieve a complete penetration with double-welded joints of low HI (each weld pass less than to 60 J/mm) without increasing the size and softening of the HAZ, although it could increase the level of porosity. Thus, the first four series (S1, S2, S3 and S4) form a 22 factorial design, where the factors welding speed and power varied on two levels (Table 3), and for the fifth series (S5) welded from both sides, on the top side, the welding speed was varied within the range of 2.0 to 1.75 m/min with the constant power (1.75 kW) and, on the bottom side, the welding parameters were constant (Table 3). For all series, the welding parameters—focus diameter, focus position and the beam inclination—were constant in the values: 350 µm, −2 mm and 9 degrees respectively. A disk laser equipment Trumpf TruDisk 2000 with laser maximum output of 2000 W; beam wavelength, 1020 ƞm; beam parameter product, 2 mm-mrad; and fiber diameter 200 µm was used in continuous mode.
The butt joints were formed with two laser-cut 181 mm × 110 mm × 3 mm plates. To facilitate the operation and maintain the same welding clamping condition, fixing slots were machined in the plates and two small tack welds were welded at samples’ ends (Figure 1a). The surfaces close to the welds were prepared with sandpapers #80, #120 and #180 and the edges were rectified to achieve a uniform and practically null gap clearance between the plates. Before welding, the surfaces and edges were cleaned by acetone, the welding line aligned to the trajectory of the laser beam and the plates fastened in the slots by means of screws. Argon (99.996%) shielding gas was used at a flow rate of 20 L/min. The weld axis was arranged transversely to the rolling direction.
2.2. Measurement of Weld Bead Geometry and Imperfections
The measurement and capture of weld bead geometry and imperfections were performed with a microscope and profilometer on samples or pieces and test specimens that were extracted from the samples (Figure 1a). The Mitutoyo Toolmaker’s Microscope (Kawasaki, Japan) equipped with digital micro-meters was used for the measurements of the widths (near to the top side) of the heat-affected zones and for penetration depth on the macrographs of the pieces extracted from the samples. For S1 to S4 series, four macrographs were measured, each macrograph coming from different samples, except the S4 series for which two macrographs come from the same sample, while for the S5 series, two macrographs were measured for each sample. The features of the macrographs mentioned above and the designation of the typical imperfections that will be analyzed are presented in the scheme of Figure 1b.
The microscope was also used to measure porosity on a section cut along the weld axis, near to the center of the FZ, and successive polishing showed that the greatest amount of porosity occurred very close to the center of the FZ. For each series, the measured weld length was 54 mm (six pieces of 9 mm). Pores with sizes less than 0.05 mm were not considered due to the resolution of the equipment.
The profile of each side (top and bottom) of the weld bead was captured through the Mitutoyo SURTEST SJ-5000 profilometer (Kawasaki, Japan) using a pitch of 1 μm. The data obtained by the profilometer were then inserted in an excel sheet to graphically represent the profile and to determine the geometrical parameters that define its shape and imperfections such as, excess weld metal, underfill, linear misalignment, excessive penetration and undercuts (Figure 1b). Simple functions and relationships were used to establish parameters such as lengths, heights, angles and radii. Four profiles (in top and bottom sides) in each sample were captured for all of the series, however for series S1, S2 and S3, only four samples were used. Unlike the S4 series where the measurements were made on four sites distributed along the samples, for the other series, the measurements were made on the f-specimens. Therefore, for each one of the S1, S2 and S3 series, 16 measurements were made; for the S4 series, 8 measurements; and for the S5 series, 20 measurements.
Since no appreciable undercuts were observed at other sites, measurements for this imperfection were concentrated at the weld root of the S1, S2 and S3 series and were used four f-specimens and one c-specimen from different samples, completing 100 mm of examined length: 50 mm of the f-specimens and 50 mm of the c-specimen. To determine the size and distribution of the undercuts, the possible undercuts were first located under the microscope and with the help of light, once they were marked, they were verified and measured with the profilometer, finally, the measurement of their length under the microscope was completed.
3. Results and Discussion
3.1. Weld Bead Geometry
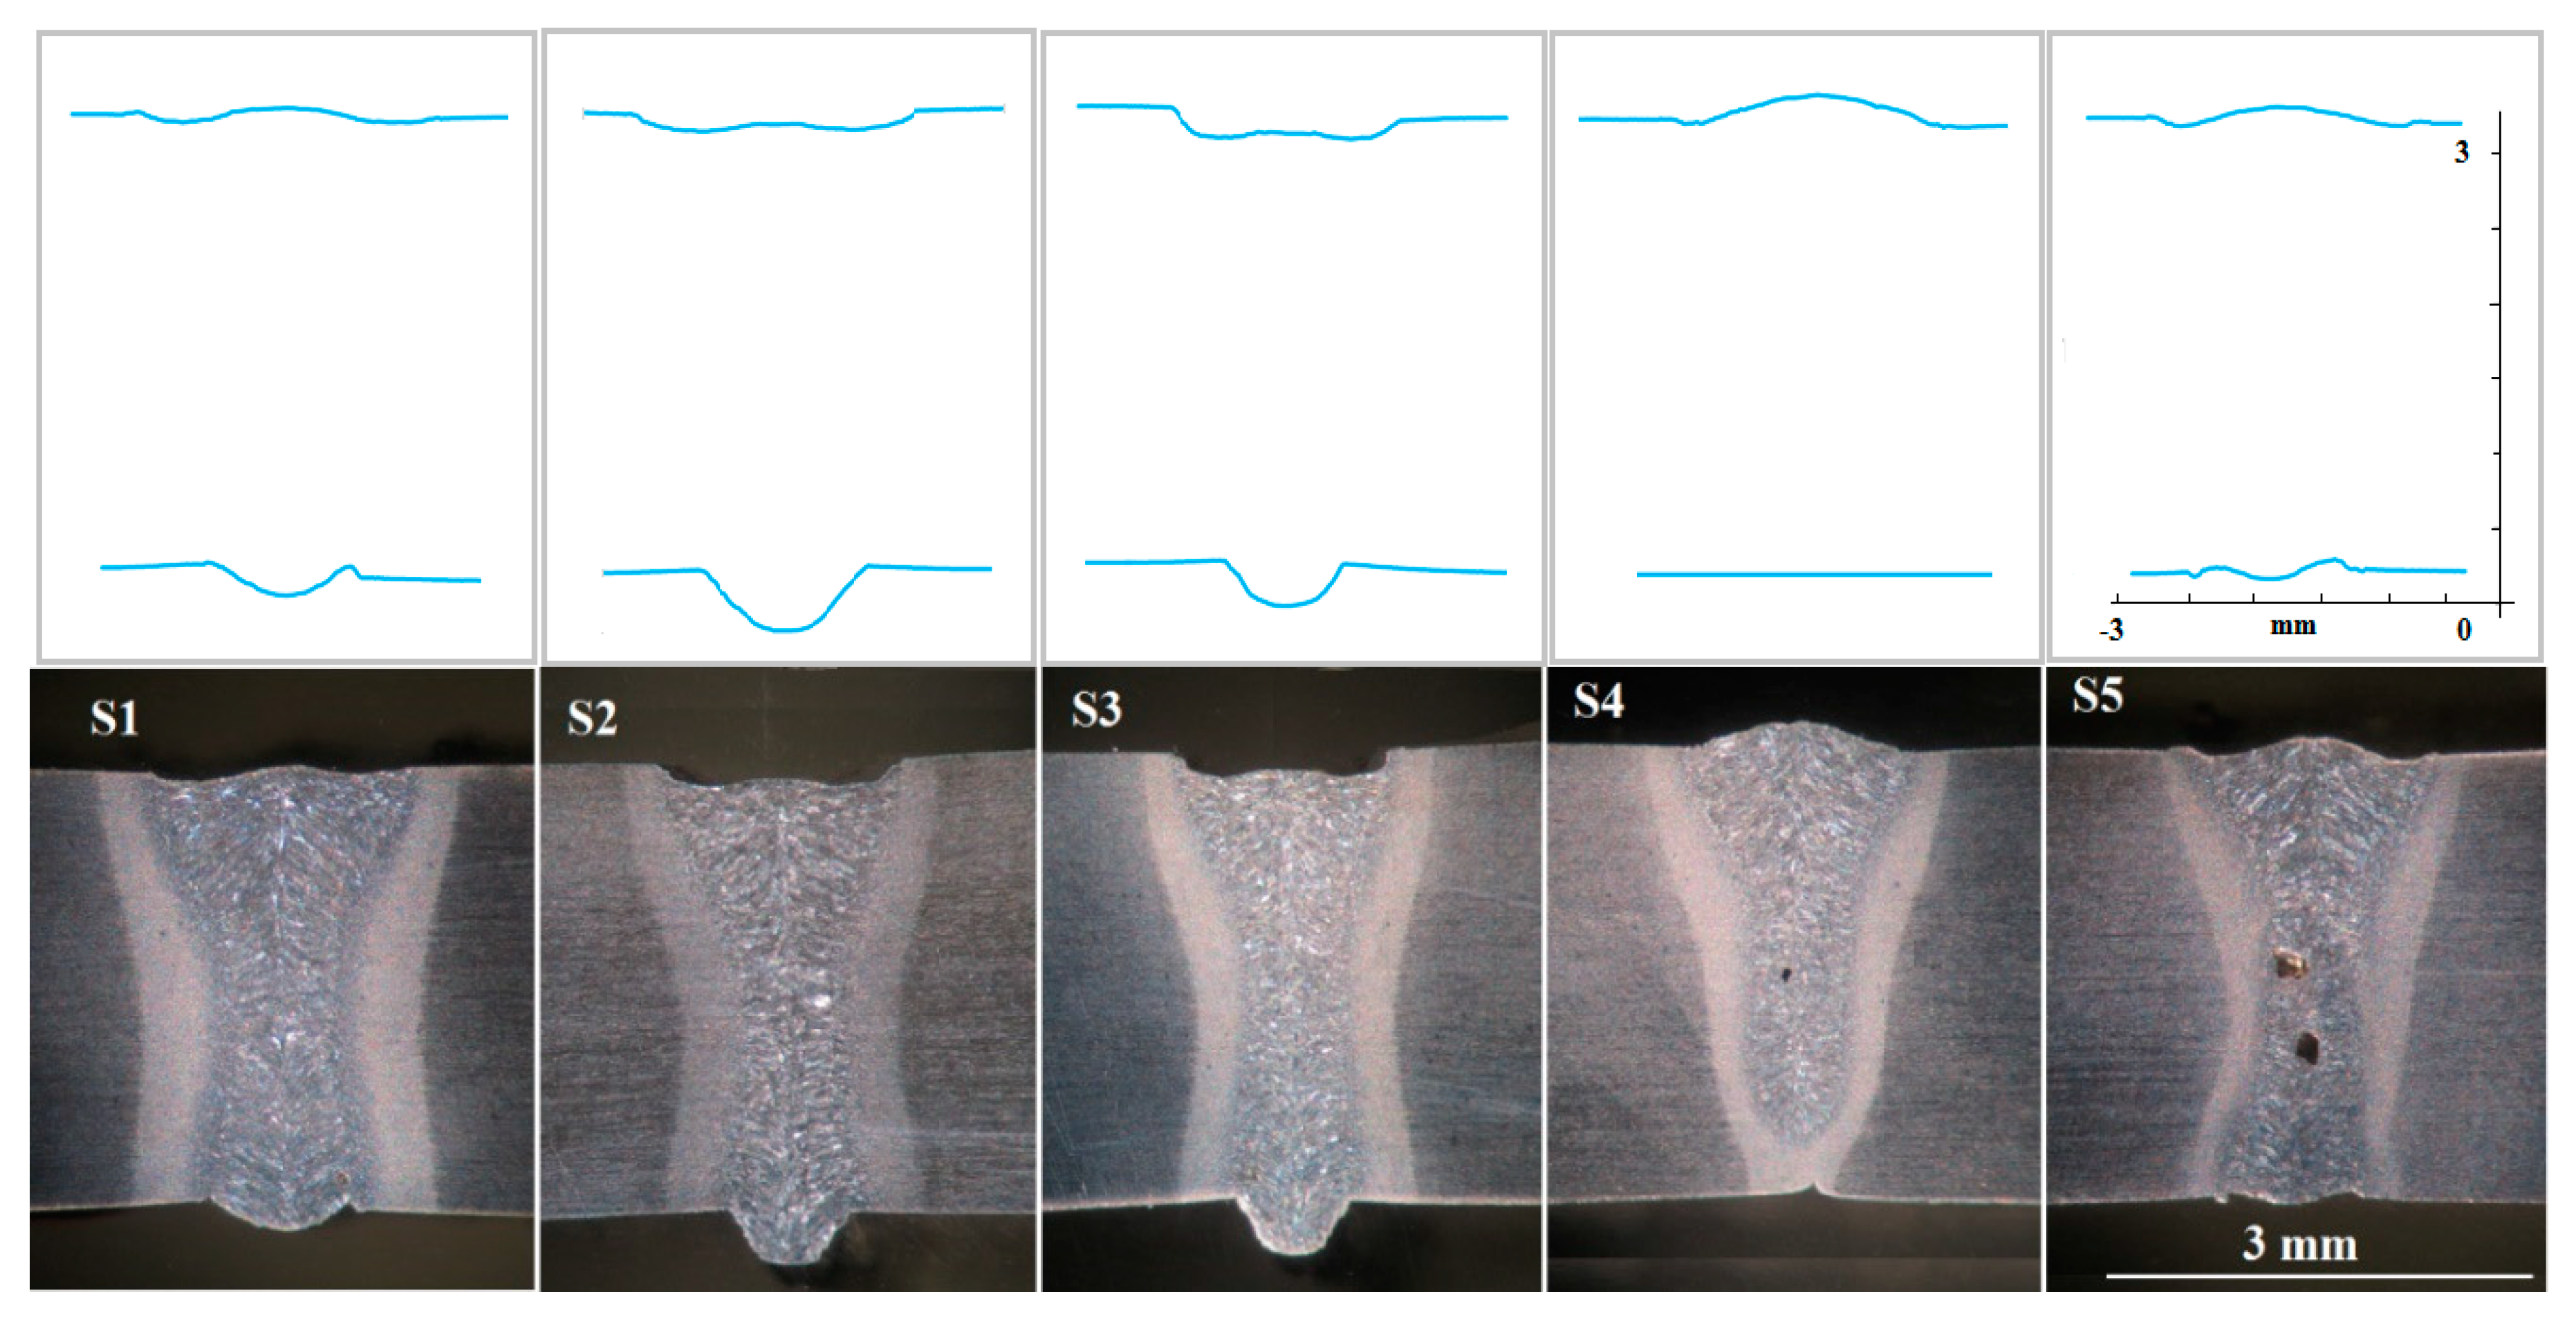
The weld bead geometry found for the welded series is illustrated in Figure 2 with profiles captured by the profilometer and with macrographs of the cross-section. As can be seen, in general, all series’ weld bead profiles presented symmetry and are composed of rounded shapes, however, a more careful observation of Figure 2 and of the enlarged graphic representation that allows of the profilometer’s data, showed that there are also straight parts. Small straight segments were observed especially in the weld face in the S3 series, as well in the bottom side (located in the middle part of the excessive penetration) in the S1, S2 and S3 series. It is also possible to observe, weld bead profiles with wide radii and smooth geometric transitions such as the top profiles of the S1, S4 and S5 series in contrast to more abrupt geometric transitions like the top profile of the S3 series or as the bottom profile of all series (without consider the S4 series).
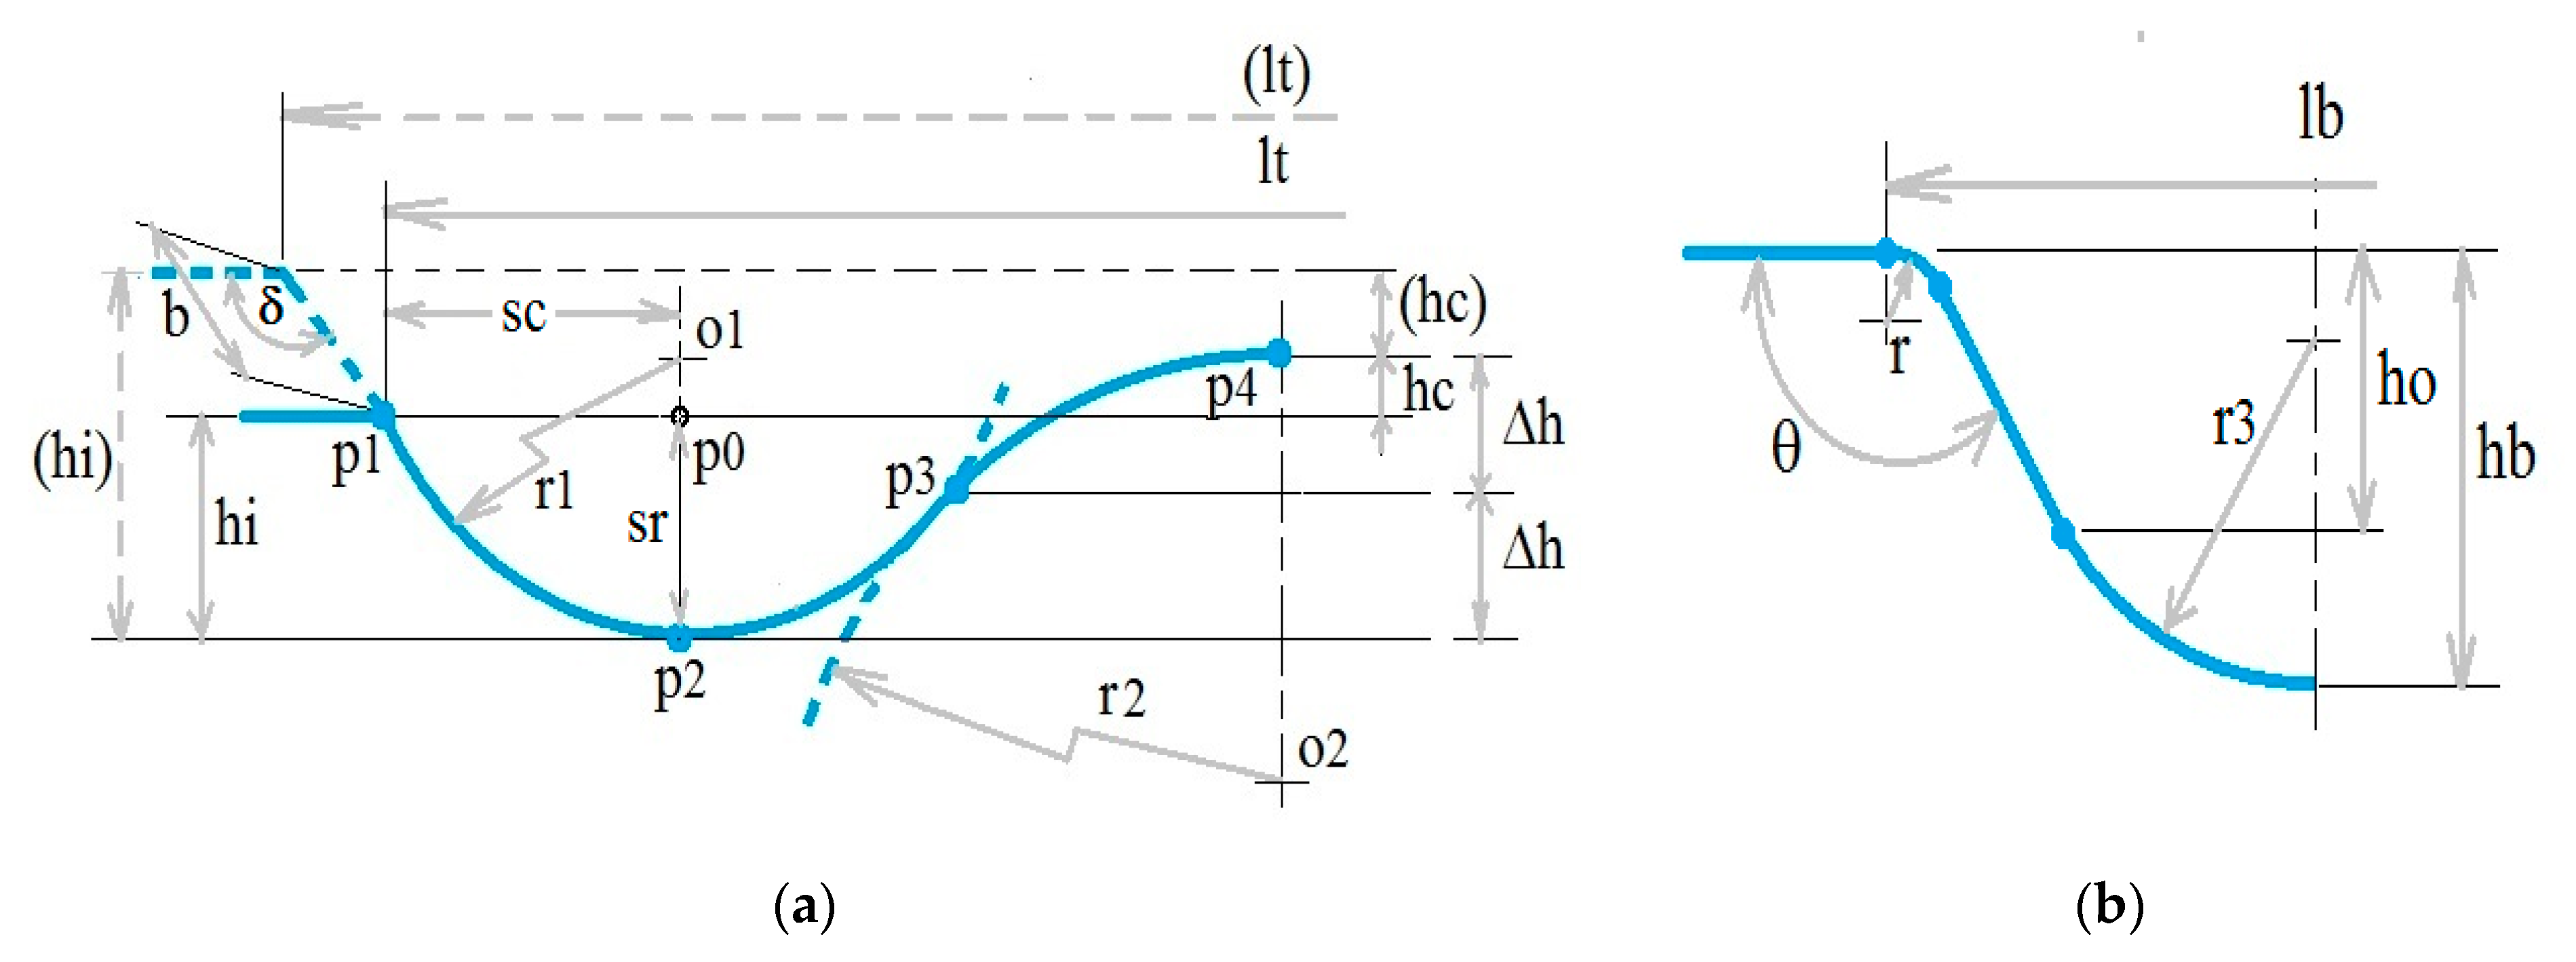
Figure 3 proposes the geometric parameters that define two idealized profiles: t-profile and b-profile. Due to symmetry, only half of the profiles are shown. The combination of these two idealized profiles allows the modelling of any weld bead profile of the welded series. Therefore, the top and bottom profiles of the S1, S2 and S3 series can be reproduced by the idealized profiles t-profile and b-profile, respectively, for the S5 series contrary to the previous ones; and for the S4 series, only the top profile can be modeled with the b-profile.
The values for the geometric parameters proposed in Figure 3 which are shown in Table 4 were determined directly from the data and graphical representation of the profiles and through simple geometric functions, while the rest of the parameters (r1, r2, r3, ho, ∆h and sr) can be calculated as outlined in the profile modelling Section 3.2. As detailed in Section 2.2, various imperfections can also be evaluated from the results of Table 4. In this table, it should be noted that the hc values are positive for excess weld metal but due to the particular shape of the profiles they can also take negative values as in the case of underfill. In Table 4, the parameter he corresponding to the linear misalignment was also included.
Some observations stand out in Table 4. The results show the variability of the profile features along the weld axis for all series which can be explained due to the sensibility of laser welding and the instability of keyhole mode as is well known [33]. Although the magnitudes are small (with the exception of the angular ones), clear differences and trends are observed between the welded series. For example, with respect to averages, the width lt decreases and the underfill hi increases for S1 to S3 series, however, there is closeness in some average values and overlap between the maximum and minimum values, especially between S2 and S3 series. It is also noteworthy that standard deviations, in general, are relatively small, and therefore it could be assumed that the weld beads of each series are characterized by their size and shape by the effect of the welding parameters, however, this issue will be analyzed in Section 3.5.
On the other hand, despite the variation of the welding speed used between its welded samples, the S5 series presented only in certain geometrical parameters (especially for the top profile) a slightly higher standard deviation than the other series, which justifies its grouping into a single series.
Table 5 shows the means of measurements in relation to the macrographs. The widths of the HAZ were measured near the top surface of the weld bead. The penetration depth of the S5 series corresponds to that achieved with two pass weld. The small difference between the values of the width of the FZ (Table 5) and the values lt or lb (as appropriate in Table 4), indicate the reliability of the measurements made with the microscope and the profilometer. Due to the S4 series’ partial penetration joint, its details or discussion may be omitted in the following sections.
3.2. Profile Modelling
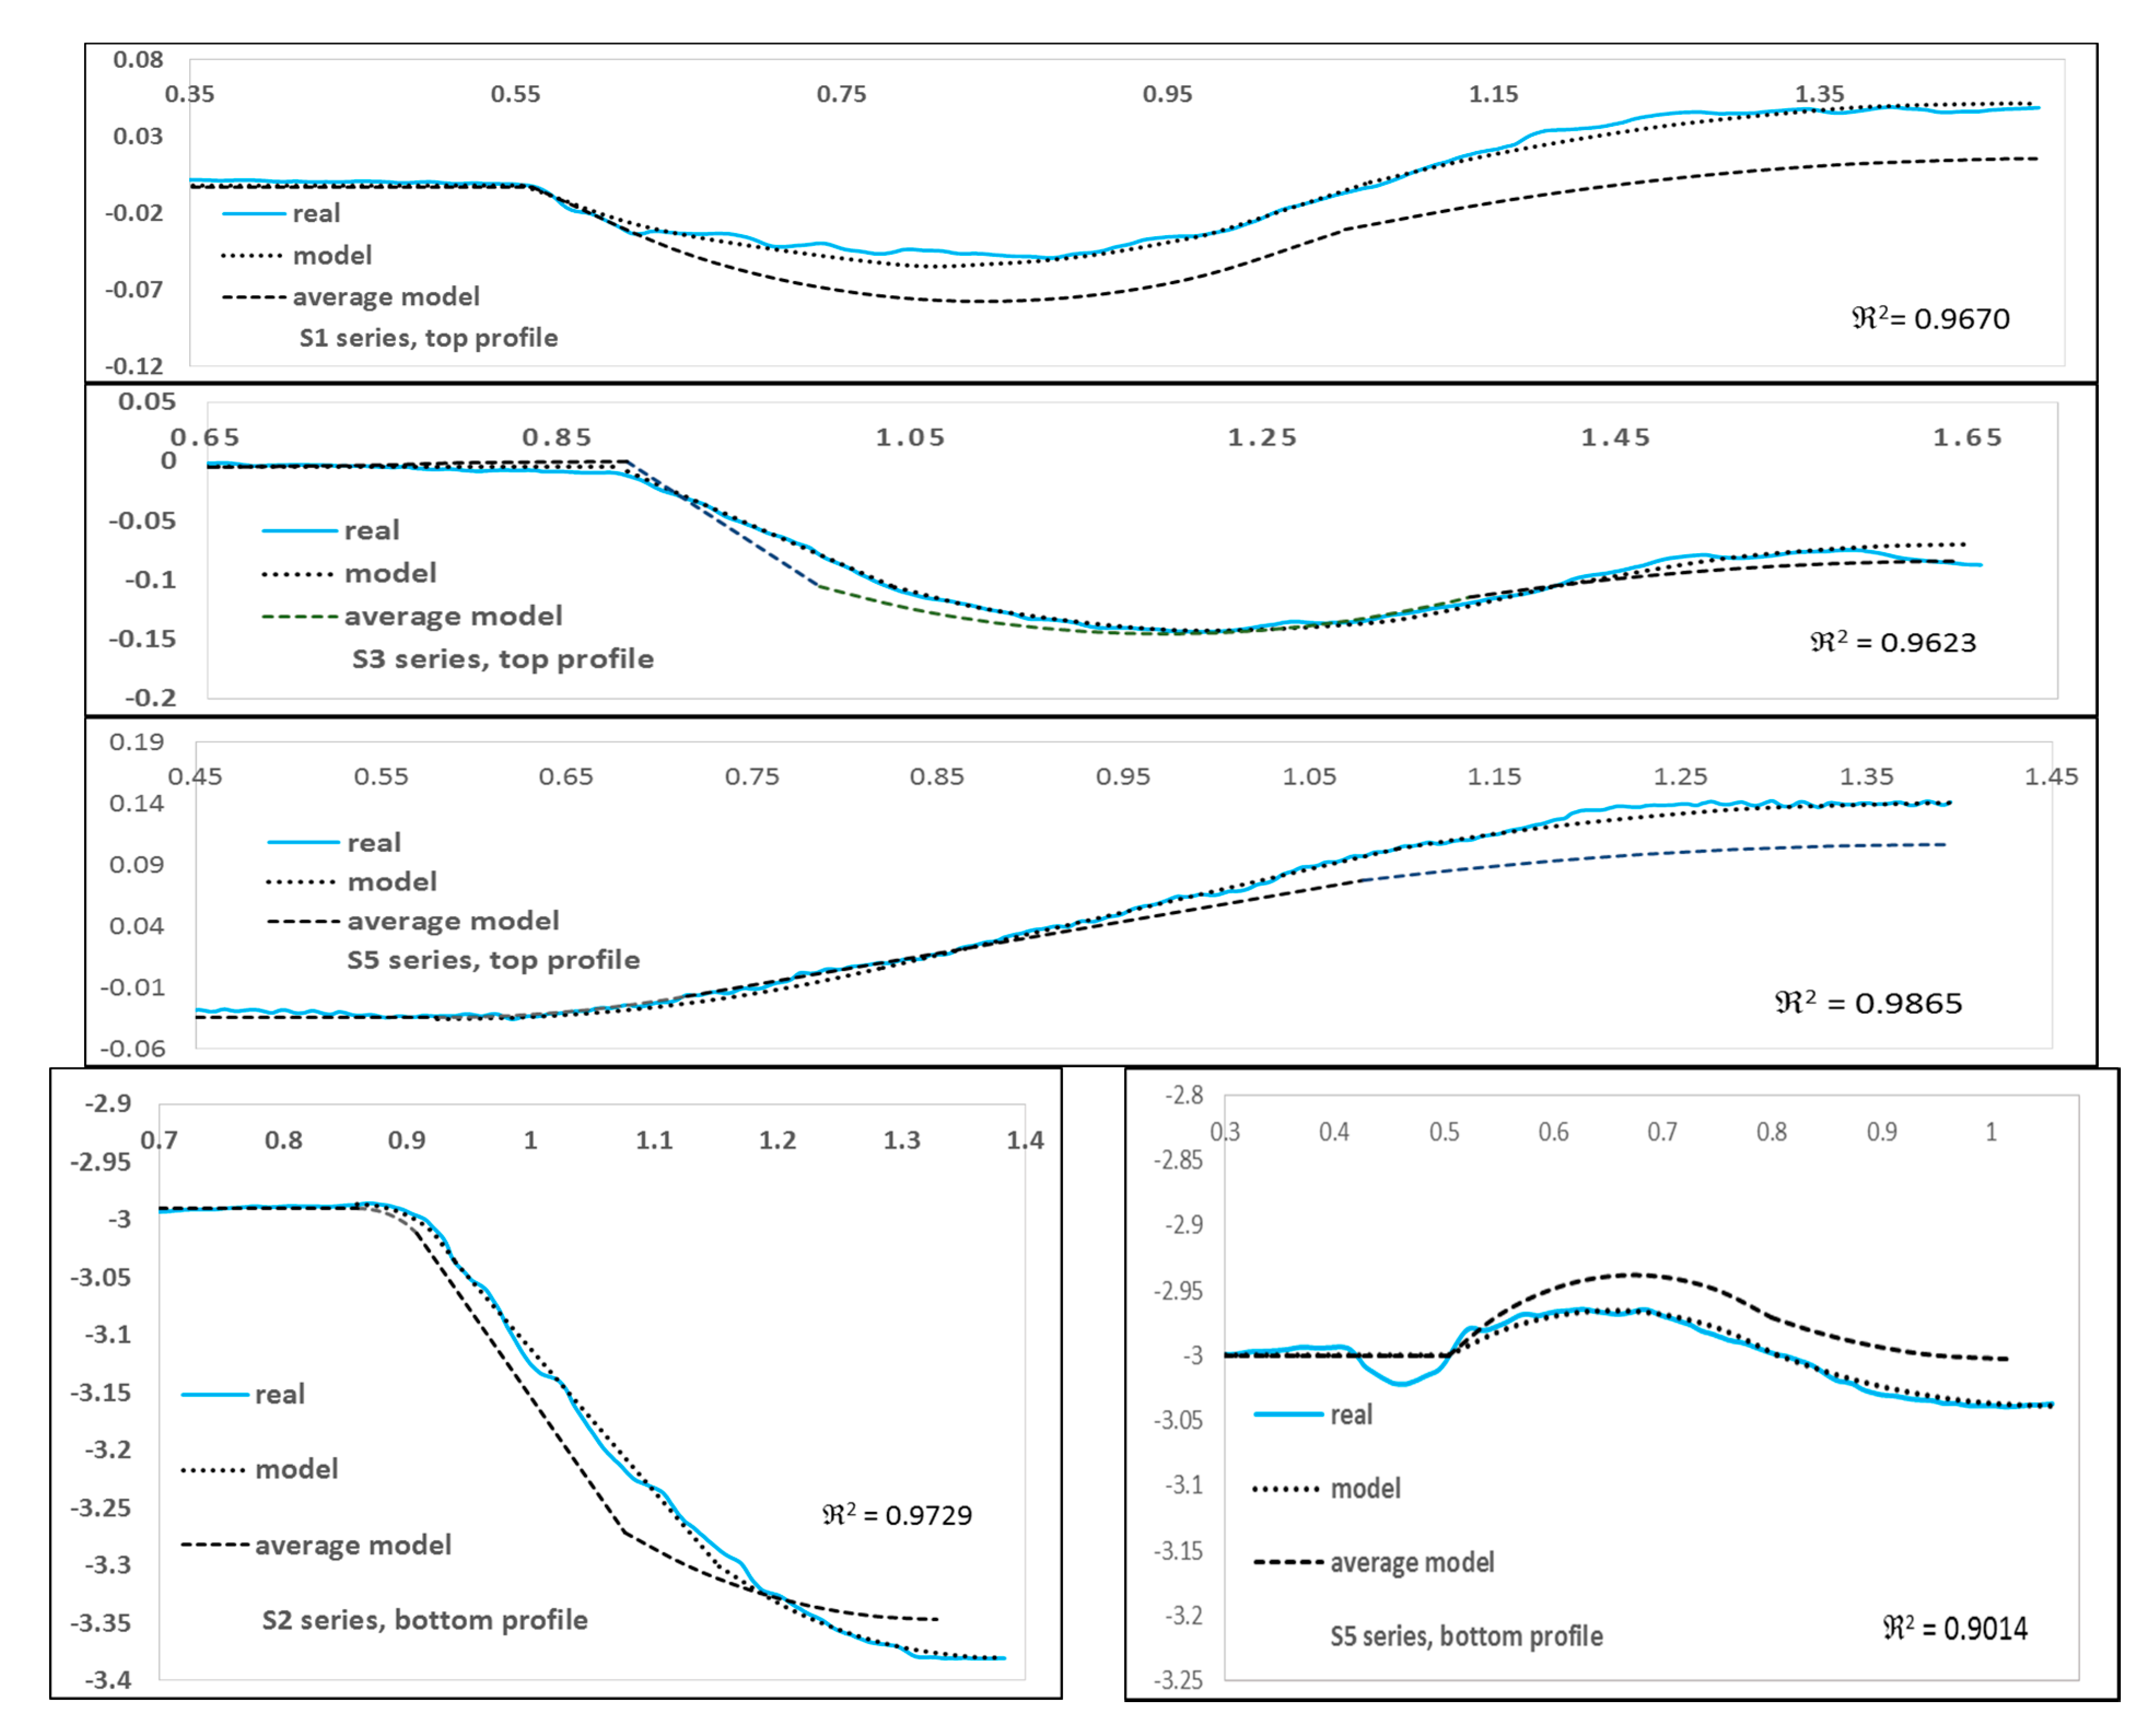
The actual profile of the weld bead captured by the profilometer can be modeled through the combination of arcs of circles and straight lines as is proposed in Figure 3. For profiles that correspond to t-profile, the parameters r1, r2 and the location of their centers o1 and o2 are key elements for a good fit and were determined as described below. An arc of a circle is assumed to pass through points p1 and p2 so that the cut between the horizontal line that passes through p1 and the vertical line that passes through p2, define the semi-chord p1p0 (of length sc) and the segment-radius p2p0 (of length sr), allowing to determine both the radius r1 (through the geometric relationship between the semi-chord and the segment-radius) the center o1 of the circle. For the second circle that passes through p4 and p3, it is assumed that the inflection point p3 is located in the middle of the high between p4 and p2 (∆h) and therefore the radius r2 and the center o2 can be known in the same way as for the first arc of the circle. Specifically for the S3 series, the profile shown in segmented lines in the upper left of Figure 3 must be added to the profile formed by the two arcs of the circle and therefore the parameters b and δ should be used. The above procedure is appropriate given the range of the results, both for positive and negative values for hc being hi always negative. Even although the profiles that correspond to the lower part of the weld root surface can be modeled by the link between straight lines and arcs with tangential transitions, in this work, to use the same modeling for profiles with both excess penetration and excess reinforcement, the arc corresponding to radius r3 it will be graphed in a similar way to the arcs of the idealized t-profile, using as an approximation for all series a value of ho equal to 0.79 hb. Figure 4 shows, for S1, S2, S3 and S5 series, examples with a real profile, its model and the average model (based on the mean parameters) according to the previous procedures.
Even though it is evident in Figure 4 that there is a good fit between the real profile and its model, for the five examples, the coefficient of determination ℜ2 was calculated in order to judge the goodness of the fit. The ℜ2 calculation was based on five points taken along the profiles but especially in the places where there is a greater difference between the heights. The ℜ2 values (shown in the lower right part of the figures) obtained determine that the adjustment is adequate. On the other hand, regarding the small dimensions of the weld bead, it is possible to see minute details of the real profiles and it is possible to reproduce an average model for each welded series.
3.3. Imperfections
Since the cross-sections shown in Figure 2 represent the welded series, at first glance, at a certain level, all the series present multiple-imperfections. The S1, S2 and S3 series have especially underfill and excessive penetration, while the S4 and S5 series have excess weld metal and porosity. In particular, in the S1 and S3 series it is possible to observe undercuts in the weld root, while the S4 series show incomplete penetration and the S5 series underfill in the bottom side.
Some imperfections can be quantified through the parameters proposed in Figure 3 and the results of Table 4. Referring to the designations of the imperfections in Figure 1b, the excess weld metal is quantified with the positive parameter hc for the S1, S2, S3 and S5 series and by the hb parameter for the S4 series; the underfill with the negative parameter hi for all series; the excessive penetration with the hb parameter for the S1, S2 and S3 series and; the linear misalignment with the he parameter. In the next sections, we will present the porosity and undercuts distributions and the assessment of the level of imperfections according to the ISO 13919-1 welding quality standard and also focused on the effect of stress concentration.
3.3.1. Porosity
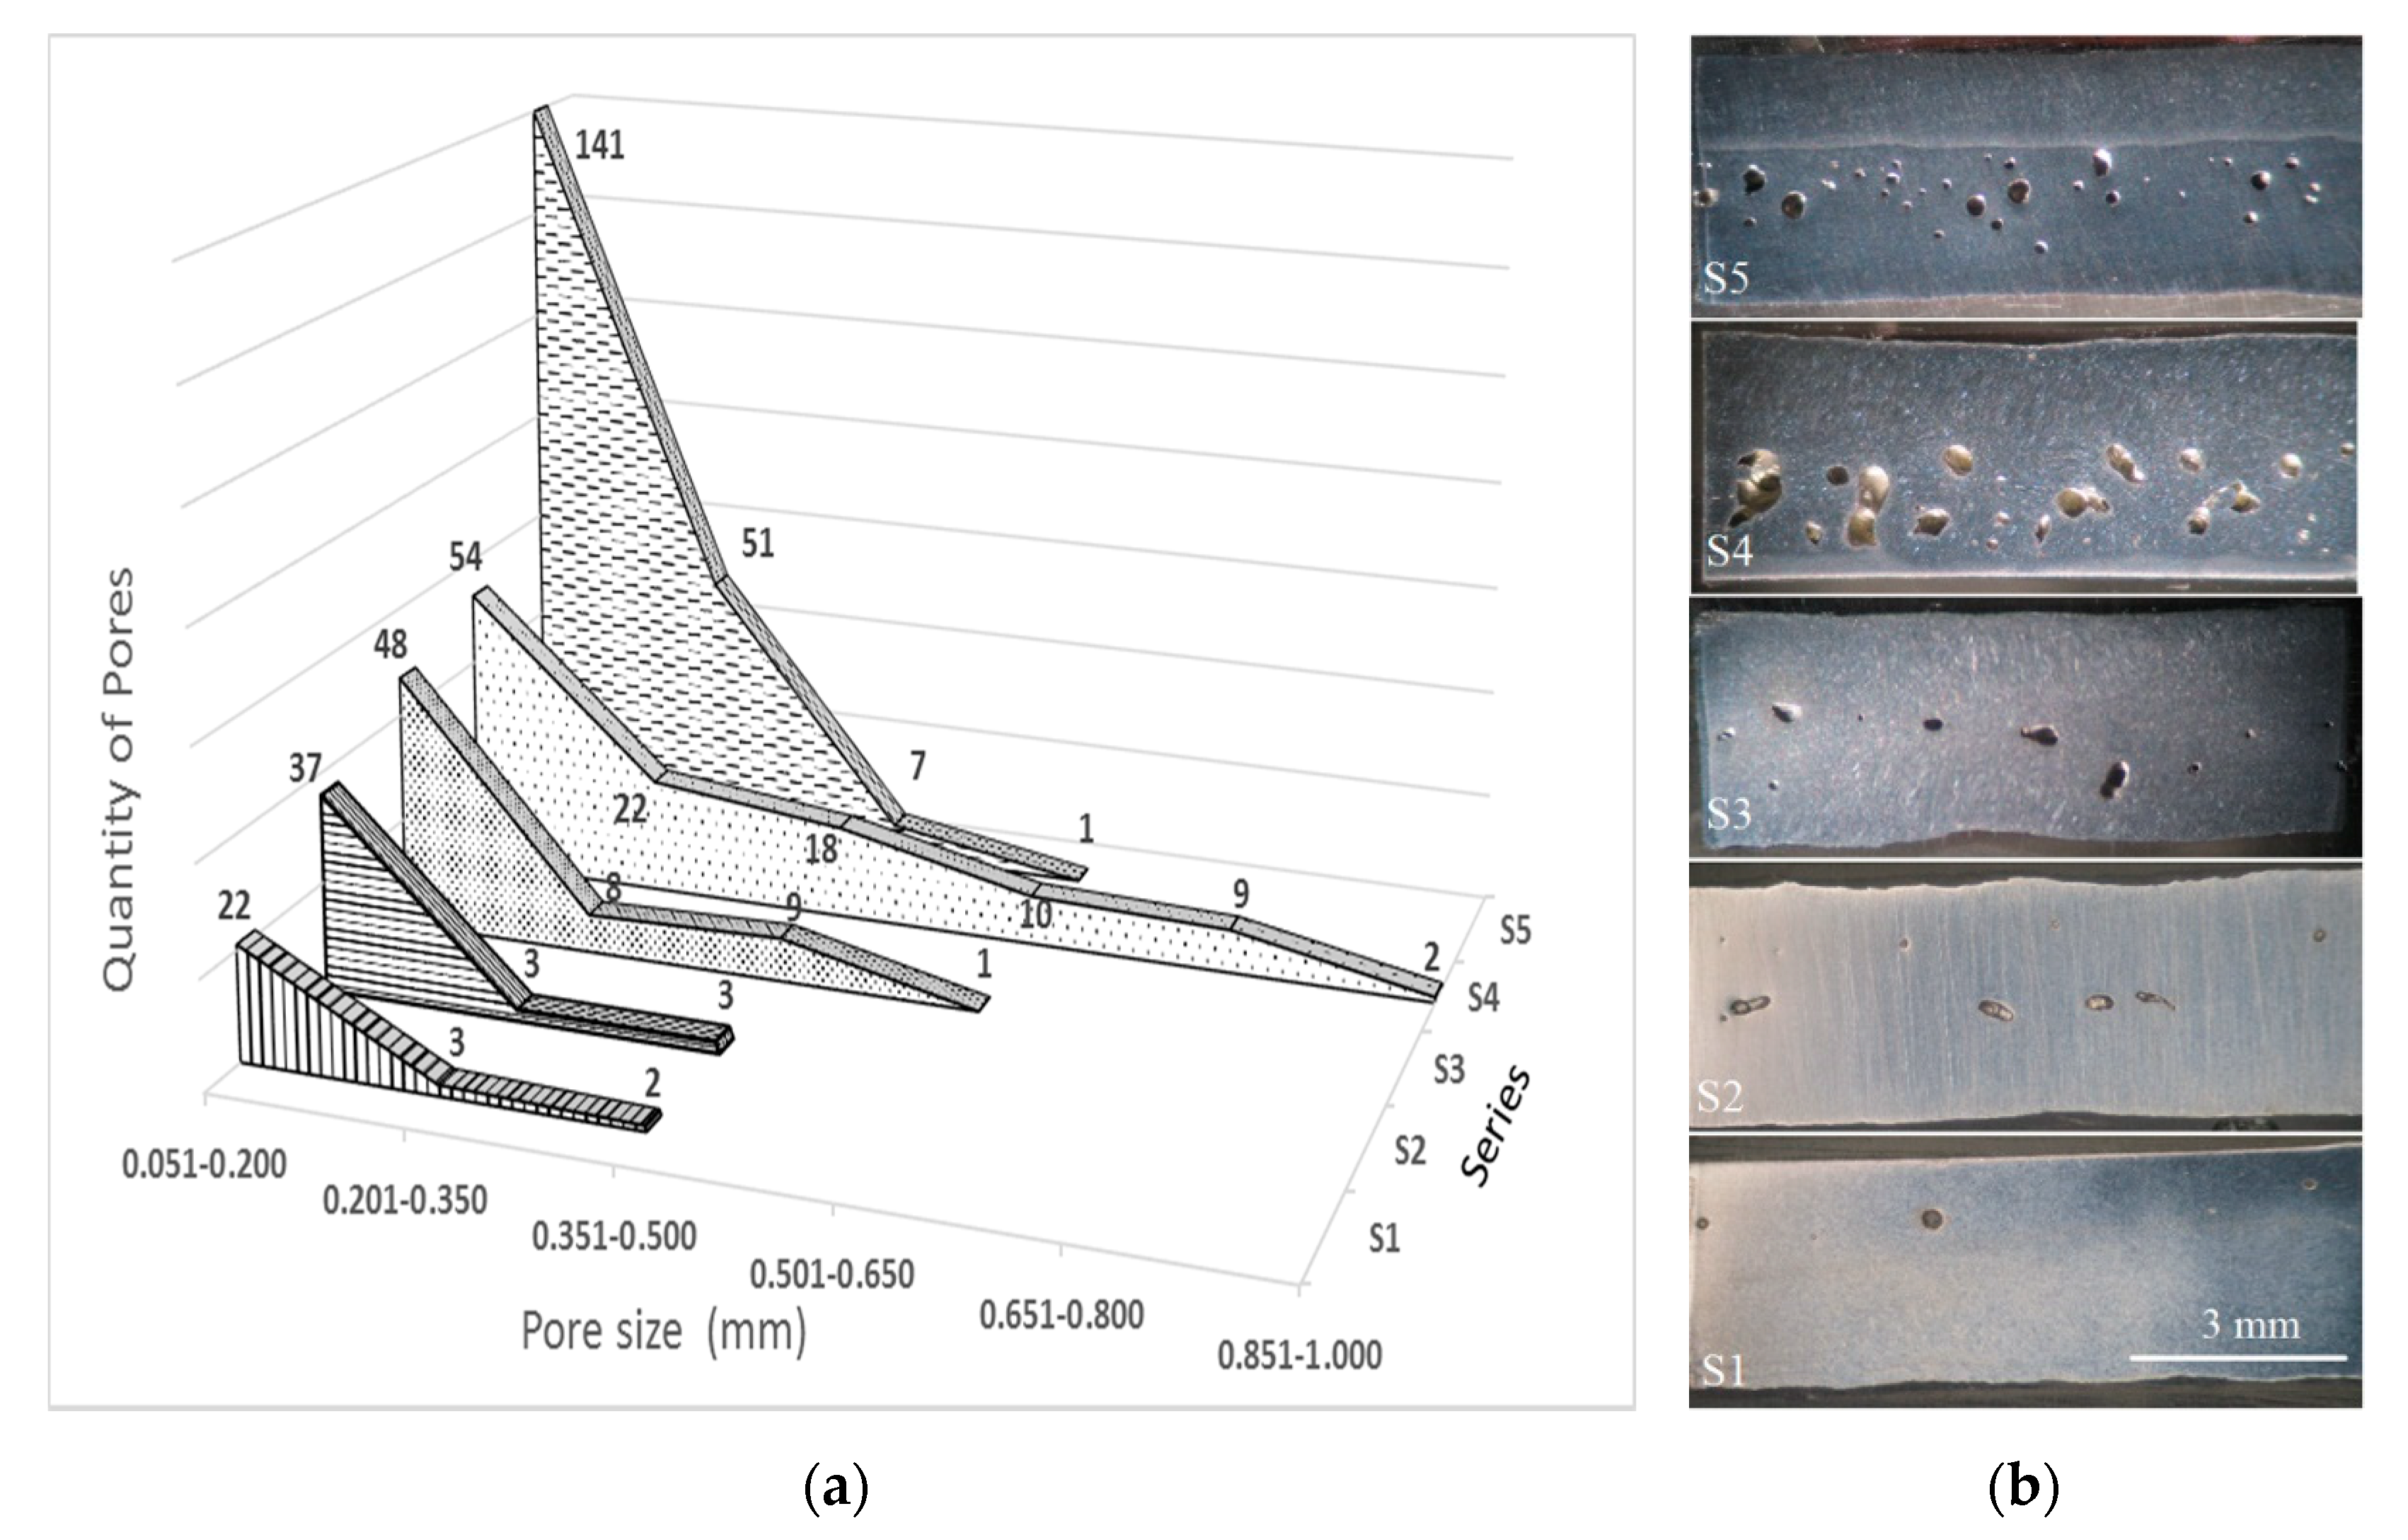
Table 6 and Figure 5 show the quantity, size, distribution and typical aspect of pores found in a section along the weld axis in the center of the FZ for each series. The measured weld length was 54 mm and the area projected was evaluated with the actual distribution of pores assuming round pores with a diameter equal to its size.
In general, the results show that the increase in the quantity and size of pores is consistent with the decrease in the HI as was found in the work [34]. There was a significant increase in porosity in the S4 and S5 series as well as a tendency to linear porosity. In the S4 series, the number and size of pores increased while in the S5 series only the number of pores increased. The high porosity of the S4 and S5 series is explained by the instability of keyhole mode and the trapping of gases that is characteristic of partial penetration joints [33]. In the case of the S5 series, the weld pass in the bottom side (of low HI) reduced porosity that was produced by the weld pass on the top side. In relation to the pore sizes, in two studies on welded joints in steel, maximum pore sizes of 0.5 mm [35] and 1 mm [36] were reported, which agrees with the maximum pore sizes found in the present work.
3.3.2. Undercuts
In [37], several types of undercuts are reported however some of those types can be similar to other imperfections as underfill or shrinkage groove according to the guidelines of the ISO 13919-1 welding quality standard [30]. In this study, the undercut will be identified as the groove with narrow width at the weld toe or at the weld root. According to the results, intermittent undercuts were localized in both sides in the weld root for S1, S2 and S3 series while for the S4 and S5 series imperfections with these characteristics practically were not observed.
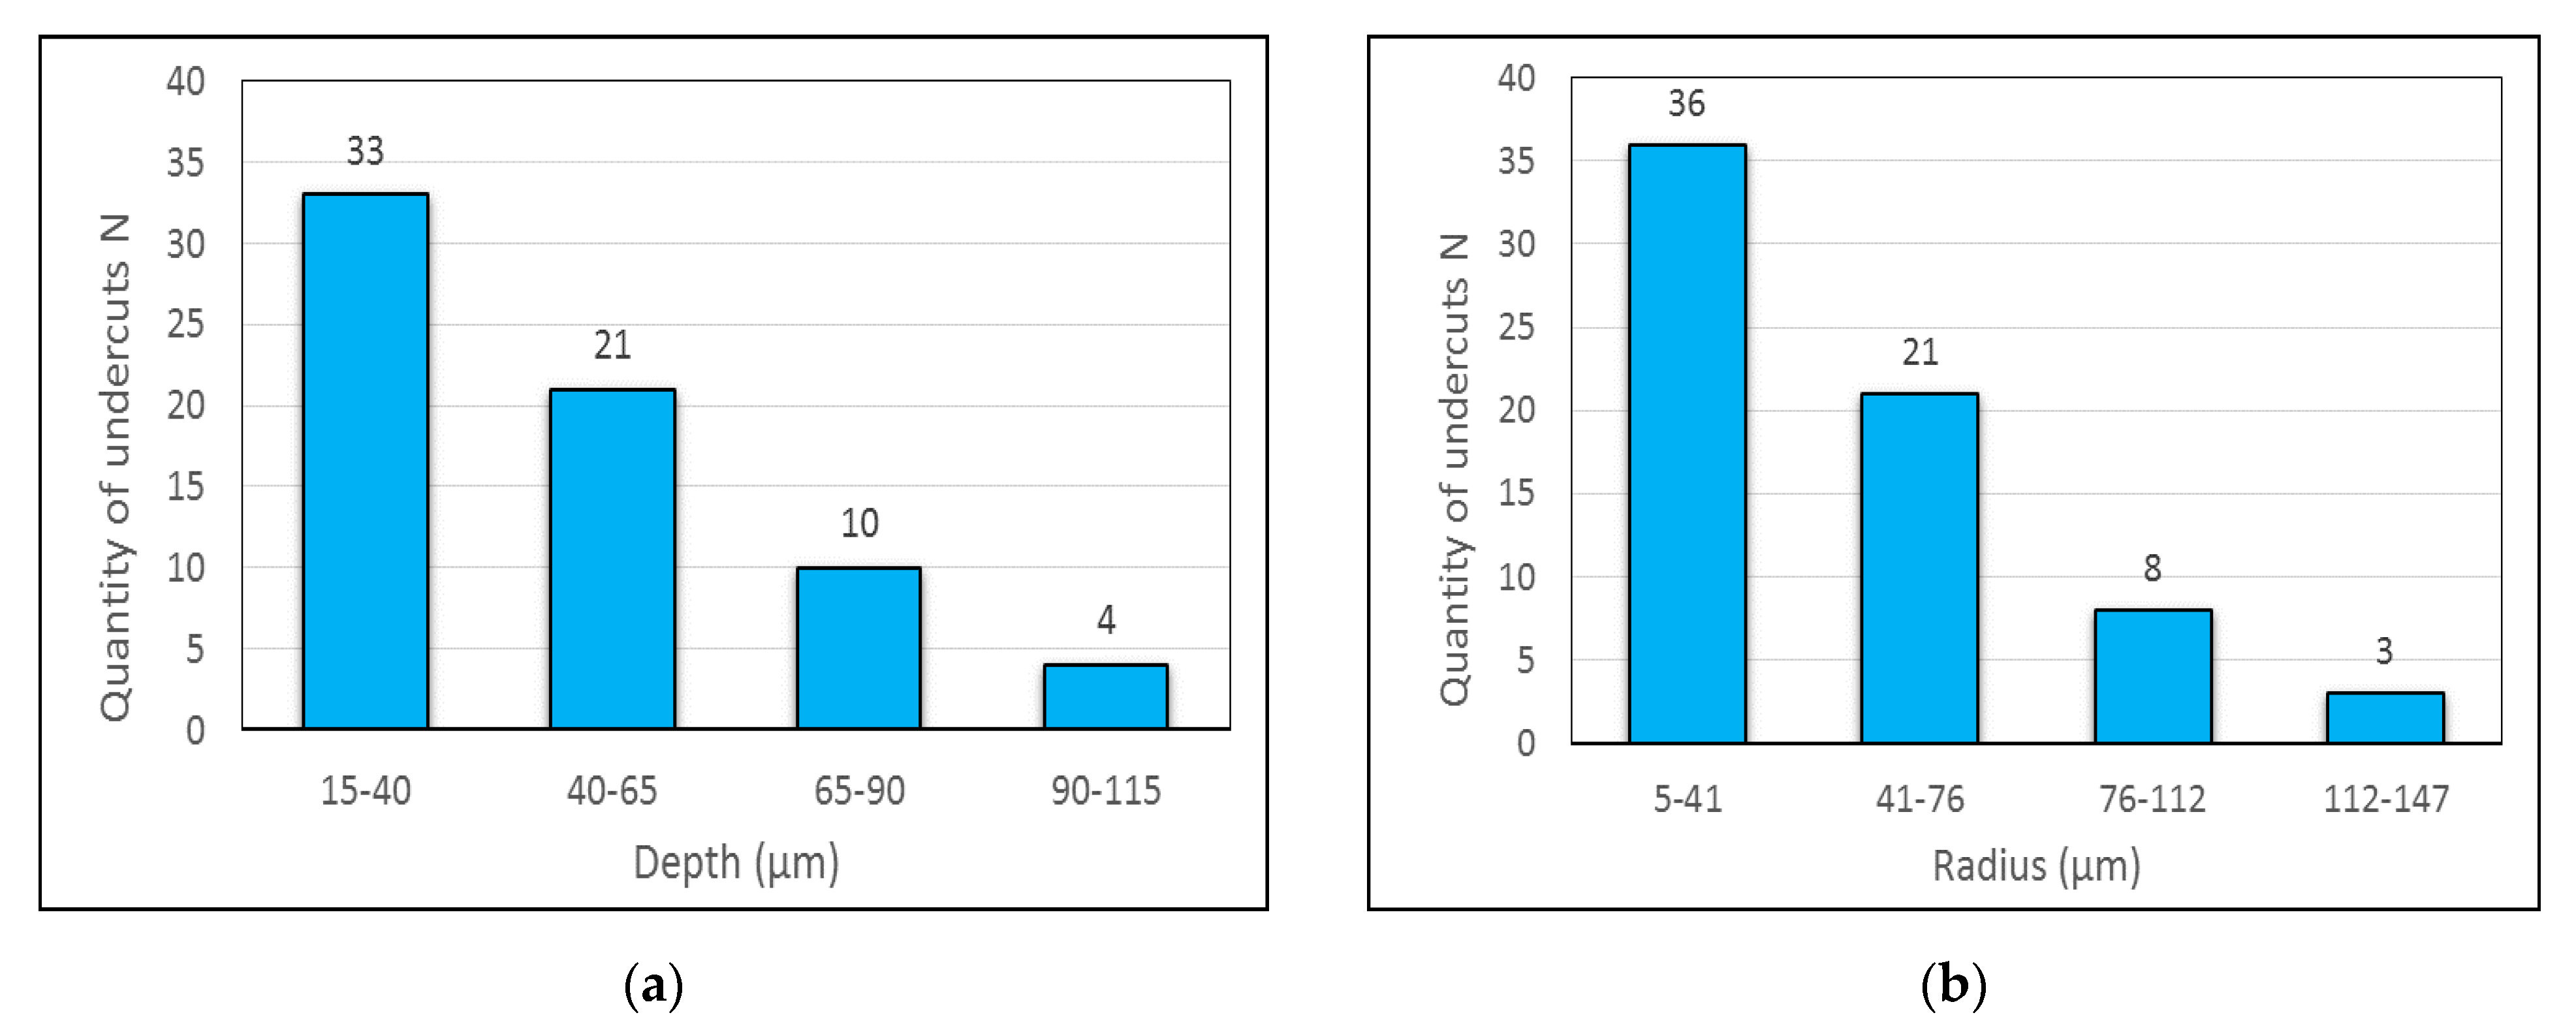
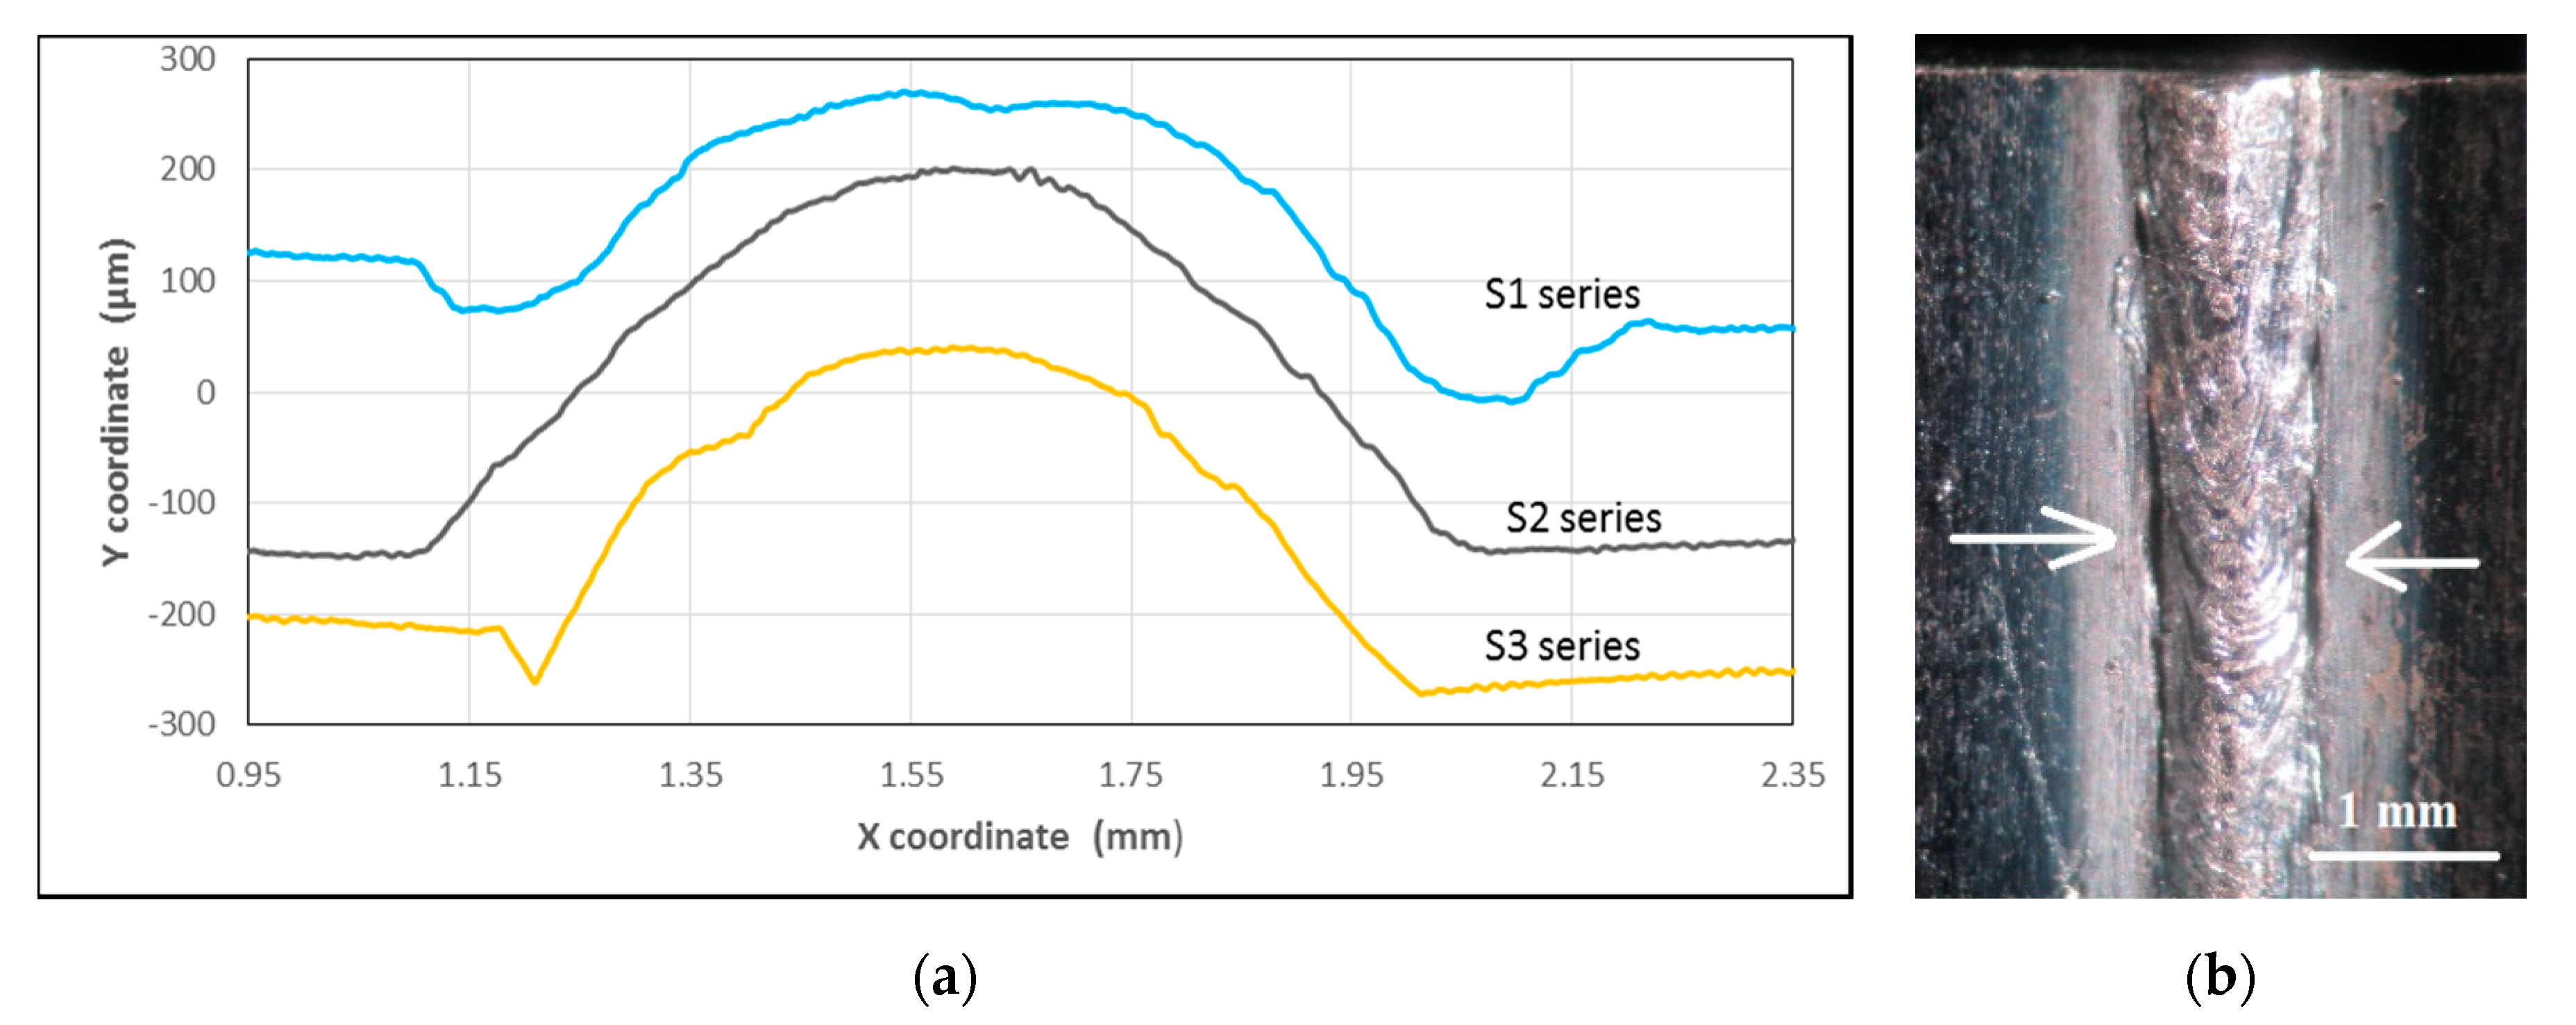
Table 7 shows various parameters of the undercut geometry found for the three series, while in Figure 6a,b, the distributions of depth and radius respectively for the mentioned series are shown. Figure 7a illustrates the weld roots with and without undercuts captured by the profilometer and Figure 7b shows the appearance of undercuts in a photograph.
From Table 7 and the distributions of Figure 6, the following can be highlighted: in general, the series have relatively shallow undercuts with very small radii and wide lengths; there is a tendency to increase the quantity, radius and length of the undercuts with increasing the HI, while the depth turned out to be similar for the three series and; the S2 series showed a considerable reduction in the number of undercuts. Due to this last fact, the root was examined with a higher magnification of the stereo-microscope finding micropores along the root of this series. The separation between undercuts was also determined in the base of the c-specimen, finding a great dispersion from 0.24 to 8.44 mm, with a mean of 2.68 mm.
As illustrated in Figure 7a, relatively the undercuts may be wide and rounded but also narrow crack-like. From the point of view that considers the undercuts as cracks, these would have very low aspect ratios (a/c) [22]. It should also be noted in Table 7 that the depth-to-radius ratios of the series are underestimated if they would be calculated through the corresponding mean values of depth and radius.
In the studies [25,37], the causes and mechanisms of undercut formation in laser welding were analyzed: high welding speeds, a combination of high power and high welding speeds, surface oxides and process instability appear as some of the causes. In the present study, the significant decrease in undercuts in the S2 series suggests that may be due to the combination of low power and low welding speed.
3.3.3. Variation of the Underfill along the Weld Axis
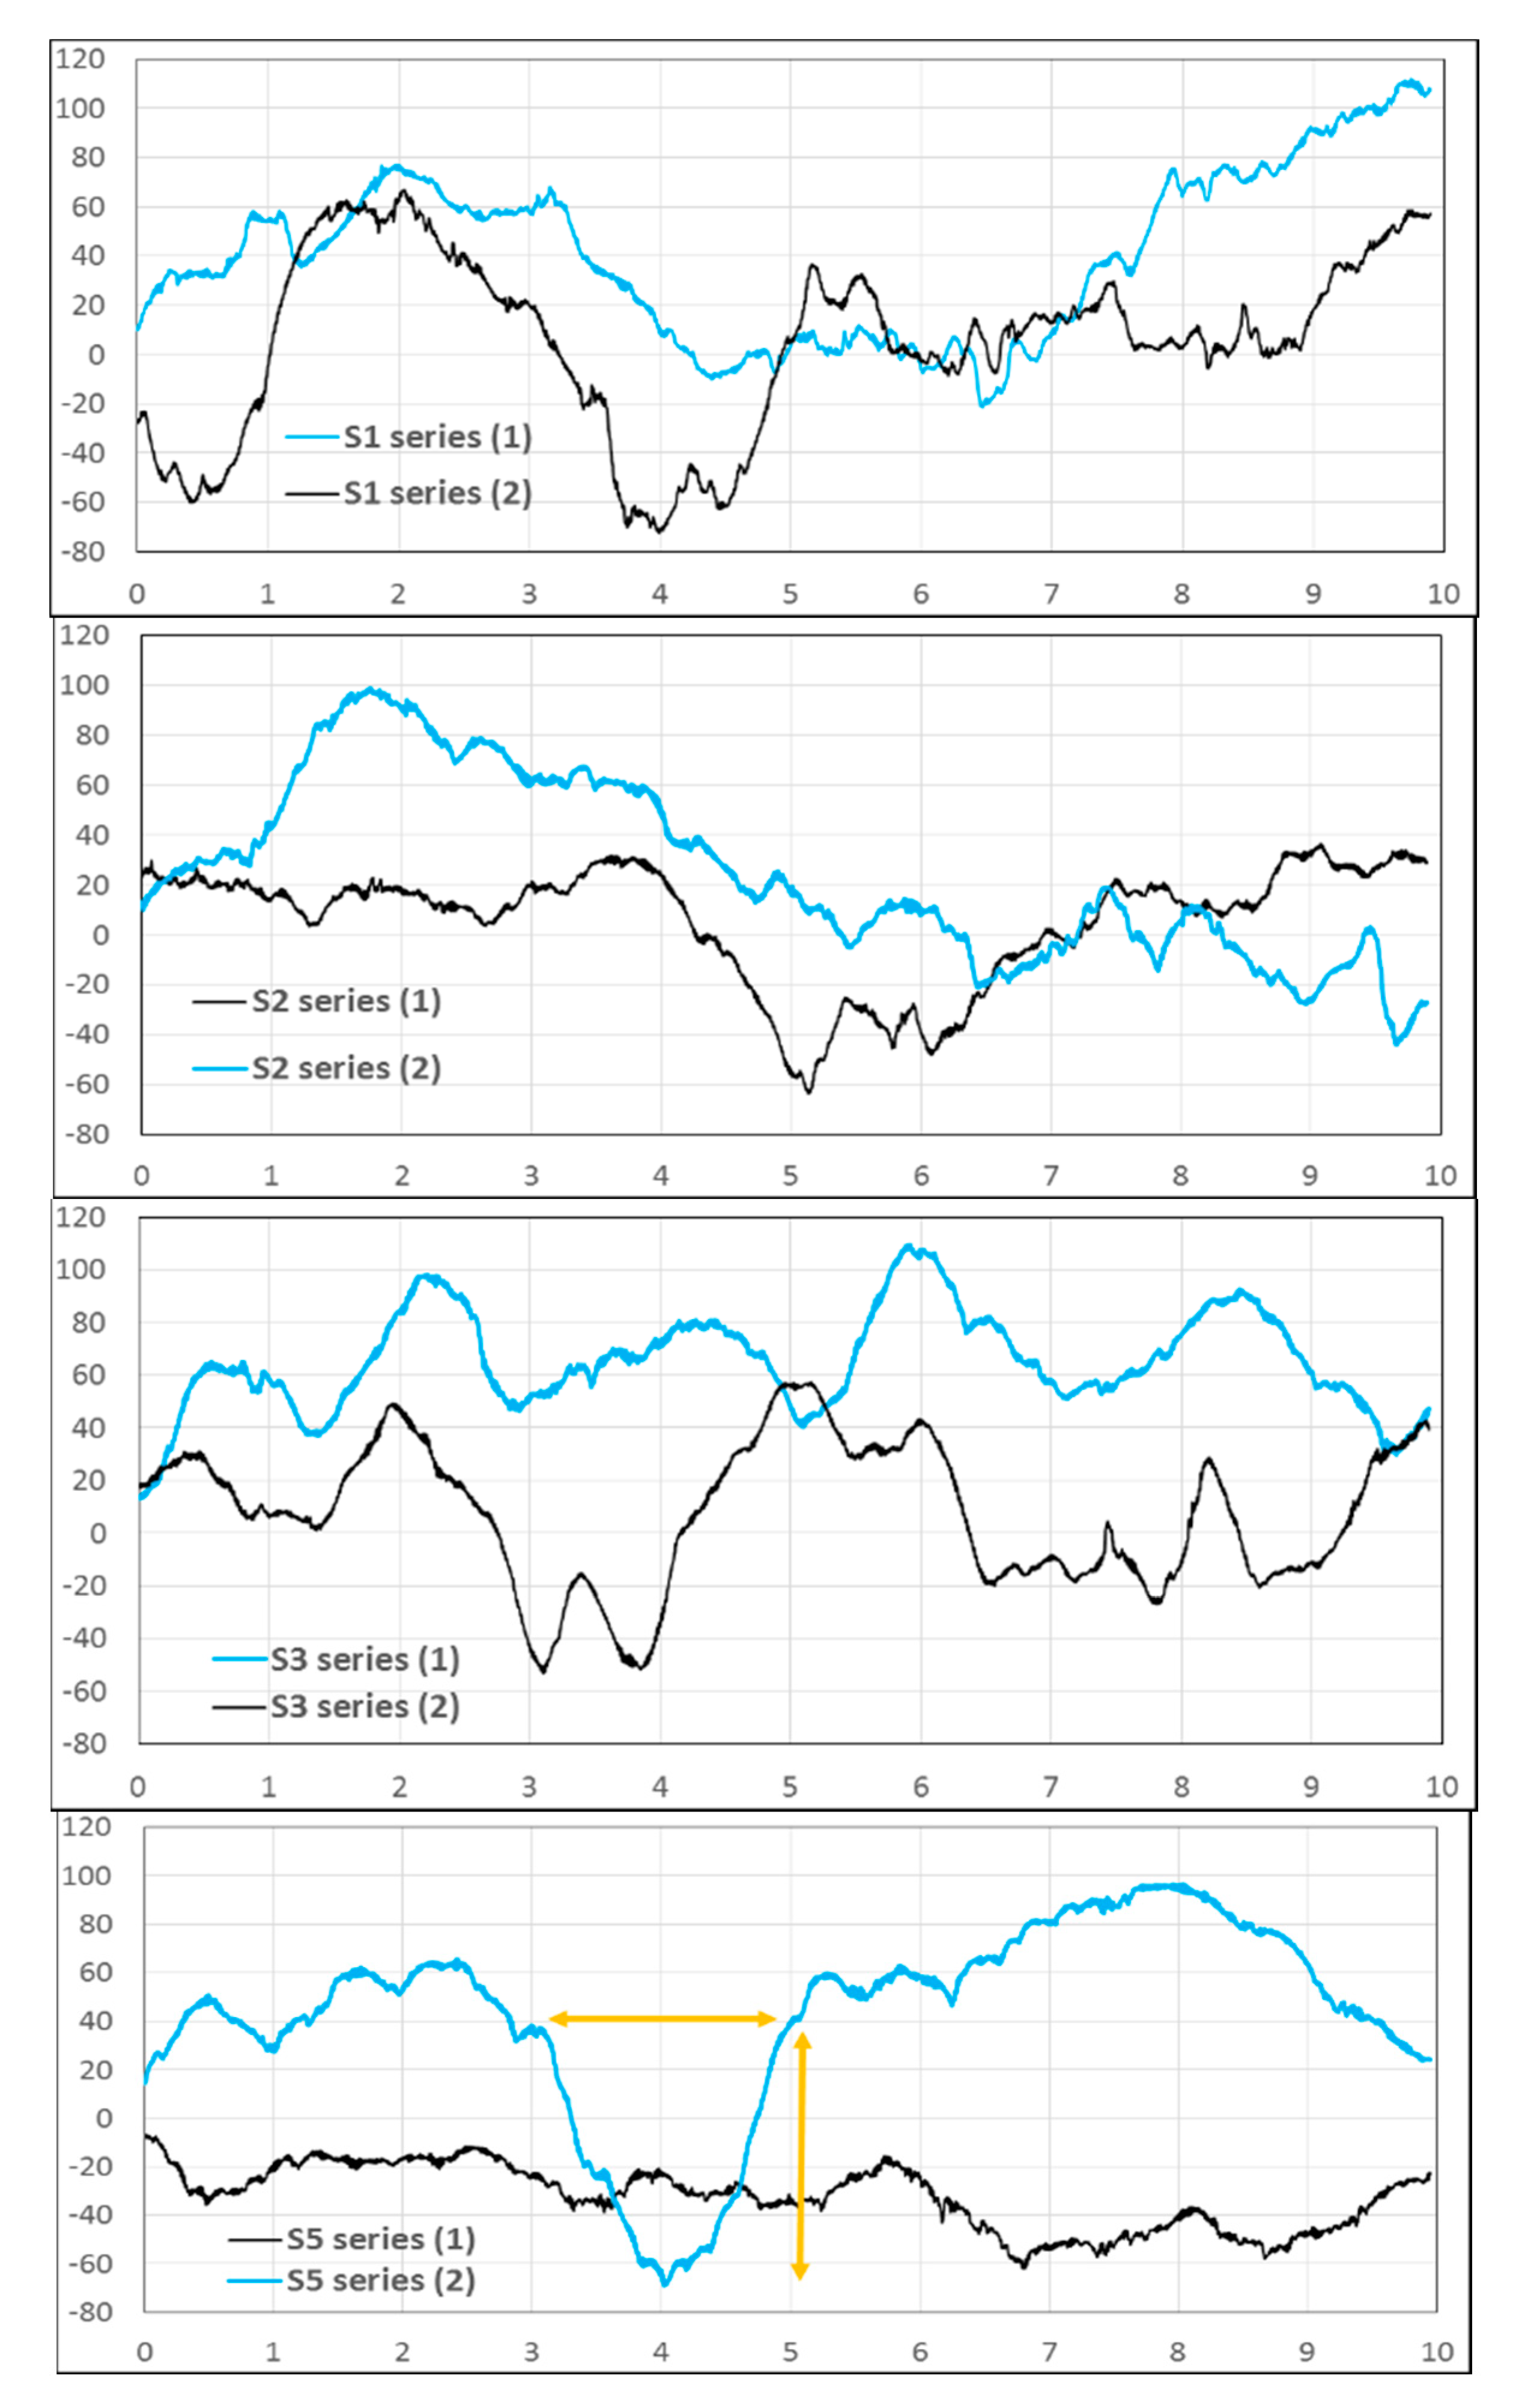
As reviewed in the literature, the interaction of weld ripples and the weld toe can cause the initiation and reduction of life to fatigue. According to the results obtained in this work, there is a great variation of the weld profile along the weld axis and underfill in the S1, S2, S3 and S5 series. Therefore, it can be inferred that the underfill together with the weld ripples could be stress concentration sites where fatigue starts. For the aforementioned series, two weld profiles were captured along the sites where the underfill was observed, these two profiles (blue line and black line) are shown in Figure 8.
In Figure 8, the profiles present a high variation of the height along the weld axis, although for the S2 and S5 series it tends to decrease. The formation of deep (about 100 µm) and long (2 to 4 mm) depressions (as the mark with arrow lines) that could have an effect similar to undercuts is also observed in all series. The height and length of depressions, as illustrated in Figure 8, could be parameters to consider in the combined effect between weld ripples and underfill.
3.4. Evaluation of Imperfections
Based on the results presented in the previous sections, for the complete penetration joints, Table 8 shows an evaluation of the imperfections found, taking, as a guide, the standard ISO 13919-1 [30]. This standard proposes three quality levels for steels: B stringent, C intermediate and D moderate. The quality levels for each imperfection in Table 8 are determined by comparing the maximum values found (Table 4, Table 6 and Table 7) with the limit values according to the quality standard for 3 mm thickness.
The quality level for the series, as shown in Table 8, generally speaking, is B, however by porosity, the S5 series is D level. It should also be noted that the linear porosity imperfection requires being measured in a greater length for a better evaluation and that the weld beads can present multiple-imperfections as shown in Figure 2.
Without considering porosity, according to the quality standard mentioned, the S1, S2, S3 and S5 series have practically the same quality level, however, the series can be evaluated taking into account the effect of imperfections and profile on fatigue behavior in terms of the SCF. For the determination of SCF values, two expressions proposed in [23] were used. Expression (1) for undercut and underfill and Expression (2) for excessive penetration or excess weld metal were modified to the nomenclature used in this work:
In Expression (1), hu, ru and φ are the depth, radius and groove angle of the undercut. For underfill as depth was assumed the value hi and as radius the corresponding radius r1. According to the results in [23], the variation of the angle φ within the range of 40 to 130 degrees caused a minimal change in Ktu, therefore in this work, a constant angle of 90 degrees was assumed for the calculation. In Expression (2), hb is the excessive penetration or excess weld metal, lb the width, r the transition radius, (180−θ) the flank angle and t the thickness of the plate.
Figure 9 summarizes the SCF values found on both sides of the weld beads for all series. The values of the profiles correspond to underfill, excessive penetration or reinforcement as appropriate to each series, while for the S2 series, due to the fact that it had almost no undercuts, the corresponding SCF value is not shown. The values obtained were based on the means of Table 3 and Table 7. Figure 9 also shows the porosity percentage for each series.
The results of Figure 9 show a greater effect of undercuts than the profiles, that there are small differences between b-profiles and t-profiles and therefore a similar effect by excessive penetration, excess weld metal or by underfill, although a certain difference exists for the S5 series, and the least affected profile by underfilling corresponds to S1 series. Due to the interaction between the profile and the undercut, in the S3 and S1 series, the detriment to fatigue resistance could be further increased. In relation to porosity, the S5 series would be the most affected. When individually evaluating the series, considering a lesser effect by porosity than by undercuts or profiles, the order of affectation in the fatigue strength, would be: S3, S1, S5 and S2.
3.5. Analysis of Variance
The ANOVA will be applied to confirm that the small differences observed between the means of the geometric parameters of the welded series (Table 5 and Table 4) are the effect of the different laser welding parameters used for each series and not due to sampling fluctuation. On the other hand, given that the factorial design allows to separate the effects of the main factors (power and welding speed) of the interaction and since the HI is an important parameter in any welding process, it is convenient to evaluate the effect of these parameters on the weld bead geometry. Therefore, taking the width W as representative of weld bead geometry in order to validate the results two analyses are developed.
The first analysis focuses on proving that the HI is an influencing factor in the width W and that the differences between the means of width W respond to the different levels of HI, for the aforementioned, Table 9 shows the four observations for each level of HI, the means, the differences between means and the LSD value that allow the comparisons according to Fisher LSD method [38], while Table 10 is the ANOVA Table.
Following the common procedure, to test the hypothesis that the HI does not affect the mean of width W, using a level of significance of 0.05, with f (0.05, 3, 12) = 3.490, and observing that 3.490 < 8.383 (F0 value), the hypothesis is rejected, and therefore the HI significantly affects the mean of W. On the other hand, the P-value 0.0028 < 0.05, confirms that the HI influences the width W. The previous analysis also implies that some means of the width W are different by the treatments HI, and according to the Fisher LSD method, the above is verified when the difference of means is greater than the LSD value 0.087 mm. Therefore, there are differences between the means for all series except for the difference W4-W3, however, this result is affected by the fact that the S4 series is a partial penetration joint.
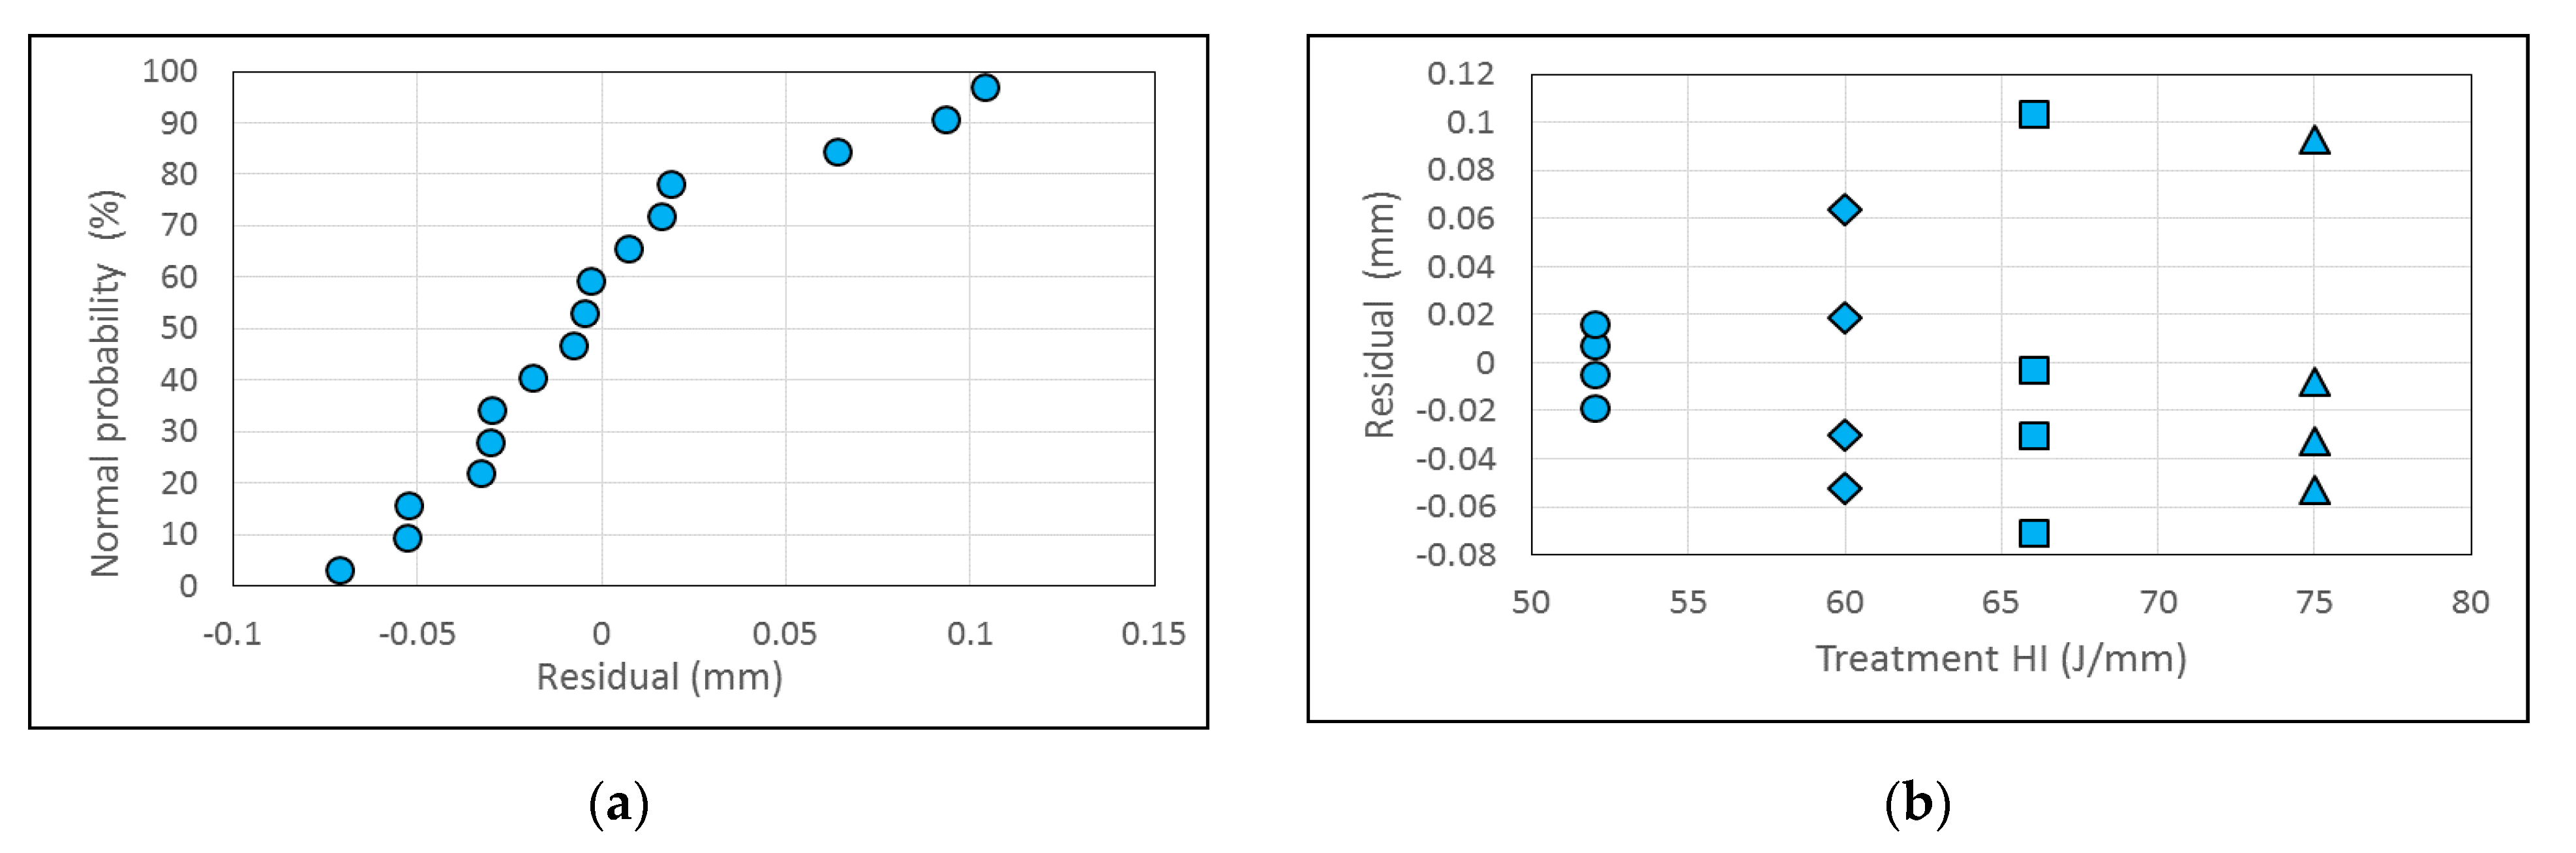
Finally, the residuals analysis shows a small deviation of the normality assumption in the high values (Figure 10a) and a small range of variance in the S4 series (Figure 10b) compared to the other series. The latter may be due both to the fact that the S4 series is a partial penetration joint and that the four observations correspond to two samples.
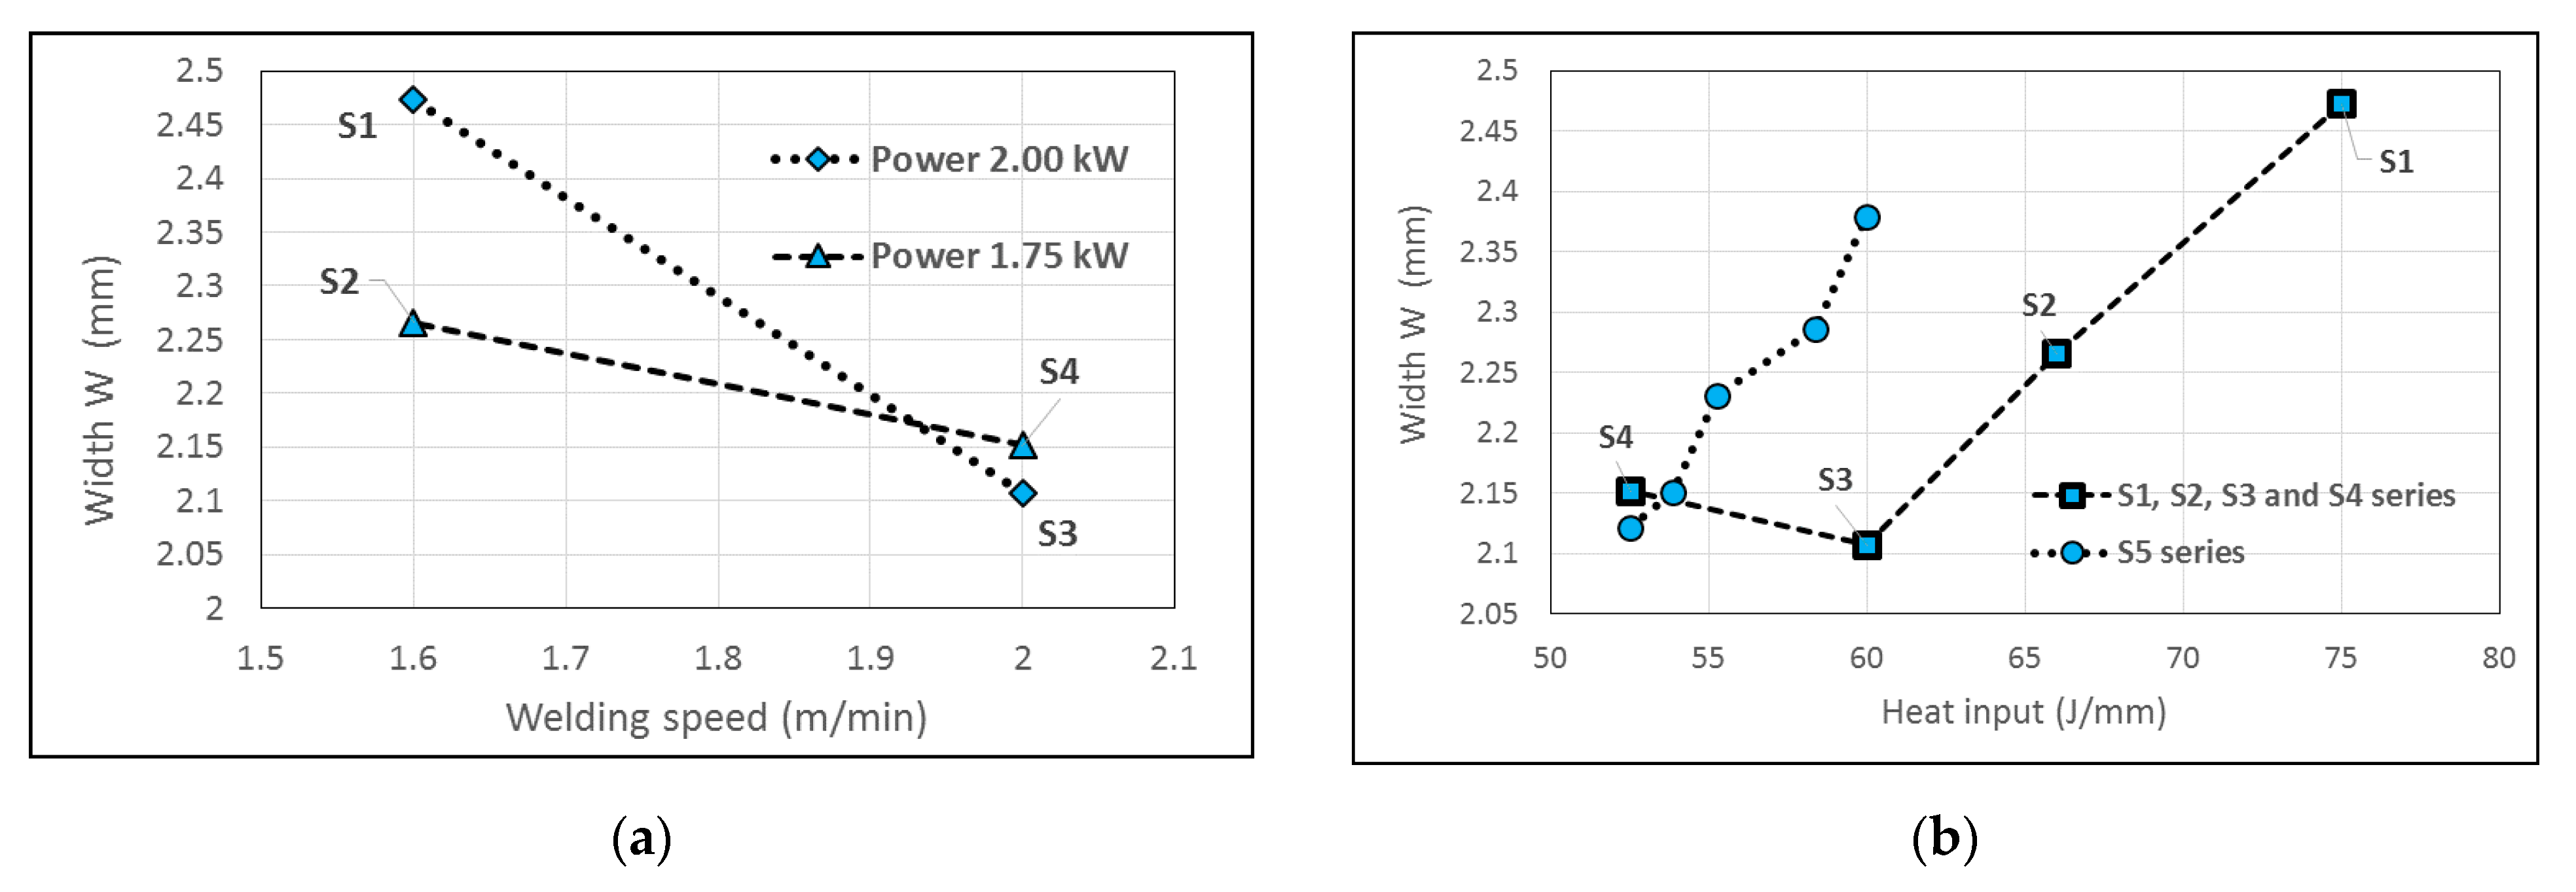
For the second analysis, Table 11 is the ANOVA table for factorial design also applied to width W and shows that all F0 values exceed the value f (0.05, 1, 12) = 4.747, therefore the two main factors and their interaction affect the width W, however, the welding speed prevails over the interaction and the power. The small p-value for the welding speed confirms its strong influence. In concordance to Table 11, in Figure 11a, the interaction between factors is seen, however, it must be taken into account that this result is influenced by the partial penetration of the S4 series. For this last reason, in Figure 11b, which shows the graph of width W as a function of the HI, the width W of the S4 series does not follow the same trend as the other series.
Figure 11b also includes the widths W corresponding to the five samples of the S5 series and considering the width W of the S4 series with the widths W of the S5 series due to the fact that the two series did not achieve full penetration with a single pass weld, it is verified that for both complete penetration and partial penetration there is an approximately linear relationship between width W and HI. Lastly, since it was tested that the different levels of HI generate different widths W, when noting that those levels of HI are combinations of different welding parameters, it is therefore verified that results are effect the different laser welding parameters used for each series.
4. Conclusions
This study, emphasizing the effect of imperfections and weld bead geometry on fatigue strength, describes in detail these two factors for five series of butt joints in a thin HSLA steel plate welded within a small range of welding parameters. The following conclusions can be drawn:
- In the case of small weld beads, the profilometer proved to be a good alternative for capturing 2D profiles due to its accuracy, simplicity and speed in contrast to other techniques and procedures that may be more complex and expensive. Adding a few geometric parameters to those commonly needed to evaluate the main imperfections and with two proposed idealized profiles, the actual profile of the weld beads or those based on mean values of each welded series can be faithfully modeled, making it possible to use it in subsequent analyses, such as the stress-concentrating effect.
- The welded series showed multiple-imperfections. For single-welded joints, the most severe imperfections were concentrated at the weld root: intermittent undercuts, shallow (depth: 15–114 µm) but sharp (radius: 5–147 µm); high flank angles (60–21 degrees), high excessive penetration (0.11–0.53 mm) and small radius at the toe (0.01–0.32 mm). For all complete penetration joints: underfill (0.03–0.32 mm) and long depressions (similar to undercuts) on its surface along the weld axis. Particularly high porosity for partial penetration joint (7.6%) and double-welded joint (3.5%).
- The evaluation of the weld quality according to the ISO 13919-1 standard determined that all the evaluated series, in general, had a B level, however, the S5 series, due to porosity, had a D level. While focusing the evaluation on the stress-concentrating effect in fatigue strength, it was found that there may be a greater detriment due to undercuts than to profiles; that is more critical the weld side where there was excessive penetration and undercuts and that considering additionally the porosity but without taking into account the S4 series, the order of detriment of the fatigue strength in the series can be the following: S3, S1, S5 and S2.
- The ANOVA applied to geometric characteristics such as the width W showed that the effect of welding speed was the most significant; confirmed that the differences in the widths W between the welded series are due to the different levels of HI and therefore to the combinations of welding parameters used in each series and that there was an approximately linear relationship between the width W and the HI.
Author Contributions
Conceptualization, P.G.R. and J.A.M.F.; methodology, P.G.R., C.A.C. and J.A.M.F.; acquisition, analysis and interpretation of data, P.G.R., C.A.C. and J.A.M.F.; writing—original draft preparation, P.G.R.; writing—review and editing, P.G.R., C.A.C. and J.A.M.F. All authors have read and agreed to the published version of the manuscript.
Funding
This research is sponsored by FEDER funds through the program COMPETE-Programa Operacional Factores de Competitividade and by National funds through FCT-Fundaçao para a Ciência e Tecnologia, under the project UIDB/00285/2020.
Acknowledgments
The authors acknowledge the support provided by the Universidad de las Fuerzas Armadas-ESPE with the PhD scholarship and by Mário Da Costa Martins and Fernando Meireles of the Orthopedia Medica company where laser welding was done.
Conflicts of Interest
The authors declare to have no conflicts of interest.
References
- Ahiale, G.; Oh, Y. Microstructure and fatigue performance of butt-welded joints in advanced high strength steels. Mater. Sci. Eng. A 2014, 597, 342–348. [Google Scholar] [CrossRef]
- Xu, W.; Westerbaan, D.; Nayak, S.; Chen, D.; Goodwin, F.; Zhou, Y. Tensile and fatigue properties of fiber laser welded high strength low alloy. Mater. Des. 2013, 43, 373–383. [Google Scholar] [CrossRef]
- Lieurade, H.P.; Huther, I.; Lefebvre, F. Effect of Weld Quality and Postweld Improvement Techniques on the Fatigue Resistance of Extra High Strength Steels. Weld. World 2008, 52, 106–115. [Google Scholar] [CrossRef]
- Lillemäe, I.; Remes, H.; Liinalampi, S.; Itävuo, A. Influence of weld quality on the fatigue strength of thin normal and high strength steel butt joints. Weld. Word 2016, 60, 731–740. [Google Scholar] [CrossRef]
- Mashiri, F.R.; Zhao, X.L.; Grundy, P. Effects of weld profile and undercut on fatigue crack propagation life of thin-walled cruciform joint. Thin-Walled Struct. 2001, 39, 261–285. [Google Scholar] [CrossRef]
- Cerit, M.; Kokumer, O.; Genel, K. Stress concentration effects of undercut defect and reinforcement metal in butt welded joint. Eng. Fail. Anal. 2010, 17, 571–578. [Google Scholar] [CrossRef]
- Liinalampi, S.; Remes, H.; Romanoff, J. Influence of three-dimensional weld undercut geometry on fatigue-effective stress. Weld. World 2019, 63, 277–291. [Google Scholar] [CrossRef] [Green Version]
- Schork, B.; Zerbst, U.; Kiyak, Y.; Kaffenberger, M.; Madia, M.; Oechsner, M. Effect of the parameters of weld toe geometry on the FAT class as obtained by means of fracture mechanics-based simulations. Weld. World 2020, 64, 925–936. [Google Scholar] [CrossRef]
- Kim, D.Y.; Hwang, I.; Jeong, G.; Kang, M.; Kim, D.; Seo, J.; Kim, Y. Effect of Porosity on the Fatigue Behavior of Gas Metal ArcWelding Lap Fillet Joint in GA 590 MPa Steel Sheets. Metals 2018, 8, 241. [Google Scholar] [CrossRef] [Green Version]
- Gou, G.; Zhang, M.; Chen, H.; Chen, J.; Li, P.; Yang, Y.P. Effect of humidity on porosity, microstructure, and fatigue strength of A7N01S-T5 aluminum alloy welded joints in high-speed trains. Mater. Des. 2015, 85, 309–317. [Google Scholar] [CrossRef]
- Hu, Y.N.; Wu, S.C.; Song, Z.; Fu, Y.N.; Yuang, Q.X.; Zhang, L.L. Effect of microstructural features on the failure behavior of hybrid laser welded AA7020. Fatigue Fract. Eng. Mater. Struct. 2018, 41, 2010–2023. [Google Scholar] [CrossRef]
- Han, X.; Yang, Z.; Ma, Y.; Shi, C.; Xin, Z. Porosity distribution and mechanical response of laser-MIG hybrid butt welded 6082-T6 aluminum alloy joint. Opt. Laser Technol. 2020, 132, 1–11. [Google Scholar] [CrossRef]
- Yan, S.; Zhu, Z.; Ma, C.; Qin, Q.; Chen, H.; Fu, Y.N. Porosity formation and its effect on the properties of hybrid laser welded Al alloy joints. Int. J. Adv. Manuf. Technol. 2019, 104, 2645–2656. [Google Scholar] [CrossRef]
- Leiner, M.; Murakami, Y.; Farajian, M.; Remes, H.; Stoschka, M. Fatigue Strength Assessment of Welded Mild Steel Joints Containing Bulk Imperfections. Metals 2018, 8, 1–15. [Google Scholar]
- Wang, X.; Meng, Q.; Hu, W. Continuum damage mechanics-based model for the fatigue analysis of welded joints considering the effects of size and position of inner pores. Int. J. Fatigue 2020, 139, 1–10. [Google Scholar] [CrossRef]
- Biswal, R.; Syed, A.; Zhang, X. Assessment of the effect of isolated porosity defects on the fatigue performance of additive manufactured titanium alloy. Addit. Manuf. 2018, 23, 433–442. [Google Scholar] [CrossRef]
- Nguyen, N.; Wahab, M. The Effect of Undercut and Residual Stresses on Fatigue Behaviour of Misaligned Butt Joints. Eng. Fract. Mech. 1996, 55, 453–469. [Google Scholar] [CrossRef]
- Lillemäe, I.; Lammi, H.; Molter, L.; Remes, H. Fatigue strength of welded butt joints in thin and slender specimens. Int. J. Fatigue 2012, 44, 98–106. [Google Scholar] [CrossRef]
- Alam, M.; Barsoum, Z.; Jonsén, P.; Kaplan, A.; Häggblad, H. The influence of surface geometry and topography on the fatigue cracking behaviour of laser hybrid welded eccentric fillet joints. Appl. Surf. Sci. 2010, 256, 1936–1945. [Google Scholar] [CrossRef]
- Chapetti, M.D.; Otegui, J.L. Importance of toe irregularity for fatigue resistance of automatic welds. Int. J. Fatigue 1995, 17, 531–538. [Google Scholar] [CrossRef]
- Schork, B.; Kucharczyk, P.; Madia, M.; Zerbst, U.; Hensel, J.; Bernhard, J.; Tchuindjang, D.; Kaffenberger, M.; Oechsner, M. The effect of the local and global weld geometry as well as material defects on crack initiation and fatigue strength. Eng. Fract. Mech. 2018, 198, 103–122. [Google Scholar] [CrossRef]
- Otegui, J.; Kerr, H.; Burns, D.; Mohaupt, U. Fatigue Crack Initiation from Defects at Weld Toes in Steel. Int. J. Press. Vessel. Pip. 1989, 38, 385–417. [Google Scholar] [CrossRef]
- Remes, H.; Varsta, P. Statistics of weld geometry for laser-hybrid welded joints and its application within notch stress approach. Weld. World 2010, 54, R189–R207. [Google Scholar] [CrossRef]
- Kawahito, Y.; Mizutami, M.; Katayama, S. Elucidation of high-power fibre laser welding phenomena of stainless steel and effect of factors on weld geometry. J. Phys. D Appl. Phys. 2007, 40, 5854–5859. [Google Scholar] [CrossRef]
- Eriksson, I.; Powell, J.; Kaplan, A.F. Measurements of fluid flow on keyhole front during laser welding. Sci. Technol. Weld. Join. 2011, 16, 636–641. [Google Scholar] [CrossRef]
- Guo, W.; Crowther, D.; Francis, J.; Thompson, A.; Liu, Z.; Li, L. Microstructure and mechanical properties of autogenous laser welded S960 high strength steel. Mater. Des. 2015, 85, 534–548. [Google Scholar] [CrossRef]
- Ai, Y.; Jiang, P.; Shao, X.; Wang, C.; Li, P.; Mi, G.; Liu, Y.; Liu, W. An optimization method for defects reduction in fiber laser keyhole welding. Appl. Phys. A Mater. 2016, 122, 1–14. [Google Scholar]
- Khan, M.; Romoli, L.; Fiaschi, M.; Dini, G.; Sarri, F. Experimental design approach to the process parameter optimization for laser welding of martensitic stainless steels in a constrained overlap configuration. Opt. Laser Technol. 2011, 43, 158–172. [Google Scholar] [CrossRef]
- Fricke, W. IIW Recommendations for the Fatigue Assessment of Welded Structures by Notch Stress Analysis; Woodhead Publishing Limited: Cambridge, UK, 2012. [Google Scholar]
- ISO. Welding-Electron and Laser-Beam Welded Joints-Guidance on Quality Levels for Imperfections; Part 1: Steel; ISO 13919-1(1996); ISO: Geneve, Switzerland, 1996. [Google Scholar]
- Strenx® 700 MC. Available online: https://www.ssab.com/products/brands/strenx/products/strenx-700-mc (accessed on 1 February 2019).
- Riofrío, P.; Capela, C.; Ferreira, J.; Ramalho, A. Interactions of the process parameters and mechanical properties of laser butt welds in thin high strength low alloy steel plates. Proc. Inst. Mech. Eng. Part L J. Mater. Des. Appl. 2020, 234, 665–680. [Google Scholar] [CrossRef]
- Matsunaga, A. Problems and solutions in deep penetration laser welding. Sci. Technol. Weld. Join. 2001, 6, 351–354. [Google Scholar] [CrossRef]
- Bo, C.; Hong, Z.; Fengde, L. Effect of Heat Input on Porosity in High Nitrogen Steel Composite Welds. MATEC Web Conf. 2018, 175, 1–4. [Google Scholar] [CrossRef]
- Górka, J. Assessment of the Weldability of T-Welded Joints in 10 mm Thick TMCP Steel Using Laser Beam. Materials 2018, 11, 1192. [Google Scholar] [CrossRef] [PubMed] [Green Version]
- Pańcikiewicz, K.; Świerczyńska, A.; Hućko, P.; Tumidajewicz, M. Laser DissimilarWelding of AISI 430F and AISI 304 Stainless Steels. Materials 2020, 13, 4540. [Google Scholar] [CrossRef] [PubMed]
- Frostevarg, J.; Kaplan, A. Undercuts in Laser Arc Hybrid Welding. Phys. Procedia 2014, 56, 663–672. [Google Scholar] [CrossRef] [Green Version]
- Montgomery, D.C. Design and Analysis of Experiments, 9th ed.; John Wiley & Sons: Hoboken, NJ, USA, 2017; pp. 96–97. [Google Scholar]
Figure 1.
Schemes of: (a) the welded sample; (b) the weld bead with designations of typical imperfections and zones produced by welding.
Figure 1.
Schemes of: (a) the welded sample; (b) the weld bead with designations of typical imperfections and zones produced by welding.

Figure 2.
Appearance of the weld beads for welded series: profiles (above); macrographs (below).

Figure 3.
Sketch of the idealized profiles and their geometrical parameters: (a) t-profile; (b) b-profile.
Figure 3.
Sketch of the idealized profiles and their geometrical parameters: (a) t-profile; (b) b-profile.

Figure 4.
Examples of profiles: real, model and average model for S1, S2, S3 and S5 series (Y-axis and X-axis in mm).
Figure 4.
Examples of profiles: real, model and average model for S1, S2, S3 and S5 series (Y-axis and X-axis in mm).

Figure 5.
Distribution (a) and appearance (b) of porosity for the welded series.

Figure 6.
Distributions of undercut parameters for the set of series: (a) depth; (b) radius.

Figure 7.
Appearance of weld roots and undercuts for S1, S2 and S3 series: (a) captured by profilometer; (b) photograph.
Figure 7.
Appearance of weld roots and undercuts for S1, S2 and S3 series: (a) captured by profilometer; (b) photograph.

Figure 8.
Variation of height of the profiles (Y-axis in µm) along the weld axis (X-axis in mm) in places of underfill for S1, S2, S3 and S5 series.
Figure 8.
Variation of height of the profiles (Y-axis in µm) along the weld axis (X-axis in mm) in places of underfill for S1, S2, S3 and S5 series.

Figure 9.
SCFs for undercuts and profiles and porosity percentage of S1, S2, S3 and S5 series.

Figure 10.
Plots of the residuals for width W: (a) normal probability; (b) residuals vs HI.

Figure 11.
(a) Interaction in the factorial experiment; (b) width W in the function of the Heat Input.
Figure 11.
(a) Interaction in the factorial experiment; (b) width W in the function of the Heat Input.


Table 1.
Chemical composition of the base metal.
| C | Mn | Si | P | S | Cr | V | Nb | Ni | Cu | Al | Mo | Ti | Co | Fe |
|---|---|---|---|---|---|---|---|---|---|---|---|---|---|---|
| 0.07 | 1.69 | 0.01 | 0.012 | 0.006 | 0.03 | 0.02 | 0.046 | 0.04 | 0.011 | 0.044 | 0.016 | 0.117 | 0.016 | balance |
Table 2.
Tensile mechanical properties of the base metal.
| Yield Strength (MPa) | Tensile Strength (MPa) | Elongation % |
|---|---|---|
| 807.63 | 838.26 | 15.04 |
Table 3.
Welding parameters used in the experimental work.
| Series | Samples | Laser Power (kW) | Welding Speed (m/min) | Heat Input (J/mm) |
|---|---|---|---|---|
| S1 | F1, F2, F6, F10, F20, F22 | 2.00 | 1.60 | 75.0 |
| S2 | F5, F8, F16, F17, F19 | 1.75 | 1.60 | 65.6 |
| S3 | F4, F7, F12, F13, F18 | 2.00 | 2.00 | 60.0 |
| S4 | F21, F23 | 1.75 | 2.00 | 52.5 |
| Top Side Weld Pass | ||||
| S5 | F15 | 1.75 | 1.75 | 60.0 |
| F14 | 1.75 | 1.80 | 58.3 | |
| F9 | 1.75 | 1.90 | 55.3 | |
| F11 | 1.75 | 1.95 | 53.8 | |
| F3 | 1.75 | 2.00 | 52.5 | |
| Bottom Side Weld Pass | ||||
| S5 | F15, F14, F9, F11, F3 | 1.25 | 2.50 | 30.0 |
Table 4.
Geometrical parameters of the welded series.
| Parameter | S1 | S2 | S3 | S4 | S5 | ||||||||||||||||
|---|---|---|---|---|---|---|---|---|---|---|---|---|---|---|---|---|---|---|---|---|---|
| Av 1 | SD 2 | Max 3 | Min 4 | Av | SD | Max | Min | Av | SD | Max | Min | Av | SD | Max | Min | Av | SD | Max | Min | ||
| hb | (mm) | 0.20 | 0.05 | 0.30 | 0.11 | 0.36 | 0.08 | 0.58 | 0.26 | 0.31 | 0.10 | 0.51 | 0.17 | 0.13 | 0.03 | 0.20 | 0.11 | 0.14 | 0.03 | 0.20 | 0.07 |
| lb | (mm) | 1.02 | 0.10 | 1.22 | 0.91 | 0.93 | 0.06 | 1.04 | 0.84 | 0.84 | 0.08 | 0.98 | 0.73 | 1.61 | 0.09 | 1.72 | 1.45 | 1.73 | 0.11 | 1.88 | 1.47 |
| r | (mm) | 0.16 | 0.07 | 0.32 | 0.06 | 0.06 | 0.04 | 0.14 | 0.02 | 0.07 | 0.05 | 0.21 | 0.01 | 0.54 | 0.26 | 0.85 | 0.17 | 0.54 | 0.38 | 1.50 | 0.25 |
| θ | (°) | 146 | 8 | 159 | 128 | 130 | 7 | 149 | 122 | 130 | 8 | 146 | 120 | 161 | 1 | 163 | 160 | 166 | 5 | 171 | 150 |
| he | (mm) | 0.03 | 0.02 | 0.08 | 0.00 | 0.06 | 0.05 | 0.12 | 0.00 | 0.05 | 0.03 | 0.10 | 0.01 | 0.05 | 0.02 | 0.07 | 0.01 | 0.05 | 0.03 | 0.09 | 0.00 |
| lt | (mm) | 1.86 | 0.06 | 1.97 | 1.76 | 1.65 | 0.06 | 1.76 | 1.55 | 1.51 | 0.08 | 1.68 | 1.36 | - | - | - | - | 1.02 | 0.10 | 1.23 | 0.87 |
| hc | (mm) | 0.02 | 0.05 | 0.09 | −0.10 | −0.05 | 0.03 | 0.00 | −0.10 | −0.08 | 0.07 | −0.01 | −0.26 | - | - | - | - | 0.00 | 0.04 | 0.06 | −0.08 |
| hi | (mm) | −0.08 | 0.03 | −0.03 | −0.15 | −0.12 | 0.03 | −0.07 | −0.19 | −0.15 | 0.06 | −0.08 | −0.32 | - | - | - | - | −0.06 | 0.03 | −0.01 | −0.11 |
| sc | (mm) | 0.28 | 0.07 | 0.41 | 0.19 | 0.36 | 0.04 | 0.41 | 0.28 | 0.20 | 0.04 | 0.29 | 0.13 | - | - | - | - | 0.17 | 0.04 | 0.25 | 0.10 |
| b | (mm) | - | - | - | - | - | - | - | - | 0.15 | 0.04 | 0.22 | 0.09 | - | - | - | - | - | - | - | - |
| δ | (°) | - | - | - | - | - | - | - | - | 136 | 9 | 153 | 121 | - | - | - | - | - | - | - | |
1 average (Av); 2 standard deviation (SD); 3 maximum (Max); 4 minimum (Min).
Table 5.
Means of macrographs features.
| Series | Width of | Penetration Depth | |||
|---|---|---|---|---|---|
| FZ 1 and HAZ 2 | FZ | FG-HAZ 3 | CG-HAZ 4 | (mm) | |
| (mm) | (mm) | (mm) | (mm) | ||
| S1 | 2.47 | 1.82 | 0.22 | 0.09 | 3.00 |
| S2 | 2.27 | 1.65 | 0.21 | 0.11 | 3.00 |
| S3 | 2.11 | 1.55 | 0.21 | 0.10 | 3.00 |
| S4 | 2.15 | 1.71 | 0.15 | 0.09 | 2.66 |
| S5 | 2.23 | 1.71 | 0.19 | 0.08 | 3.00 |
1 fusion zone (FZ); 2 heat-affected zone (HAZ); 3 fine-grain heat-affected zone (FG-HAZ); 4 coarse-grain heat-affected zone (CG-HAZ).
Table 6.
Porosity features of welded series.
| Series | Quantity of Pores | Average Size | Maximum Size | Minimum Size | Projected Area |
|---|---|---|---|---|---|
| (mm) | (mm) | (mm) | (%) | ||
| S1 | 27 | 0.12 | 0.46 | 0.05 | 0.32 |
| S2 | 43 | 0.12 | 0.41 | 0.05 | 0.46 |
| S3 | 66 | 0.18 | 0.53 | 0.06 | 1.58 |
| S4 | 115 | 0.30 | 0.99 | 0.06 | 7.63 |
| S5 | 200 | 0.17 | 0.51 | 0.05 | 3.51 |
Table 7.
Parameters of the undercut geometry.
| Series | Quantity | Depth (µm) | Radius (µm) | Depth/Radius (µm/µm) | Length (mm) | ||||||||||||
|---|---|---|---|---|---|---|---|---|---|---|---|---|---|---|---|---|---|
| Av 1 | SD 2 | Max 3 | Min 4 | Av | SD | Max | Min | Av | SD | Max | Min | Av | SD | Max | Min | ||
| S1 | 38 | 40 | 22 | 105 | 15 | 56 | 33 | 147 | 5 | 1.36 | 2.00 | 9.00 | 0.17 | 1.11 | 0.63 | 2.84 | 0.35 |
| S2 | 2 | 72 | 3 | 74 | 69 | 25 | 21 | 39 | 10 | 4.39 | 3.58 | 6.93 | 1.86 | 0.62 | 0.02 | 0.63 | 0.60 |
| S3 | 28 | 52 | 24 | 114 | 23 | 32 | 24 | 87 | 6 | 3.33 | 3.74 | 15.17 | 0.28 | 0.59 | 0.23 | 1.17 | 0.21 |
1 average (Av); 2 standard deviation (SD); 3 maximum (Max); 4 minimum (Min).
Table 8.
Evaluation of the weld quality of the welded series.
| Imperfection Designation | Parameter | Limits of Quality Levels | Quality Levels for Series | |||||
|---|---|---|---|---|---|---|---|---|
| D | C | B | S1 | S2 | S3 | S5 | ||
| Porosity | - | - | - | - | - | - | - | - |
| maximum dimension for single pore | hp (mm)≤ | 1.50 | 1.20 | 0.90 | B | B | B | B |
| maximum projected area of pores | f (%)≤ | 6.00 | 2.00 | 0.70 | B | B | B | D |
| in cluster or linear porosity | - | - | - | - | - | - | - | - |
| two pores closer than | ∆lp (mm) | 0.75 | 1.50 | 1.50 | B | D | B | D |
| shall be considered combined porosity | - | - | - | - | not | yes | yes | yes |
| if the affected weld length | lc (mm)≤ | 6.00 | 3.00 | 3.00 | - | - | - | - |
| combined porosity is permitted | - | - | - | - | - | yes | yes | not |
| Undercut | hu≤ | 0.45 | 0.30 | 0.15 | B | B | B | B |
| Excess weld metal (reinforcement) | hc (mm)≤ | 1.10 | 0.80 | 0.65 | B | B | B | B |
| Excessive penetration | hb (mm) | 1.10 | 0.80 | 0.65 | B | B | B | B |
| Linear misalignment | he (mm)≤ | 0.75 | 0.45 | 0.30 | B | B | B | B |
| Underfill | hi (mm)≤ | 0.90 | 0.60 | 0.30 | B | B | B | B |
Table 9.
Data for width W.
| Series | Treatments HI | Observations | Means | Differences | LSD Value | |||
|---|---|---|---|---|---|---|---|---|
| (J/mm) | (mm) | (mm) | (mm) | (mm) | ||||
| S1 | 75 | 2.465 | 2.440 | 2.420 | 2.566 | 2.473 | W1−W2 = 0.207 | 0.087 |
| S2 | 66 | 2.263 | 2.370 | 2.236 | 2.195 | 2.266 | W2−W3 = 0.159 | - |
| S3 | 60 | 2.077 | 2.055 | 2.171 | 2.126 | 2.107 | W4−W3 = 0.045 | - |
| S4 | 53 | 2.133 | 2.147 | 2.159 | 2.168 | 2.152 | - | - |
Table 10.
ANOVA table for width W.
| Source of Variation | Sum of Squares | Degrees of Freedom | Mean Square | F0 | P-Value |
|---|---|---|---|---|---|
| Heat Input | 0.080 | 3 | 0.027 | 8.383 | 0.0028 |
| Error | 0.038 | 12 | 0.003 | - | - |
| Total | 0.118 | 15 | - | - | - |
Table 11.
ANOVA table for factorial design applied to width W.
| Source of Variation | Sum of Squares | Degrees of Freedom | Mean Square | F0 | P-Value |
|---|---|---|---|---|---|
| Power | 0.026 | 1 | 0.026 | 8.29 | 1.39 × 10⁻² |
| Welding speed | 0.230 | 1 | 0.230 | 72.44 | 2 × 10⁻⁶ |
| Interaction | 0.063 | 1 | 0.063 | 19.87 | 7.82 × 10⁻⁴ |
| Error | 0.038 | 12 | 0.003 | - | - |
| Total | 0.358 | 15 | - | - | - |
Publisher’s Note: MDPI stays neutral with regard to jurisdictional claims in published maps and institutional affiliations. |
© 2021 by the authors. Licensee MDPI, Basel, Switzerland. This article is an open access article distributed under the terms and conditions of the Creative Commons Attribution (CC BY) license (http://creativecommons.org/licenses/by/4.0/).
Share and Cite
MDPI and ACS Style
Riofrío, P.G.; Ferreira, J.A.M.; Capela, C.A. Imperfections and Modelling of the Weld Bead Profile of Laser Butt Joints in HSLA Steel Thin Plate. Metals 2021, 11, 151. https://0-doi-org.brum.beds.ac.uk/10.3390/met11010151
AMA Style
Riofrío PG, Ferreira JAM, Capela CA. Imperfections and Modelling of the Weld Bead Profile of Laser Butt Joints in HSLA Steel Thin Plate. Metals. 2021; 11(1):151. https://0-doi-org.brum.beds.ac.uk/10.3390/met11010151
Chicago/Turabian StyleRiofrío, Patricio G., José A. M. Ferreira, and Carlos A. Capela. 2021. "Imperfections and Modelling of the Weld Bead Profile of Laser Butt Joints in HSLA Steel Thin Plate" Metals 11, no. 1: 151. https://0-doi-org.brum.beds.ac.uk/10.3390/met11010151
Note that from the first issue of 2016, this journal uses article numbers instead of page numbers. See further details here.