
Determination of the Li Distribution in Synthetic Recycling Slag with SIMS

1
Department of Mineralogy, Geochemistry, Salt Deposits, Institute of Disposal Research, Clausthal, University of Technology, Adolph-Roemer-Str. 2A, 38678 Clausthal-Zellerfeld, Germany
2
Institute for Surface and Thin Film Analysis IFOS GmbH, Trippstadter Str. 120, 67663 Kaiserslautern, Germany
*
Author to whom correspondence should be addressed.
Metals 2021, 11(5), 825; https://0-doi-org.brum.beds.ac.uk/10.3390/met11050825
Submission received: 8 April 2021
/
Revised: 12 May 2021
/
Accepted: 14 May 2021
/
Published: 18 May 2021
Abstract
:The recovery of technically important elements like lithium from slag of pyrometallurgical recycling of lithium traction batteries will be very important in future due to the expected increasing demand of this element with the upcoming world-wide implementation of electro mobility. Therefore, the investigation of possibilities to recover lithium from pyrometallurgical slag from the recycling of lithium traction batteries is mandatory. In this context, the EnAM (engineered artificial mineral) approach is very promising. Solidified melt of synthetic recycling slag with the compounds Li2O-MgO-Al2O3-SiO2-CaO-MnO contains various Li-bearing phases including spinel solid solution, Li-aluminate and eucryptite-like Li-alumosilicate. Most probably, the Ca-alumosilicate matrix (melilite-like solid solution) incorporates lithium as well. These compounds can be determined and calculated to an acceptable approximation with electron probe microanalysis (EPMA). Nevertheless, an adequate precise measurement of lithium is virtually impossible due to the extremely low fluorescence yield and long wavelength of Li Kα. Secondary mass spectrometry (SIMS) can be used to fill this gap in the analytical assessment of the slag. Therefore, the combination of these two analytical methods can distinctively improve the mineralogical and chemical characterization of lithium-containing solidified (slag) melt.
1. Introduction
Due to its flexibility, pyro metallurgical processing is a state-of-the-art process for recovering important commodities like lithium from recyclable materials (e.g., traction batteries). In this process, the valuable elements Co, Ni and Cu are extracted into an alloy melt, whereas ignoble elements like lithium are directed into the slag (Elwert et al. [1]). On solidification, the used slag system leads to formation of a merely xenomorphic Ca-alumosilicate matrix (here: melilite-like solid solution) with aggregates, grains and crystals of lithium aluminate, spinel and lithium-alumosilicate. All of these phases can incorporate Li. The first step of the engineered artificial mineral approach is pinpointing the most promising phase to concentrate and remove the element of interest. In this respect, LiAlO2, especially, is a very promising candidate, because of its high Li content, advantageous crystal habitus (no needles or whiskers), and its potential reuse as coating of electrodes (e.g., Srur-Lavi et al. [2]). The possibility of flotation of this phase from a remaining silicate slag matrix was proved by Haas et al. [3]. The hydrometallurgical processing of Li-enriched silicate slag has also shown that Li recovery can reach 80–95% (Elwert et al. [4]).
The studies of Schirmer et al. [5] and Wittkowski et al. [6] showed that Li is distributed in different phases in these slags. Among these compounds are Li-aluminate (LiAl, Li1 − x(Al1 − xSix)O2), eucryptite-like alumosilicate (ELAS, Li1 − xMgy(Al)(Al2y − xSi2 − (2y − x))O6), and spinel solid solutions of Mg1 − (3/2y)Al2 + yO4/LiAl5O8 and (Li(2x)Mn2+(1 − x))1 + x)(Al(2 − z),Mn3+(z))O4. The Ca-alumosilicate (melilite-like solid solution) matrix may incorporate Li as well.
Complex stoichiometric chemical formula calculations, including Li, which virtually cannot be measured with the required accuracy using standard electron microprobe (EPMA) wavelength optical setups (e.g., LiF, PET, TAP, PC(0–3)), can be carried out using virtual compounds. The idea of using virtual compounds for investigation of Mg-containing eucryptite solid solution was discussed by Iwatsuki et al. [7]. This approach enables the use of proven, simple and widespread analysis technique like EPMA with wavelength dispersive X-Ray optics to investigate Li-bearing materials. The calculation of concentrations for elements that are unanalyzable (in this case, Li) to compose stoichiometric phases via virtual compounds using analyzable elements is often superior to direct measurement with other probes, such as secondary ion mass spectrometry (SIMS), in terms of accuracy and quantification effort.
Nevertheless, for a complete understanding of the behavior of lithium during the crystallization of potential Li-incorporating compounds, a mapping of the real measured Li distribution is important. SIMS is capable of mapping this element with a resolution of up to ~1 µm. This enables the determination of periodic or increasing Li enrichment along the crystallographic directions, as well as the formation of lamellae and exsolution phenomena during the crystallization process. Therefore, the combination of EPMA and SIMS is a sensible extension of the analytical characterization of the solidification of lithium-bearing slag.
2. Materials and Methods
2.1. Materials
The investigated material is a synthetic slag originating from experiments published in Schirmer et al. [5] and Wittkowski et al. [6]. The system of the synthetic slags contains Li2O, MgO, Al2O3, SiO2 and CaO, as well as MnOx in the case of the manganese-containing material. Detailed descriptions of the starting materials, the heating curve, the bulk and mineralogical composition, including Li loss during smelting and solidification have been published by Schirmer et al. [5] and Wittkowski et al. [6].
2.2. Methods
Mineralogical Investigation
Prior to selection of regions of interest for SIMS, the analysis of single crystals and grains was carried out using electron probe microanalysis (EPMA, CAMECA SAS, Gennevilliers Cedex, France). EPMA is a standard method for characterizing the chemical composition in terms of single spot analysis or element distribution patterns, accompanied by electron backscattered Z (ordinal number) contrast (BSE(Z)) or secondary electron (SE) micrographs. To carry out EPMA measurements, the sample was prepared as a polished block in epoxy resin, coated with carbon, and characterized using a Cameca SXFIVE FE (Field Emission, CAMECA SAS, Gennevilliers Cedex, France) electron probe, equipped with five wavelength dispersive (WDX) spectrometers (CAMECA SAS, Gennevilliers Cedex, France). The following elements/(lines) were used to quantify the measurement points: Na (Kα), Mg (Kα), Al (Kα), Si (Kα), K (Kα), Ca (Kα), Ti (Kα), Mn (Kα) and Fe (Kα). To calibrate the wavelength dispersive X-ray fluorescence spectrometers (WDXRF, CAMECA SAS, Gennevilliers Cedex, France), an appropriate suite of standards and analyzing crystals was used. The reference materials were provided by P&H Developments (The Shire 85A, Derbyshire, UK) and Astimex Standards Ltd. (72 Milicent St, Toronto, Ontario, M6H 1W4, Canada). The beam size was set to 0, leading to a beam diameter substantially below 1 µm (100–600 nm with field emitters of Schottky-type, e.g., Jercinovic [8]). To evaluate the measured intensities, the X-PHI-Model was applied (Merlet [9].
Lithium, one of the key elements in this study, cannot be analyzed using standard X-ray optics because the extremely low fluorescence yield and long wavelength of Li Kα makes the precise determination of this element virtually impossible. Nevertheless, Li can be calculated using virtual compounds. As an example, LiAlO2 and SiO2 can be used to describe a compound like Li1 − x(Al1 − xSix)O2. Prior to carrying out the calculations, it has to be verified that other refractory light elements such as Be and B are not present in the investigated material (which are well-known sources), and volatile elements and compounds such as F, H2O, CO2 or NO3− have been effectively eliminated during processing (omitting formation of CaF2: not detected with PXRD). The resulting calculated Li concentration can be included in a matrix back-correction and iterated recalculation.
To assess the analytical accuracy with respect to Li-containing compounds, the international reference material spodumene (Astimex) and the in-house standard LiAlO2 were used (Table 1). Additionally, Li-containing crystalline phases identified by X-ray diffraction (PXRD) were referenced to the EPMA result.
To study the presence and the lateral distribution of the light element Li, which cannot easily be detected by EPMA, time-of-flight (ToF) secondary ion mass spectrometry (SIMS) was used for some selected samples/positions, which were pre-characterized by optical microscopy and EPMA. In general, SIMS is a technique used for surface analysis (e.g., Vickerman et al. [10]). Briefly, samples are bombarded with primary ions with typical energies of 1–30 keV, leading to a release of secondary particles from layers close to the surface in a so-called sputtering process. Besides electrons, these secondary particles consist of atoms and molecules, which are in part (approximately around 1%) positively or negatively charged. These so-called atomic and molecular secondary ions (SIs) are extracted with an electric field and then separated and detected using a mass analyzer. In this study, a ToF-SIMS IV instrument from IONTOF (IONTOF GmbH, Münster, Germany) equipped with a Bi-liquid metal ion gun (LMIG) was used. The energy of the Bi-primary ions was 25 keV. A pre-sputtering with low-energy O ions (1 kV) was applied to the sample in order to remove the carbon coating stemming from prior EPMA analysis as well as possible contaminations resulting from the preparation of the polished thin section.
To achieve a high sensitivity in combination with a high mass resolution (m/Δm > 4000) and a moderate lateral resolution (3–5 µm), the LMIG was operated in the so-called “high-current mode”, using Bi3 clusters with a pulse length <1 ns and a repetition rate of 10 kHz. Sample charging, resulting from the primary ion beam, was compensated by using low-energy electrons. Additional details of the ToF-SIMS analysis have been published by Vickerman et al. [10].
To map the spatial distribution of the emitted elemental SI (beginning with H) and the characteristic elements (e.g., Li, Si, Al, Mg, Mn), the primary beam was used to scan an area of maxiumum 500 × 500 mm2 using a pixel resolution of 128 × 128 or 256 × 256. If necessary, a higher lateral resolution (200–400 nm) can be achieved using a different operational mode of the LMIG, in cases where the lower detection sensitivity and mass resolution of this mode are acceptable. Because of the complex mechanism of SI emission in contrast to other analysis methods (e.g., EPMA), a direct quantification of the measured SI intensities is very difficult. Therefore, all images presented in this study only display intensities, rather than concentrations.
3. Results
3.1. Definition of Phases with Potential Li Content
Interesting potentially Li-containing compounds in the analyzed material published by Schirmer et al. [5] and Wittkowski et al. [6] include:
- Lithium aluminate (LiAl): Li1 − x(Al1 − xSix)O2
- Eucryptite-like lithium alumosilicate (ELAS): Li1 − xMgy(Al)(Al2y − xSi2 − (2y − x))O6 or (Li1 − x(Mn3+y,Al1 − (x + y))1 − x(Si1 + x)O4 (if Mn is available)
- Melilite-like solid solution:
- ⚬
- Gehlenite-like alumosilicate (GCAS)
- ⚬
- Melilite-like alumosilicate (MCAS): X2Y2ZO7 (X: Li (?), Na, Ca, Y: Li (?), Mg, Al, Z: Al, Si) where the compound GCAS is an end member of the MCAS: Ca2Al2SiO7 with minute amounts of Mg (?: Plausible but to be verified)
- Spinel: Mg1 − (3/2y)Al2 + yO4 and (Li(2x)Mn2+(1 − x))1 + x)(Al(2 − z),Mn3+(z))O4
The calculations and data describing these phases were published by Schirmer et al. [5] and Wittkowski et al. [6]. Due to the fact that Li cannot be determined with EPMA, the first challenge is to classify the potential Li-containing phases. The first indications are simply the single element concentrations and the total of all measured elements calculated as oxides. This can easily be recognized by looking at the result of a LiAl measurement. The only elements to be measured were Al and Si (as a minor component). The Al concentration was about 40 wt.%. Possible candidates for these results include corundum (Al2O3) and LiAlO2. The Al content of corundum is 52.93 wt.%, and no Si can normally be incorporated into the crystal. Therefore, corundum can be omitted. Other Li-aluminate phases, such as Li5AlO4 (21.47 wt.% Al), LiAl5O8 (50 wt.% Al), and LiAl11O17 (51.55 wt.% Al), can therefore be omitted as well. Because of the Si content, the LiAl has to be divided into two virtual compounds—LiAlO2 and SiO2—with the theoretical formula Li1 − x(Al1 − xSix)O2. The Si content is limited to a maximum of ~2.5 wt.% (Schirmer et al. [5]).
The ELAS contains mainly Al, Si and smaller amounts of Mg (~3 wt.%). The analyzed Al/Si ratio (wt.%) is about 1. Due to the similar atomic mass of these elements, the stoichiometric formula numbers should be very similar. Of the potential candidates—eucryptite (LiAlSiO4), spodumene (LiAlSi2O6) and petalite (LiAlSi4O10)—only the first candidate fulfills this criterion. Pure eucryptite can be derived from the SiO2 structure by replacing the appropriate amount of SiO2 units with LiAlO2 units. To use Mg0.5AlO2 units to explain the Mg content in this compound is plausible (e.g., Iwatsuki [7]). Therefore these three units can be used for the definition of the virtual compounds in order to form a theoretical compound like Li1 − xMgy(Al)(Al2y − xSi2 − (2y − x))O6 (Schirmer et al. [5]).
Assessing the MCAS is more complicated, because the totals of all of the elements are closer to 100 wt.% (97–99.7 wt.%). Interesting in this respect is that all analysis results of the MCAS are about 1 wt.% lower than those of the GCAS, indicating a small amount of an additional element.
In theory, Li+ can be present in 4 or 8 coordination, which the ionic radius is very similar to that of Mg (4 coordination) or Na (8 coordination) (see the ionic radii published by Shannon [11]). Principally the MCAS contains the primary end members gehlenite (Ca2Al2SiO7) and akermanite (Ca2MgSi2O7). Rankinite (Ca3Si2O7), although not an endmember of the melilite solid solution, can be calculated as an equivalent for slag alumosilicate, too (Stracher [12]). Due to the Na content in natural melilite, Na2Si3O7 (not classified as a mineral) is additionally plausible. The same should then be valid for Li2Si3O7. Therefore, these five virtual compounds can be used to define MCAS X2Y2ZO7 (Schirmer et al. [5].
Even more complicated is the classification of the spinel solid solution. In this case, due to its highly variable crystal (defect) structure, a bulk analysis result of distinctly lower than 100 wt.% (e.g., 97 wt.%) is plausible. In the Mn-free system, thermodynamic modeling of the Mg/Al ratio at every temperature and chemistry, as well as the solid solution behavior of Mg1 (3/2y)Al2 + yO4/LiAl5O8 in the presence of LiAlO2 as a concurring phase, despite being defined as an ideal solid solution by Konar [13], is mandatory. In contrast, Mn is known to form various Li-containing spinel solid solutions, like Li(1 + x)Mn(2 − x)O4 Paulsen [14]. Therefore a solid solution of MnAl2O4 (galaxite) and cubic MnMn2O4 (hausmannite > 1172 °C, Chatterjee, [15]) with Li-Mn spinel (LiMnO2) to form a theoretical ((Li(2x)Mn2+(1 − x))1 + x)(Al(2 − z),Mn3+(z))O4, is plausible (Wittkowski [6]). A presentation and description of the XRD results is beyond the scope of this article, which is classified as a short communication. Detailed assessments of the XRD results of the same sample materials were recently published by Schirmer et al. [5] and Wittkowski et al. [6]
3.2. Element Distribution Patterns with SIMS
The synthetic recycling slag used by Schirmer et al. [5] and Wittkowski et al. [6] was investigated using ToF-SIMS to verify the calculated Li distribution. A special focus was placed on the Li distribution in the spinel solid solution.
3.2.1. Mn-Free Synthetic Slag
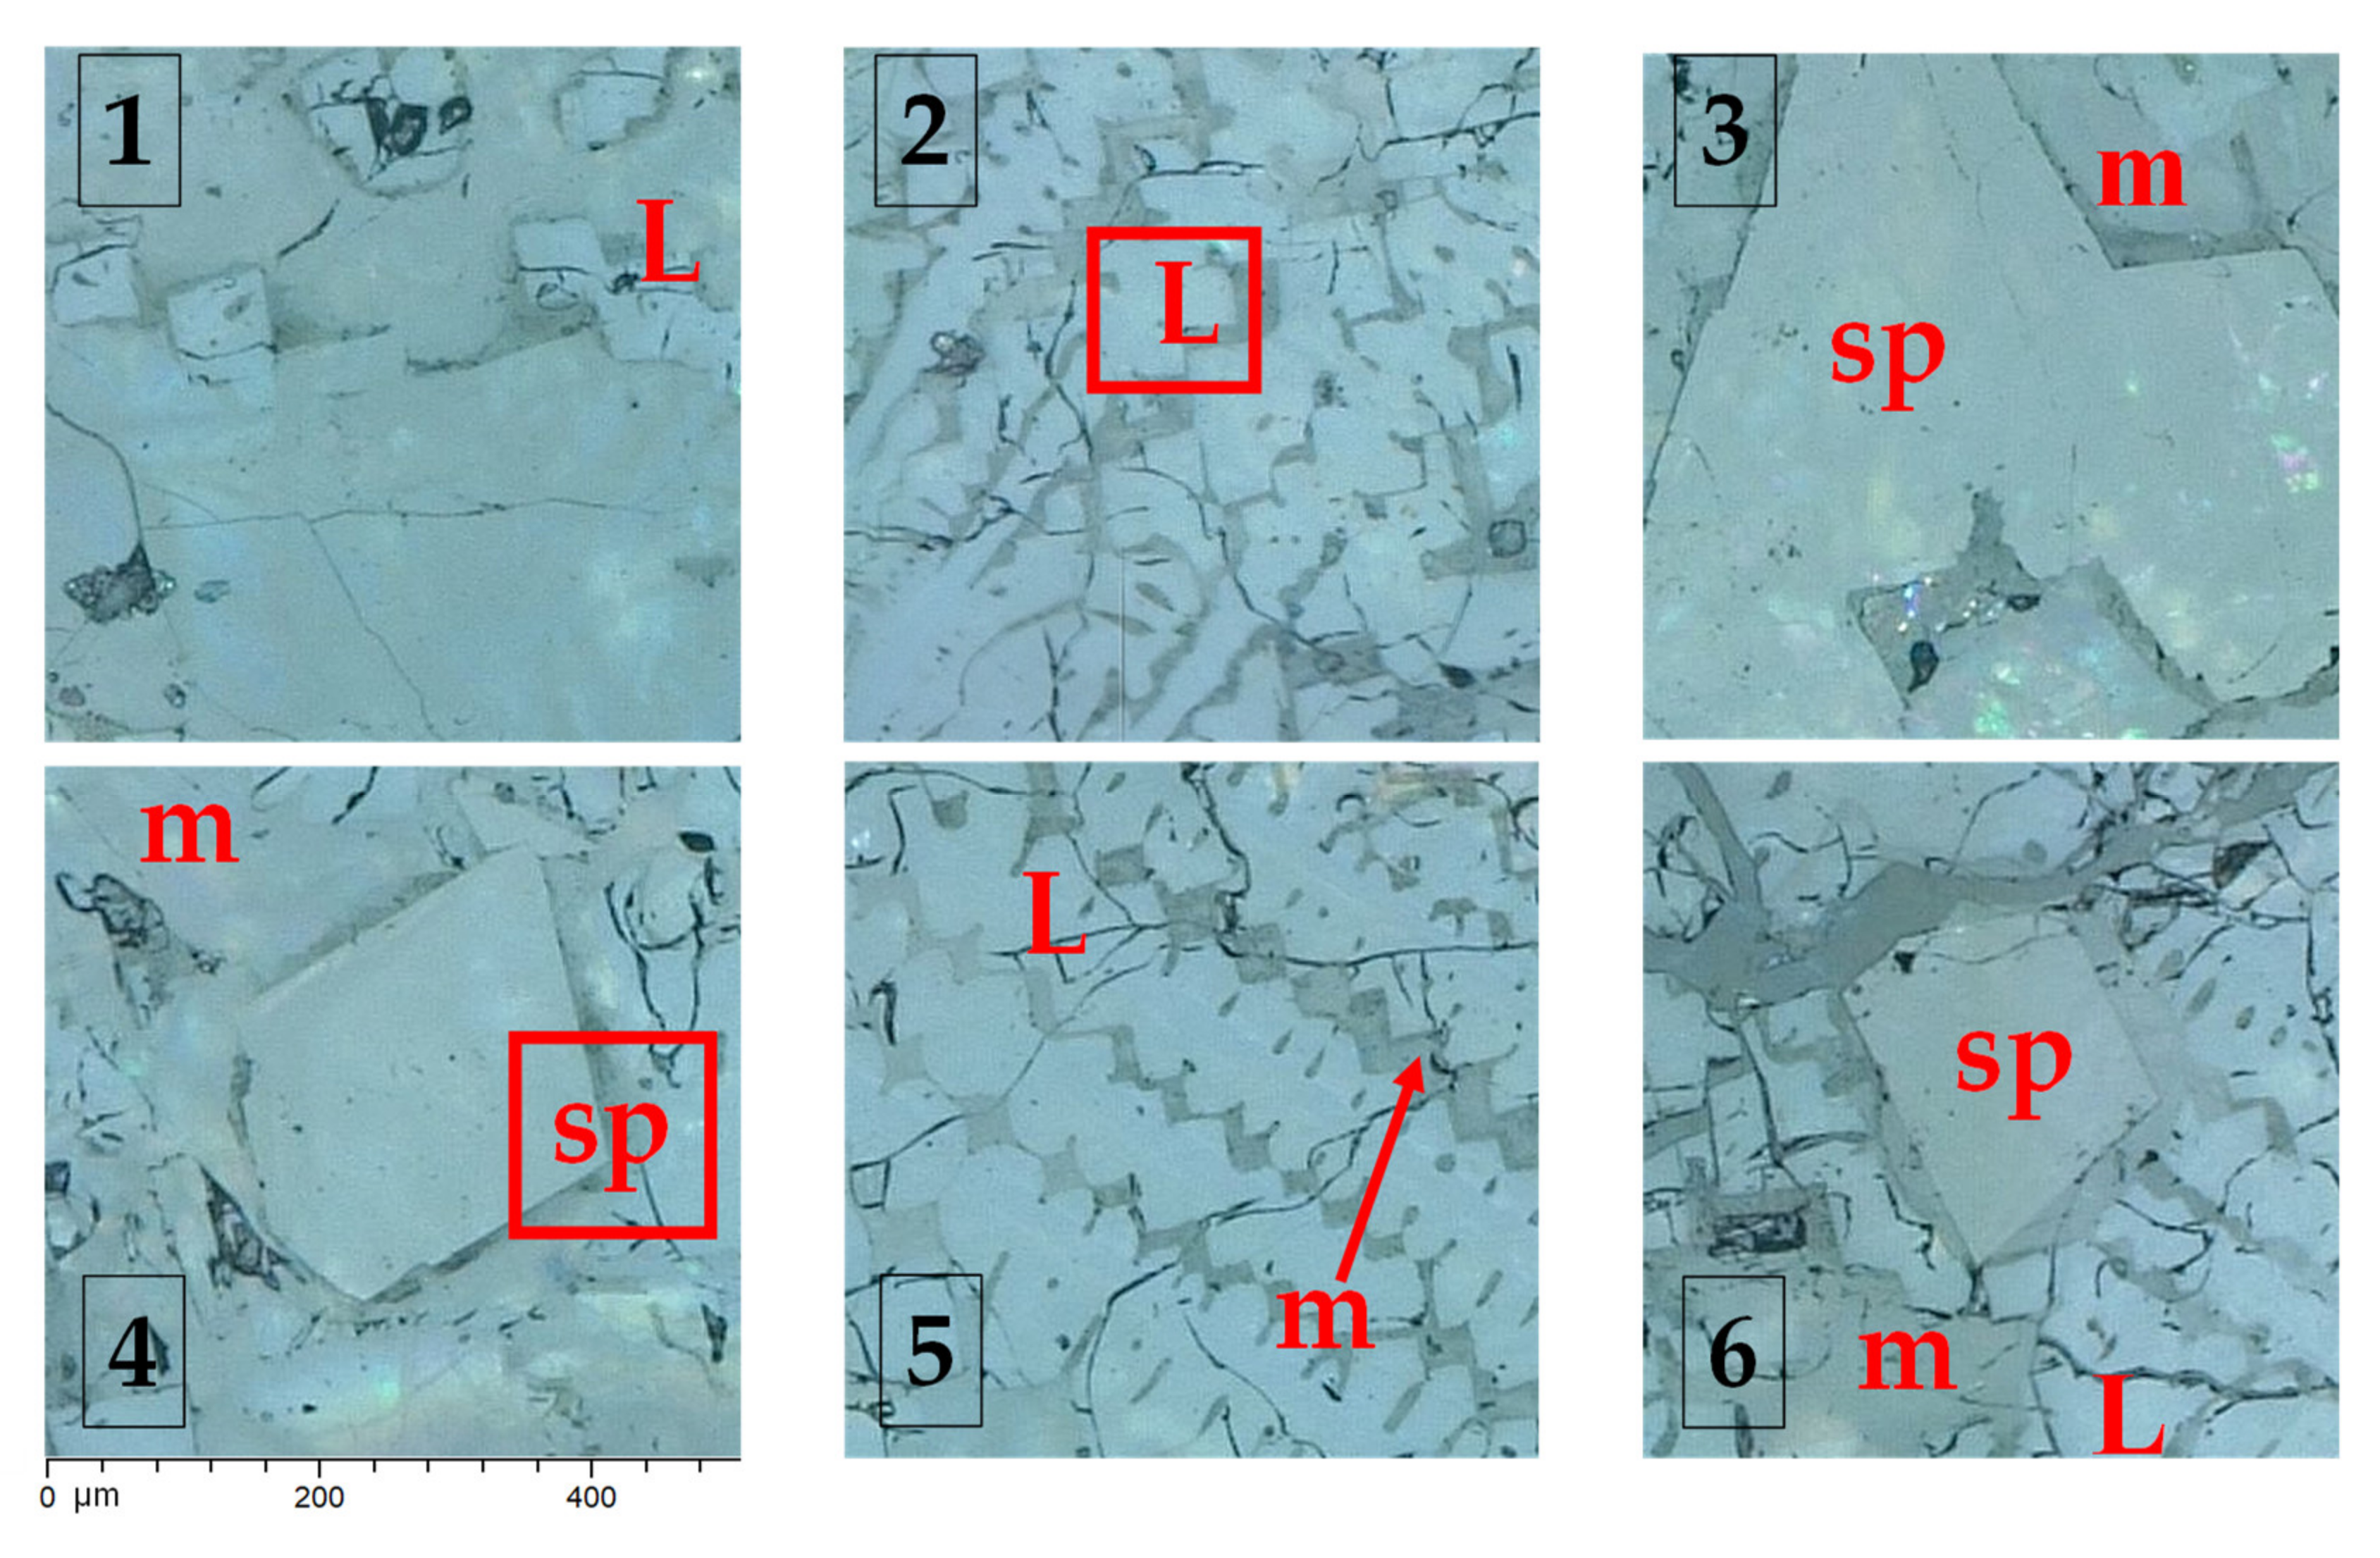
In the Mn-free sample, the compounds LiAl, spinel (ss), and the MCAS matrix were easily identified on the basis of the optical microscopy image (Figure 1).
The optical microscope image was used to define the overview sections and detailed regions of interest (ROI) for further element distribution mappings with ToF-SIMS.
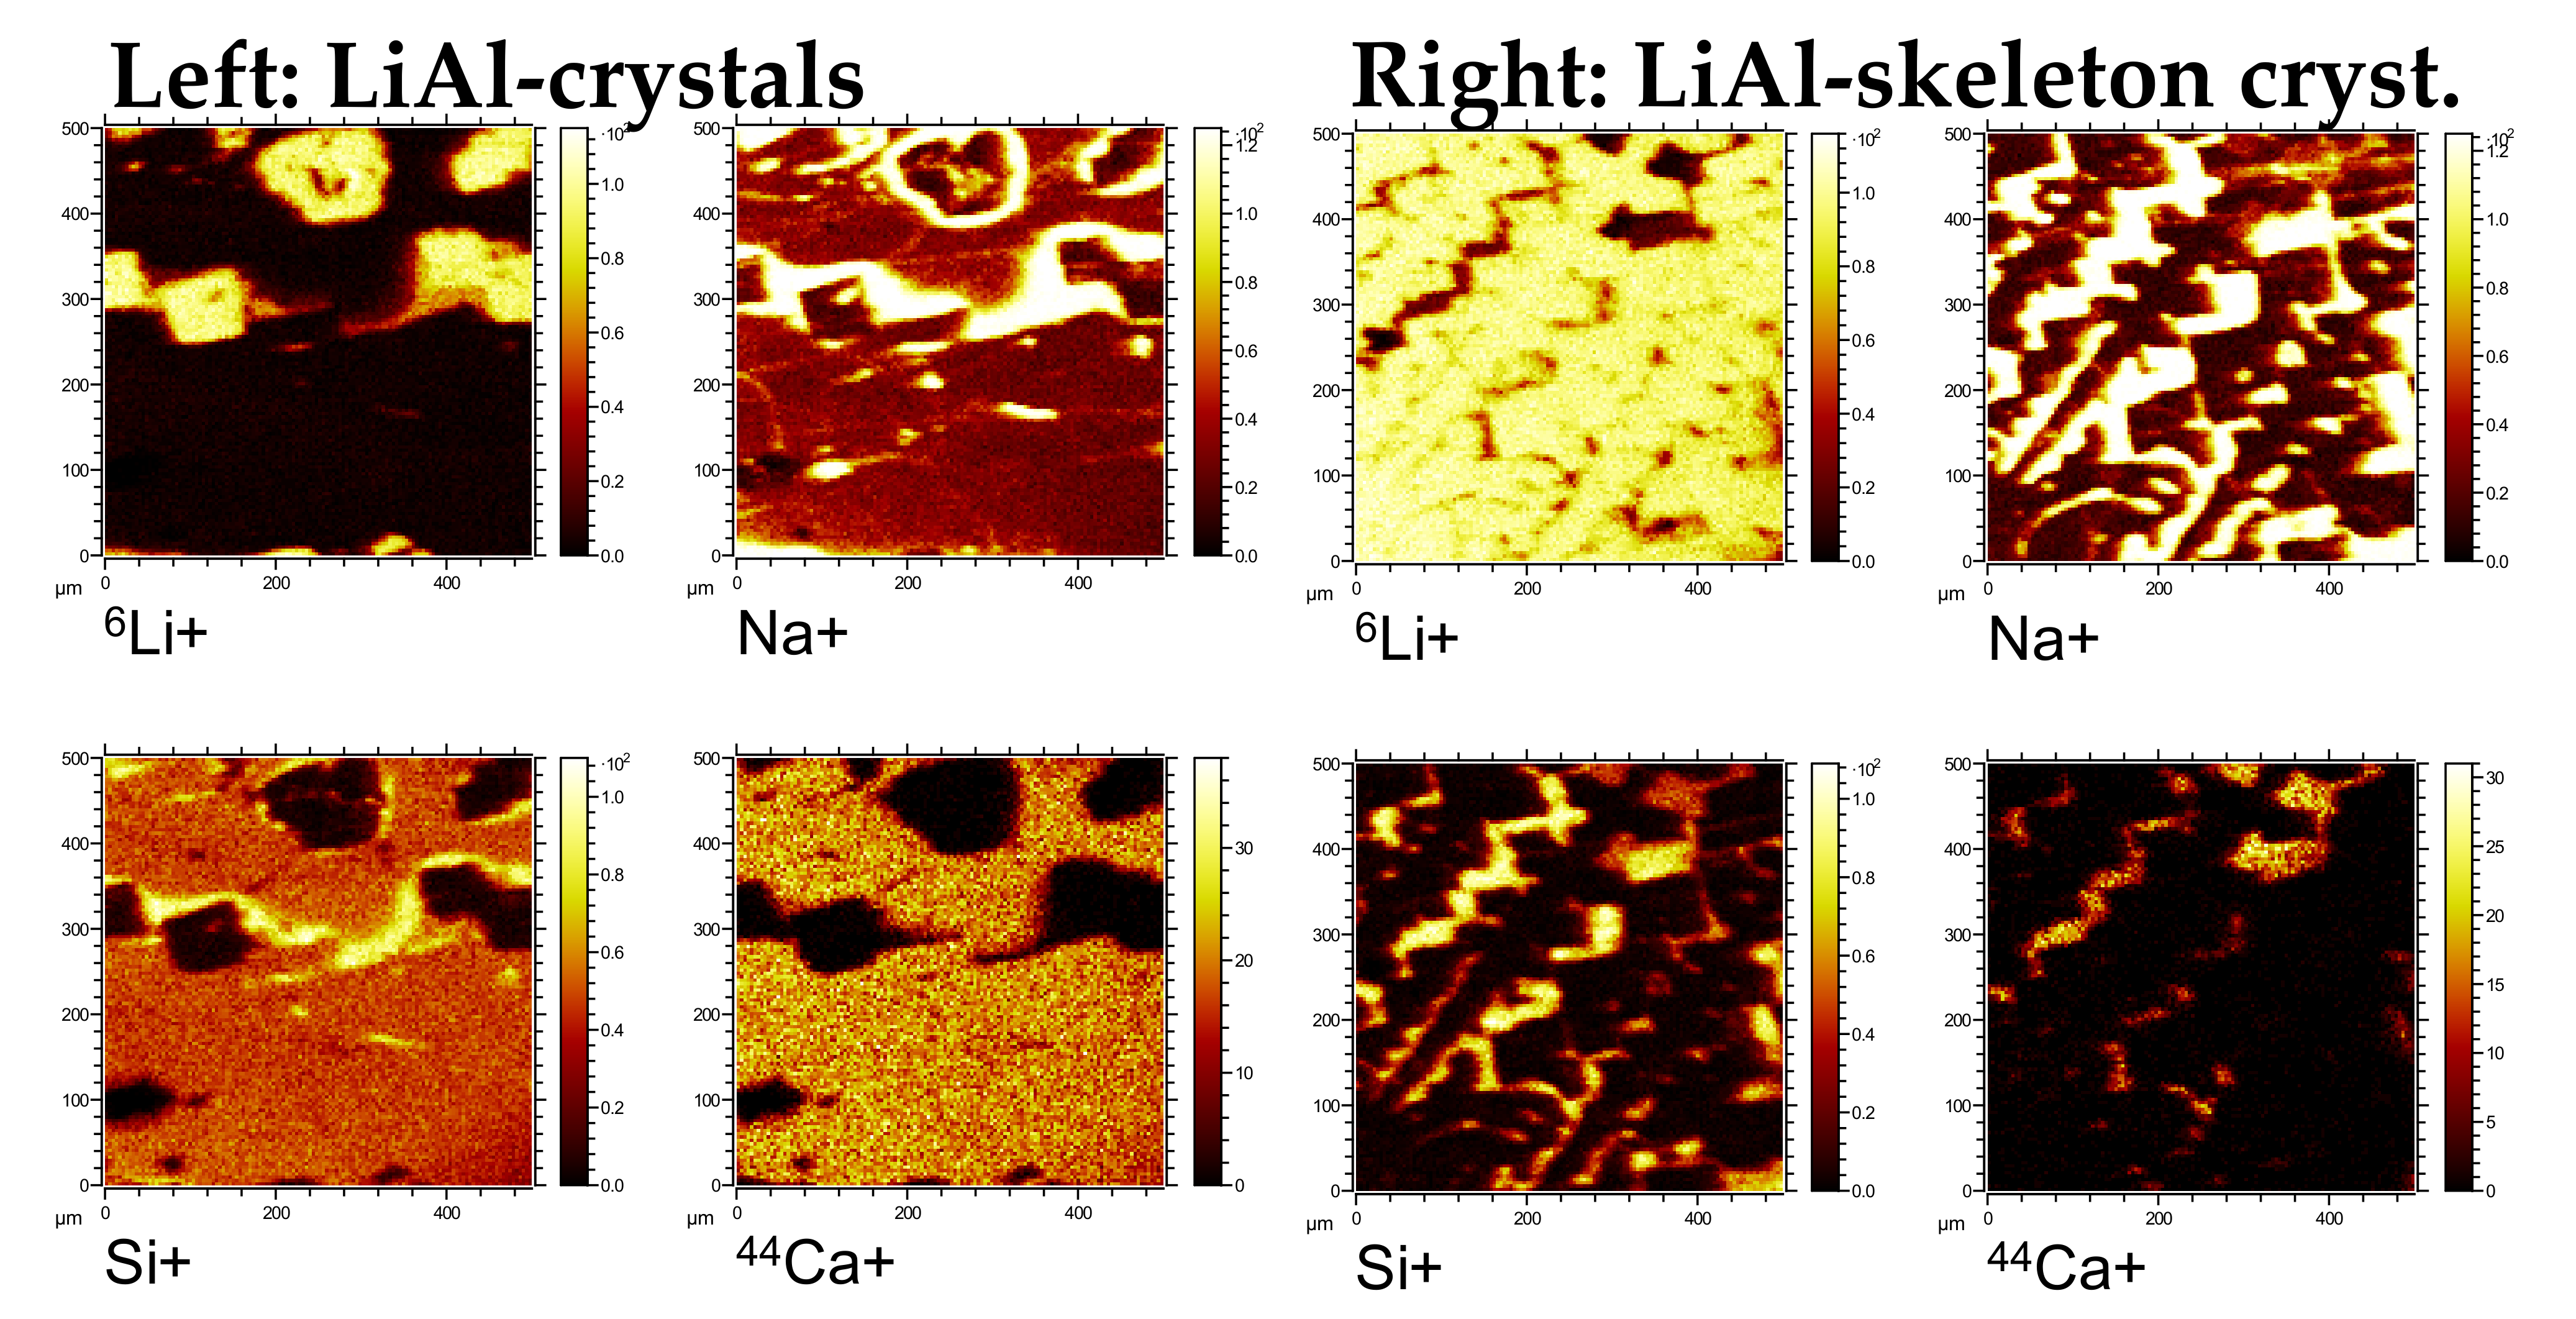
The overview of the Mn-free material with optical microscopy shows the Ca- and Si-rich matrix with single crystals of LiAl. Furthermore, LiAl forms skeleton crystallizates whose interstices are filled with the same siliceous phase. SIMS measurements show that an alkali-rich phase forms streaks throughout the whole Ca-alumosilicate matrix (Figure 2). Besides LiAl, the material contains large idiomorphic crystals of spinel, which are also often surrounded by an area of alkali-rich siliceous phase, described above. The total view of the spinel crystals indicates a homogeneous distribution of Li throughout the whole crystal.
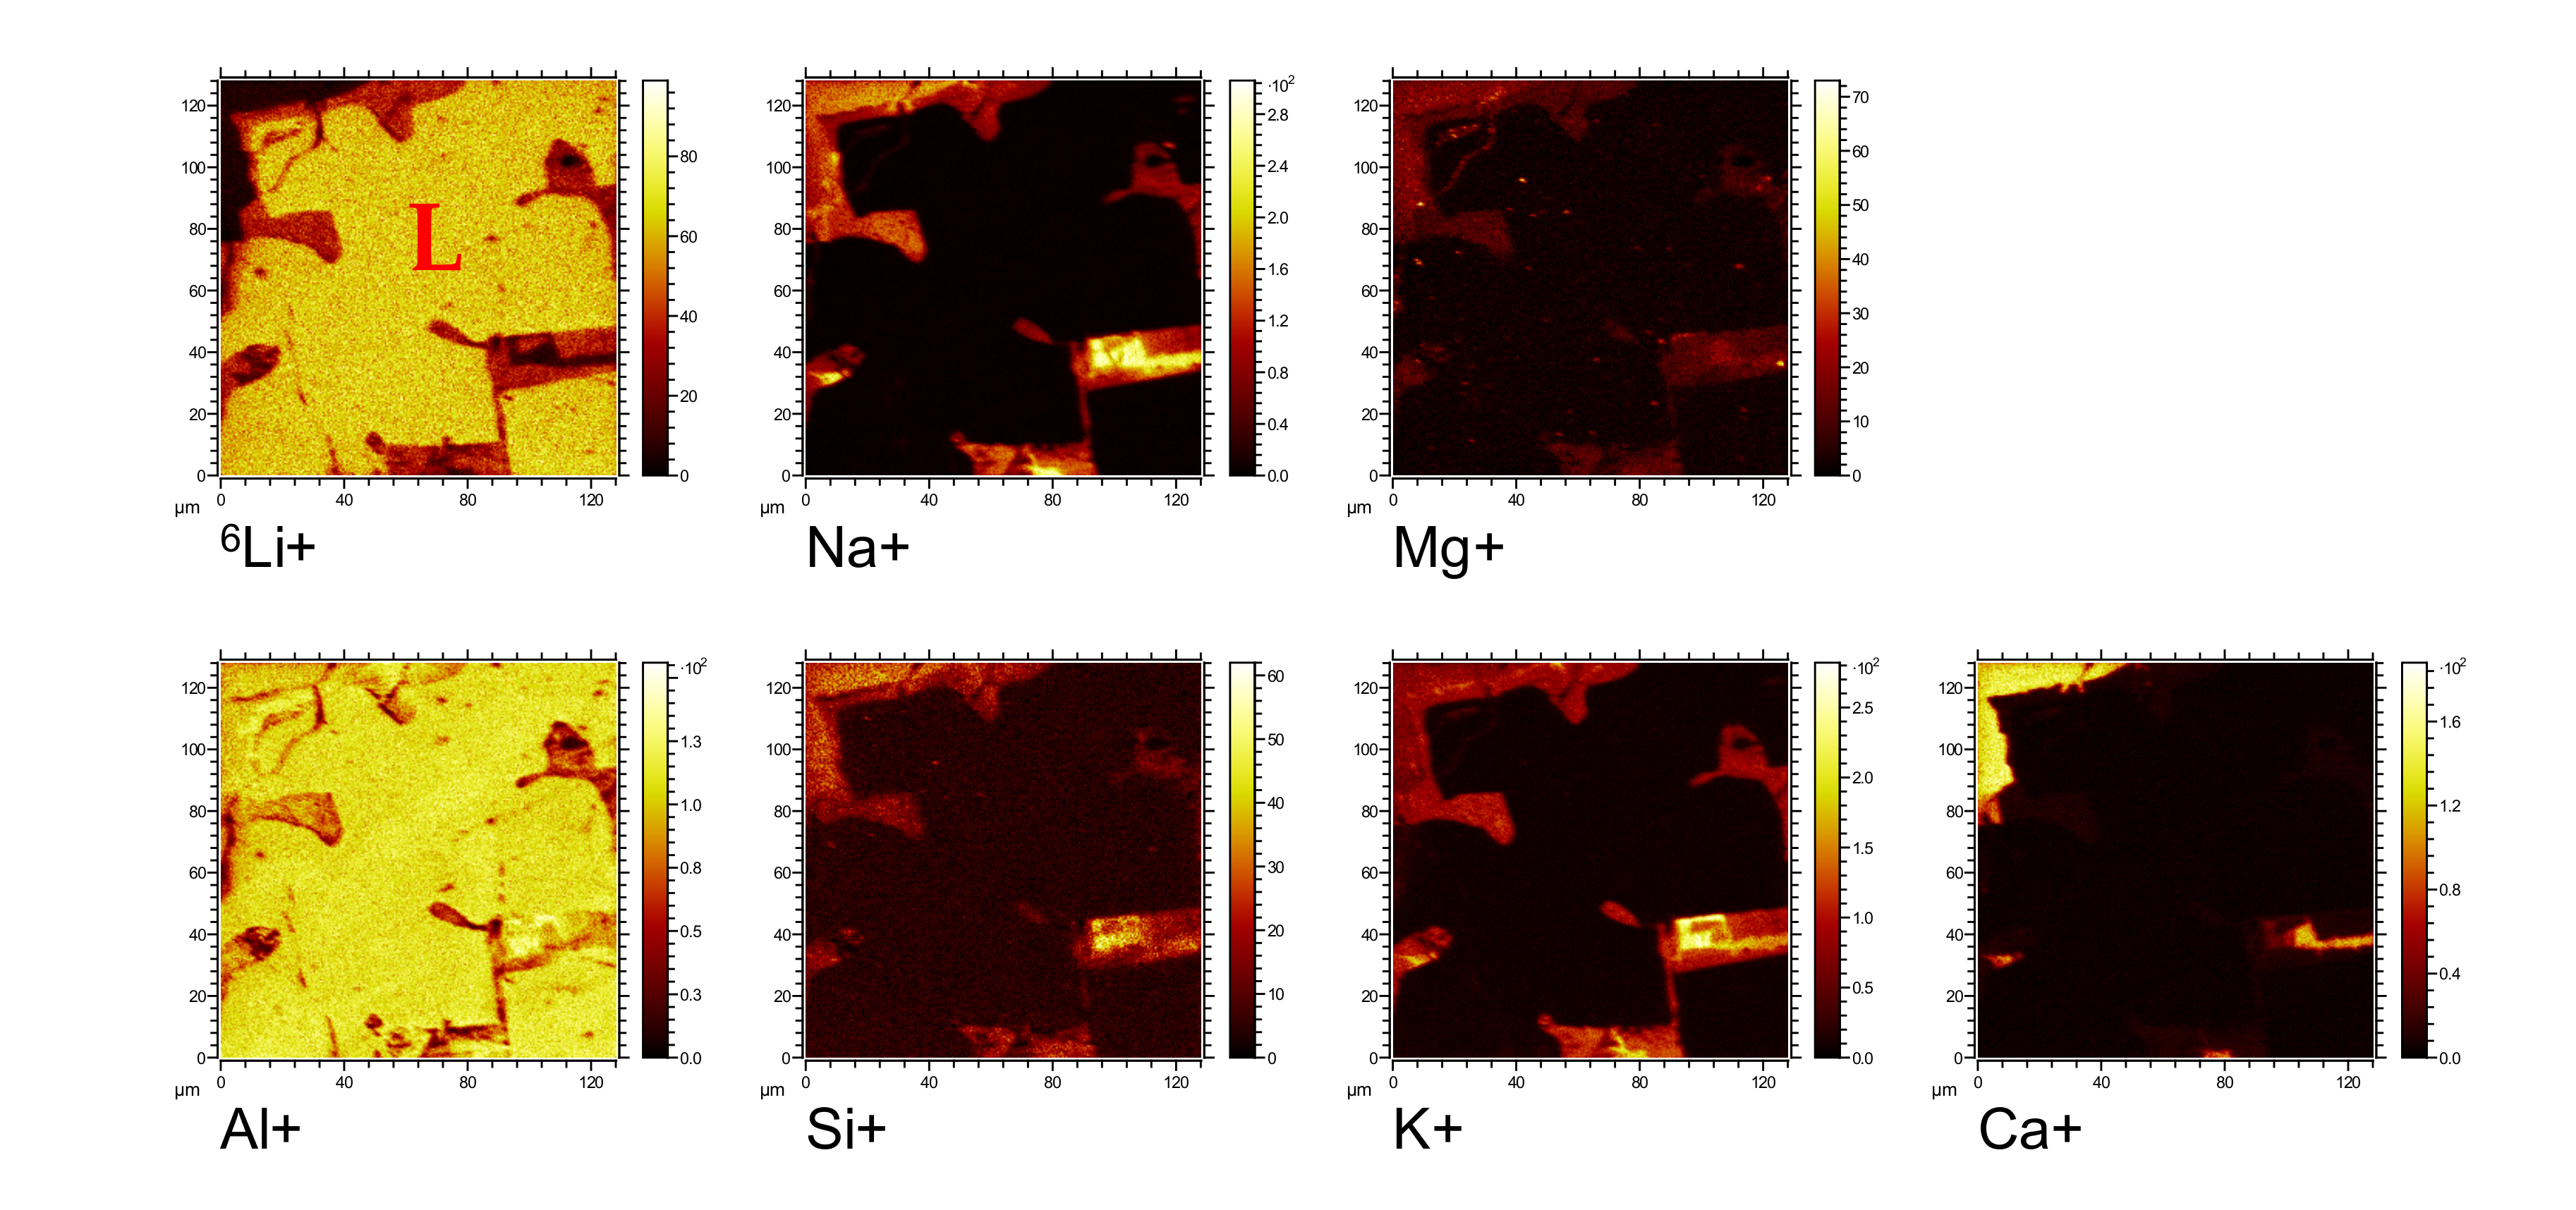
A first ROI (Figure 1, red square at position 2, named “L”) is concentrated on a detailed view of a skeleton crystallizate of LiAl with high signal of Li and Al (Figure 3). The Li distribution is homogeneous from inside to the rim of the skeleton structure. All other elements except for Si are below the significant level. On the basis of the shade of the element distribution, the Si concentration may be rather low. This is in agreement with the theoretical formula of Li-aluminate crystallizing in the presence of Si, as depicted by Schirmer et al. [5]; Li1 − x(Al1 − xSix)O2, with a maximum of ~ 1 wt.% Si in the skeleton crystallizate.
Interestingly, the skeleton structure of LiAl is surrounded by a siliceous matrix enriched in Na and K, most probably representing a eutectic melt residuum. Figure 3 gives an indication that Li is incorporated into this residuum. This, too, was predicted by the MCAS formula presented by Schirmer et al. [5].
A detailed view of lateral intensity distributions of selected positive isotope-resolved secondary ion signals of a spinel crystal (specified in Figure 1, red square at position 4, named “sp”) is presented in Figure 4. While the distribution of Al seems to be homogeneous, the crystal shows a depletion of Li at the rim. Additionally, remarkably, there is a slim line, which is translatable to a crystal plane where the depletion of Li is increased and correlates with an increase of the Mg signal. The sharp rim of the spinel crystal is surrounded by a silicate matrix with patches enriched in Na and K. In these patches, Li is incorporated, as well.
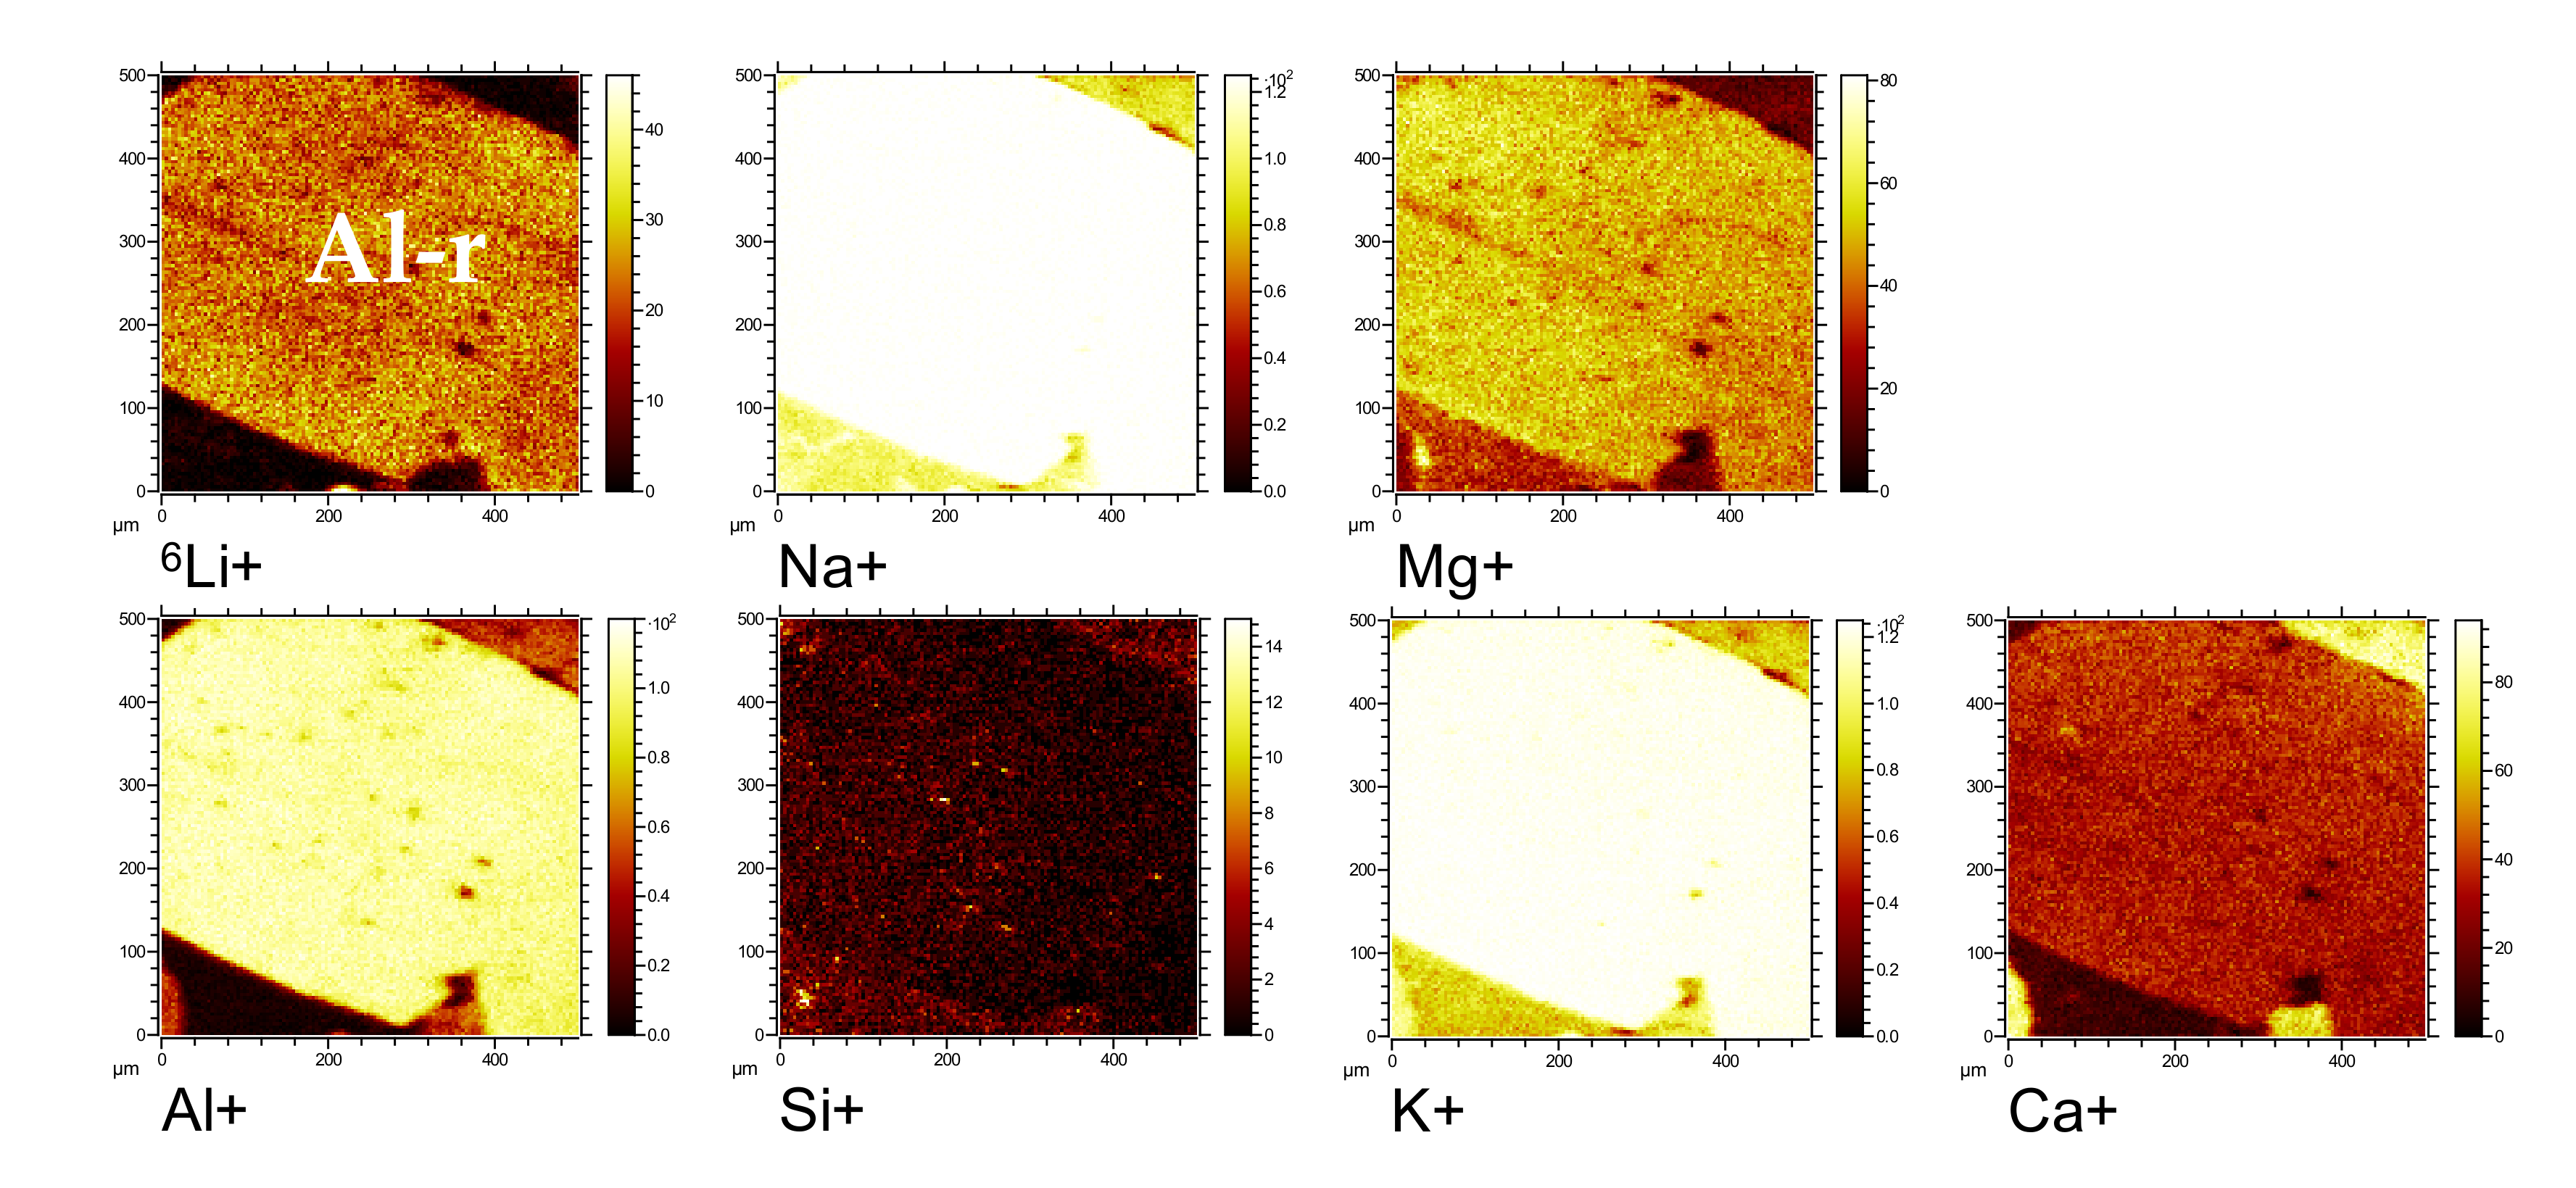
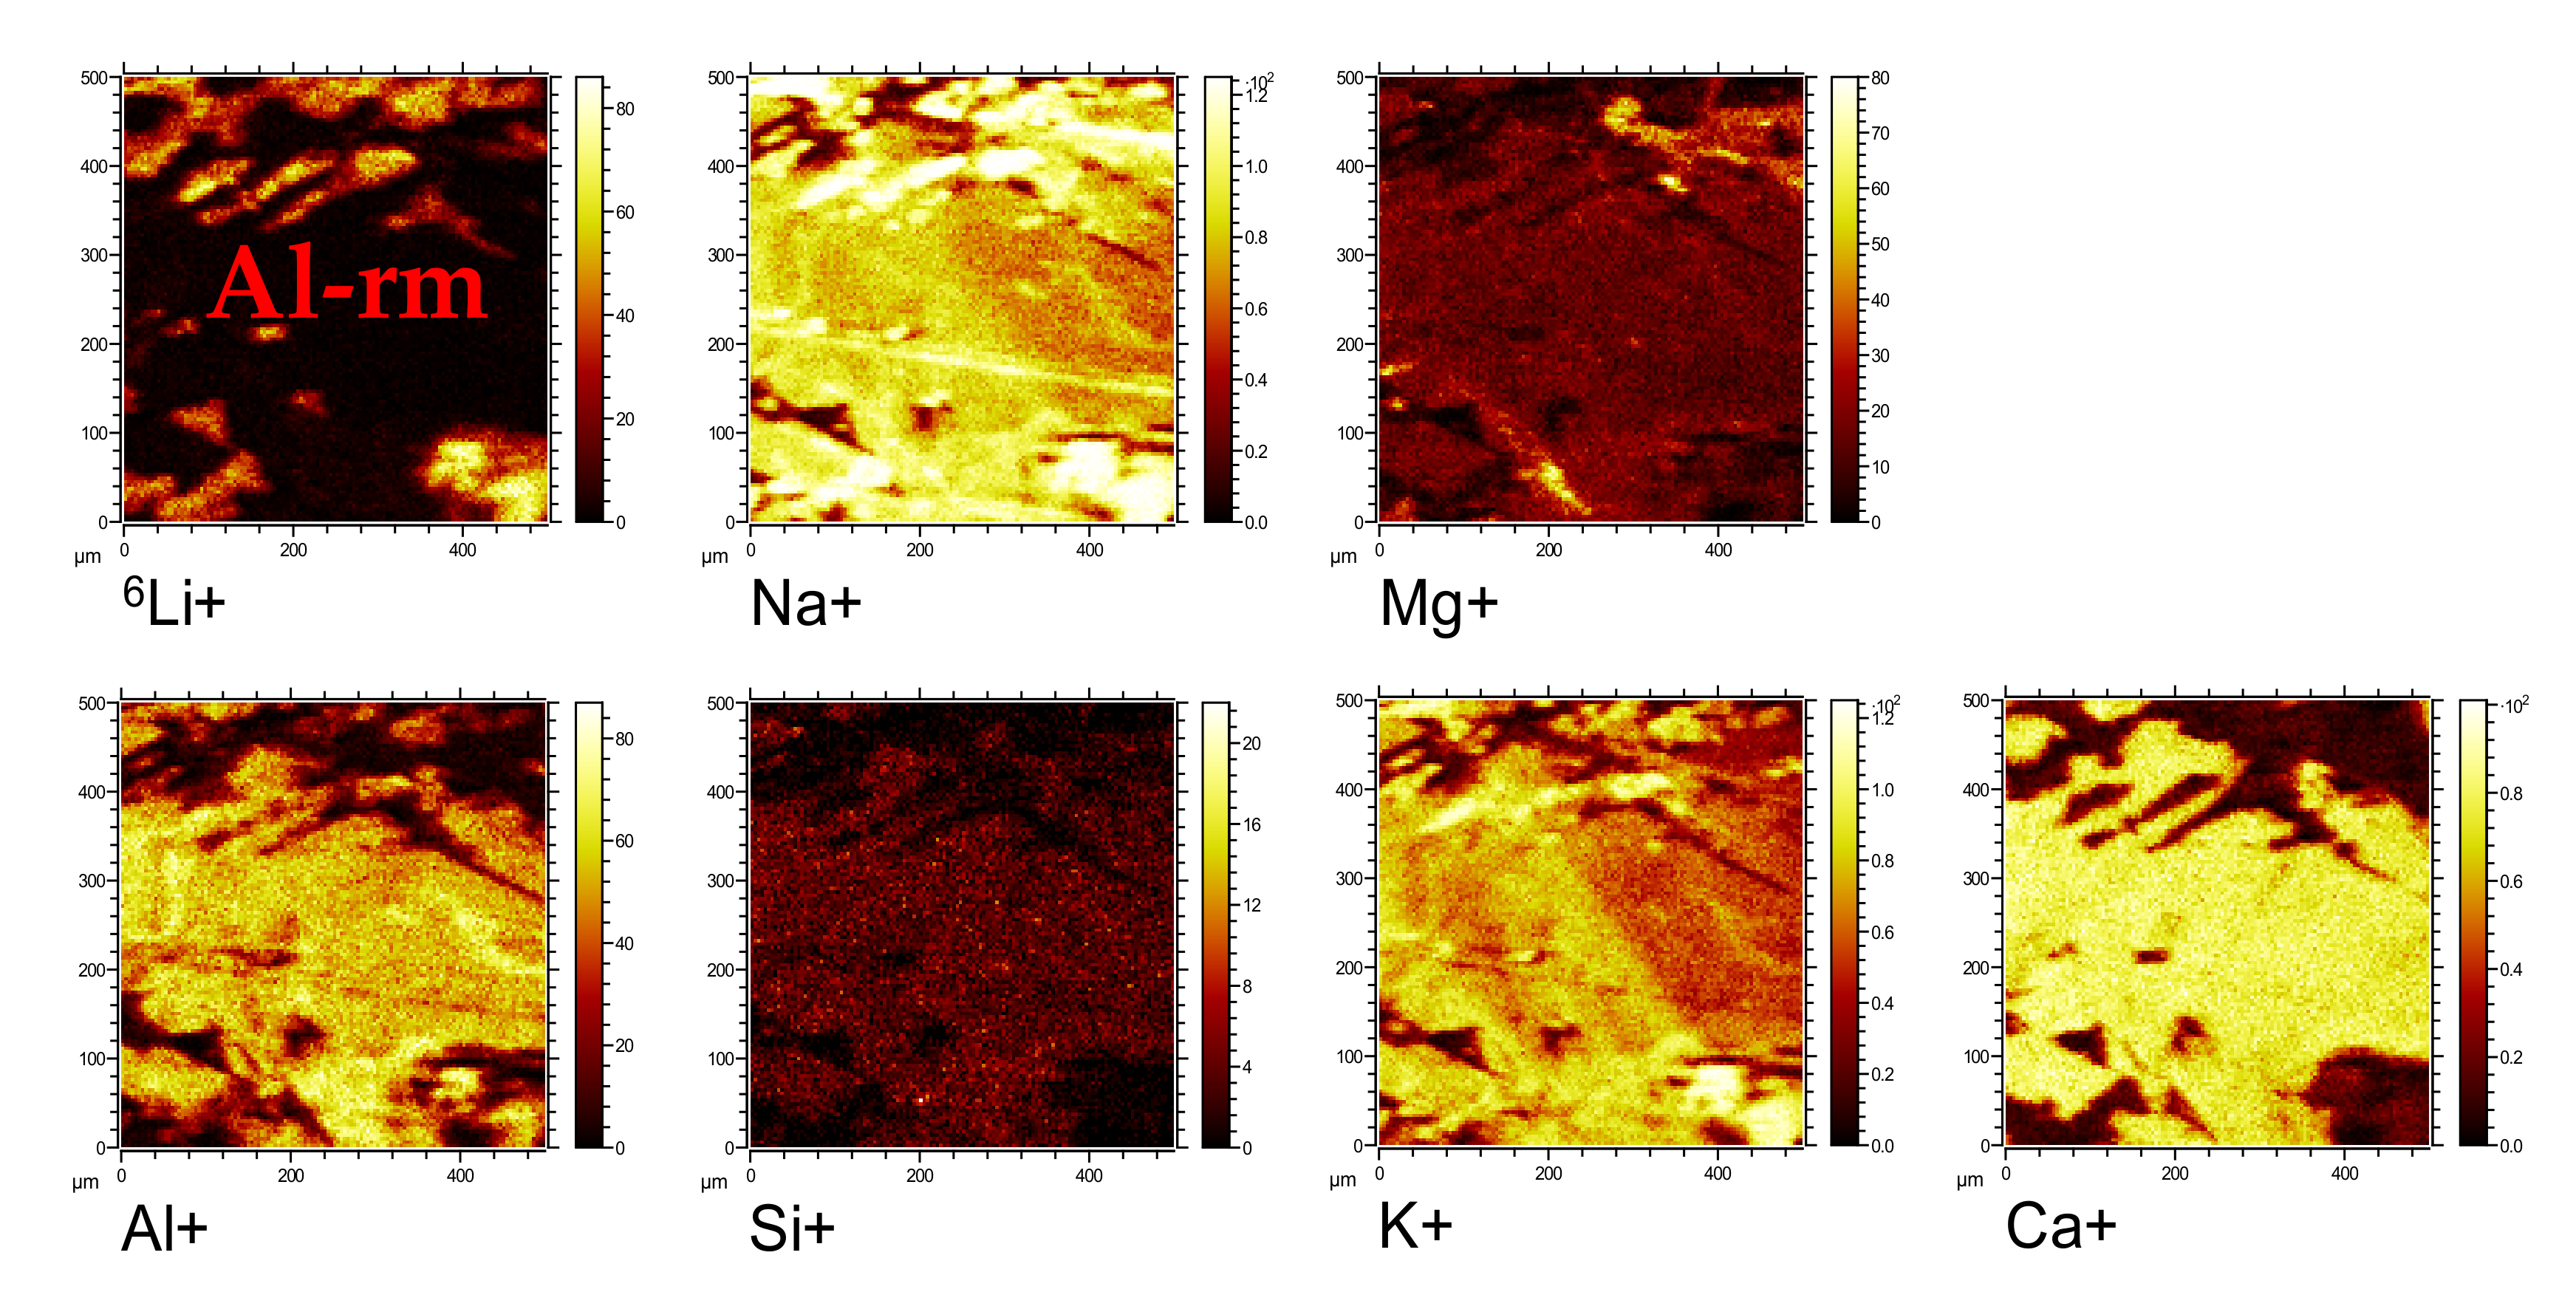
Particularly interesting is the existence of crystals with Al in combination with alkaline elements (including Li) and Mg and small amounts of Ca without Si (Figure 5). This indicates that under certain circumstances, the formation of complex aluminates is also possible.
3.2.2. Synthetic Slag with Mn
According to the results of the EPMA, this slag contains Ca-alumosilicate (MCAS with Mn), LiAl, spinel solid solution ((Li(2x)Mn2+(1 − x))1 + x)(Al(2 − z),Mn3+(z))O4) and ELAS(Mn) solid solution (Li1 − x(Mn3+y,Al1 − (x + y))1 − x(Si1 + x)O4. Because of the presence of Mn, this element is distributed over all phases in the sample. The ELAS(Mn) solid solution is different from the ELAS in the Mn-free material published by Schirmer et al. [5]. Unfortunately, this phase could not (yet) be detected using SIMS. Nevertheless, the behavior of ELAS in the presence of Mn is interesting. Therefore, an example is presented in Table 2.
Table 2 presents the calculated using the virtual compounds LiAlO2, LiMnO2 and SiO2 using a what-if analysis with Si, making it possible to vary with an error of maximum ten percent absolute. The ELAS(Mn) is highly variable, ranging from nearly pure eucryptite to (Li1 − x(Mn3+y,Al1 − (x + y))1 − x(Si1 + x)O4 solid solution with >5 wt.% Mn.
The measured Si concentration of the low Mn ELAS was about 9% higher than the calculated value using virtual compounds (below the allowed error of maxiumum ten percent absolute). Nevertheless, the distinct deviation of the measured and calculated Si values (25.01 and 22.69) cannot yet be explained.
Mn-containing spinel (ss) crystals with high reflectance were easily identified using the optical microscope. One of these crystals was selected for an overview measurement using SIMS (Figure 7a). The overview of the element distribution pattern shows high Al content throughout the whole grain. In contrast, Li and Mn seem to be enriched at the rim of the grain. The grain itself is surrounded by a Ca- and Si-rich matrix (GCAS, MCAS) and a skeleton-like network of an Al-rich phase, most probably LiAlO2. Zooming in on the rim of this grain (Figure 7b) illustrates the enrichment of Li and Mn. In between the grains, a melilitic matrix with elevated concentrations of Na and K can be found, indicating a eutectic residual melt. In this case, the Li concentration in this residual melt is rather low. Zooming in on another homogeneous spinel (ss) grains clearly demonstrates that the high Li concentration is accompanied by high concentrations of Al and Mn, and distinctively less Mg (Figure 7c,d).
All these results impressively prove the incorporation of Li, together with Mn and Al, into a spinel, providing a clear explanation for the role of Mn in hampering the formation of LiAlO2.
4. Discussion
The investigation of Li-containing synthetic slag on the basis of tailored chemical composition is important for understanding crystallization reactions during solidification of the certainly more complex real Li slag resulting from the pyrometallurgical processing of used Li batteries.
Applying the EnAM approach to adopt the slag forming process (e.g., heating/cooling curve or chemistry) requires fundamental mapping of the phase reactions. In addition to thermodynamic modeling, an analytical toolbox or combination method has to be developed. SIMS and EPMA seems to be a suitable combination. EPMA enables the quick survey of samples (even better when used with mineral liberation analysis (MLA)) and high-resolution electron imaging. With stoichiometric calculation based on virtual compounds, Li-bearing phases can be determined and classified. Result can be used to simplified to specify regions of interest for the SIMS analysis, providing the possibility of minute mapping of the Li distribution in the specified phases.
The qualitative SIMS element imaging carried out on the material, as already described by Schirmer et al. [5] and Wittkowski et al. [6], verifies the incorporation of Li into the siliceous (melilitic) matrix, LiAl, and spinel. The ELAS, forming small inclusions in the massive LiAl crystals (Schirmer et al. [5]) was not detected with SIMS.
In the Mn-rich synthetic slag, in addition to the nearly pure eucryptitic ELAS, a Mn-rich species can be found using EPMA that can be stoichiometrically described as (Li1 − x(Mn3+y,Al1 − (x + y))1 − x(Si1 + x)O4. The calculation of the optimized concentrations via virtual compounds was quite successful in the case of the Mn-rich variant (Table 1). The optimization of the Mn-free ELAS leads to a Si content about 9 percent lower than that measured by EPMA. Whether this is due to the calibration, the matrix correction model, or the exsolution of submicron SiO2 whiskers has to be investigated in detail in subsequent research projects.
Nevertheless, the material additionally contains complex aluminum-rich phases with Li, Na, Mg and K, which are not determined with EPMA. Because of the undulant element distribution of some aluminum-rich parts of the sample, there is also an indication of segregation of an aluminum-rich melt. If such a melt exists, it seems not to incorporate Li.
The melilite-like solid solution comprises a homogeneous more-or-less GCAS matrix traversed by streaks of MCAS, enriched in Na, Mg and K, and partly significantly enriched in Li. Because Na and K were not used in the experiment (as they are contaminants), this enrichment most probably represents a eutectic residuum. Particularly interesting is the formation of coatings of this alkali-rich phase around crystals (e.g., spinels) or interstice fillings of skeleton-like LiAl (Figure 2 and Figure 3). It seems that certain properties like the surface charge of the LiAl and spinel crystals trigger the movement of the residual melt. The alkaline-rich MCAS is an indication that Li can also be enriched in a residual melt, which makes the investigation of the first eutectic melt on heating interesting as a second (low-temperature) approach to scavenging Li from slag.
The homogeneous Li enrichment in the spinel firstly confirms the existence of aMg1 − (3/2y)Al2 + yO4/LiAl5O8 solid solution. Secondly, it seems that Li is already incorporated into the spinel at the beginning of the solidification. The rim of the crystal starting with a distinct enrichment of Mg accompanied by a slight reduction of the Li concentration could represent a change in the melt chemistry due to the commencement of LiAl crystallization. A Li-enriched outer rim, as postulated by Schirmer et al. [5], seems not to be realized in this individual crystal. This could be due to the fact that the crystallization of this spinel crystal stopped at an earlier stage of solidification, before the incorporation of the LiAl5O8 component into the spinel solid solution started.
The Mn-containing synthetic slag was analyzed with a special focus on the spinel (ss). The plausibility of Li incorporation in the form of a spinel oxide like(Li(2x)Mn2+(1 − x))1 + x)(Al(2 − z),Mn3+(z))O4 (with minute amounts of Mg) was able to be verified. The incorporation of Mg indicates that the spinel (ss) could be even more complex than the specified stoichiometric formula with Mg2+ on the Mn2+-position.
5. Conclusions
Many modern analytical applications require the spatial determination of light elements. Nevertheless, EPMA is a proven, stable, simple and widespread analytical technology, available in virtually every university. Although light elements like Li cannot be measured, the calculation of Li-bearing phases can be carried out.
The first requirement for accurate determination/calculation of an unmeasurable light element is the maximum reasonably achievable precision of the measurement. Therefore, it is advisable to obtain suitable international reference material representing the matrix of the sample including the light element (here: spodumene, LiAlSi2O6). A check has to be carried out using an in-house standard (here: LiAlO2).
Another requirement is that no other light elements (except for O) are in the sample material. For most technical products, this can be assessed (in contrast to natural materials). The phase of interest has to be divided up into virtual compounds, in which at least one element can be measured by the analytical method used. Without thermodynamic modeling, it would be difficult or impossible to apply the presented calculation approach to temperature- and chemistry-dependent solid solutions (e.g., spinels). The method as described has is only applicable to oxide materials, but could be extended to compounds with other anions (S2− CO32−, etc.).
If all constraints are fulfilled, even complex phases like Mn-ELAS (Li1 − x(Mn3+y,Al1 − (x + y))1 − x(Si1 + x)O4 can be calculated.
Nevertheless, a combination of EPMA measurements (including calculations) with a technique capable of determining Li is required to analytically verify the calculated Li-containing phases. Only through such a combination can Li phases be easily monitored with EPMA and calculated followed by verification and detailed investigation of the real Li incorporation using SIMS, not least with the purpose of mapping Li distribution at the µm scale and correlating these results with a high-resolution electron micrograph (e.g., BSE(Z)).
In this work, the real Li content in the calculated Li-bearing phases, especially in the spinel solid solution, could be verified with SIMS and element distribution patterns, except for the ELAS, which was because of the low abundance and small grain size, which made it extremely difficult to find using optical microscopy. Therefore, in future, a tool for the precise correlation of the BSE image coordinates with those of the optical microscope image should be developed.
Author Contributions
T.S. conceived the paper. T.S. and M.W. conducted the literature review. The SIMS measurements, visualization and interpretation was conducted by M.W., W.B. and M.K. The phase analysis (PXRD, EPMA) and the mineralogical investigation was conducted by T.S. Interpretation and discussion, was conducted by all authors. All authors have read and agreed to the published version of the manuscript.
Funding
This research was funded by the Clausthal University of Technology in the course of a joint research project “Engineering and processing of Artificial Minerals for an advanced circular economy approach for finely dispersed critical elements” (EnAM).
Informed Consent Statement
Not applicable.
Data Availability Statement
Data sharing is not applicable to this article because all relevant data is presented in the tables and images of this article.
Acknowledgments
We acknowledge support by Open Access Publishing Fund of Clausthal University of Technology.
Conflicts of Interest
The authors declare no conflict of interest. The funders had no role in the design of the study, in the collection, analyses, or interpretation of data, in the writing of the manuscript, or in the decision to publish the results.
References
- Elwert, T.; Goldmann, D.; Schirmer, T.; Strauss, K.W. Phase Composition of High Lithium Slags from the Recycling of Lithium Ion Batteries. WoM 2012, 65, 163–171. [Google Scholar]
- Srur-Lavi, O.; Miikkulainen, V.; Markovsky, B.; Grinblat, J.; Talianker, M.; Fleger, Y.; Cohen-Taguri, G.; Mor, A.; Tal-Yosef, Y.; Aurbach, D. Studies of the Electrochemical Behavior of LiNi 0.80 Co 0.15 Al 0.05 O 2 Electrodes Coated with LiAlO 2. J. Electrochem. Soc. 2017, 164, A3266–A3275. [Google Scholar] [CrossRef] [Green Version]
- Haas, A.; Goldmann, D.; Schirmer, T. Challenges and research needs in flotation of synthetic metal phase. In Challenges and Research Needs in Flotation of Synthetic Metal Phases; GDMB Verlag GmbH: Clausthal-Zellerfeld, Germany, 2018; ISBN 978-3-940276-84-1. [Google Scholar]
- Elwert, T.; Goldmann, D.; Schirmer, T.; Strauss, K.W. Recycling of lithium ion traction batteries—The LiBRi project. In Recycling und Rohstoffe Bd. 5, Proceedings of the European Mineral Resources Conference, Leoben, Austria, 19–21 September 2012; TK: Neuruppin, Germany, 2012; ISBN 978-3-935317-81-8. [Google Scholar]
- Schirmer, T.; Qiu, H.; Li, H.; Goldmann, D.; Fischlschweiger, M. Li-Distribution in Compounds of the Li2O-MgO-Al2O3-SiO2-CaO System—A First Survey. Metals 2020, 10, 1633. [Google Scholar] [CrossRef]
- Wittkowski, A.; Schirmer, T.; Qiu, H.; Goldmann, D.; Fittschen, U.E.A. Speciation of Manganese in a Synthetic Recycling Slag Relevant for Lithium Recycling from Lithium-Ion Batteries. Metals 2021, 11, 188. [Google Scholar] [CrossRef]
- Iwatsuki, M.; Tsukada, N.; Fukasawa, T. Analysis of a Magnesium-Containing: β-Eucryptite Solid Solution by the Lattice Constant Method and Its Application. BCSJ 1975, 48, 1217–1221. [Google Scholar] [CrossRef] [Green Version]
- Jercinovic, M.J. Analytical Perils (and Progress) in Electron Microprobe Trace Element Analysis Applied to Geochronology: Background Acquisition, Interferences, and Beam Irradiation Effects. Am. Mineral. 2005, 90, 526–546. [Google Scholar] [CrossRef]
- Merlet, C. Quantitative Electron Probe Microanalysis: New Accurate Φ (ρz) Description. In Electron Microbeam Analysis; Boekestein, A., Pavićević, M.K., Eds.; Springer: Vienna, Austria, 1992; Volume 12, pp. 107–115. ISBN 978-3-211-82359-0. [Google Scholar]
- Vickerman, J.C.; Briggs, D. (Eds.) ToF-SIMS: Materials Analysis by Mass Spectrometry, 2nd ed.; SurfaceSpectra Limited: Manchester, UK, 2013; ISBN 978-1-906715-17-5. [Google Scholar]
- Shannon, R.D. Revised Effective Ionic Radii and Systematic Studies of Interatomic Distances in Halides and Chalcogenides. Acta Crystallogr. Sect. A 1976, 32, 751–767. [Google Scholar] [CrossRef]
- Stracher, G.B. Crystallochemical Behavior of Slag Minerals and the Occurrence of Potentially New Mineral Species From Lapanouse-de-Sévérac, France. In Coal and Peat Fires: A Global Perspective; Elsevier: Amsterdam, The Netherlands, 2019; pp. 243–300. ISBN 978-0-12-849885-9. [Google Scholar]
- Konar, B.; Van Ende, M.-A.; Jung, I.-H. Critical Evaluation and Thermodynamic Optimization of the Li2O-Al2O3 and Li2O-MgO-Al2O3 Systems. Metall. Mater. Trans. B 2018, 49, 2917–2944. [Google Scholar] [CrossRef]
- Paulsen, J.M.; Dahn, J.R. Phase Diagram of Li−Mn−O Spinel in Air. Chem. Mater. 1999, 11, 3065–3079. [Google Scholar] [CrossRef]
- Chatterjee, S.; Jung, I.-H. Critical Evaluation and Thermodynamic Modeling of the Al–Mn–O (Al2O3–MnO–Mn2O3) System. J. Eur. Ceram. Soc. 2014, 34, 1611–1621. [Google Scholar] [CrossRef]
Figure 1.
Overview optical microscopy images of six different positions of the sample. L: Li-aluminate, m: matrix (MCAS, sp: spinel (ss). Red squares: regions of interest (ROI) (see text).
Figure 1.
Overview optical microscopy images of six different positions of the sample. L: Li-aluminate, m: matrix (MCAS, sp: spinel (ss). Red squares: regions of interest (ROI) (see text).

Figure 2.
Overview of the lateral intensity distributions of selected positive isotope-resolved secondary ion signals of two different parts of the sample showing LiAl crystals (left) and LiAl skeleton crystallizates (right) in a Ca-alumosilicate matrix. Due to the signals being too high and the resulting saturation of the detector, the isotopes with smaller natural abundances, 6Li and 44Ca, were chosen for Li and Ca, respectively. Aluminum (Al) has only one isotope, with a mass of 27 amu, and therefore cannot be represented here because of the saturation of the signal.

Figure 3.
Details of the lateral intensity distributions of selected positive isotope-resolved secondary ion signals of a skeleton crystallizate LiAl-phase (L) in a Ca-alumosilicate matrix.
Figure 3.
Details of the lateral intensity distributions of selected positive isotope-resolved secondary ion signals of a skeleton crystallizate LiAl-phase (L) in a Ca-alumosilicate matrix.

Figure 4.
Details of the lateral intensity distributions of selected positive isotope-resolved secondary ion signals of a spinel crystal (sp).
Figure 4.
Details of the lateral intensity distributions of selected positive isotope-resolved secondary ion signals of a spinel crystal (sp).

Figure 5.
Details of the lateral intensity distributions of selected positive isotope-resolved secondary ion signals of an aluminum-rich phase (Al-r) containing Li, Na, Mg and K.
Figure 5.
Details of the lateral intensity distributions of selected positive isotope-resolved secondary ion signals of an aluminum-rich phase (Al-r) containing Li, Na, Mg and K.

Figure 6.
Details of the lateral intensity distributions of selected positive isotope-resolved secondary ion signals of an aluminum-rich phase (Al-rm) containing Na, Mg and K, indicating a melt segregation.
Figure 6.
Details of the lateral intensity distributions of selected positive isotope-resolved secondary ion signals of an aluminum-rich phase (Al-rm) containing Na, Mg and K, indicating a melt segregation.

Figure 7.
(a–d) Details of the lateral intensity distributions of selected positive isotope-resolved secondary ion signals of spinel (ss) grains (sp) depicting the relation of Li, Al, Mn (and Mg).
Figure 7.
(a–d) Details of the lateral intensity distributions of selected positive isotope-resolved secondary ion signals of spinel (ss) grains (sp) depicting the relation of Li, Al, Mn (and Mg).


Table 1.
Repeated measurements on two Li compounds. Spod, spodumene; %StdDev, percentage standard deviation of the measured points (repeats: n = 5); R, recovery; LiAl = LiAlO2.
Table 1.
Repeated measurements on two Li compounds. Spod, spodumene; %StdDev, percentage standard deviation of the measured points (repeats: n = 5); R, recovery; LiAl = LiAlO2.
| wt.% | Average Spod. | %StDev., Spod. | Ref. Spod. | R (%) | Average LiAl | %StDev. LiAl | Ref. LiAl | R (%) |
|---|---|---|---|---|---|---|---|---|
| Al | 15.04 | 0.35 | 14.4 | 104 | 41.24 | 0.22 | 40.9 | 101 |
| Mg | 0 | n. a. | 0 | n. a. | 0.01 | n. a. | 0 | n. a. |
| Ti | 0 | n. a. | 0 | n. a. | 0 | n. a. | 0 | n. a. |
| Mn | 0.05 | n. a. | 0 | n. a. | 0 | n. a. | 0 | n. a. |
| Fe | 0.02 | n. a. | 0 | n. a. | 0.03 | n. a. | 0 | n. a. |
| Ca | 0.01 | n. a. | 0 | n. a. | 0.01 | n. a. | 0 | n. a. |
| K | 0 | n. a. | 0 | n. a. | 0 | n. a. | 0 | n. a. |
| Si | 28.71 | 0.56 | 30 | 96 | 0.01 | n. a. | 0 | n. a. |
| Na | 0.1 | 2.83 | 0.09 | 112 | 0 | n. a. | 0 | n. a. |
Table 2.
Example of a Mn-ELAS determined in the Mn-rich material. Ave: Arithmetic average, RSD: relative standard deviation (n) of repeats, Opt.: Optimized composition of ELAS using virtual compounds, N: number of repeats.
Table 2.
Example of a Mn-ELAS determined in the Mn-rich material. Ave: Arithmetic average, RSD: relative standard deviation (n) of repeats, Opt.: Optimized composition of ELAS using virtual compounds, N: number of repeats.
| wt.% | Ave | RSD | Opt. | wt.% | Ave | RSD | Opt. |
|---|---|---|---|---|---|---|---|
| Al | 21.14 | 3.06 | 21.14 | Al | 16.61 | 5.1 | 16.61 |
| Mg | 0.00 | n.a. | 0.00 | Mg | 0.14 | 5.6 | 0.00 |
| Ti | 0.00 | n.a. | 0.00 | Ti | 0.00 | n.a. | 0.00 |
| Mn(III) | 0.47 | 18.52 | 0.47 | Mn | 5.53 | 6.1 | 5.53 |
| Fe | 0.02 | n.a. | 0.00 | Fe | 0.06 | n.a. | 0.00 |
| Ca | 0.09 | n.a. | 0.00 | Ca | 0.08 | n.a. | 0.00 |
| K | 0.01 | n.a. | 0.00 | K | 0.00 | n.a. | 0.00 |
| Si | 25.01 | 1.40 | 22.69 | Si | 22.19 | 5.1 | 22.19 |
| Na | 0.01 | n.a. | 0.00 | Na | 0.02 | n.a. | 0.00 |
| Li (calc.) | n.a. | n.a. | 5.5 | Li (calc.) | n.a. | n.a. | 4.97 |
| O (calc.) | n.a. | n.a. | 51.2 | O (calc.) | n.a. | n.a. | 48.2 |
| Sum | n.a. | n.a. | 100.9 | Sum | n.a. | n.a. | 97.5 |
| N | 9 | N | 9 | ||||
| Li0.99(Mn3+0.01,Al0.98)0.99(Si1.01)O4 | Li0.95(Mn3+0.13,Al0.82)0.95(Si1.05)O4 | ||||||
Publisher’s Note: MDPI stays neutral with regard to jurisdictional claims in published maps and institutional affiliations. |
© 2021 by the authors. Licensee MDPI, Basel, Switzerland. This article is an open access article distributed under the terms and conditions of the Creative Commons Attribution (CC BY) license (https://creativecommons.org/licenses/by/4.0/).
Share and Cite
MDPI and ACS Style
Schirmer, T.; Wahl, M.; Bock, W.; Kopnarski, M. Determination of the Li Distribution in Synthetic Recycling Slag with SIMS. Metals 2021, 11, 825. https://0-doi-org.brum.beds.ac.uk/10.3390/met11050825
AMA Style
Schirmer T, Wahl M, Bock W, Kopnarski M. Determination of the Li Distribution in Synthetic Recycling Slag with SIMS. Metals. 2021; 11(5):825. https://0-doi-org.brum.beds.ac.uk/10.3390/met11050825
Chicago/Turabian StyleSchirmer, Thomas, Michael Wahl, Wolfgang Bock, and Michael Kopnarski. 2021. "Determination of the Li Distribution in Synthetic Recycling Slag with SIMS" Metals 11, no. 5: 825. https://0-doi-org.brum.beds.ac.uk/10.3390/met11050825
Note that from the first issue of 2016, this journal uses article numbers instead of page numbers. See further details here.