
Influence of Supersaturation on Growth Behavior and Mechanical Properties of Polycrystalline 3C-SiC on W Wire Substrate

School of Materials Science and Engineering, Northwestern Polytechnical University, Xi’an 710072, China
*
Author to whom correspondence should be addressed.
Metals 2022, 12(5), 881; https://0-doi-org.brum.beds.ac.uk/10.3390/met12050881
Submission received: 18 April 2022
/
Revised: 9 May 2022
/
Accepted: 20 May 2022
/
Published: 23 May 2022
(This article belongs to the Special Issue Research on Microstructure and Mechanical Properties of Metallic Materials and Metal-Matrix Composites)
Abstract
:As an important reinforcement for metal matrix composites, the microstructure and mechanical properties of W-core SiC filament have drawn increasing attentions among researchers. In this work, the growth behavior of polycrystalline 3C-SiC on W-wire substrate in the chemical vapor deposition (CVD) process and the evolution of mechanical properties in preparation of W-core SiC filament, were investigated as a function of gas-phase supersaturation. Kinetic studies revealed that the growth of 3C-SiC grains was limited by surface reactions at both 850 °C and 1050 °C, and the deposit experienced similar morphological changes from a porous structure to large clusters, with the increase in supersaturation. Structural analyses and mechanical tests show that the production of pores and the amorphous phase with a low supersaturation, of 9.6 × 10⁷ at 850 °C, resulted in a reduction in the modulus and hardness of the polycrystalline deposits, to 270.3 GPa and 33.9 GPa, while the reduced structural defects (e.g., stacking faults and twins) in highly (111) orientated 3C-SiC grains, as well as the improved surface quality obtained with the medium supersaturation of 1.6 × 10⁷ at 1050 °C, enhanced the tensile strength and the Weibull modulus of W-core SiC filament to 2.88 GPa and 11.2, respectively. During the growth of 3C-SiC grains, the variation in structural defects density is controlled by the critical nucleation energy of the two-dimensional (2D) nucleus.
1. Introduction
W-core SiC filament exhibits high tensile strength, high stiffness and excellent irradiation resistance, and has a good compatibility with many metallic materials. Therefore, it is often used as the reinforcement of metal matrix composites, in developing light-weight structural components in aeroengines and plasma-facing components for fusion reactors [1,2,3]. Considering the mechanical performance of metal matrix composites are, mainly, determined by that of the reinforcement, it is essential to gain insight into the relationship between the microstructure and mechanical properties of W-core SiC filament.
The continuous hot-wire CVD method is, widely, adopted to produce W-core SiC filament [4,5]. In the CVD process, the deposition of SiC is, directly, carried out on an electrically heated W-wire substrate, and the rapid growth of the deposit layer will be finished within several tens of seconds. Since the deposition temperature is usually below 1200 °C, short-period heating has a limited influence on the tensile strength of W wire [6,7]. On the other hand, the deposit layer, mainly, consists of cubic (3C) SiC grains, which occupies over 95 vol% of a commercial W-core SiC filament. Therefore, as a core-shell composite, the mechanical properties of W-core SiC filament are heavily dependent on the growth quality of deposit layer.
Owing to the small difference in the heat of formation of SiC polytypes (1.4–2.6 kJ/mol) and the low stacking fault energies of SiC (2.9–34 mJ/m2), diverse structural defects could be produced in the SiC growth process [8,9,10]. For example, micropipes and dislocations are, frequently, generated during the growth of hexagonal SiC single crystals by physical vapor transport (PVT) and solution growth methods, which will severely damage their electronic performance; stacking faults and twins are often formed in CVD polycrystalline 3C-SiC deposits, which not only have a notable impact on their mechanical properties, but also can lead to crack initiation and propagation [11,12]. Previous studies have shown that the type of in-grown structural defects is related to the growth mode of the SiC nuclei, and defect densities are dictated by growth parameters [13,14].
Supersaturation is an important growth parameter, and its validity in regulating the crystal quality of hexagonal SiC has been widely acknowledged. It is reported that a low supersaturation could improve the surface morphology of 4H-SiC, whereas a high supersaturation was able to eliminate micropipes and screw dislocations’ formation, during the growth of hexagonal SiC monocrystals [15,16,17]. Moreover, the different dependences of the growth rate of SiC polytypes on supersaturation have been revealed in both PVT and solution growth processes, and the so-called ‘polytype-selective growth’ technique has been successfully applied in growing bulk 4H- and 6H-SiC crystals [18,19]. In contrast, only the influence of supersaturation on 3C-SiC nucleation behavior has been studied in the CVD process, and little research focuses on its effects in the growth behavior and mechanical properties of the polycrystalline deposit or the structural defects’ evolution in 3C-SiC grains [20].
With the aim of improving the mechanical performance of W-core SiC filament, the growth behavior of polycrystalline 3C-SiC grains on W-wire substrate, the mechanical properties of the deposit and the resultant filament in continuous hot-wire CVD process were investigated, as a function of gas-phase supersaturation. A newly defined thermodynamic equation was adopted, to calculate the gas-phase supersaturation in the CVD process, and the evolution of structural defects formed on the deposit surface and in 3C-SiC grains were quantitatively assessed in experimental conditions. It is revealed that both the enhanced surface qualities, the reduced stacking faults and twins’ densities can be realized under medium gas-phase supersaturations, which are decisive factors for obtaining W-core SiC filament with high tensile strength and a high Weibull modulus.
2. Experimental Details
2.1. Sample Preparation
SiC deposition was carried out at atmospheric pressure in a Φ2 × 120 cm continuous hot-wire CVD reactor. W wire, with a diameter of 17.8 μm and a mean tensile strength of 3.95 GPa, was employed as the substrate. CH3SiCl3, with a purity of 98%, was used as the precursor, and H2, with a purity of 99.999%, was applied as the carrier and dilute gas. To create different gas-phase supersaturation conditions in the CVD reactor, flow rates of CH3SiCl3 (FCH3SiCl3), in the range of 250–1500 sccm with deposition temperatures (T) at 850 °C and 1050 °C, were adopted during the deposition of 3C-SiC. The flow rate of H2 was kept at 2000 sccm, and the travelling speed of W-wire substrate in the CVD reactor was set to 1.25 cm/s. In this temperature range, the selected flow rates of CH3SiCl3 and H2 could ensure the uniform and rapid growth of SiC deposits on W wire substrate [21,22]. The deposition temperature was measured from the observation window at the center of the reactor, by a WGG 2-201 pyrometer with an error of ± 20 °C. The average deposition time in the reactor was 90 s, and the duration of continuous deposition process was 30 min.
2.2. Microstructure Characterization
The thickness of the deposit layer and the corresponding surface morphology were observed by an FEI Nova NanoSEM 450 (FEI Technologies Inc., Hillsboro, OR, USA). A PANalytical X’ pert Pro diffractometer (PANalytical B. V., Eindhoven, The Netherlands), with a Cu Kα1 (λ = 0.15406 nm) radiation source, was used to analyze the structural characteristics of the deposit. XRD patterns were recorded in the Bragg-Brentano configuration, with a working voltage of 40 kV and a current of 35 mA. Each sample consisted of 50 filaments with a length of 40 mm, which were placed parallel to each other and laid at the center of a glass slide. The whole patterns in the 2θ range of 30–80° were recorded, with a step size of 0.02° and a scanning speed of 2°/min. The texture coefficient of the hkl crystallographic plane (TChkl) in the SiC deposit could be calculated from Equation (1) [23]
where Ihkl and are intensities of (hkl) crystallographic planes in the deposit pattern and the Powder Diffraction File of 3C-SiC (PDF#29-1129), respectively. The single-line method was utilized to analyze the (111) diffraction profiles [24]. The volume-weighted coherently scattering domain size () and the microstrain (e111) along the 111 direction of the 3C-SiC grain could be calculated from the following equations:
where and are the real Lorentz and Gaussian components of the (111) diffraction profile, θ is the corresponding diffraction angle. A standard KCl powder and the approach proposed by Langford were adopted to subtract the contribution of instrumental broadening to diffraction profiles [25,26].
Raman spectra of the deposits were recorded by a Renishaw inVia reflex Raman microscope, in a backscattering configuration. A 514.5 nm Ar+ laser source, with a power of 5 mW, was focused on the cross-sectional surface of each sample. The diameter of the laser spot and the spectral resolution were 1 μm and 1 cm−1, respectively. The density of structural defects (i.e., stacking faults and twins) in 3C-SiC grains could be estimated from the hexagonality (h%) equation:
where ω(TO1) is the wavenumber of the transverse optical (TO) band of 3C-SiC, and ω(TO2) is the wavenumber of the structural-defects-induced TO band of hexagonal SiC [27,28].
h% = 3.4[ω(TO1) − ω(TO2)]
Conventional and high-resolution transmission electron microscopy (TEM) analyses of the deposit’s microstructure and stacking sequences in 3C-SiC grains were performed using an FEI Tecnai G2 F30 TEM (FEI Technologies Inc., Hillsboro, OR, USA), operated at 300 kV. Cross-sectional TEM specimens were sectioned from SiC filament/epoxy composites and fabricated by mechanical grinding and Ar+ ion beam milling. The strain fields in 3C-SiC grains were established by geometry phase analysis (GPA), using the Strain++ software [29].
2.3. Mechanical Tests
Mechanical properties of the deposit were measured by nanoindentation tests using a Hystrion TI 950 TriboIndenter nanoindenter (Hysitron Inc., Minneapolis, MN, USA). The tests were performed at the central part of the deposit layer, with a diamond Berkovich indenter and a peak load of 11 mN. The indentation modulus and the hardness of the deposit were calculated from the load-displacement curves, using the Oliver–Pharr method [30].
Tensile tests of the resultant W-core SiC filaments were carried out using a Grandtry XLD 100C tensile tester (Grandtry Testing Instruments Co., Ltd., Guangzhou, China), with a crosshead velocity at 1 mm/min and a load cell of 50 N. The gauge length of the tensile specimen was 25 mm, and 20 filaments were examined in each group. The failure probability (F) at the stress level of σ is estimated by:
where i represents the rank of a tested specimen arranged in the increasing order of failure strength. The Weibull modulus and the mean tensile strength of W-core SiC filaments were determined, by the two-parameter Weibull function [31]. The elastic modulus of the filaments was calculated from the recorded load-displacement curves.
2.4. Thermodynamic Calculation
The deposition reaction of SiC from CH3SiCl3 can be described as follows:
CH3SiCl3 = SiC + 3HCl
The gas-phase supersaturation (S) in this process can be derived from the equilibrium partial pressure of the related species, by using the following equation:
where Phomo and Phetero represent the partial pressure of CH3SiCl3 and HCl in the homogeneous gas-phase equilibrium state and the heterogeneous gas-solid equilibrium state, respectively, which are calculated from the equilibrium reaction model using the Gibbs energy minimization approach [32,33].
Figure 1 shows the calculated gas-phase supersaturation in different deposition conditions. The iso-supersaturation lines suggest that gas-phase supersaturation in continuous hot-wire CVD process depends more on deposition temperature than on the flow rate of CH3SiCl3. For SiC deposition, a high supersaturation can be created by employing a low deposition temperature and a high CH3SiCl3 flow rate, whereas high deposition temperatures and low CH3SiCl3 flow rates are necessary to build low supersaturations in the reactor. In experimental deposition conditions, the gas-phase supersaturation increases from 9.6 × 10⁷ to 1.7 × 10⁹, with the flow rate of CH3SiCl3 increasing from 250 sccm to 1250 sccm at 850 °C, which exhibits an increase from 5.4 × 10⁶ to 2.5 × 10⁷ when the deposition temperature further increases to 1050 °C.
3. Results and Discussion
3.1. Growth Kinetics of the Deposit
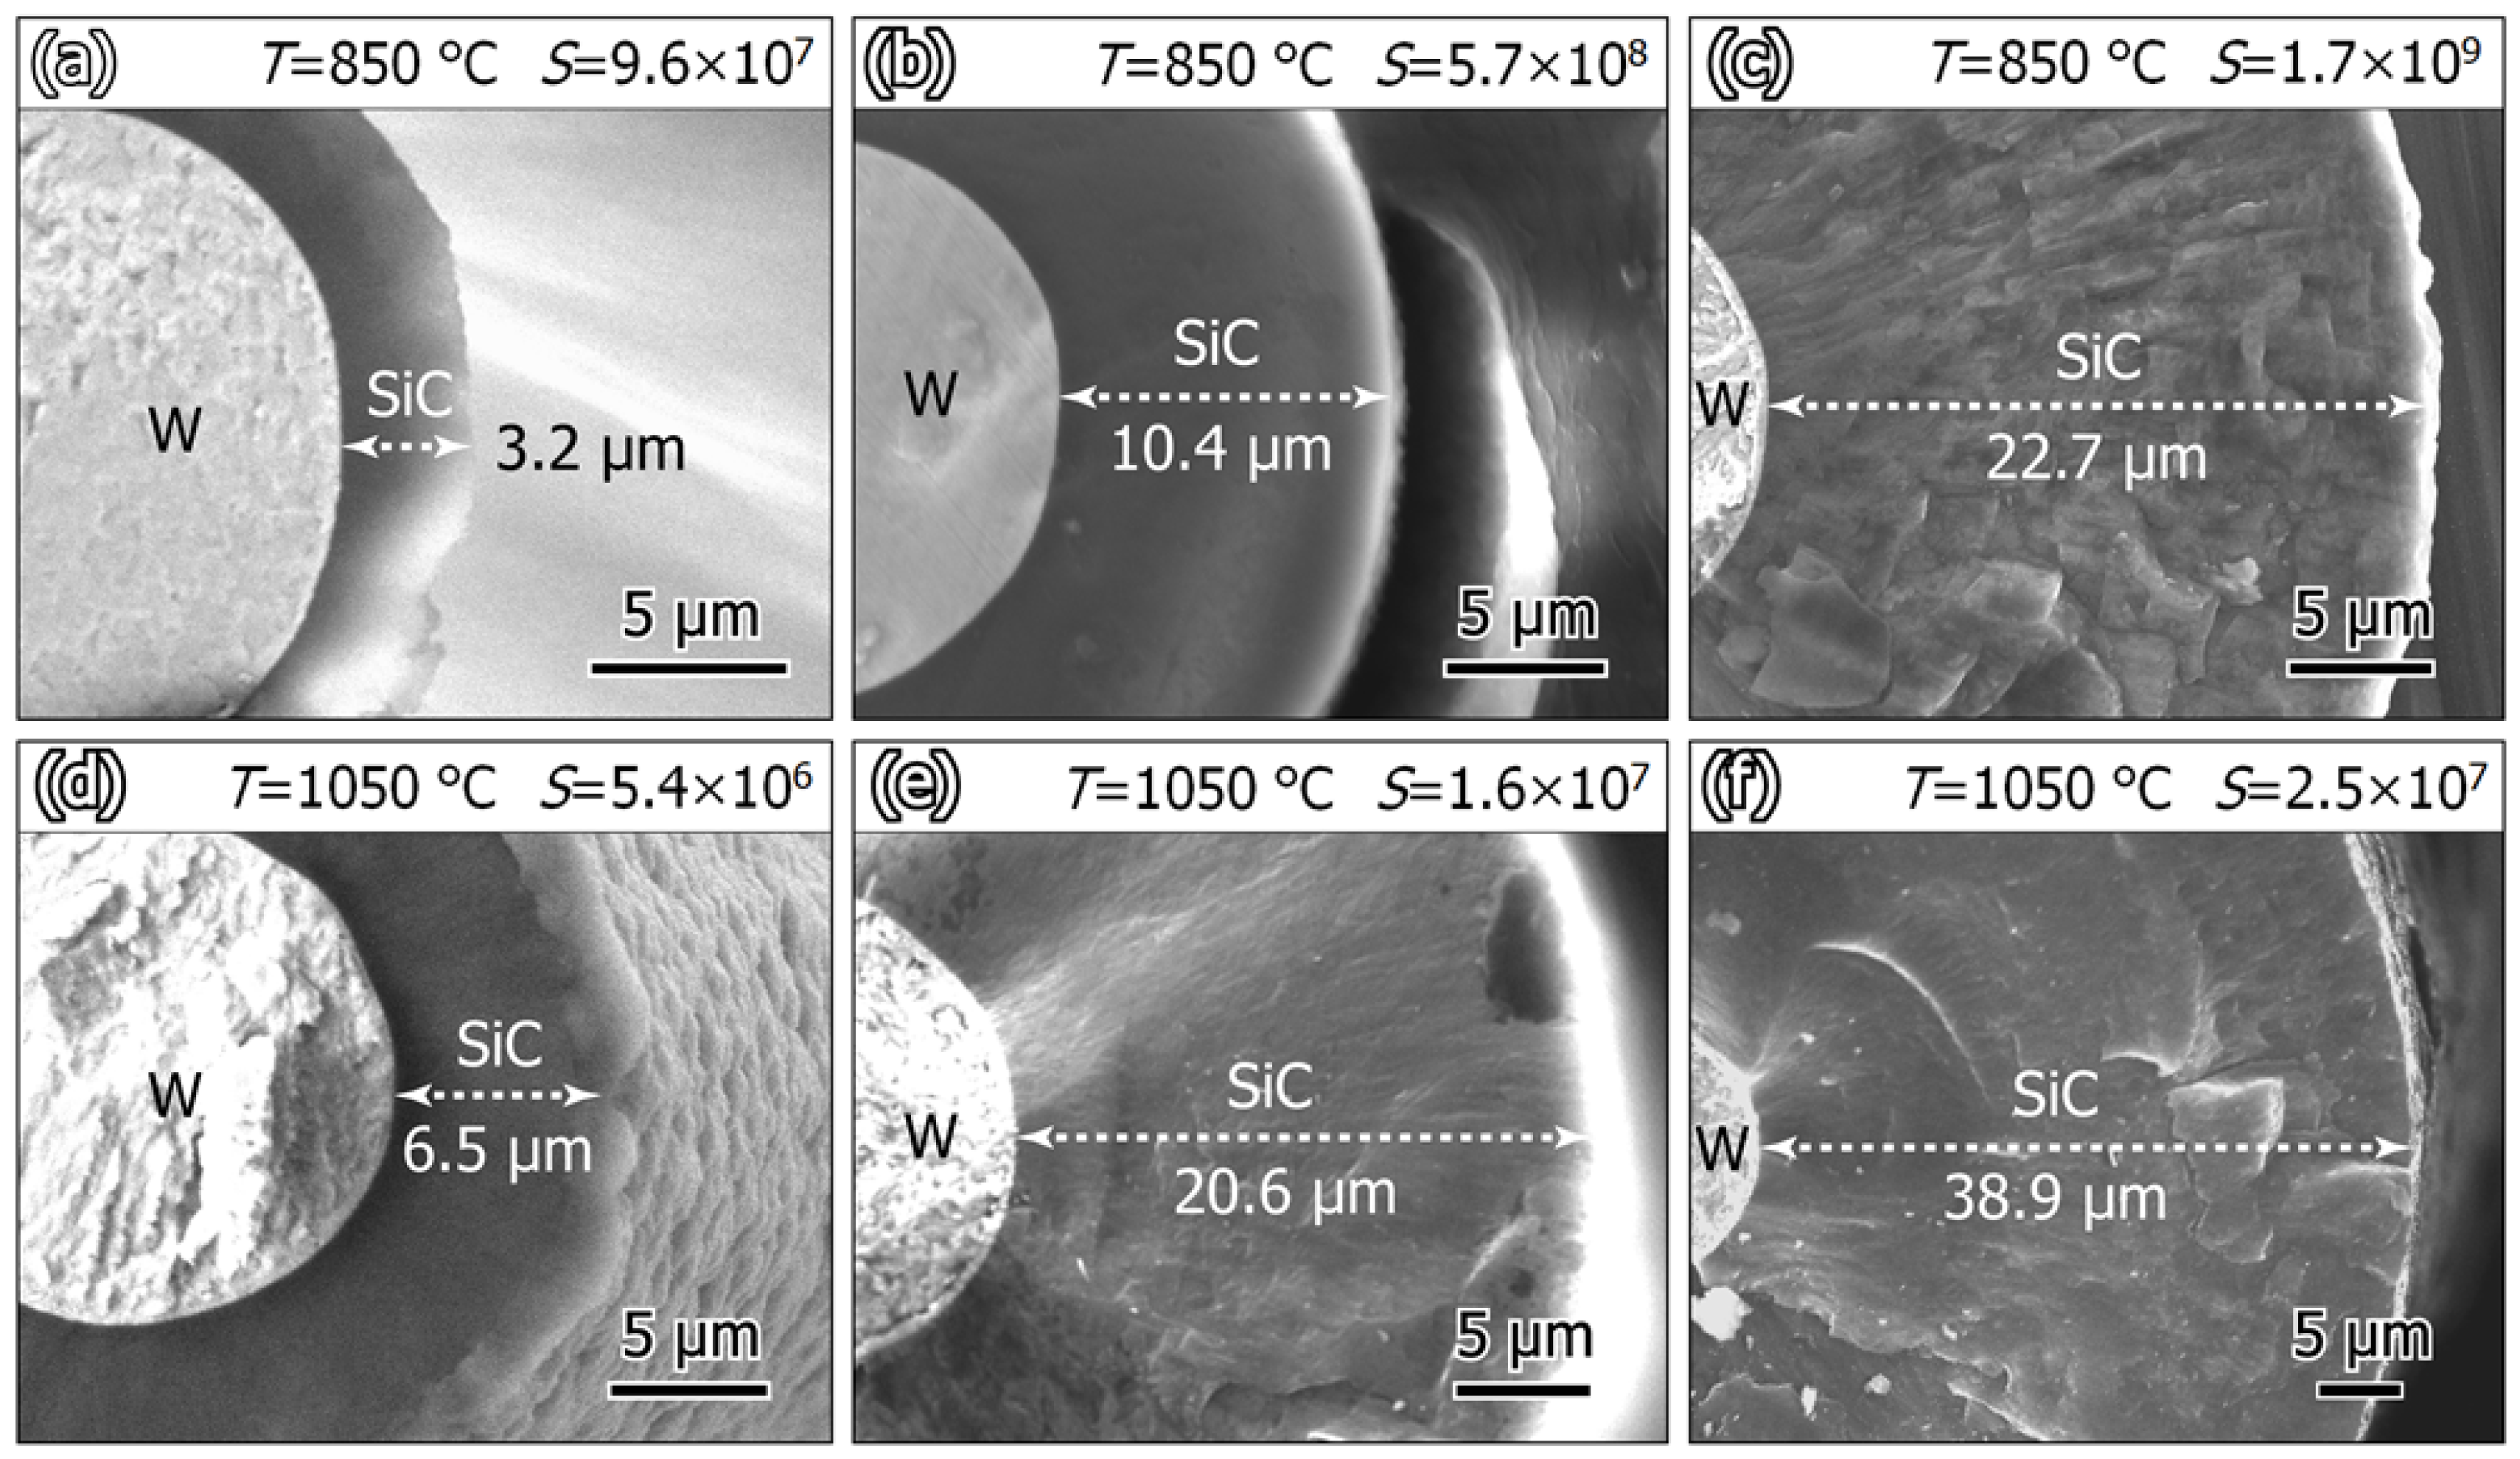
Figure 2 presents the thickness of deposit layer, prepared at different deposition temperatures and gas-phase supersaturations. It can be seen from Figure 2a–c that the increase in supersaturation, from 9.6 × 10⁷ to 1.7 × 10⁹ at 850 °C, enabled the deposit layer to increase from 3.2 μm to 22.7 μm. Meanwhile, as displayed in Figure 2d–f, a rapid growth of the deposit from 6.5 μm to 38.9 μm took place at 1050 °C, with the supersaturation increasing from 5.4 × 10⁶ to 2.5 × 10⁷. At both 850 °C and 1050 °C, an increase in the flow rate of CH3SiCl3 not only can enhance the gas-phase supersaturation, but also can provide more precursor for SiC deposition. Besides, an increase in deposition temperature is able to accelerate the endothermic decomposition process of CH3SiCl3 in the gas phase as well as the reactions of intermediates on W-wire substrate, both of which are beneficial to deposit growth [34,35]. As a result, deposits with increased thicknesses were obtained, at the elevated gas-phase supersaturations and the elevated deposition temperature.
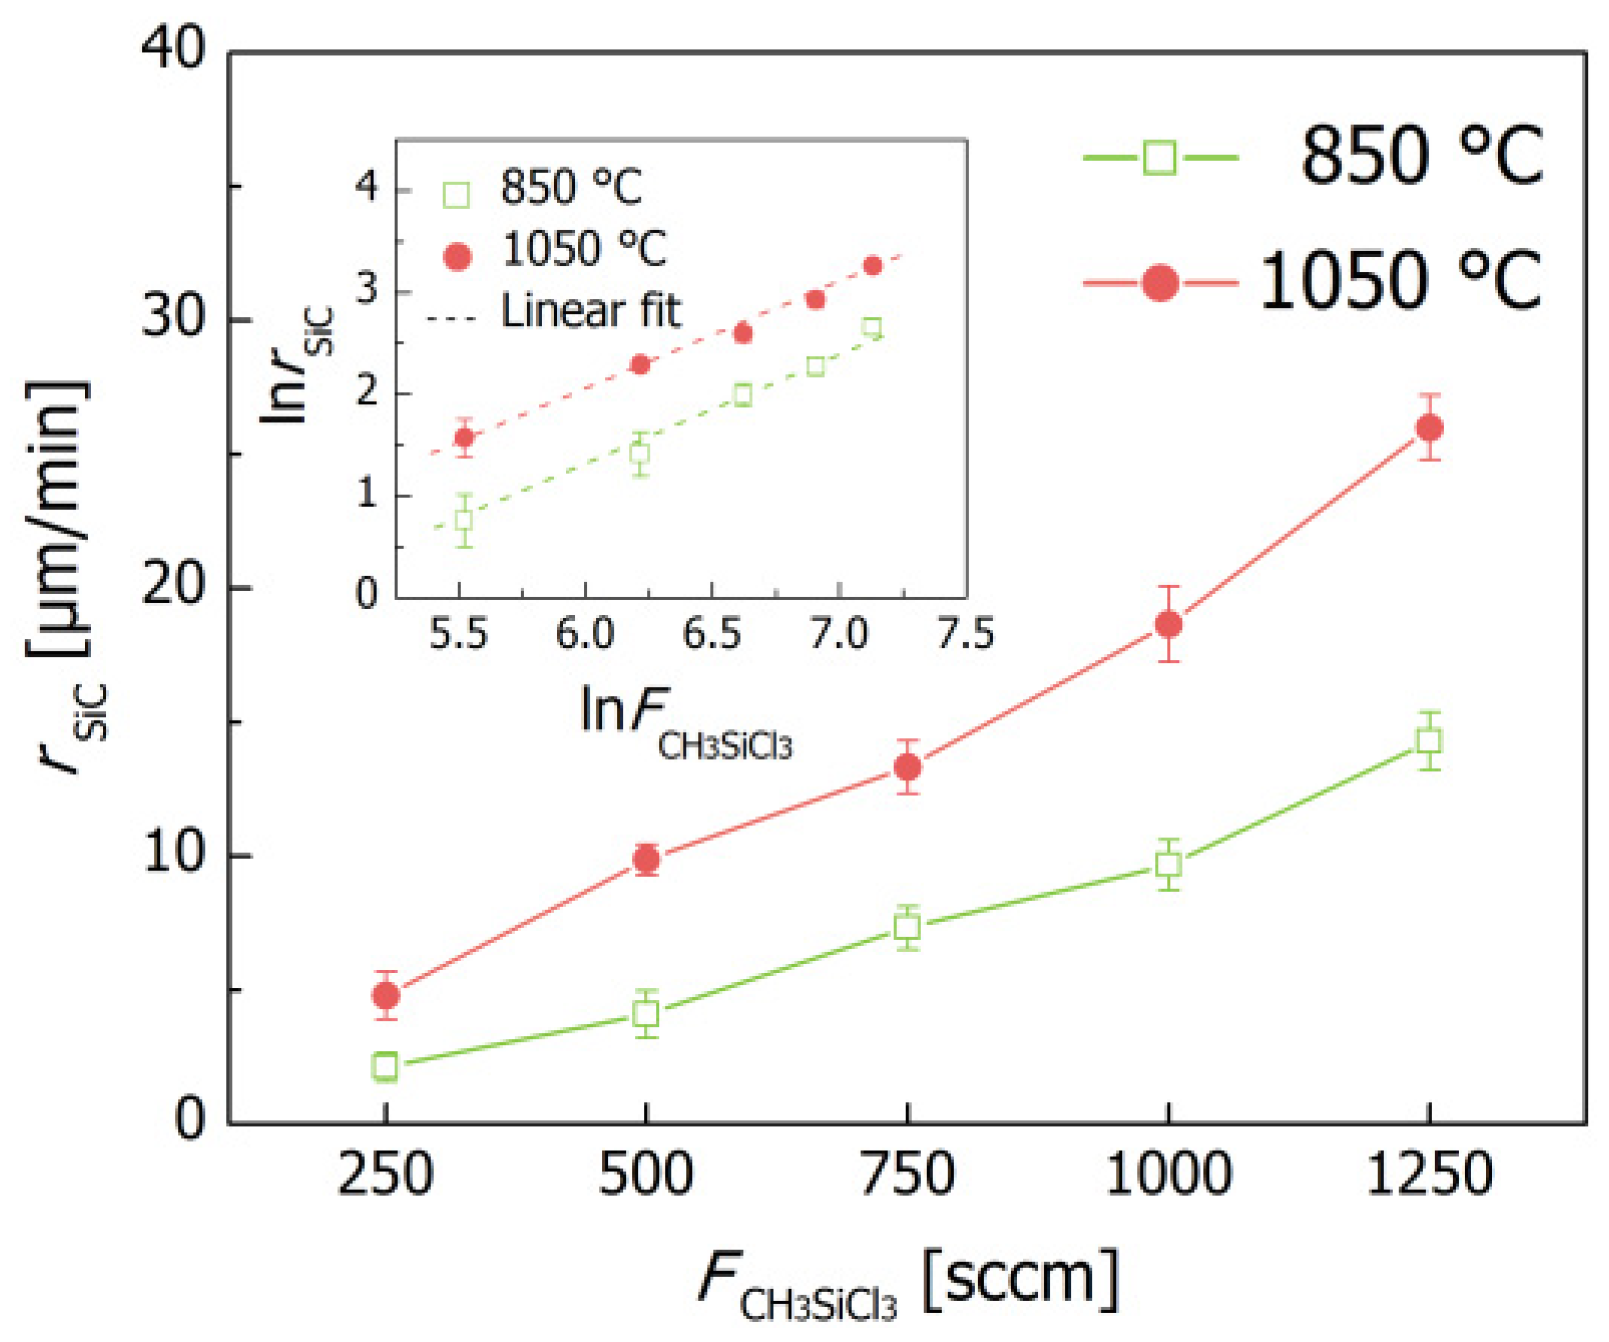
Figure 3 illustrates the growth kinetics of the deposit in different deposition conditions. At 850 °C, the growth rate of the deposit increased from 2.1 μm/min to 14.3 μm/min, with the flow rate of CH3SiCl3 increasing from 250 sccm to 1250 sccm, which experienced an increase from 4.8 μm/min to 25.9 μm/min, when the deposition temperature reached 1050 °C. It can be drawn from the inset that the growth behavior of the deposits at both 850 °C and 1050 °C can be described by the following Arrhenius equation:
This result suggests that when deposition processes were carried out at the same flow rate of CH3SiCl3, the growth rate of the deposit would be, largely, determined by the deposition temperature. Therefore, it could be concluded that the deposition process is limited by surface reactions in this temperature range [36]. This growth mechanism can also explain that, although much higher gas-phase supersaturations were established at 850 °C, relatively low growth rates were obtained in deposition process.
3.2. Surface Morphology and Microstructure of the Deposit
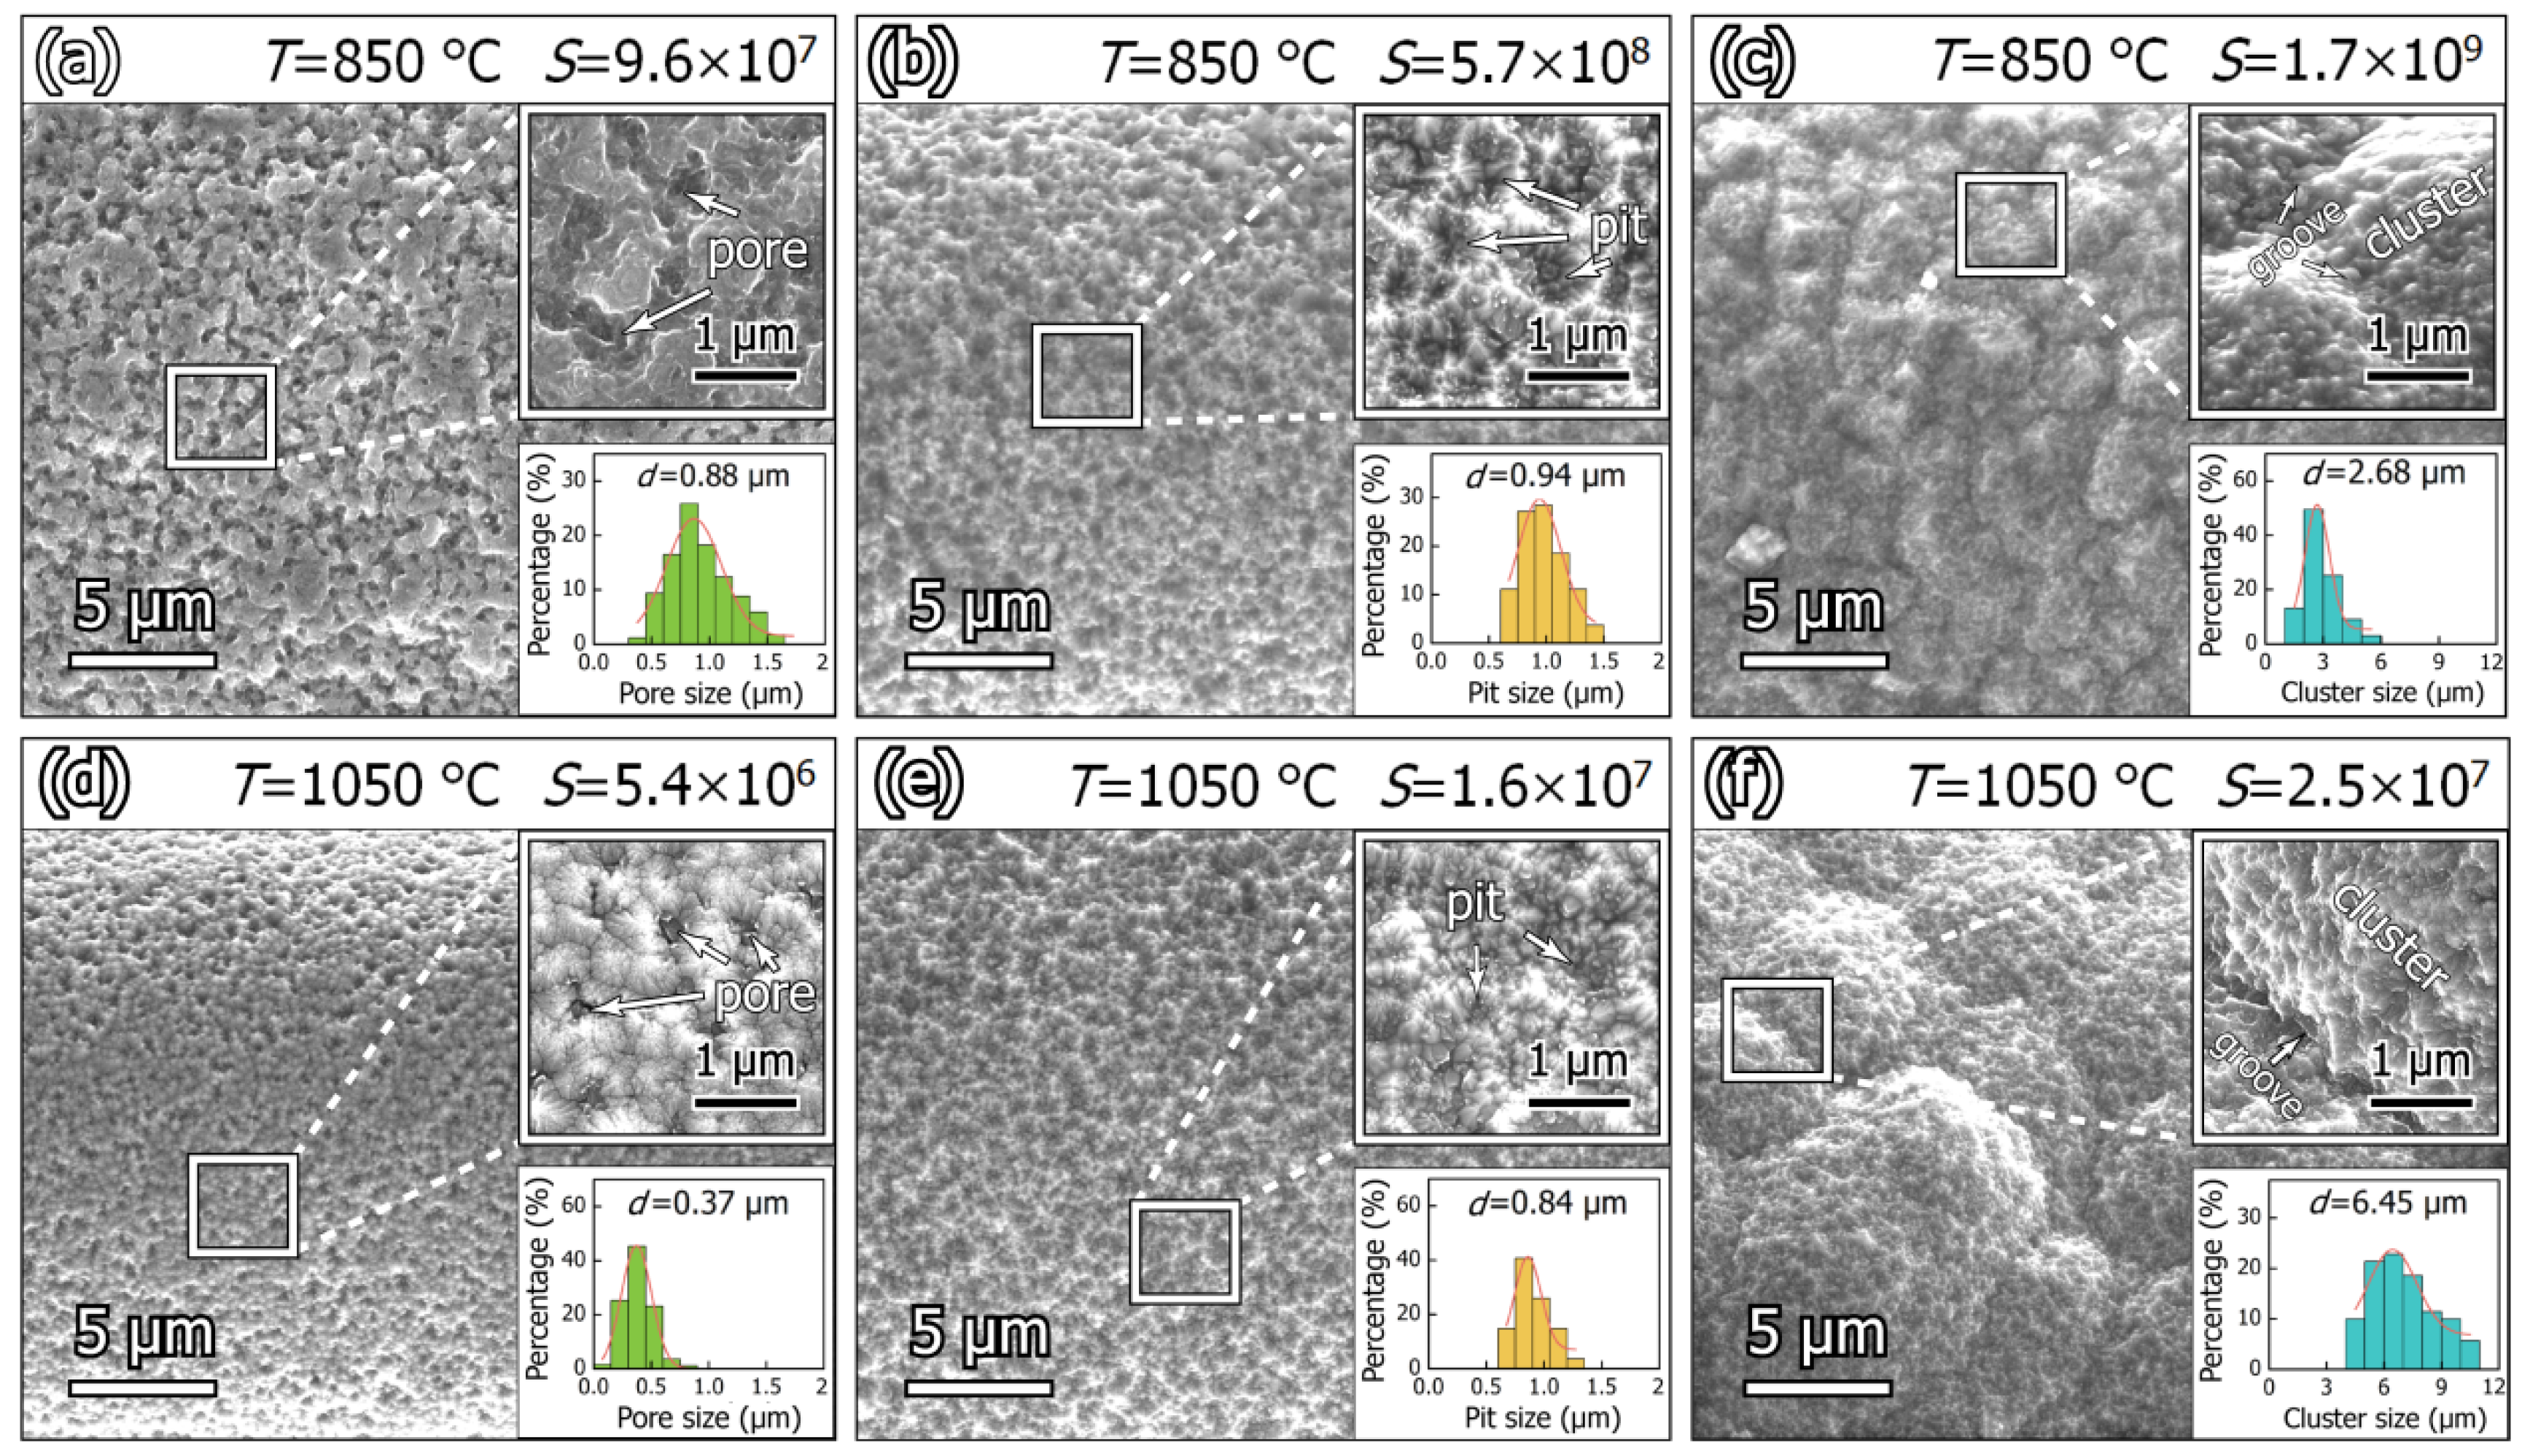
Figure 4 exhibits the surface morphology of the deposit obtained in different deposition conditions. It can be seen from Figure 4a that a porous surface was formed at 850 °C, with supersaturation of 9.6 × 10⁷. As shown in the inset, the pores are interconnected and have a mean size of 0.88 μm. When the supersaturation rose to 5.7 × 10⁸, Figure 4b, clearly, demonstrates that the increased deposition rate promoted the growth of fine faceted grains, and numerous pits with an average size of 0.94 μm were formed on the dense deposit surface. In Figure 4c, the deposit prepared with the supersaturation of 1.7 × 10⁹ exhibits a rough surface morphology, which consists of clusters and grooves. The average size of the cluster is 2.68 μm. In Figure 4d, the surface morphology of deposit prepared at 1050 °C, with supersaturation of 5.4 × 10⁶, is similar to that obtained in the low supersaturation condition at 850 °C, except that the pores are isolated and the average size has decreased to 0.37 μm. When the supersaturation increased to 1.6 × 10⁷, the uniformly distributed faceted grains and the shallow pits, with a decreased size of 0.84 μm, enable the deposit to demonstrate a homogeneous and compact surface morphology in Figure 4e. As displayed in Figure 4f, when the supersaturation was 2.5 × 10⁷, large clusters with an average size of 6.45 μm were produced on the deposit surface, and deep grooves could be observed around them, which further increased the surface roughness of the deposit. Since deposit growth was limited by surface reactions in this temperature range, the porous structure produced in low supersaturation situations at 850 °C should be attributed to the insufficient production of gas-phase intermediate species and restricted diffusion of adatoms on W wire substrate, while the occurrence of facet grains and rough surface morphologies in higher supersaturation conditions are related to the preferential growth of coarse grains with abundant intermediates [37].
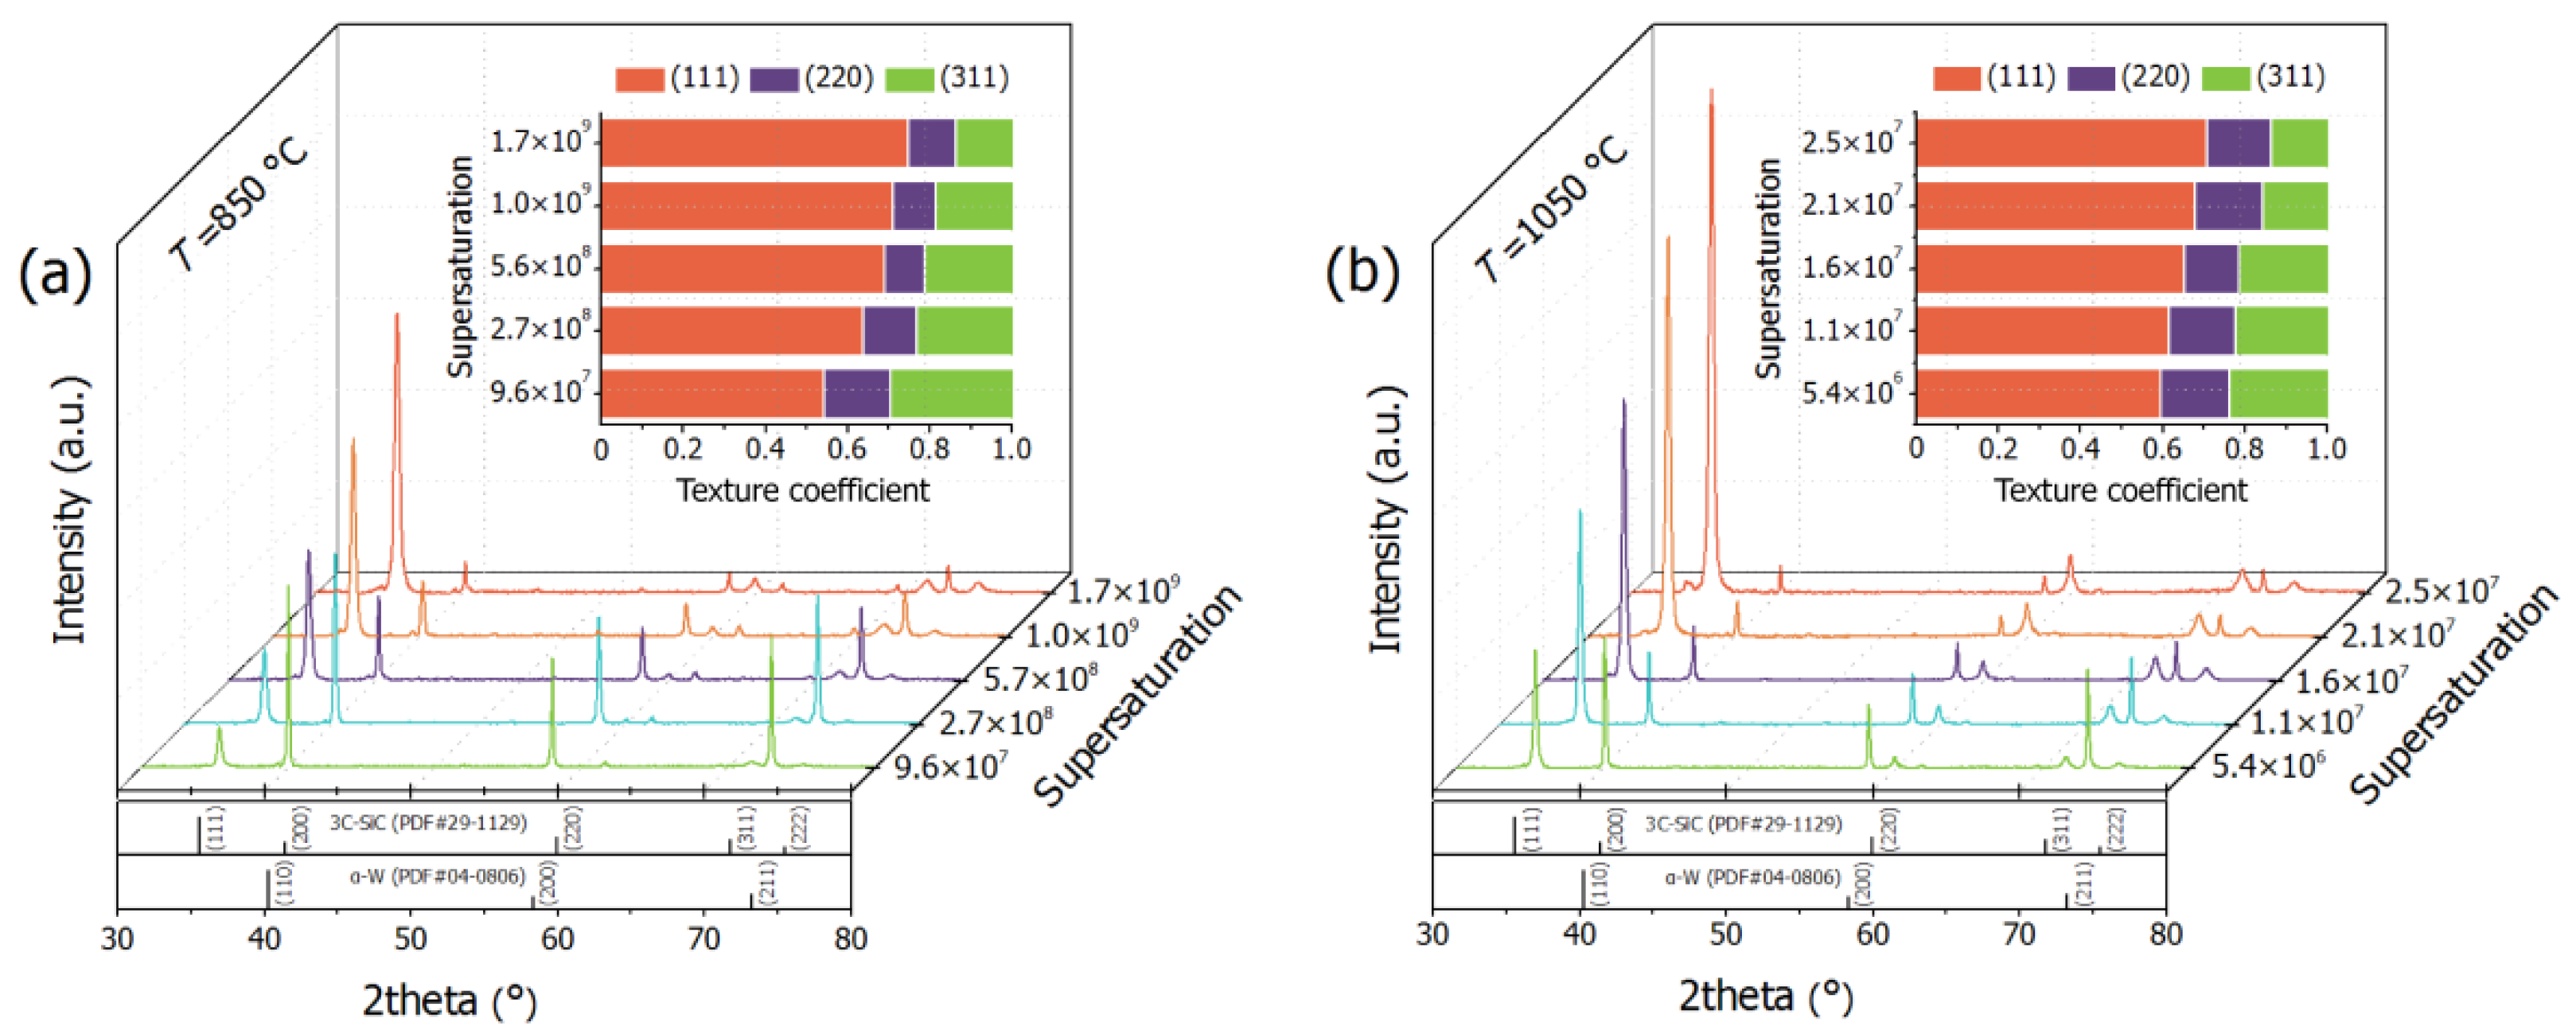
Figure 5 shows the XRD patterns of the resultant W-core SiC filaments, which mainly consist of signals from the 3C-SiC deposit and the W-wire substrate. At both 850 and 1050 °C, the diffraction peaks of 3C-SiC are intensified with the increase in supersaturation, which are due to the growth of the deposit layer. It can be drawn from the insets that the texture coefficient of (111) plane is much higher than those of (220) and (311) planes in each deposition condition, which suggests that a strong (111) texture was developed during the growth of the 3C-SiC deposit. In addition, the texture coefficient of the (111) plane increased from 0.55 to 0.74, with the supersaturation increasing from 9.6 × 10⁷ to 1.7 × 10⁹ at 850 °C, which grew from 0.59 to 0.69 at 1050 °C, with the increase in supersaturation from 5.4 × 10⁶ to 2.5 × 10⁷, indicating that when an increased growth rate of the deposit on W wire substrate could be realized in higher supersaturation conditions, the growth of 3C-SiC grains along the 111 direction would be strengthened in the deposition process. The relationship between growth rate and the preferential orientation of the deposit in a surface reaction limited CVD process can be described by:
where k0 is the rate constant, V is the molar volume of the deposit and Nhkl is the atomic density of (hkl) plane [38]. In 3C-SiC, the (111) plane possesses the highest Si-C pair density (2.02 × 10⁵ mol/m2). Thus, the preferential growth of 3C-SiC grains along the 111 direction could yield higher growth rates in elevated supersaturation situations.
The volume-weighted coherently scattering domain size and microstrain in the 111 direction, of the deposited 3C-SiC grains, are listed in Table 1. It is observed that the average domain size experienced a decrease from 168 Å to 137 Å, with the supersaturation increasing from 9.6 × 10⁷ to 1.7 × 10⁹ at 850 °C, and the microstrain increased from 1.86 × 10⁻³ to 2.59 × 10⁻³. Likewise, when the deposition temperature was 1050 °C, the increase in supersaturation, from 5.4 × 10⁶ to 2.5 × 10⁷, resulted in the average domain size decreasing from 213 Å to 156 Å, which is accompanied by the microstrain increasing from 1.72 × 10⁻³ to 2.88 × 10⁻³. These results suggest that, although an increased supersaturation could promote the deposition rate and facilitate the development of the (111) texture in the deposit, it tends to reduce the domain size and enhance the microstrain in the 111 direction of the deposited 3C-SiC grains.
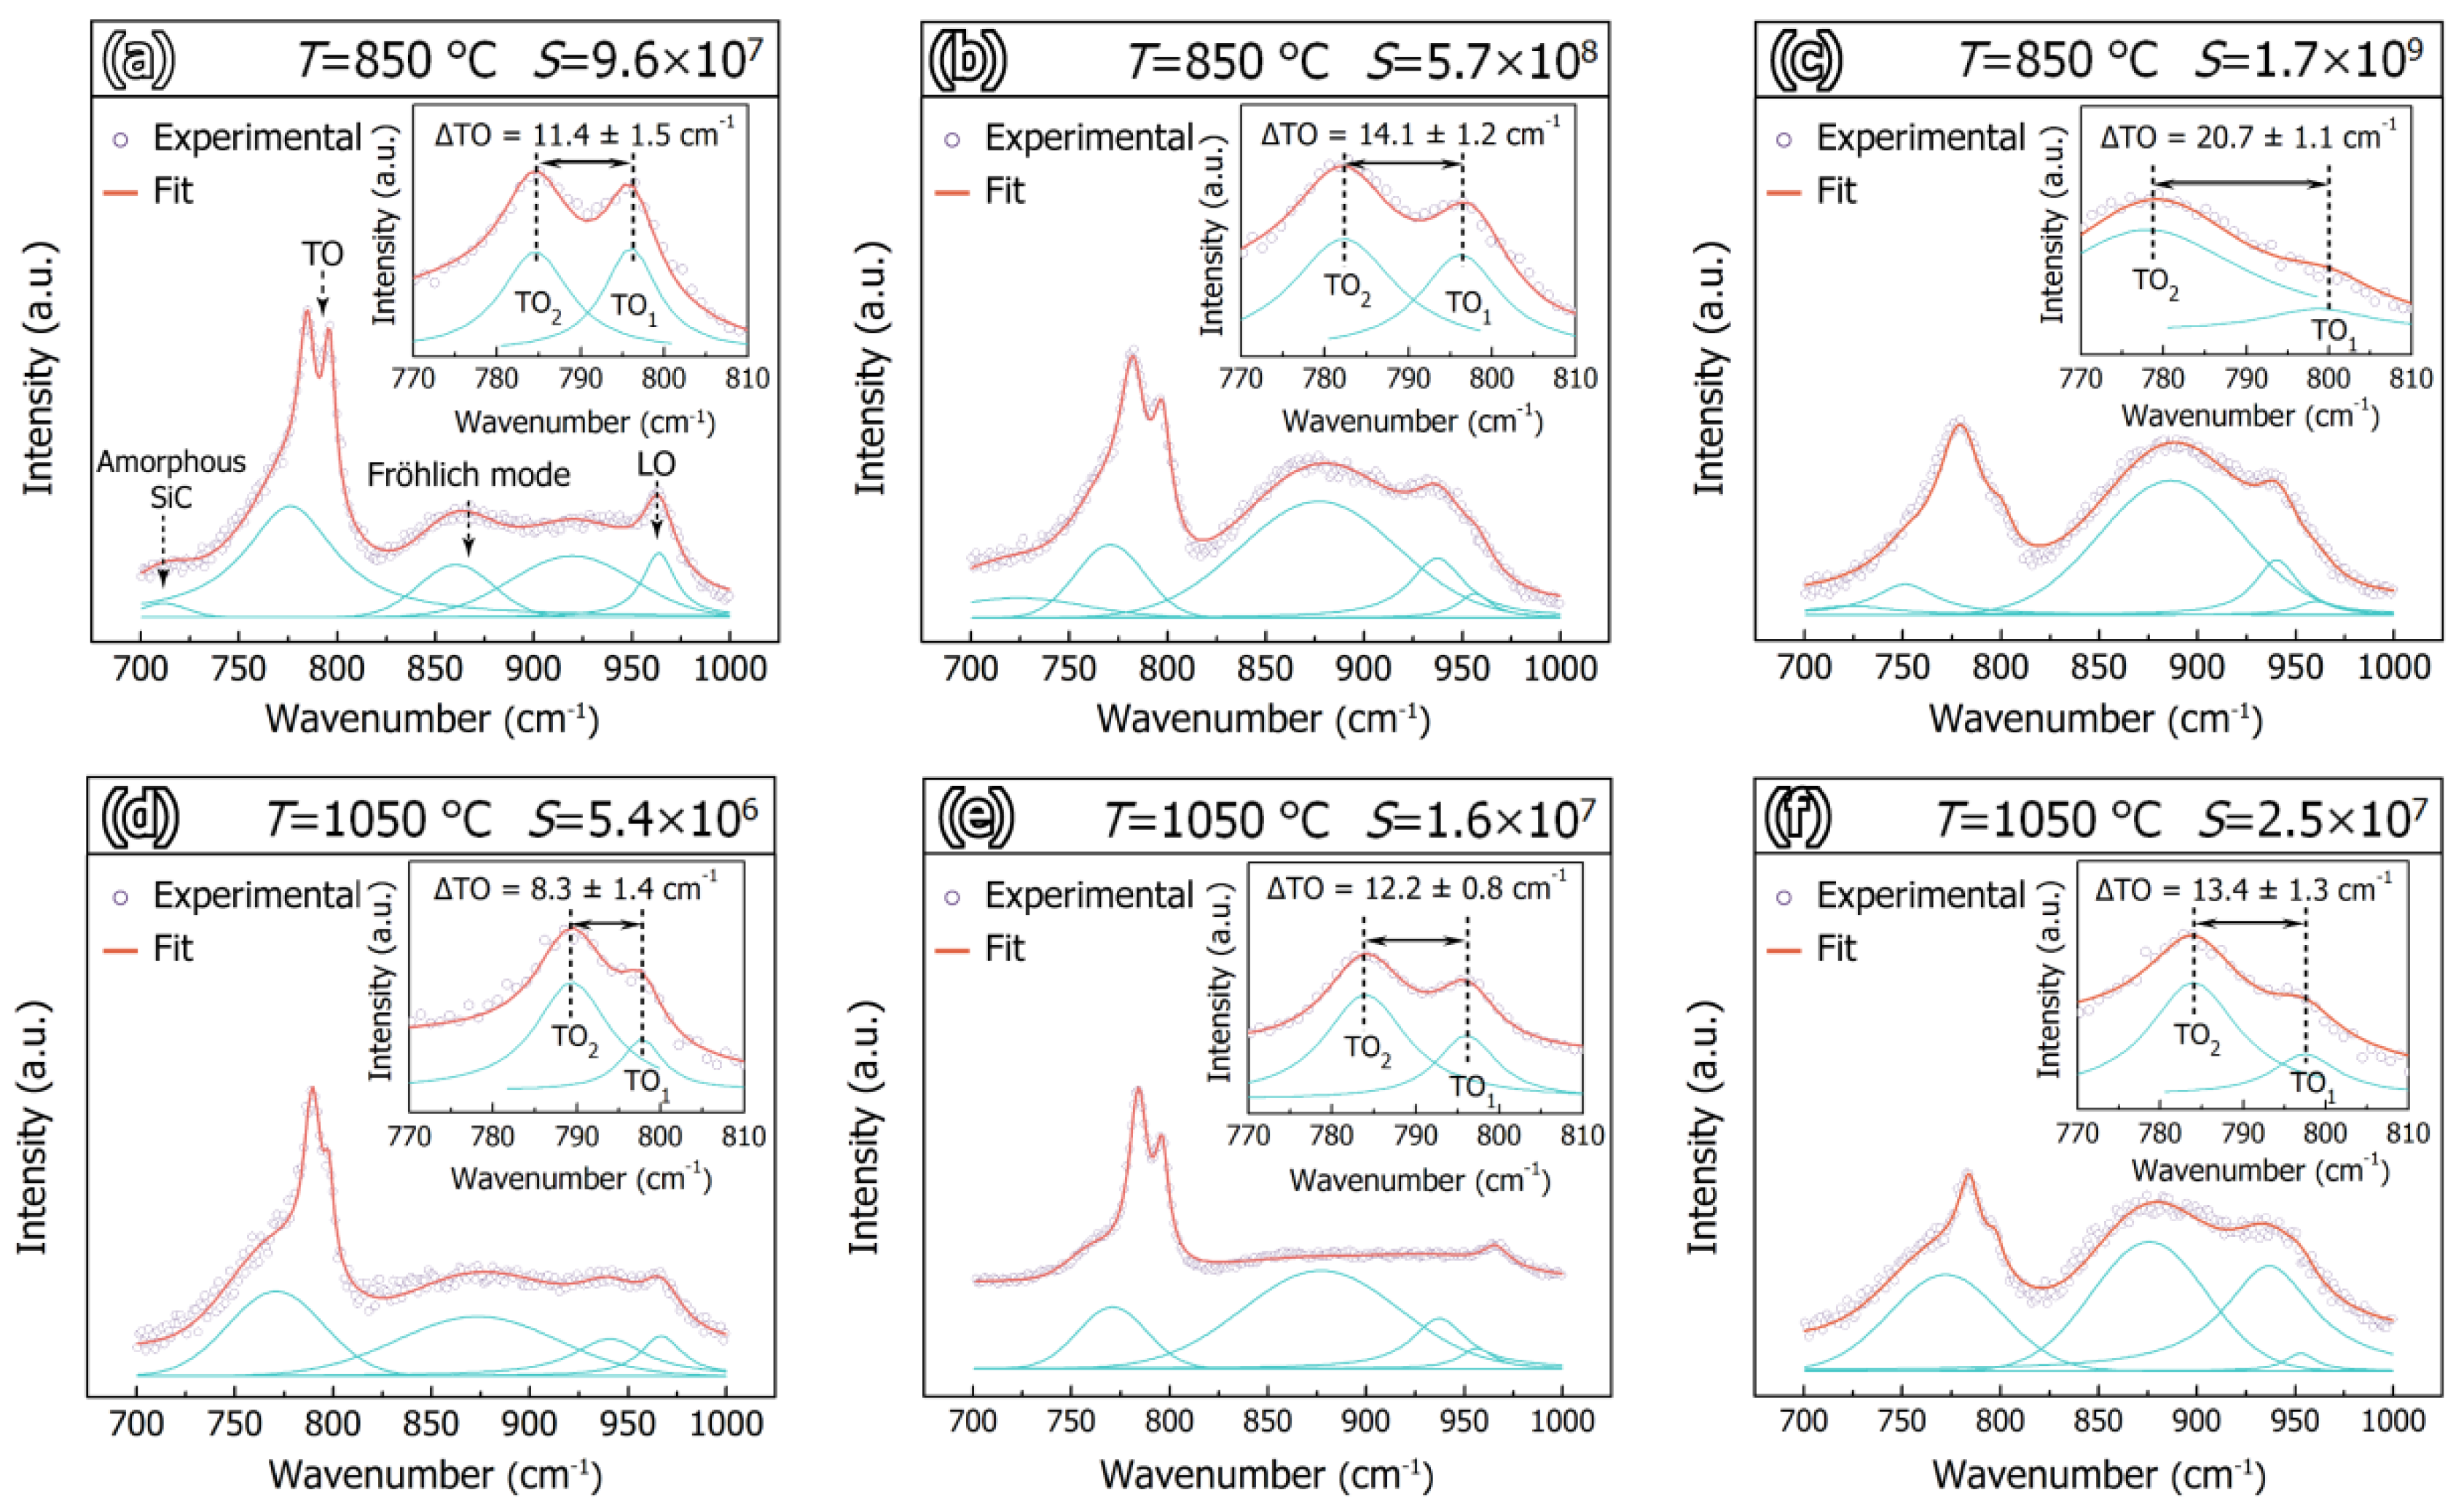
Figure 6 displays the Raman spectra of the deposits, prepared in different deposition conditions. As shown in Figure 6a, the longitudinal optical (TO) and the transverse optical (LO) bands of 3C-SiC are located at ~790 cm−1 and ~970 cm−1, respectively. It can be observed from the inset that the TO band has split into two components, TO1 and TO2, as a result of the formation of stacking faults and twins in the 3C-SiC grains [39]. Besides, the broad band at ~720 cm−1 is aroused by amorphous SiC, the bands at ~770 and ~950 cm−1 are caused by hexagonal SiC polytypes and the Fröhlich mode, which is produced by the interaction between the incident photons and structural defects, occurs at ~870 cm−1 [40,41,42]. At 850 °C, the signal from amorphous SiC decreased with the increase in supersaturation, and the splitting of the TO band increased from 11.4 to 20.7 cm−1. Although little amorphous SiC was deposited at 1050 °C, the splitting of the TO band still experienced an increase from 8.3 cm−1 to 13.4 cm−1 during the supersaturation, increasing from 5.4 × 10⁶ to 2.5 × 10⁷. In addition, at both 850 °C and 1050 °C, the Fröhlich mode was intensified in high supersaturation conditions, indicating more structural defects that were formed during the growth of the 3C-SiC grains.
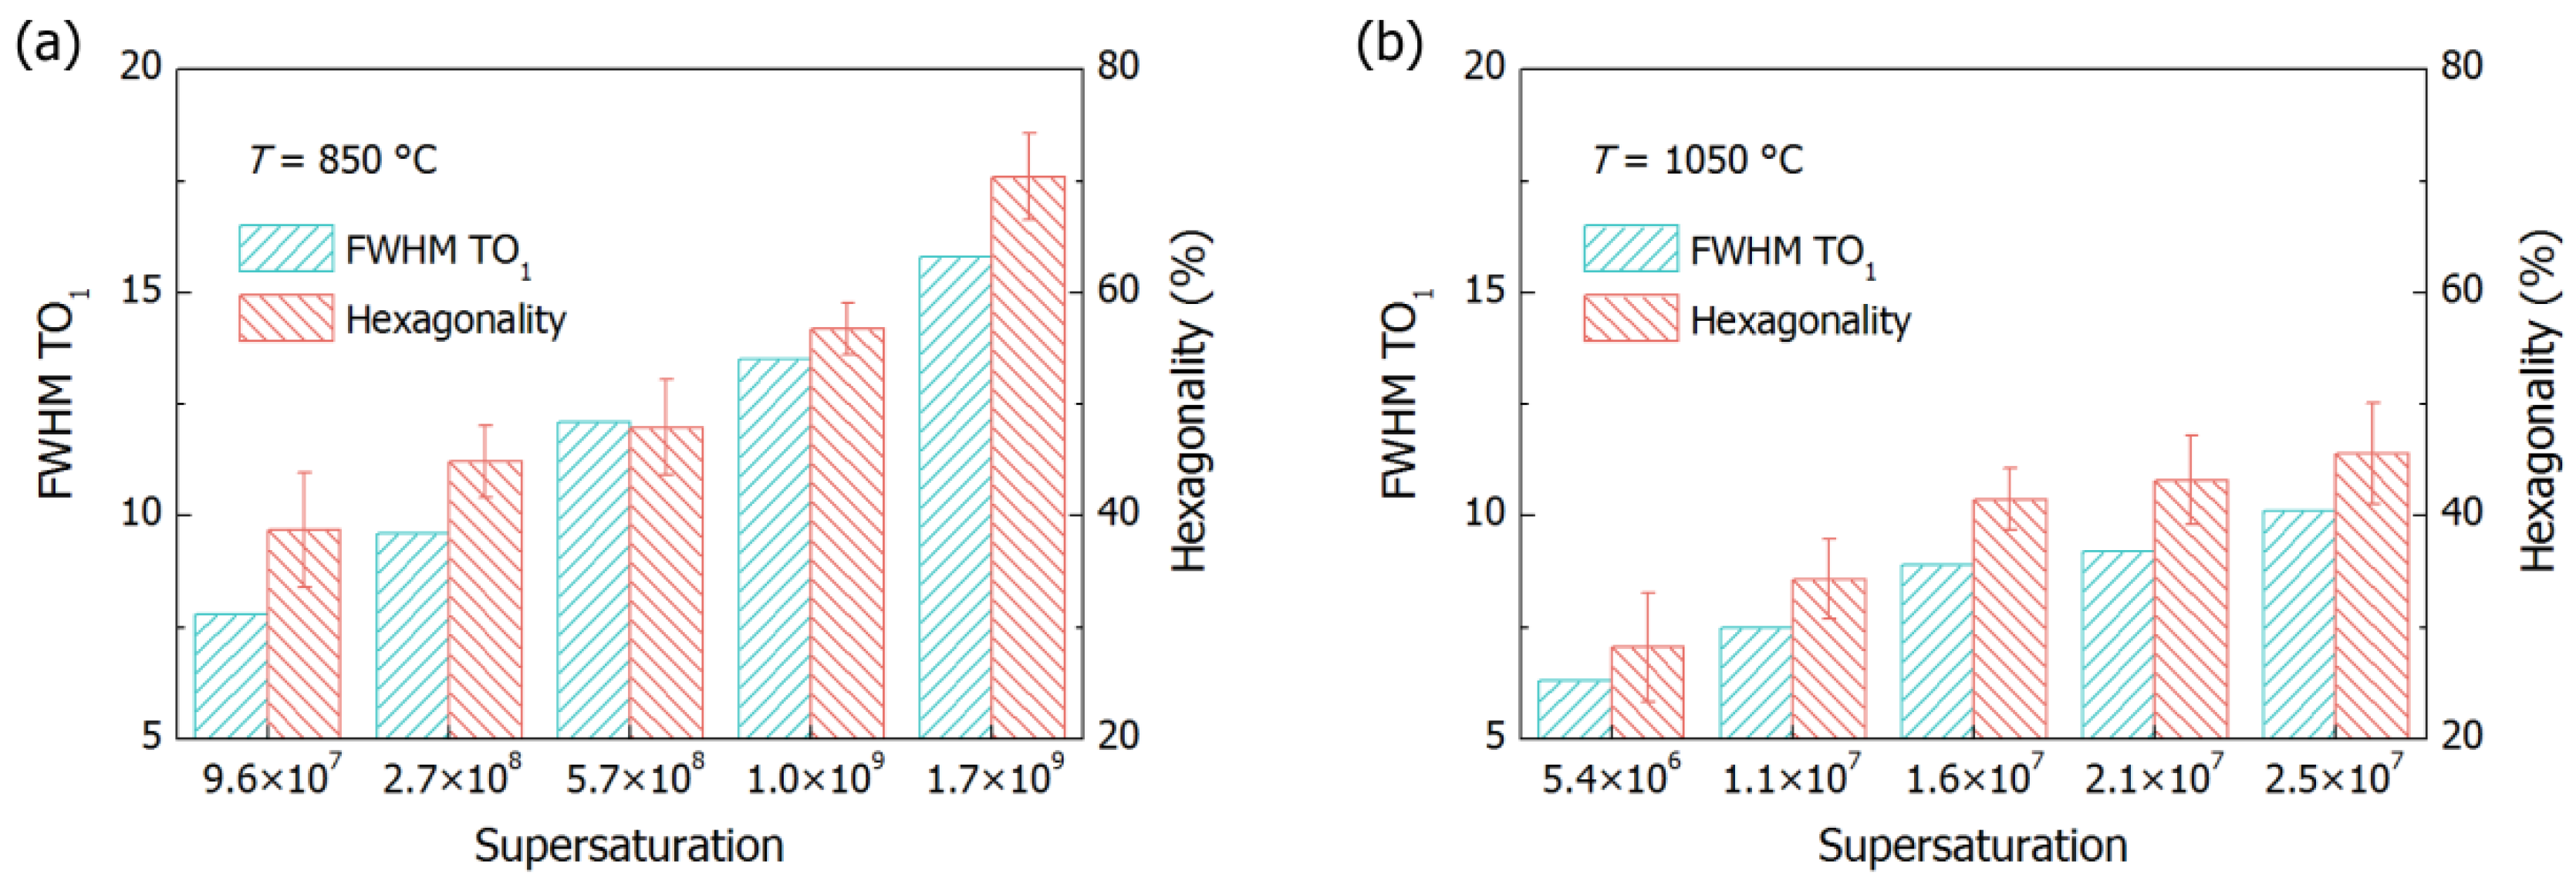
Figure 7 shows the variations of the full width at half the maximum of the TO1 band and the hexagonality of the deposited 3C-SiC grains, at 850 °C and 1050 °C. The full width at half the maximum of the TO1 band increased from 7.8 cm−1 to 15.7 cm−1, with the supersaturation increasing from 9.6 × 10⁷ to 1.7 × 10⁹ at 850 °C. In the meantime, the hexagonality of the deposited 3C-SiC grains went up from 38.7% to 70.4%. At 1050 °C, the full width at half the maximum of the TO1 band experienced an increase from 6.3 cm−1 to 10.1 cm−1, with the supersaturation increasing from 5.4 × 10⁶ to 2.5 × 10⁷, while the hexagonality of the deposited 3C-SiC grains rose from 28.2% to 45.6%. The full width at half the maximum of the TO1 band is inversely proportional to the domain size in the SiC grain, and the formation of stacking faults and twins in 3C-SiC grains can not only convert the cubic stacking sequences to hexagonal ones but also produce lattice strain in the 111 direction [43,44]. Thus, it can be deduced that the deposit prepared with the supersaturation of 1.7 × 10⁹ at 850 °C has a small domain size and high lattice strain, whereas the deposit prepared with the supersaturation of 5.4 × 10⁶ at 1050 °C will exhibit a large domain size and low lattice strain. These results agree well with the XRD analyses.
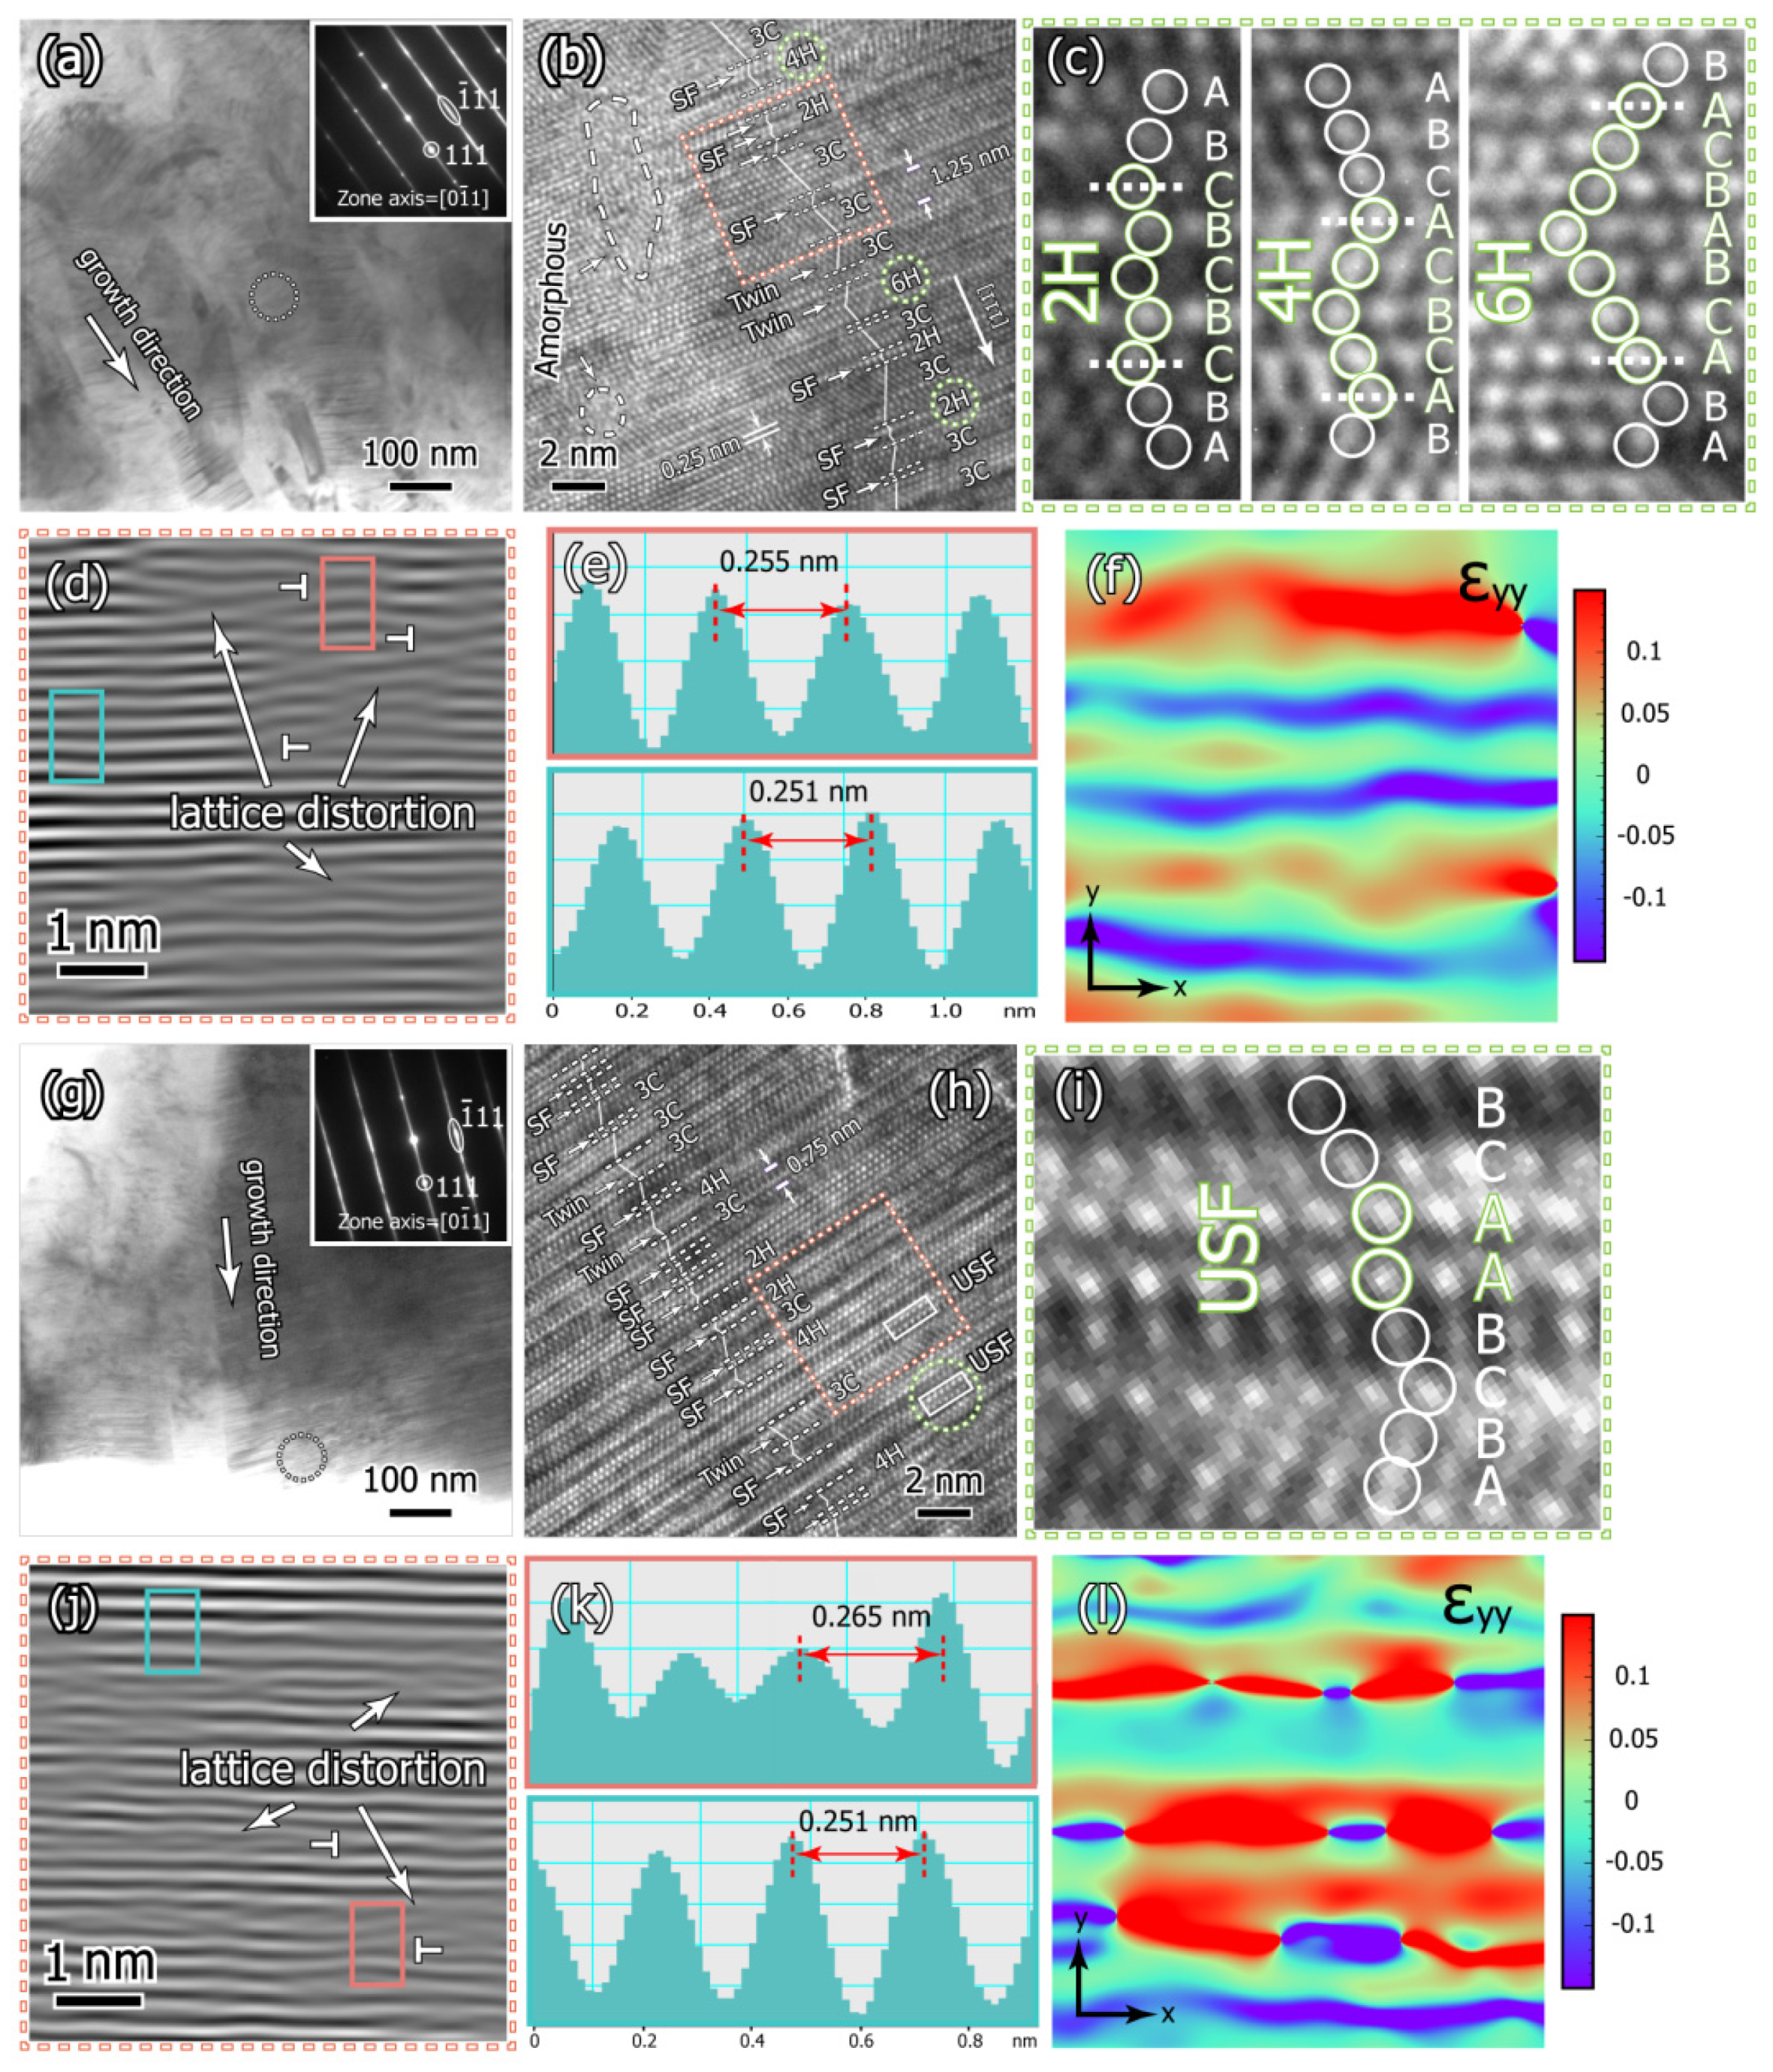
Figure 8 shows the microstructure of polycrystalline SiC grains deposited at 850 °C, with supersaturation of 9.6 × 10⁷ and 1.7 × 10⁹, respectively. It can be observed from Figure 8a that the deposit consists of columnar grains. The inserted selected area electron diffraction pattern (SAED) suggests that the 3C-SiC grain, preferentially, grows along the 111 direction, although small misorientations exist in adjacent grains. In addition, the columnar 3C-SiC grains contain numerous planar defects, which spread laterally to fill the entire cross section of the grains and account for the streaks in the SAED pattern. From the high-resolution TEM (HRTEM) image in Figure 8b, it can be seen that the amorphous phase is formed at the 3C-SiC grain boundary, which produces a weak Raman signal at ~720 cm−1. Within the columnar grain, the planar defects are, mainly, stacking faults and twins, which interrupt the regular 3C stacking order and locally transform the cubic stacking sequences into hexagonal ones. As a result, the thickness of the 3C domain was decreased to 1.5 nm. The stacking sequences of the structural defects-induced 2H-, 4H- and 6H- domains in the dotted circle areas, are exhibited in Figure 8c. These areas generate the TO2 band and the hexagonal bands in the Raman spectra. The inverse fast Fourier transform (FFT) image in Figure 8d, clearly, demonstrates the lattice distortion introduced perpendicular to the (111) plane, by structural defects in the 3C-SiC columnar grain. As shown in Figure 8e, the lattice spacing of the structural defects-induced hexagonal domain (0.255 nm) is slightly higher than that of the 3C domain (0.251 nm) [45]. As a result, the formation of structural defects will introduce tensile strain to SiC (111) lattices, which are illustrated in Figure 8f. Additionally, since the structural defects in 3C-SiC columnar grains exhibit the lateral expansion behavior, when different defect nuclei meet each other during their lateral growth on the (111) plane, dislocations will be produced at their interfaces, which can explain the observed Frank dislocations in Figure 8d.
As shown in Figure 8g, the 111 direction of 3C-SiC became the dominant growth direction in the deposit, when the supersaturation increased to 1.7 × 10⁹. The intensified streaks in the SAED pattern suggest that more structural defects were formed in these columnar grains. As shown in Figure 8f, the thickness of the 3C domain was further decreased to 0.75 nm, by the increased stacking faults and twins. Besides, unstable stacking faults (USF) were produced in 3C-SiC grain. Figure 8i demonstrates the stacking sequences of the USF, in which the neighboring Si-C bilayers locate almost at the same position. It can be seen from Figure 8j,k that the formation of USF could significantly increase the (111) lattice spacing to 0.265 nm, bringing about severe lattice strain in the 111 direction of 3C-SiC grains [46]. The decrease in 3C domain thickness and the increase in lattice strain in the 111 direction in high supersaturation conditions are consistent with the XRD and Raman results.
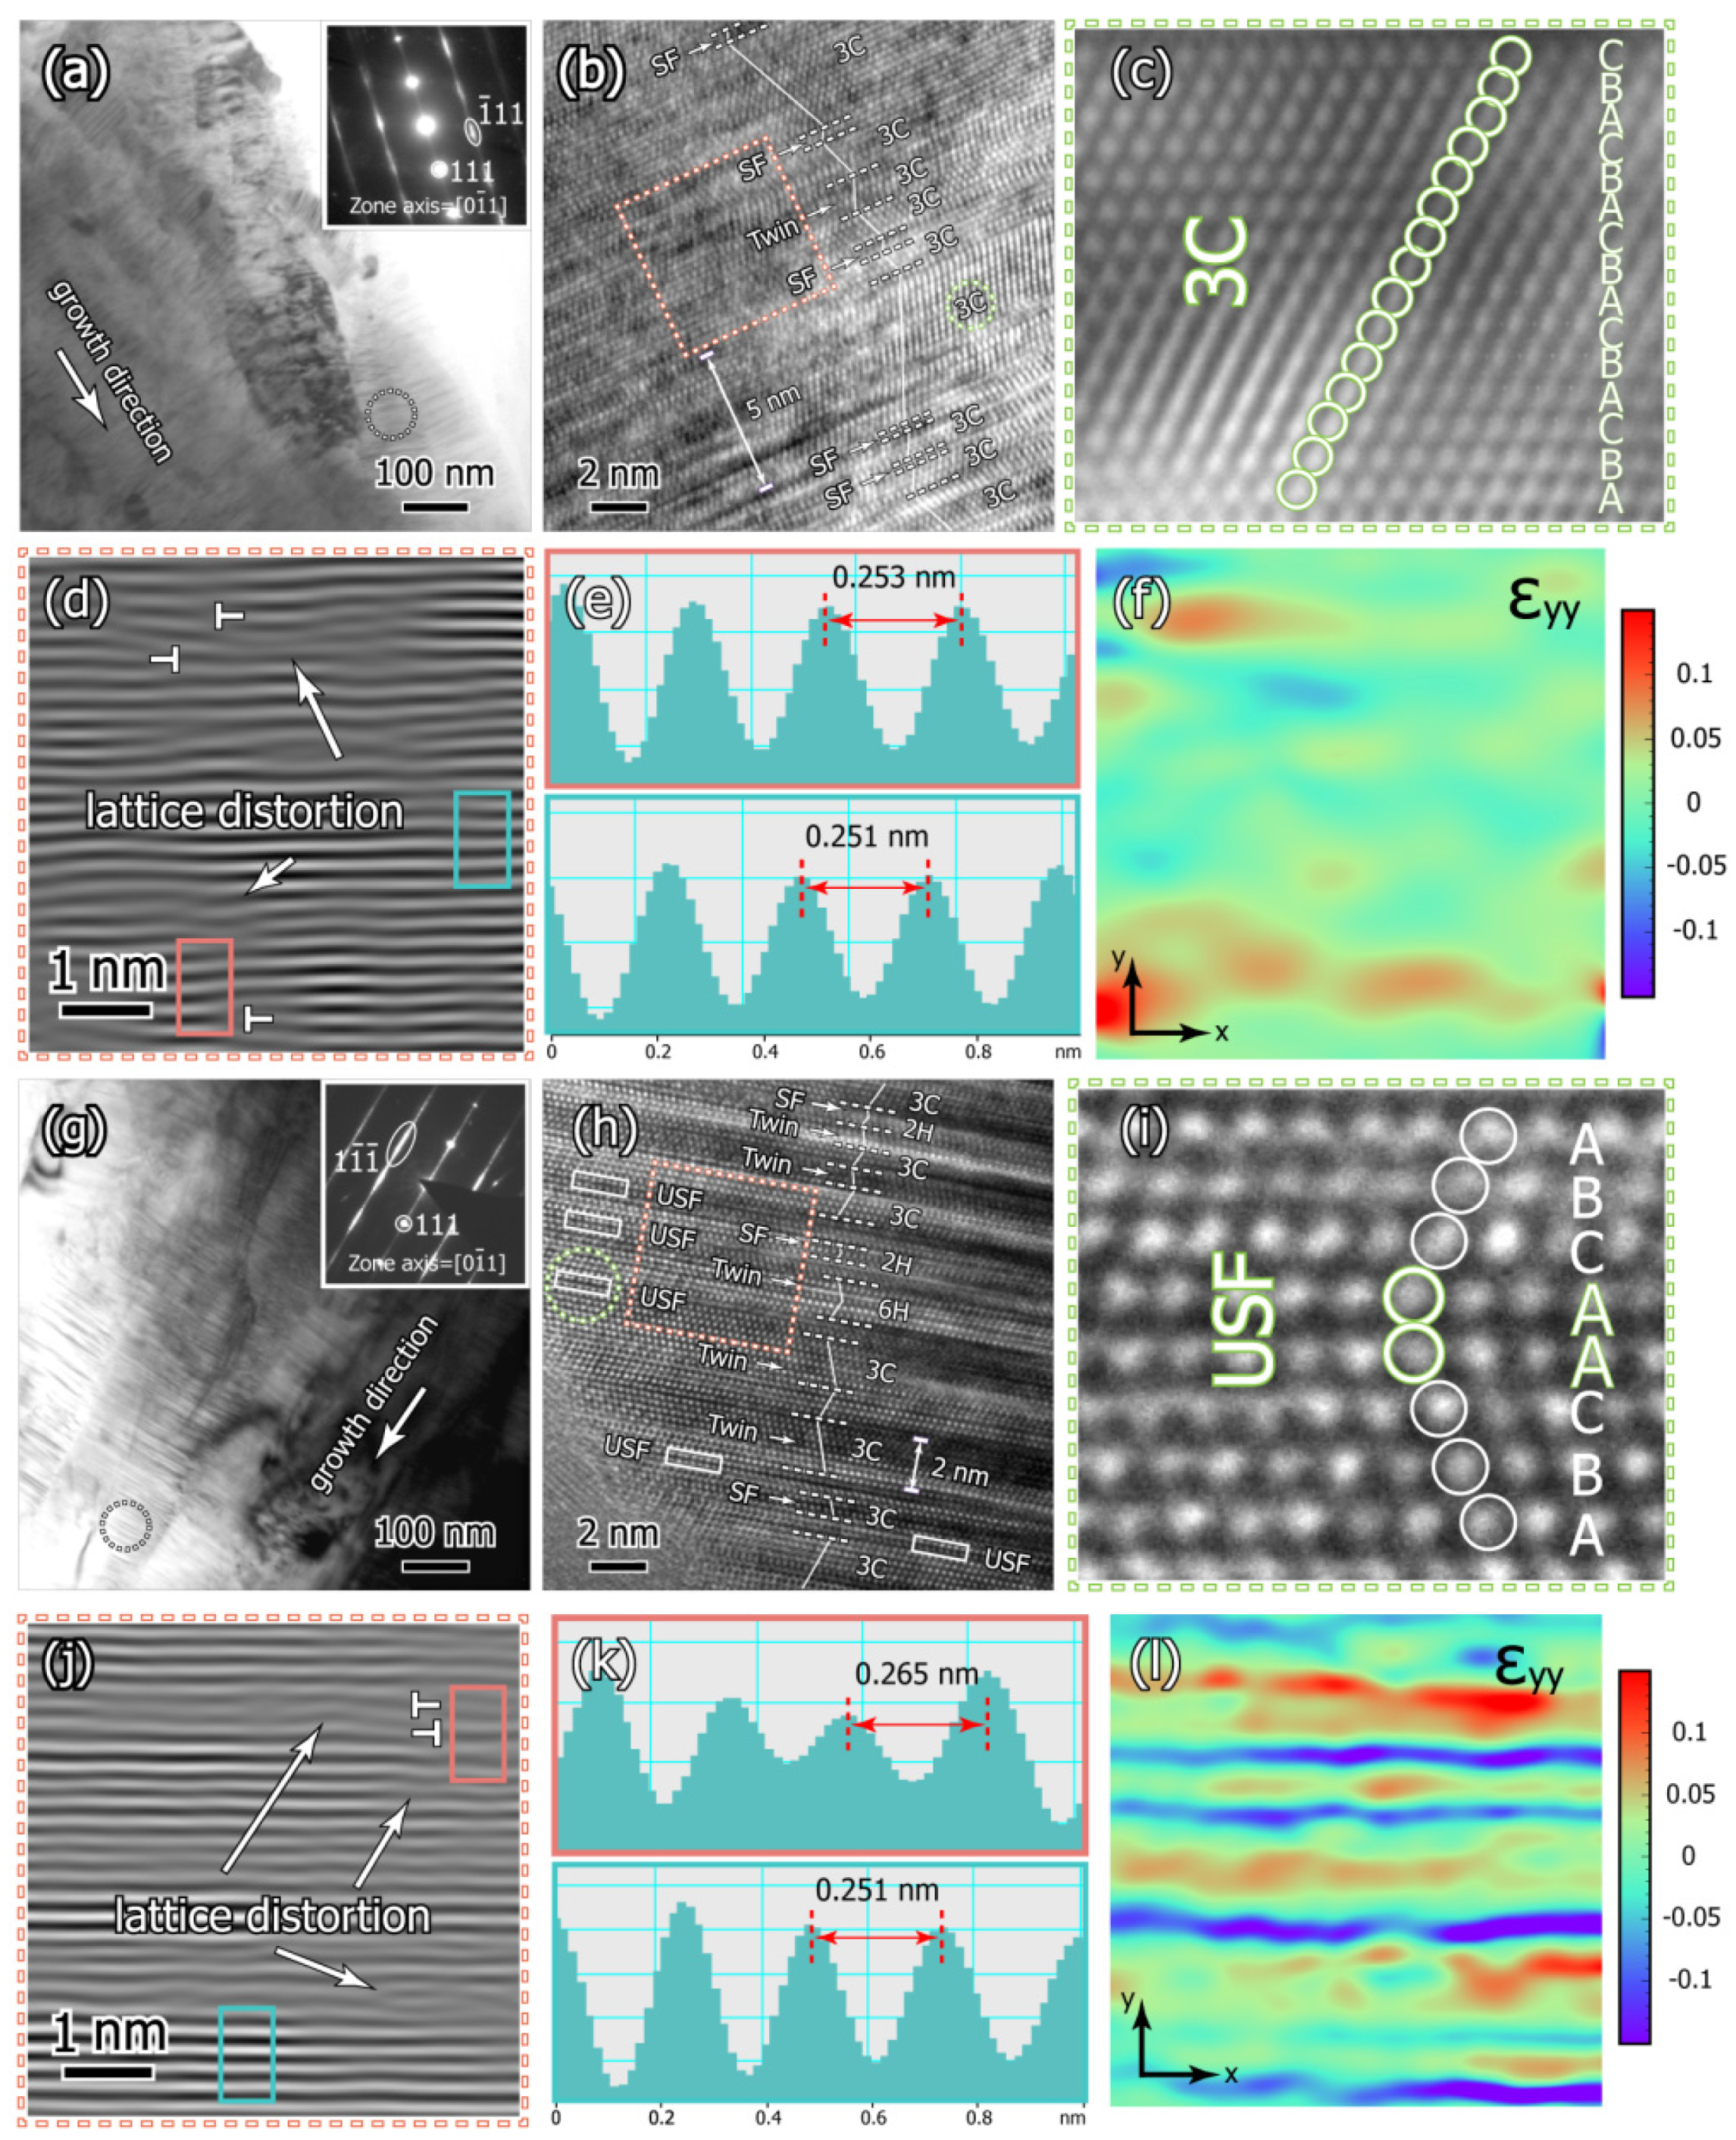
Figure 9a displays polycrystalline 3C-SiC grains, deposited at 1050 °C with supersaturation of 5.4 × 10⁶. From the inserted SAED pattern and the HRTEM image in Figure 9b, it can be drawn that the number of stacking faults and twins decreased in 3C-SiC grains. Figure 9c shows that the 3C stacking sequence in the columnar grain could be maintained in a wide range, and the resultant thickness of the 3C domain could reach 5 nm. Although the structural defects induced dislocations and the variations in lattice spacing could still be observed in Figure 9d,e, the decreased structural defect density resulted in the alleviation of lattice strain in Figure 9f. From the bright-field image in Figure 9g and the inserted SAED pattern, it is obvious that a strengthened (111) texture was formed in the deposit, when the supersaturation increased to 2.5 × 10⁷, and the density of the laterally extended structural defects in 3C-SiC columnar grains was also enhanced. As illustrated in Figure 9h,i, the increased number of stacking faults, twins and unstable stacking faults induced the 3C domain thickness to reduce to 2 nm. Since the lattice spacings of these structural defects are all larger than that of the 3C domain, the lattice distortion and intensified lattice strain observed in Figure 9j,l should be ascribed to the increased number of structural defects in 3C-SiC grains. It is obvious that the thicknesses of 3C domains obtained at 1050 °C are larger than those formed at 850 °C. Thus, the decrease in supersaturation at elevated deposition temperatures could, also, reduce the structural defects generated in 3C-SiC grains.
3.3. Mechanical Properties of the Deposit and the W-Core SiC Filament
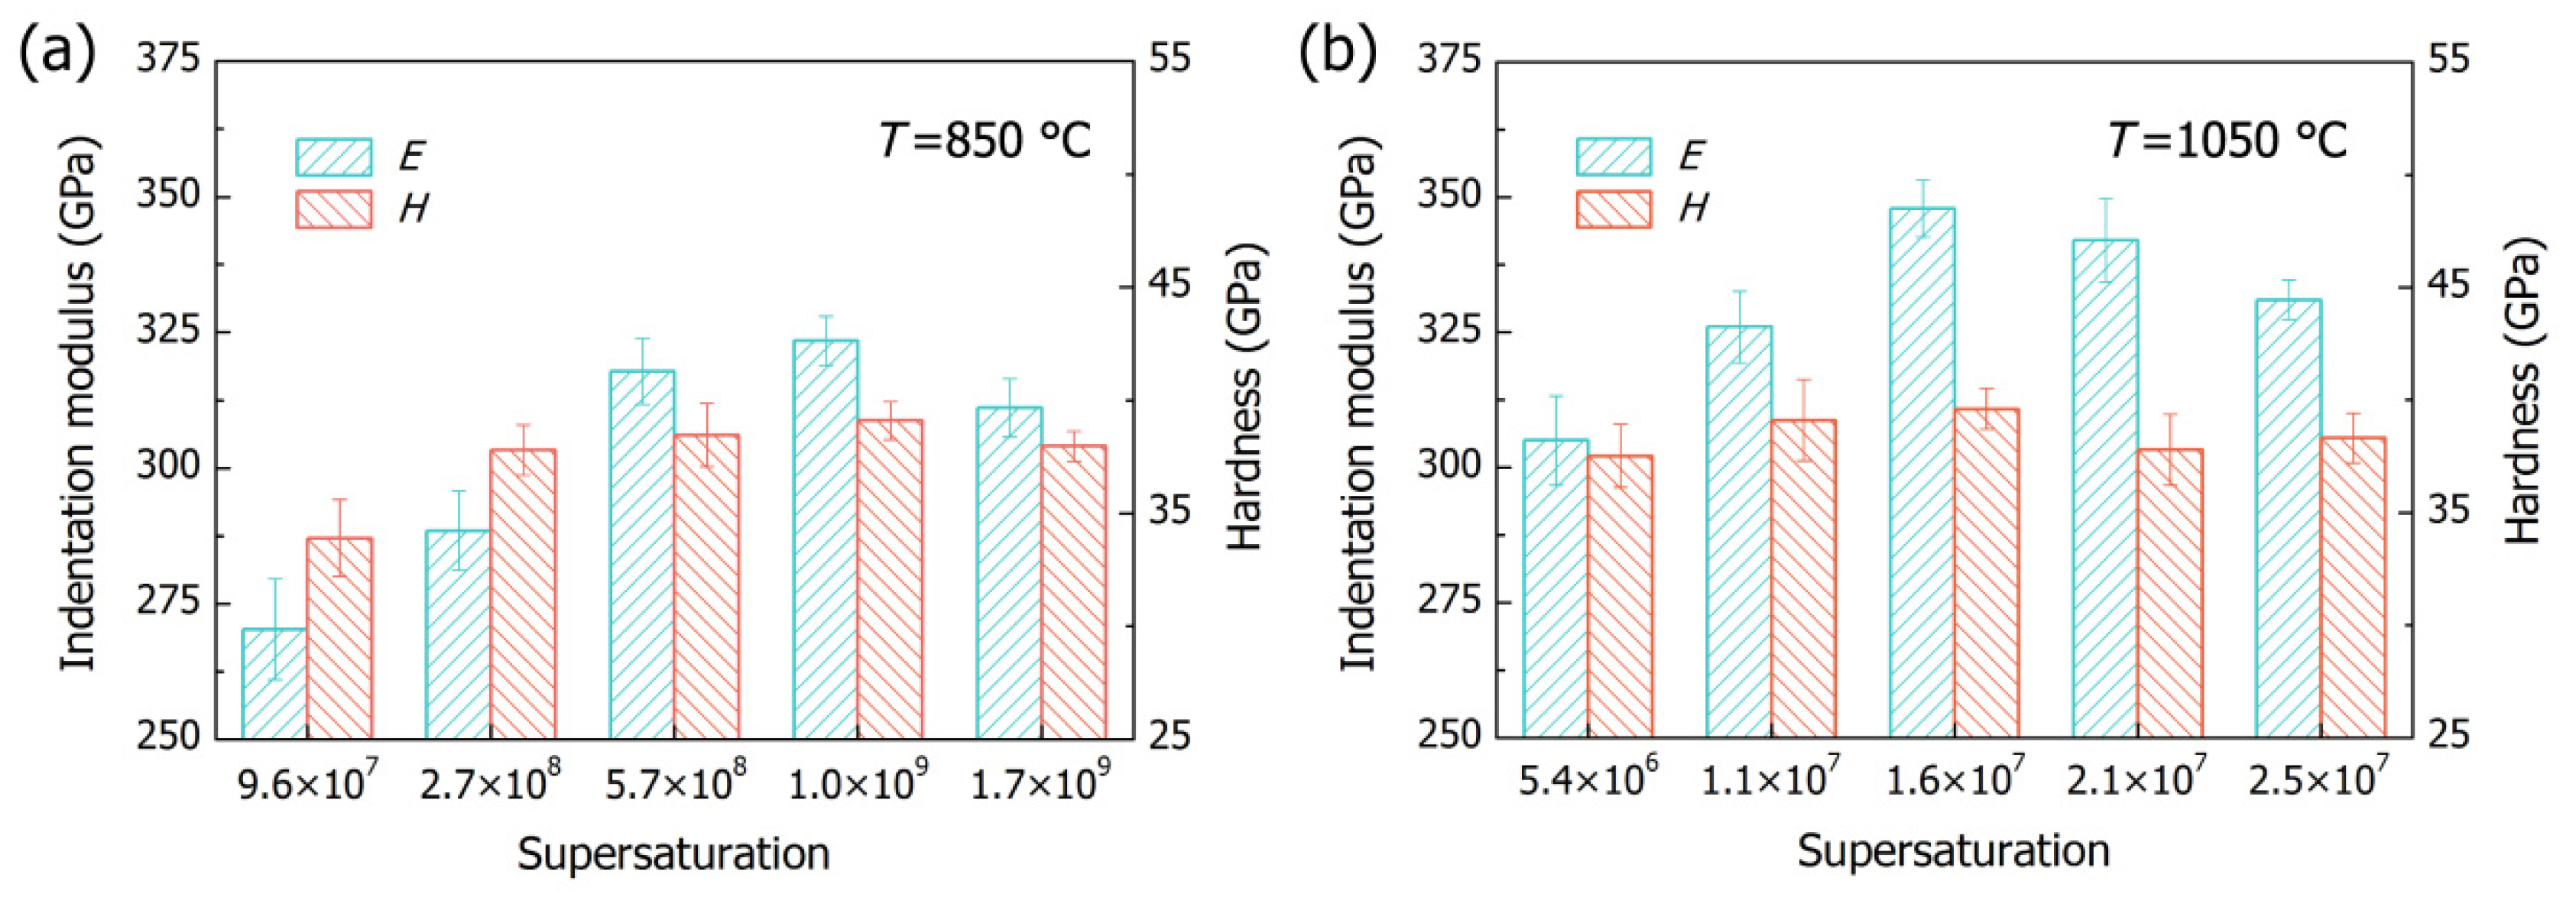
Figure 10 shows the mechanical properties of the deposits, determined from nanoindentation tests. It can be seen from Figure 10a that the indentation modulus of the deposit prepared at 850 °C increased from 270.3 GPa to 323.5 GPa and, then, decreased to 309.1 GPa, with the supersaturation increasing from 9.6 × 10⁷ to 1.7 × 10⁹. The hardness of the deposit, initially, increased from 33.9 GPa at 9.6 × 10⁷ to 37.8 GPa at 2.7 × 10⁸, and no obvious change can be observed as the supersaturation further increased to 1.7 × 10⁹. In Figure 10b, the variation of the deposit’s indentation modulus with the increasing supersaturation at 1050 °C was similar to that at 850 °C, and a medium supersaturation of 1.6 × 10⁷ favored the 3C-SiC deposit to reach the maximum indentation modulus of 347.9 GPa. However, the hardness of the deposit was insensitive to the deposition conditions. Studies have shown that the formation of pores and amorphous phase would seriously degrade the elastic modulus and hardness of SiC [47,48]. Besides, stacking faults and residual stress could cause a reduction in the elastic modulus of 3C-SiC [49,50]. Since the deposit has a strong 111 texture, and the tensile strains were introduced by stacking faults and twins formed on the (111) planes, the residual stresses in 3C-SiC grains could be estimated by the following equation:
where E111 is the Young’s modulus of 3C-SiC in the 111 direction, 425.3 GPa, and e is the microstrain determined by XRD analysis [49]. It can be calculated from Equation (10) and the microstrains in Table 1 that the residual stress in the 3C-SiC grain increased from 0.79 GPa to 1.1 GPa, with the supersaturation increasing from 9.6 × 10⁷ to 1.7 × 10⁹ at 850 °C, which experienced an increase from 0.73 GPa to 1.22 GPa, with the supersaturation increasing from 5.4 × 10⁶ to 2.5 × 10⁷ at 1050 °C. When a compact deposit with a strong (111) texture was obtained on W-wire substrate, the high residual stress produced in 3C-SiC grains would reduce the elastic modulus of the deposit.
Thus, the reduced pores and structural defects formed in the deposition process promote the indentation modulus of the deposit prepared with the supersaturations of 1.0 × 10⁹ at 850 °C to 323.5 GPa, while the elimination of amorphous phase and the relatively low residual stress developed in the compact and textured 3C-SiC deposit further enhance the indentation modulus and the hardness of deposit obtained, with supersaturation of 1.6 × 10⁷ at 1050 °C to 347.9 and 39.6 GPa, respectively.
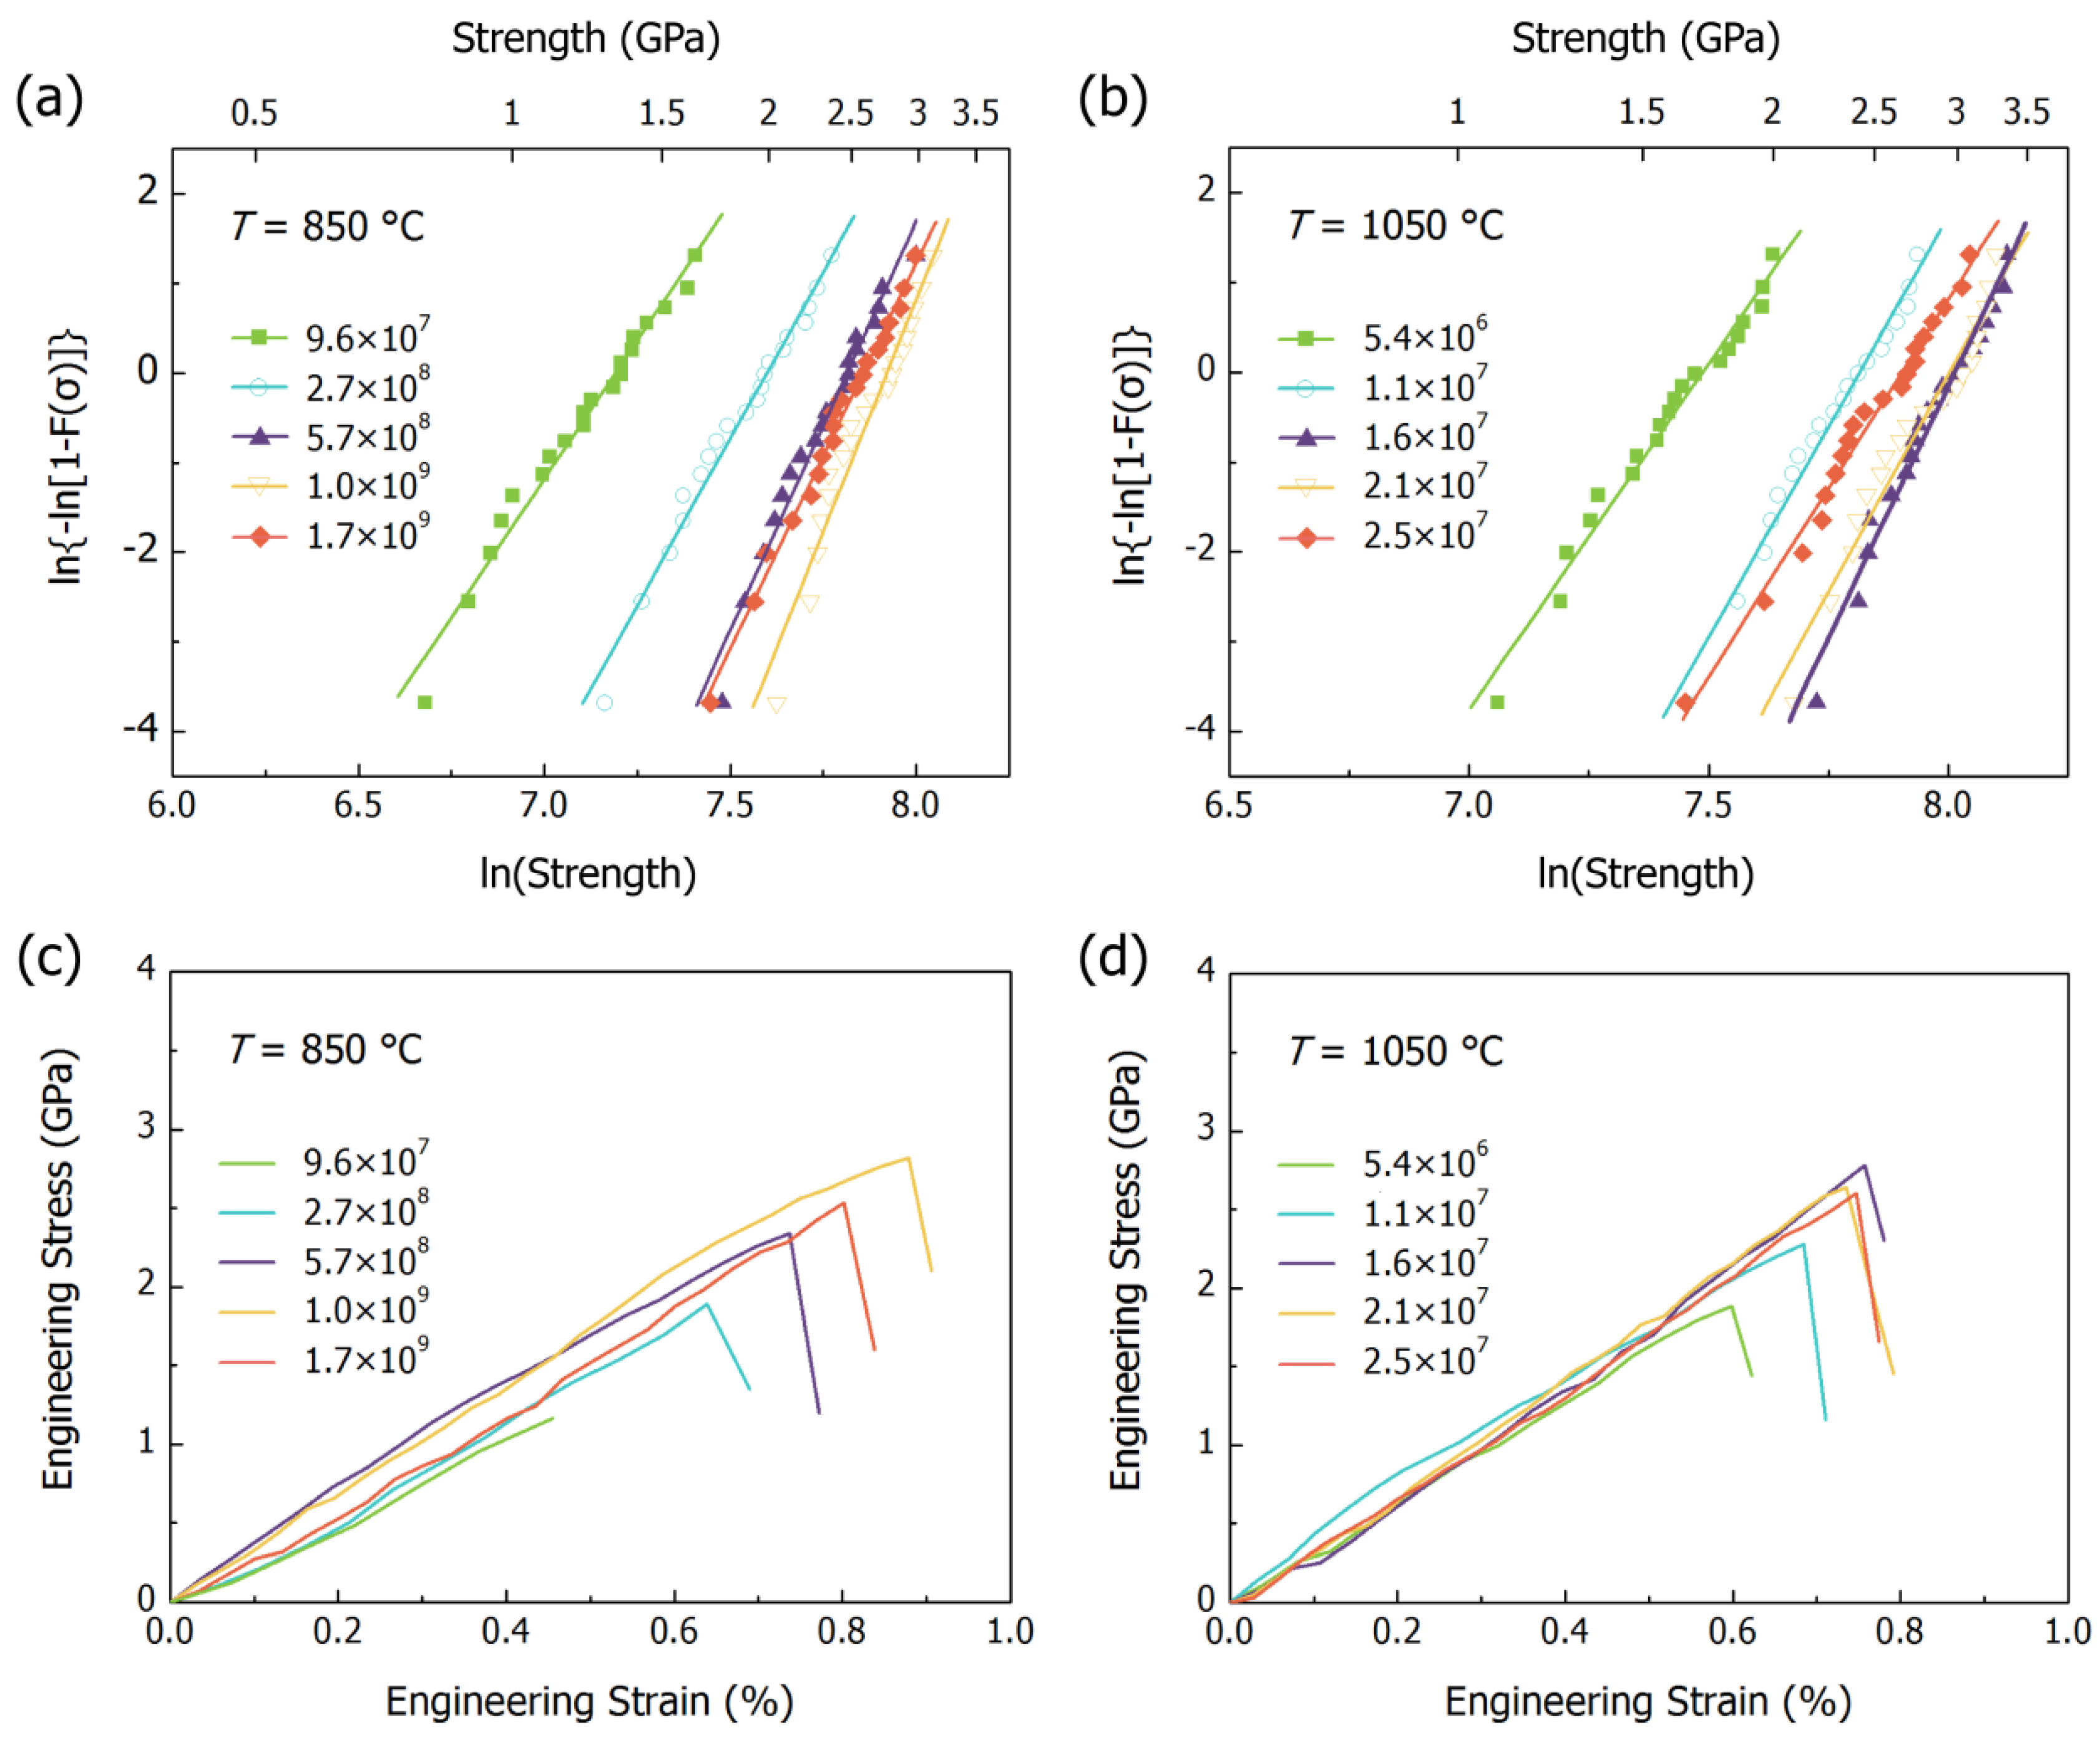
The Weibull plots and stress-strain curves of the W-core SiC filaments obtained from tensile tests are illustrated in Figure 11. In Figure 11a,b, the increase in supersaturation at both 850 °C and 1050 °C would change the slope of the Weibull plots, which suggests that the uniformity of the filament’s tensile strength, i.e., the Weibull modulus, is influenced by this deposition parameter. In addition, although the stress-strain curves in Figure 11c,d demonstrate the brittle fracture behavior of the filaments, the increase in supersaturation can, also, alter their elastic modulus and tensile strength. Table 2 summarizes the mechanical properties of the as-prepared W-core SiC filaments. At 850 °C, the filaments prepared with the supersaturation of 9.6 × 10⁷ exhibited the lowest elastic modulus and tensile strength of 248.9 GPa and 1.23 GPa, respectively. The increase in supersaturation, simultaneously, enhanced the mechanical properties and Weibull modulus of the filaments, and a high elastic modulus of 316.1 GPa and a high tensile strength of 2.63 GPa were achieved with the supersaturation at 5.7 × 10⁸ and 1.0 × 10⁹, respectively. Moreover, the Weibull modulus of the filament experienced an increase from 6.2 to 10.3, as a result of the enhanced surface quality of the deposit. When the supersaturation came to 1.7 × 10⁹, the elastic modulus and tensile strength of the filament were reduced by 17.4 GPa and 0.18 GPa, respectively, accompanied with a drop of 2.2 in the Weibull modulus. Experimental and simulation studies have shown that when 3C-SiC contains amorphous phase, pores and stacking faults, these defects would decrease its tensile strength [51,52]. Thus, the reduction in tensile strength is related to the increased structural defects density, while the rough surface morphology leads to the decrease in the Weibull modulus. When the supersaturation is 1.0 × 10⁹, not only would pores not be formed during the deposition process, the densities of stacking faults and twins in 3C-SiC grains were also less than those produced with the supersaturation of 1.7 × 10⁹. As a result, the filament prepared with the supersaturation of 1.0 × 10⁹ demonstrates the highest tensile strength at 850 °C. Similar changes are observed in the mechanical properties of the filaments prepared at 1050 °C. Since the content of the amorphous phase and pores in the homogeneous deposit prepared with the medium supersaturation of 1.6 × 10⁷ were negligibly small, and limited stacking faults and twins were formed in 3C-SiC grains, the filament was able to reach the highest elastic modulus of 353.1 GPa, with a tensile strength of 2.88 GPa, as well as a high Weibull modulus of 11.2. In general, the mechanical properties of the filaments prepared at 1050 °C are better than those at 850 °C, which, also, benefit from the elimination of amorphous phase and the relatively low structural-defects density at the high deposition temperature. These results indicate the mechanical performance of the W-core SiC filaments is, mainly, determined by the growth quality and the mechanical properties of the deposit.
3.4. Structural Defects Evolution in Different Gas Phase Supersaturation Conditions
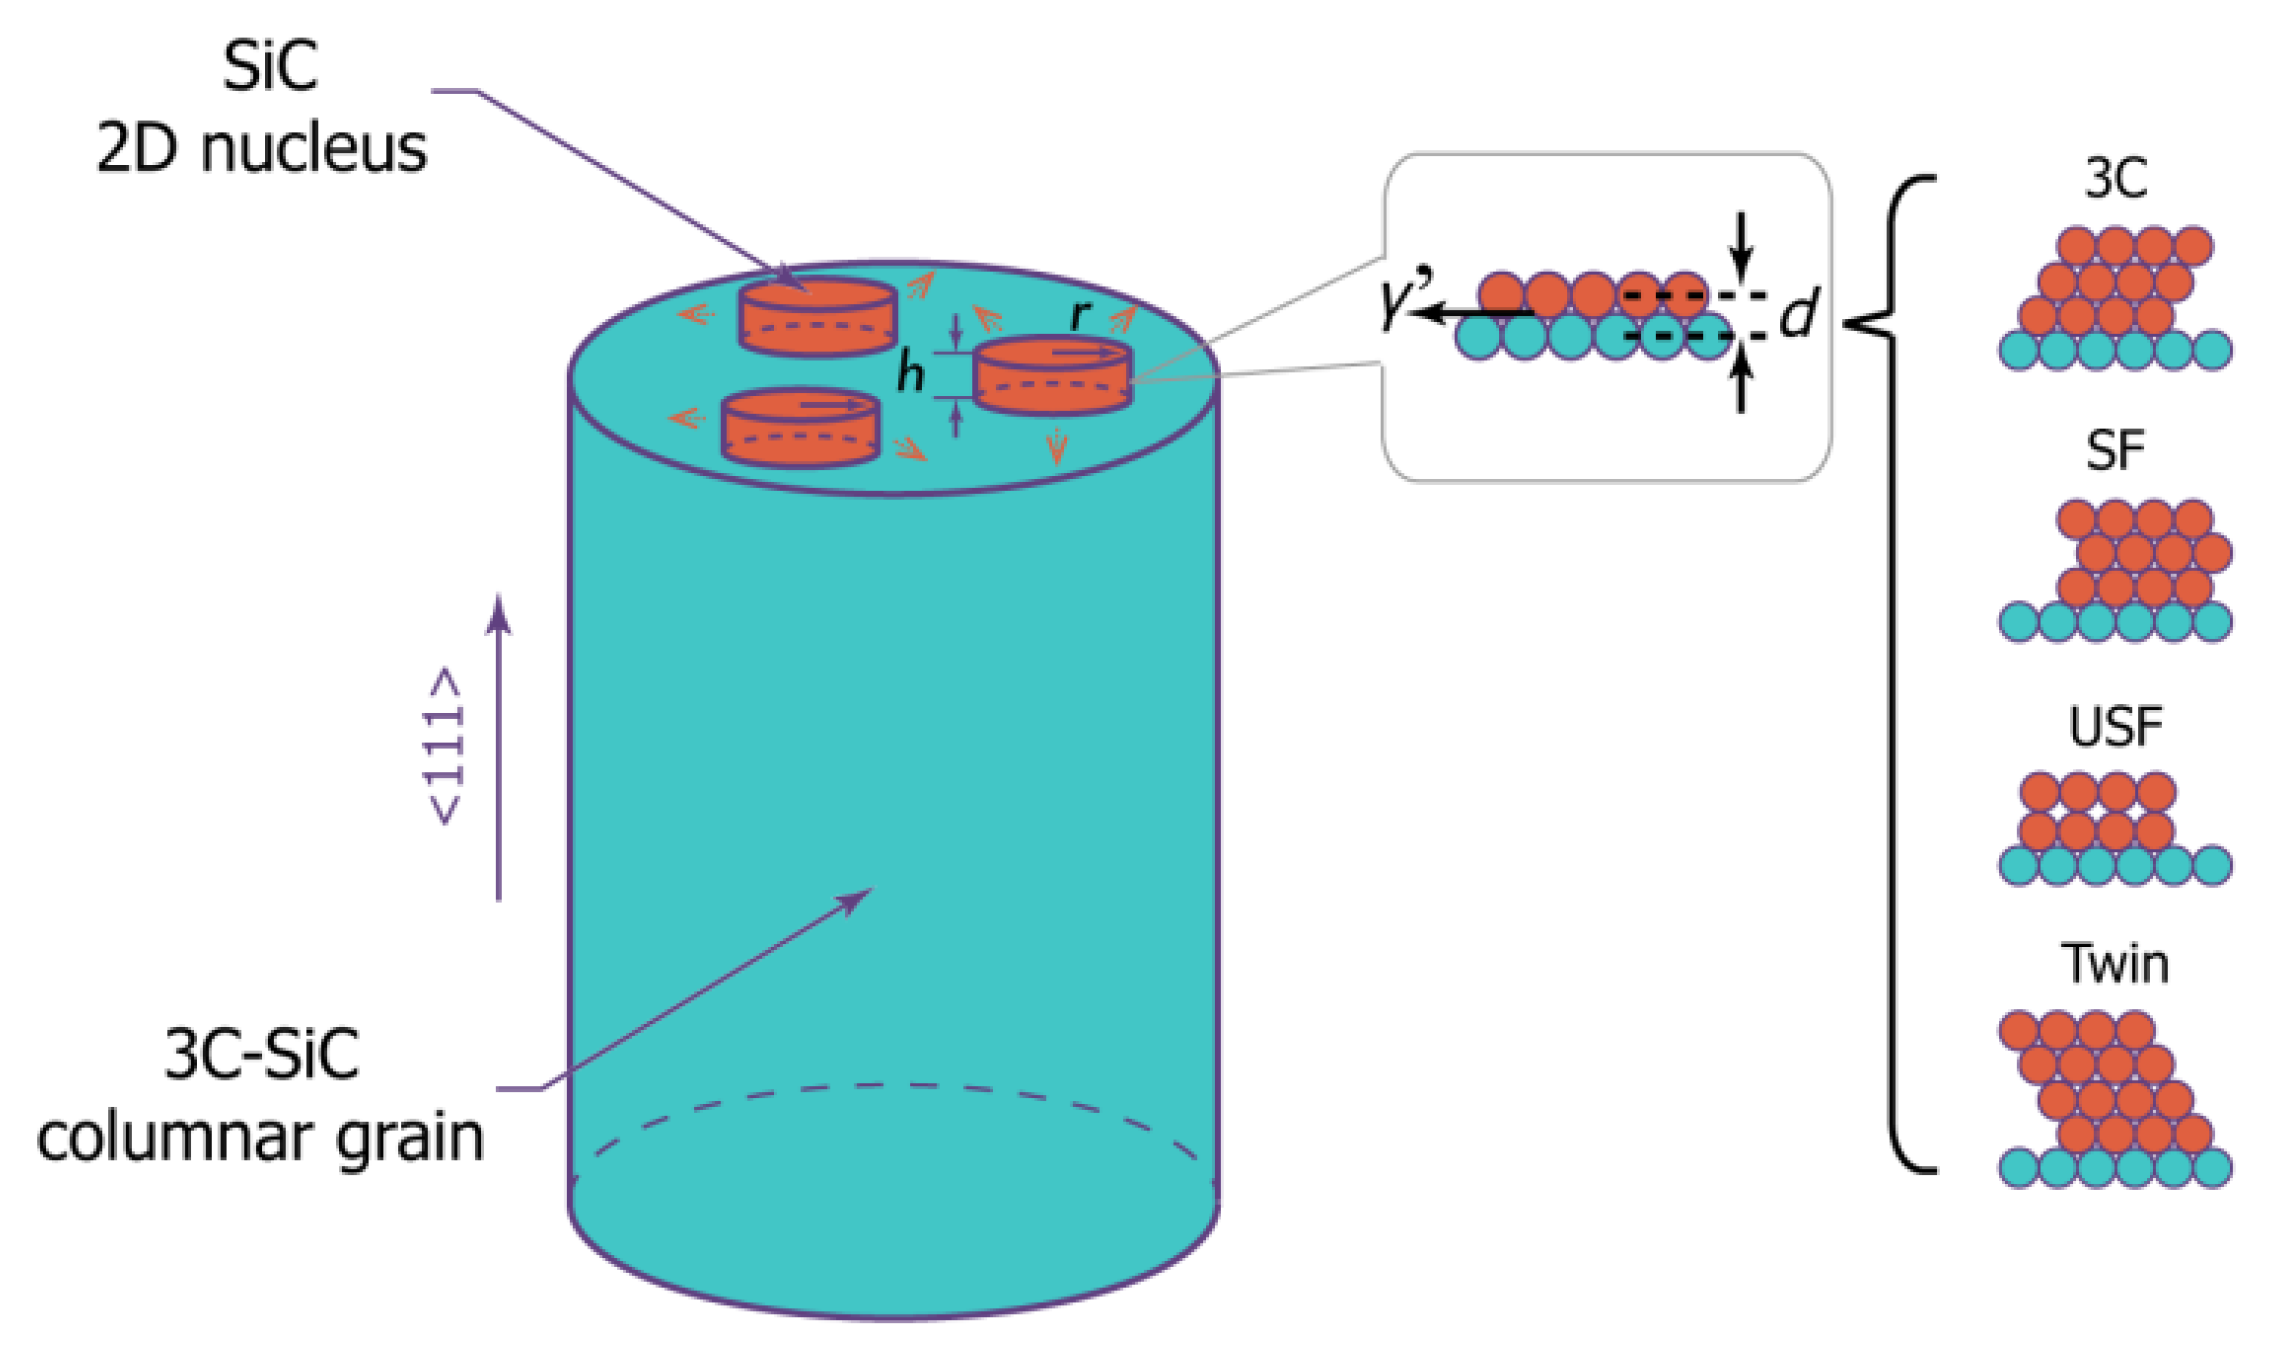
In view of the lateral extended planar defects formed in 3C-SiC columnar grains, we propose a 2D nucleation model to understand their evolution in different supersaturation conditions. As illustrated in Figure 12, the growth of 3C-SiC columnar grain is realized by the continuous formation of 2D nuclei and their lateral expansions on the (111) plane. Both the perfect 3C nucleus and defect nuclei (e.g., stacking faults and twins and unstable stacking faults) could be produced in the growth process. When different nuclei meet each other during the lateral growth, dislocations will be formed at the interface. The critical nucleation energy of a perfect 3C-SiC nucleus and a defect nucleus on the (111) plane of 3C-SiC can be calculated as follows [53,54]:
where r* is critical radius of the nucleus, γ0 is the average surface energy of SiC, 1.74 J/m2 [55], h is the height of the nucleus, k is the Boltzmann constant, Ω is the volume of Si-C tetrahedron, 2.08 × 10⁻²⁹ m3, δ is the force constant of the Si-C bond, 309 N/m, and Δd and γ’ are the lattice spacing difference and the interfacial energy between the 2D nucleus and the (111) plane of 3C-SiC, which are listed in Table 3.
Figure 13 displays the calculated critical nucleation energies of different 2D nucleus. In each supersaturation condition, the perfect 3C nucleus has the lowest the critical nucleation energy, indicating it is the most easily produced structure during the growth of columnar grain. At both 850 and 1050 °C, the USF nucleus exhibits the highest the critical nucleation energy, especially in low supersaturation conditions. These results conform to TEM observations in Figure 8 and Figure 9b, that little USF was formed in 3C-SiC grains, when the supersaturation was 9.6 × 10⁷ at 850 °C and 5.4 × 10⁶ at 1050 °C, respectively. An increase in the supersaturation at each deposition temperature can decrease the critical nucleation energies of stacking faults and twin nuclei, which suggests more structural defects and small 3C domains will be produced in deposits. These results are in accordance with the XRD profile analyses. The critical nucleation energy of USF nucleus will be significantly reduced in high supersaturation conditions. Therefore, it is possible to generate unstable stacking faults during the growth of 3C-SiC grains, which can explain the occurrence of this defect in Figure 8 and Figure 9h, when the supersaturation was 1.7 × 10⁹ at 850 °C and 2.5 × 10⁷ at 1050 °C, respectively. Moreover, at the same flow rate of CH3SiCl3, the relatively low supersaturations produced at 1050 °C are able to further increase the critical nucleation energy of the faulted nuclei. As a result, fewer structural defects will be produced in 3C-SiC grains when the deposition processes were carried out at 1050 °C, which agrees well with the changes in the hexagonality of 3C-SiC grains. Thus, it is the critical nucleation energy of 2D nucleus that determines the structural defects evolution in the deposition process.
4. Conclusions
- In a continuous hot-wire CVD process, the decrease in deposition temperature and the increase in CH3SiCl3 flow rate will increase the gas phase supersaturation.
- At both 850 °C and 1050 °C, an increase in gas phase supersaturation can increase the deposition rate. The growth of the deposit layer on W-wire substrate is limited by the surface reactions.
- An amorphous phase and a porous surface structure were produced by the low supersaturation of 9.6 × 10⁷ at 850 °C, while intensified (111) texture and increased structural defects, together with a rough surface structure, were developed in the deposit prepared by the high supersaturation of 2.5 × 10⁷ at 1050 °C.
- A polycrystalline 3C-SiC deposit, with a high modulus of 347.9 GPa, was obtained with a medium supersaturation of 1.6 × 10⁷ at 1050 °C, which, also, promoted the mean tensile strength and the Weibull modulus of the resultant W-core SiC filament, to 2.88 GPa and 11.2, respectively. The improved mechanical performance should be attributed to the reduced structural defects and the enhanced surface quality.
- Under different supersaturation conditions, the evolution of structural defects in 3C-SiC columnar grains is controlled by the critical nucleation energy of the 2D nucleus.
Author Contributions
Conceptualization, Y.Y.; formal analysis, S.L. and X.L.; funding acquisition, X.L.; investigation, S.L.; data curation, B.H.; methodology, S.L. and B.H.; project administration, Y.Y.; supervision, Y.Y.; writing—original draft, S.L.; writing—review and editing, X.L. and Y.Y. All authors have read and agreed to the published version of the manuscript.
Funding
This research was funded by the Natural Science Foundation of Shaanxi Province (No. 2021JM-061).
Institutional Review Board Statement
Not applicable.
Informed Consent Statement
Not applicable.
Data Availability Statement
The data presented in this study are available on request from the corresponding author (X.L.).
Conflicts of Interest
The authors declare no conflict of interest.
References
- Hayat, M.D.; Singh, H.; He, Z.; Cao, P. Titanium metal matrix composites: An overview. Compos. Part A 2019, 121, 418–438. [Google Scholar] [CrossRef]
- Levchuk, S.; Lindig, S.; Brendel, A.; Bolt, H. Interface reactions and control of diffusion at the interface between SiC fibres and layer of deposited Fe-9Cr base alloy. J. Nucl. Mater. 2007, 367–370, 1233–1237. [Google Scholar] [CrossRef] [Green Version]
- Chu, D.S.; Ma, Y.; Li, P.Y.; Tang, P.J. Bending properties and failure mechanism of continuous W-core-SiC fiber-reinforced 2024 and 6061 aluminum matrix composites. J. Mater. Eng. Perform. 2020, 29, 6295–6306. [Google Scholar] [CrossRef]
- Du, Y.; Chang, X.; Shi, N.; Chung, J.C.Y.; Rao, K.P. A strength evaluation of SiC fibers prepared by RFCVD. JOM 1998, 50, 36–39. [Google Scholar] [CrossRef]
- Zhang, Y.; Wen, M.; Sun, G.X.; Huang, H.; Zhang, S.M.; Wang, M.J.; Zhang, K.; Pang, H.P.; Zheng, W.T. Insight into microstructural architectures contributing to the tensile strength of continuous W-core SiC fiber. J. Eur. Ceram. Soc. 2020, 40, 5147–5161. [Google Scholar] [CrossRef]
- Féron, O.; Chollon, G.; Dartigues, F.; Langlais, F.; Naslain, R. In situ kinetic analysis of SiC filaments CVD. Diam. Relat. Mater. 2002, 11, 1234–1238. [Google Scholar] [CrossRef]
- Terentyev, D.; Riesch, J.; Lebediev, S.; Khvan, T.; Dubinko, A.; Bakaeva, A. Strength and deformation mechanism of tungsten wires exposed to high temperature annealing: Impact of potassium doping. Int. J. Refract. Hard Met. 2018, 76, 226–233. [Google Scholar] [CrossRef] [Green Version]
- Fissel, A. Thermodynamic considerations of the epitaxial growth of SiC polytypes. J. Cryst. Growth. 2000, 212, 438–450. [Google Scholar] [CrossRef]
- Ning, X.G.; Ye, H.Q. Experimental determination of the intrinsic stacking fault energy of SiC crystals. J. Phys. 1990, 2, 10223–10225. [Google Scholar] [CrossRef]
- Hong, M.H.; Samant, A.V.; Pirouz, P. Stacking fault energy of 6H-SiC and 4H-SiC single crystals. Philos. Mag. 2000, 80, 919–935. [Google Scholar] [CrossRef]
- Wang, Z.G.; Li, J.B.; Gao, F.; Weber, W.J. Tensile and compressive mechanical behavior of twinned silicon carbide nanowires. Acta. Mater. 2010, 58, 1963–1971. [Google Scholar] [CrossRef]
- Wang, J.; Lu, C.S.; Wang, Q.; Xiao, P.; Ke, F.J.; Bai, Y.L.; Shen, Y.G.; Liao, X.Z.; Gao, H.J. Influence of microstructures on mechanical behaviours of SiC nanowires: A molecular dynamics study. Nanotechnology 2012, 23, 025703. [Google Scholar] [CrossRef] [PubMed] [Green Version]
- Kimoto, T. Bulk and epitaxial growth of silicon carbide. Prog. Cryst. Growth. Ch. 2016, 62, 329–351. [Google Scholar] [CrossRef]
- Nakamura, D.; Gunjishima, I.; Yamaguchi, S.; Ito, T.; Okamoto, A.; Kondo, H.; Onda, S.; Takatori, K. Ultrahigh-quality silicon carbide single crystals. Nature 2004, 430, 1009–1012. [Google Scholar] [CrossRef]
- Komatsu, N.; Mitani, T.; Takahashi, T.; Okamura, M.; Kato, T.; Okumura, H. Growth rate and surface morphology of 4H-SiC single crystal growth under various supersaturations using Si-C solution. Mater. Sci. Forum 2013, 740–742, 23–26. [Google Scholar] [CrossRef]
- Epelbaum, B.M.; Hofmann, D.J. On the mechanisms of micropipes and macrodefect transformation in SiC during liquid phase treatment. J. Cryst. Growth. 2001, 225, 1–5. [Google Scholar] [CrossRef]
- Mitani, T.; Eto, K.; Komatsu, N.; Hayashi, Y.; Suo, H.; Kato, T. Reduction of threading screw dislocations in 4H-SiC crystals by a hybrid method with solution growth and physical vapor transport growth. J. Cryst. Growth 2021, 568–569, 126189. [Google Scholar] [CrossRef]
- Seki, K.; Alexander; Kozawa, S.; Harada, S.; Ujihara, T.; Takeda, Y. Polytype-selective growth of SiC by supersaturation control in solution growth. J. Cryst. Growth 2012, 360, 176–180. [Google Scholar] [CrossRef]
- Chaussende, D.; Ucar, M.; Auvray, L.; Baillet, F.; Pons, M.; Madar, R. Control of the supersaturation in the CF-PVT process for the growth of silicon carbide crystals: Research and applications. Cryst. Growth. Des. 2005, 5, 1539–1544. [Google Scholar] [CrossRef]
- Lespiaux, D.; Langlais, F.; Naslain, R.; Schamm, S.; Sevely, J. Correlations between gas phase supersaturation, nucleation process and physico-chemical characteristics of silicon carbide deposited from Si-C-H-Cl system on silica substrates. J. Mater. Sci. 1995, 30, 1500–1510. [Google Scholar] [CrossRef]
- Liu, S.; Yang, Y.Q.; Luo, X.; Huang, B.; Jin, N.; Kou, Z.D. Microstructure and mechanical property of high growth rate SiC via continuous hot-wire CVD. J. Am. Ceram. Soc. 2019, 102, 5656–5667. [Google Scholar] [CrossRef]
- Liu, S.; Luo, X.; Huang, B.; Li, P.T.; Yang, Y.Q. Role of H2 and Ar as the diluent gas in continuous hot-wire CVD synthesis of SiC fiber. J. Eur. Ceram. Soc. 2022, 42, 3135–3147. [Google Scholar] [CrossRef]
- Harris, G.B. Quantitative measurement of preferred orientation in rolled uranium bars. Philos. Mag. 1952, 43, 113–123. [Google Scholar] [CrossRef]
- De Keijser, T.H.; Langford, J.I.; Mittmeijer, E.J.; Vogels, A.B.P. Use of the Voigt function in a single-line method for the analysis of X-ray diffraction line broadening. J. Appl. Cryst. 1982, 15, 308–314. [Google Scholar] [CrossRef]
- Scardi, P.; Lutterotti, L.; Maistrelli, P. Experimental determination of the instrumental broadening in the Bragg-Brentano geometry. Powder Diffr. 1994, 9, 180–186. [Google Scholar] [CrossRef]
- Vives, S.; Gaffet, E.; Meunier, C. X-ray diffraction line profile analysis of iron ball milled powders. Mater. Sci. Eng. A 2004, 336, 229–238. [Google Scholar] [CrossRef]
- Feldman, D.W.; Parker, J.H.; Choyke, W.J.; Patrick, L. Phonon dispersion curves by Raman scattering in SiC polytypes 3C, 4H, 6H, 15R, and 21R. Phys. Rev. 1968, 173, 787–793. [Google Scholar] [CrossRef]
- Nakashima, S.; Wada, A.; Inoue, Z. Raman scattering from anisotropic phonon modes in SiC polytypes. J. Phys. Soc. Jpn. 1987, 56, 3375–3380. [Google Scholar] [CrossRef]
- Peters, J.J.P.; Beanland, R.; Alexe, M.; Cockbern, J.W.; Revin, D.G.; Zhang, S.Y.; Sanchez, A.M. Artefacts in geometric phase analysis of compound materials. Ultramicroscopy 2015, 157, 91–97. [Google Scholar] [CrossRef] [Green Version]
- Oliver, W.C.; Pharr, G.M. Nanoindentation in materials research: Past, present, and future. MRS Bull. 2010, 35, 97–907. [Google Scholar] [CrossRef]
- Rebillat, F.; Guette, A.; Brosse, C.R. Chemical and mechanical alterations of SiC Nicalon fiber properties during the CVD/CVI process for boron nitride. Acta Mater. 1999, 47, 1685–1696. [Google Scholar] [CrossRef]
- Hwang, N.M. Non-Classical Crystallization of Thin Films and Nanostructures in CVD and PVD Processes; Springer: New York, NY, USA, 2016. [Google Scholar] [CrossRef]
- Deng, J.L.; Su, K.H.; Zeng, Q.F.; Wang, X.; Cheng, L.F.; Xu, Y.D.; Zhang, L.T. Thermodynamics of the production of condensed phases in the CVD of methyltrichlorosilane pyrolysis. Chem. Vapor Depos. 2009, 15, 281–290. [Google Scholar] [CrossRef]
- Ge, Y.B.; Gordon, M.S.; Battaglia, F.; Fox, R.O. Theoretical study of the pyrolysis of methyltrichlorosilane in the gas phase. 1. Thermodynamics. J. Phys. Chem. A 2007, 111, 1462–1474. [Google Scholar] [CrossRef] [PubMed] [Green Version]
- Wang, R.; Ma, R.H. Kinetics of halide chemical vapor deposition of silicon carbide film. J. Cryst. Growth 2007, 308, 189–197. [Google Scholar] [CrossRef]
- Sone, H.; Kaneko, T.; Miyakawa, N. In situ measurements and growth kinetics of silicon carbide chemical vapor deposition from methyltrichlorosilane. J. Cryst. Growth 2000, 219, 245–252. [Google Scholar] [CrossRef]
- Blocher, J.M., Jr. Structure/property/process relationships in chemical vapor deposition CVD. J. Vac. Sci. Technol. 1974, 11, 680–686. [Google Scholar] [CrossRef]
- Kajikawa, Y.; Noda, S.; Komiyama, H. Preferred orientation of chemical vapor deposited polycrystalline silicon carbide films. Chem. Vapor Depos. 2002, 8, 99–104. [Google Scholar] [CrossRef]
- Ward, Y.; Young, R.J.; Shatwell, R.A. Application of Raman microscopy to the analysis of silicon carbide monofilaments. J. Mater. Sci. 2004, 39, 6781–6790. [Google Scholar] [CrossRef]
- Dkaki, M.; Calcagno, L.; Makthari, A.M.; Raineri, V. Infrared spectroscopy and transmission electron microscopy of polycrystalline silicon carbide. Mat. Sci. Semicon. Proc. 2001, 4, 201–204. [Google Scholar] [CrossRef]
- Nakashima, S.; Higashihira, M.; Maeda, K. Raman scattering characterization of polytype in silicon carbide ceramics: Comparison with X-ray diffraction. J. Am. Ceram. Soc. 2003, 86, 823–829. [Google Scholar] [CrossRef]
- Zhang, S.L.; Zhu, B.F.; Huang, F.M.; Yan, Y.; Shang, E.Y.; Fan, S.S.; Han, W.G. Effect of defects on optical phonon Raman spectra in SiC nanorods. Solid State Commu. 1999, 111, 647–651. [Google Scholar] [CrossRef]
- Liu, L.Z.; Wang, J.; Wu, X.L.; Li, T.H.; Chu, P.K. Longitudinal optical phonon-plasmon coupling in luminescent 3C-SiC nanocrystal films. Opt. Lett. 2010, 35, 4024–4026. [Google Scholar] [CrossRef] [Green Version]
- Umeno, Y.; Yagi, K.; Nagasawa, H. Ab initio density functional theory calculation of stacking fault energy and stress in 3C-SiC. Phys. Status Solidi B 2012, 249, 1–6. [Google Scholar] [CrossRef]
- Scalise, E.; Marzegalli, A.; Montalenti, F.; Miglio, L. Temperature-dependent stability of polytypes and stacking faults in SiC: Reconciling theory and experiments. Phys. Rev. Appl. 2019, 12, 021002. [Google Scholar] [CrossRef] [Green Version]
- Shirahata, N.; Kijima, K.; Ma, X.L.; Ikuhara, Y. A new type of stacking fault in β-SiC. Jpn. J. Appl. Phys. 2001, 40, 505–508. [Google Scholar] [CrossRef]
- Milman, Y.V.; Chugunova, S.I.; Goncharova, I.V.; Chudoba, T.; Lojkowski, W.; Gooch, W. Temperature dependence of hardness in silicon carbide ceramics with different porosity. Int. J. Refract. Met. H. 1999, 17, 361–368. [Google Scholar] [CrossRef]
- Kulikovsky, V.; Vorlíček, V.; Boháč, P.; Stranyánek, M.; Čtvrtlík, R.; Kurdyumov, A.; Jastrabik, L. Hardness and elastic modulus of amorphous and nanocrystalline SiC and Si films. Surf. Coat. Technol. 2008, 202, 1738–1745. [Google Scholar] [CrossRef]
- Anzalone, R.; Camarda, M.; Canino, A.; Piluso, N.; La Via, F.; D’Arrigo, G. Defect influence on heteroepitaxial 3C-SiC Young’s modulus. ECS Solid State Lett. 2011, 14, H161–H162. [Google Scholar] [CrossRef]
- Tsui, T.Y.; Oliver, W.C.; Pharr, G.M. Influences of stress on the measurement of mechanical properties using nanoindentation: Part, I. Experimental studies in an aluminum alloy. J. Mater. Res. 1996, 11, 752–759. [Google Scholar] [CrossRef]
- Cheng, G.M.; Chang, T.H.; Qin, Q.Q.; Huang, H.C.; Zhu, Y. Mechanical properties of silicon carbide nanowires: Effect of size-dependent defect density. Nano Lett. 2014, 14, 754–758. [Google Scholar] [CrossRef]
- Ivashchenko, V.I.; Turchi, P.E.A.; Shevchenko, V.I. Simulations of the mechanical properties of crystalline, nanocrystalline, and amorphous SiC and Si. Phys. Rev. B 2007, 75, 085209. [Google Scholar] [CrossRef]
- Zhang, X.; Misra, A.; Wang, H.; Shen, T.D.; Nastasi, M.; Mitchell, T.E.; Hirth, J.P.; Hoagland, R.G.; Embury, J.D. Enhanced hardening in Cu/330 stainless steel multilayers by nanoscale twinning. Acta Mater. 2004, 52, 995–1002. [Google Scholar] [CrossRef]
- Markov, I.V. Crystal Growth for Beginners: Fundamentals of Nucleation, Crystal Growth and Epitaxy; World Scientific: Singapore, 2003; pp. 77–320. [Google Scholar]
- Scharmann, F.; Maslarski, P.; Attenberger, W.; Lindner, J.K.N.; Stritzker, B.; Stauden, T.; Pezoldt, J. Investigation of the nucleation and growth of SiC nanostructures on Si. Thin Solid Films 2000, 380, 92–96. [Google Scholar] [CrossRef]
- Chavoshi, S.Z.; Luo, X.C. Molecular dynamics simulation study of deformation mechanisms in 3C-SiC during nanometric cutting at elevated temperatures. Mater. Sci. Eng. A 2016, 654, 400–417. [Google Scholar] [CrossRef] [Green Version]
- Zhang, Y.F.; Shim, H.W.; Huang, H.C. Size dependence of twin formation energy in cubic SiC at the nanoscale. Appl. Phys. Lett. 2008, 92, 261908. [Google Scholar] [CrossRef]
Figure 1.
Gas-phase supersaturation as a function of deposition temperature and the flow rate of CH3SiCl3.
Figure 1.
Gas-phase supersaturation as a function of deposition temperature and the flow rate of CH3SiCl3.

Figure 2.
SEM secondary electron images showing the deposit layer obtained at different deposition temperatures (T) and gas-phase supersaturations (S). (a) T = 850 °C, S = 9.6 × 10⁷; (b) T = 850 °C, S = 5.7 × 10⁸; (c) T = 850 °C, S = 1.7 × 10⁹; (d) T = 1050 °C, S = 5.4 × 10⁶; (e) T = 1050 °C, S = 1.6 × 10⁷; (f) T = 1050 °C, S = 2.5 × 10⁷.

Figure 3.
Growth rate of SiC deposit (rSiC), as a function of the flow rate of CH3SiCl3 at 850 °C and 1050 °C, respectively. The fitted Arrhenius plots are shown in the inset.
Figure 3.
Growth rate of SiC deposit (rSiC), as a function of the flow rate of CH3SiCl3 at 850 °C and 1050 °C, respectively. The fitted Arrhenius plots are shown in the inset.

Figure 4.
SEM secondary electron images showing the surface morphology of deposits obtained at different deposition temperatures (T) and gas-phase supersaturations (S). The magnified view of the deposit and the average size of surface defects obtained at different deposition temperatures and gas-phase supersaturations are illustrated in the insets. (a) T = 850 °C, S = 9.6 × 10⁷; (b) T = 850 °C, S = 5.7 × 10⁸; (c) T = 850 °C, S = 1.7 × 10⁹; (d) T = 1050 °C, S = 5.4 × 10⁶; (e) T = 1050 °C, S = 1.6 × 10⁷; (f) T = 1050 °C, S = 2.5 × 10⁷.

Figure 5.
XRD patterns of the W-core SiC filaments, prepared at 850 °C (a) and 1050 °C (b) under different supersaturation conditions. The corresponding texture coefficients of the (111), (220) and (311) planes in 3C-SiC grains are displayed in the insets.
Figure 5.
XRD patterns of the W-core SiC filaments, prepared at 850 °C (a) and 1050 °C (b) under different supersaturation conditions. The corresponding texture coefficients of the (111), (220) and (311) planes in 3C-SiC grains are displayed in the insets.

Figure 6.
Raman spectra of the deposits prepared at different deposition temperatures (T) and gas-phase supersaturations (S), the splitting of the TO bands (ΔTO) in the range of 770–810 cm−1 are illustrated in the insets. (a) T = 850 °C, S = 9.6 × 10⁷; (b) T = 850 °C, S = 5.7 × 10⁸; (c) T = 850 °C, S = 1.7 × 10⁹; (d) T = 1050 °C, S = 5.4 × 10⁶; (e) T = 1050 °C, S = 1.6 × 10⁷; (f) T = 1050 °C, S = 2.5 × 10⁷.

Figure 7.
The full width at half the maximum of the TO1 band and the hexagonality of the deposited 3C-SiC grains obtained at 850 °C (a) and 1050 °C (b).
Figure 7.
The full width at half the maximum of the TO1 band and the hexagonality of the deposited 3C-SiC grains obtained at 850 °C (a) and 1050 °C (b).

Figure 8.
Bright-field TEM image of the deposits prepared at 850 °C, with supersaturation of 9.6 × 10⁷ (a) and 1.7 × 10⁹ (g), respectively. The insets show the SAED patterns along the 0-11 crytallographic axis of 3C-SiC. The corresponding HRTEM images of 3C-SiC grains, along the 0-11 crystallographic axis, are shown in (b,h). The stacking sequences in the dotted circle areas of (b,h) are given in (c,i). (d,j) exhibit the filtered inverse FFT (111) lattice fringe images of 3C-SiC, in the dotted rectangular areas of (b,h). (e,k) exhibit the lattice spacing in the green and red rectangular regions of (d,j), and the corresponding strain fields are shown in (f,l), respectively.

Figure 9.
Bright-field TEM image of the deposits prepared at 1050 °C, with supersaturation of 5.4 × 10⁶ (a) and 2.5 × 10⁷ (g), respectively. The insets show the SAED patterns along the 0-11 crytallographic axis of 3C-SiC. The corresponding HRTEM images of 3C-SiC grains, along the 0-11 crystallographic axis, are shown in (b,h). The stacking sequences in the dotted circle areas of (b,h) are given in (c,i). (d,j) exhibit the filtered inverse FFT (111) lattice fringe images of 3C-SiC, in the dotted rectangular areas of (b,h). (e,k) exhibit the lattice spacing in the green and red rectangular regions of (d,j), and the corresponding strain fields are shown in (f,l), respectively.

Figure 10.
Indentation modulus (E) and hardness (H) of the polycrystalline 3C-SiC deposits, pre-pared at 850 °C (a) and 1050 °C (b), respectively.
Figure 10.
Indentation modulus (E) and hardness (H) of the polycrystalline 3C-SiC deposits, pre-pared at 850 °C (a) and 1050 °C (b), respectively.

Figure 11.
Weibull plots of W-core SiC filaments prepared in different supersaturation conditions, at 850 °C (a) and 1050 °C (b), respectively. The corresponding stress-strain curves of the filaments are displayed in (c,d).
Figure 11.
Weibull plots of W-core SiC filaments prepared in different supersaturation conditions, at 850 °C (a) and 1050 °C (b), respectively. The corresponding stress-strain curves of the filaments are displayed in (c,d).

Figure 12.
Schematic diagram showing the 2D nucleation model for the growth of 3C-SiC columnar grain.
Figure 12.
Schematic diagram showing the 2D nucleation model for the growth of 3C-SiC columnar grain.

Figure 13.
The critical nucleation energies of different 2D nuclei in different supersaturation conditions, at 850 °C (a) and 1050 °C (b), respectively.
Figure 13.
The critical nucleation energies of different 2D nuclei in different supersaturation conditions, at 850 °C (a) and 1050 °C (b), respectively.


Table 1.
The volume-weighted coherently scattering domain size (DV) and microstrain (e) in the (111) direction, of the deposited 3C-SiC grains in different deposition conditions.
Table 1.
The volume-weighted coherently scattering domain size (DV) and microstrain (e) in the (111) direction, of the deposited 3C-SiC grains in different deposition conditions.
| T (°C) | Supersaturation | DV (Å) | e × 103 |
|---|---|---|---|
| 850 | 9.6 × 10⁷ | 168 ± 13 | 1.86 ± 0.15 |
| 2.7 × 10⁸ | 163 ± 11 | 1.97 ± 0.12 | |
| 5.7 × 10⁸ | 156 ± 13 | 2.14 ± 0.17 | |
| 1.0 × 10⁹ | 149 ± 16 | 2.33 ± 0.14 | |
| 1.7 × 10⁹ | 137 ± 10 | 2.59 ± 0.10 | |
| 1050 | 5.4 × 10⁶ | 213 ± 16 | 1.72 ± 0.23 |
| 1.1 × 10⁷ | 201 ± 14 | 2.23 ± 0.19 | |
| 1.6 × 10⁷ | 182 ± 7 | 2.51 ± 0.11 | |
| 2.1 × 10⁷ | 170 ± 9 | 2.67 ± 0.14 | |
| 2.5 × 10⁷ | 156 ± 12 | 2.88 ± 0.17 |
Table 2.
The elastic modulus (Ef), mean tensile strength () and Weibull modulus (m) of W-core SiC filaments.
Table 2.
The elastic modulus (Ef), mean tensile strength () and Weibull modulus (m) of W-core SiC filaments.
| T (°C) | Supersaturation | Ef(GPa) | (GPa) | m |
| 850 | 9.6 × 10⁷ | 248.9 ± 20.7 | 1.23 | 6.2 |
| 2.7 × 10⁸ | 280.7 ± 21.4 | 1.87 | 7.4 | |
| 5.7 × 10⁸ | 316.1 ± 23.7 | 2.35 | 9.1 | |
| 1.0 × 10⁹ | 305.0 ± 20.2 | 2.63 | 10.3 | |
| 1.7 × 10⁹ | 297.6 ± 16.1 | 2.45 | 8.5 | |
| 1050 | 5.4 × 10⁶ | 301.6 ± 22.6 | 1.92 | 7.7 |
| 1.1 × 10⁷ | 332.3 ± 27.3 | 2.55 | 8.8 | |
| 1.6 × 10⁷ | 353.1 ± 18.1 | 2.88 | 11.2 | |
| 2.1 × 10⁷ | 340.8 ± 24.2 | 2.85 | 9.4 | |
| 2.5 × 10⁷ | 329.9 ± 15.1 | 2.67 | 8.1 |
Publisher’s Note: MDPI stays neutral with regard to jurisdictional claims in published maps and institutional affiliations. |
© 2022 by the authors. Licensee MDPI, Basel, Switzerland. This article is an open access article distributed under the terms and conditions of the Creative Commons Attribution (CC BY) license (https://creativecommons.org/licenses/by/4.0/).
Share and Cite
MDPI and ACS Style
Liu, S.; Luo, X.; Huang, B.; Yang, Y. Influence of Supersaturation on Growth Behavior and Mechanical Properties of Polycrystalline 3C-SiC on W Wire Substrate. Metals 2022, 12, 881. https://0-doi-org.brum.beds.ac.uk/10.3390/met12050881
AMA Style
Liu S, Luo X, Huang B, Yang Y. Influence of Supersaturation on Growth Behavior and Mechanical Properties of Polycrystalline 3C-SiC on W Wire Substrate. Metals. 2022; 12(5):881. https://0-doi-org.brum.beds.ac.uk/10.3390/met12050881
Chicago/Turabian StyleLiu, Shuai, Xian Luo, Bin Huang, and Yanqing Yang. 2022. "Influence of Supersaturation on Growth Behavior and Mechanical Properties of Polycrystalline 3C-SiC on W Wire Substrate" Metals 12, no. 5: 881. https://0-doi-org.brum.beds.ac.uk/10.3390/met12050881
Note that from the first issue of 2016, this journal uses article numbers instead of page numbers. See further details here.