Article

Nitrogen Availability Affects the Metabolic Profile in Cyanobacteria

1
Innovation and Technology and Engineering Biology Research Center, Kobe University, Nada, Kobe 657-8501, Japan
2
Graduate School of Science, Innovation and Technology, Kobe University, Nada, Kobe 657-8501, Japan
3
Department of Chemical Science and Engineering, Graduate School of Engineering, Kobe University, Nada, Kobe 657-8501, Japan
*
Author to whom correspondence should be addressed.
Submission received: 2 December 2021 / Revised: 9 December 2021 / Accepted: 10 December 2021 / Published: 14 December 2021
(This article belongs to the Special Issue Stable Isotope Guided Metabolomics II)

Abstract

:
Nitrogen is essential for the biosynthesis of various molecules in cells, such as amino acids and nucleotides, as well as several types of lipids and sugars. Cyanobacteria can assimilate several forms of nitrogen, including nitrate, ammonium, and urea, and the physiological and genetic responses to these nitrogen sources have been studied previously. However, the metabolic changes in cyanobacteria caused by different nitrogen sources have not yet been characterized. This study aimed to elucidate the influence of nitrate and ammonium on the metabolic profiles of the cyanobacterium Synechocystis sp. strain PCC 6803. When supplemented with NaNO3 or NH4Cl as the nitrogen source, Synechocystis sp. PCC 6803 grew faster in NH4Cl medium than in NaNO3 medium. Metabolome analysis indicated that some metabolites in the CBB cycle, glycolysis, and TCA cycle, and amino acids were more abundant when grown in NH4Cl medium than NaNO3 medium. 15N turnover rate analysis revealed that the nitrogen assimilation rate in NH4Cl medium was higher than in NaNO3 medium. These results indicate that the mechanism of nitrogen assimilation in the GS-GOGAT cycle differs between NaNO3 and NH4Cl. We conclude that the amounts and biosynthetic rate of cyanobacterial metabolites varies depending on the type of nitrogen.

1. Introduction

Nitrogen is an important element for living things, being used in amino acids, nucleotides, lipids, and sugars, which are building blocks of all forms of life. Cyanobacteria are Gram-negative bacteria and are known to be oxygenic photosynthetic microorganisms that utilize solar energy to generate chemical energy (ATP and NADPH). Such chemical energy is used in the Calvin–Benson–Bassham cycle (CBB cycle), glycolysis, and tricarboxylic acid (TCA cycle). Similar to other organisms, non-diazotrophic cyanobacteria, such as Synechocystis sp. PCC 6803 can take up nitrogen as NO3, NO2, NH4+, CO(NH2)2 (urea), and arginine [1,2]. Diazotrophic cyanobacteria (for example, Anabaena sp. PCC 7120) can fix N2 in heterocyst cells using nitrogenase [3]. Cyanobacteria require reducing power when using the former nitrogen sources (NO3 and NO2), but not when using the latter (NH4+, urea, and arginine). NO3 and NO2 transporters are already identified as NrtA-D. NH4+ is transported by ammonium transporters Amt1-3 and urea by urea transporters UrtA-E [4,5,6]. NO3 in the cell is reduced to NO2 by ferredoxin-nitrate reductase, NarB, and finally reduced to NH4+ by NirA [7,8]. Urea in the cell is converted by UreA-B to NH3 [6,9]. NH4+ is produced from arginine by arginine dihydrolase [2]. The GS (glutamine synthetase)-GOGAT (glutamate synthase or glutamine-oxoglutarate cycle amido transferase) cycle synthesizes glutamate and glutamine from NH4+ and 2OG [10]. The resulting Glu is mainly consumed as a nitrogen source.
Although cyanobacteria can assimilate nitrogen compounds as mentioned above, the choice of nitrogen sources is important for cultivation because photosynthesis and growth are affected by the type of nitrogen source [11,12,13]. In addition, there are differences in gene expression associated with utilizing the nitrogen sources and changes in activity of enzymes involved in nitrogen assimilation when cyanobacteria are exposed to each of the nitrogen sources, NO3, NH4+, and urea [14,15,16]. The physiological response of cyanobacteria to nitrogen sources also varies according to the species [13,17]. We previously reported that when Synechocystis sp. PCC 6803 was phototrophically cultivated in the presence of NH4Cl, it produced a higher content of intracellular organic acids including malate, fumarate, and succinate under dark anoxic fermentation than cells grown in NaNO3, resulting in increased succinate secretion [18]. In this way, the influences of different types of nitrogen sources have been investigated to reveal the physiological responses of cyanobacteria and their application. However, metabolites produced with different types of nitrogen sources have not been fully investigated, in contrast to the effects of nitrogen starvation [19,20]. Moreover, in our previous report, we revealed that the different metabolic profiles produced during dark anoxic cultivation after a transfer from phototrophic cultivation with different nitrogen sources enhanced the production of succinate. These findings prompted us to investigate the metabolic profiles under phototrophic conditions.
In this study, we aimed to clarify the metabolic responses to different nitrogen sources. For this purpose, we performed a combination of in vivo 15N-labeling of metabolites and metabolome analysis. The 15N-labeling technique is applied to detect metabolites of interest in cyanobacteria or to examine the metabolic behavior of a few metabolites [2,17,21,22]. This technique enables us to compare the metabolic turnover under different nitrogen sources by calculating the 15N labeling rate at each time point. Using this technique and metabolome analysis, we compared the metabolic profiles and synthesis rates of amino acids in Synechocystis sp. PCC 6803 when grown in NaNO3 or NH4Cl, revealing distinct metabolic profiles between the different nitrogen sources.

2. Results

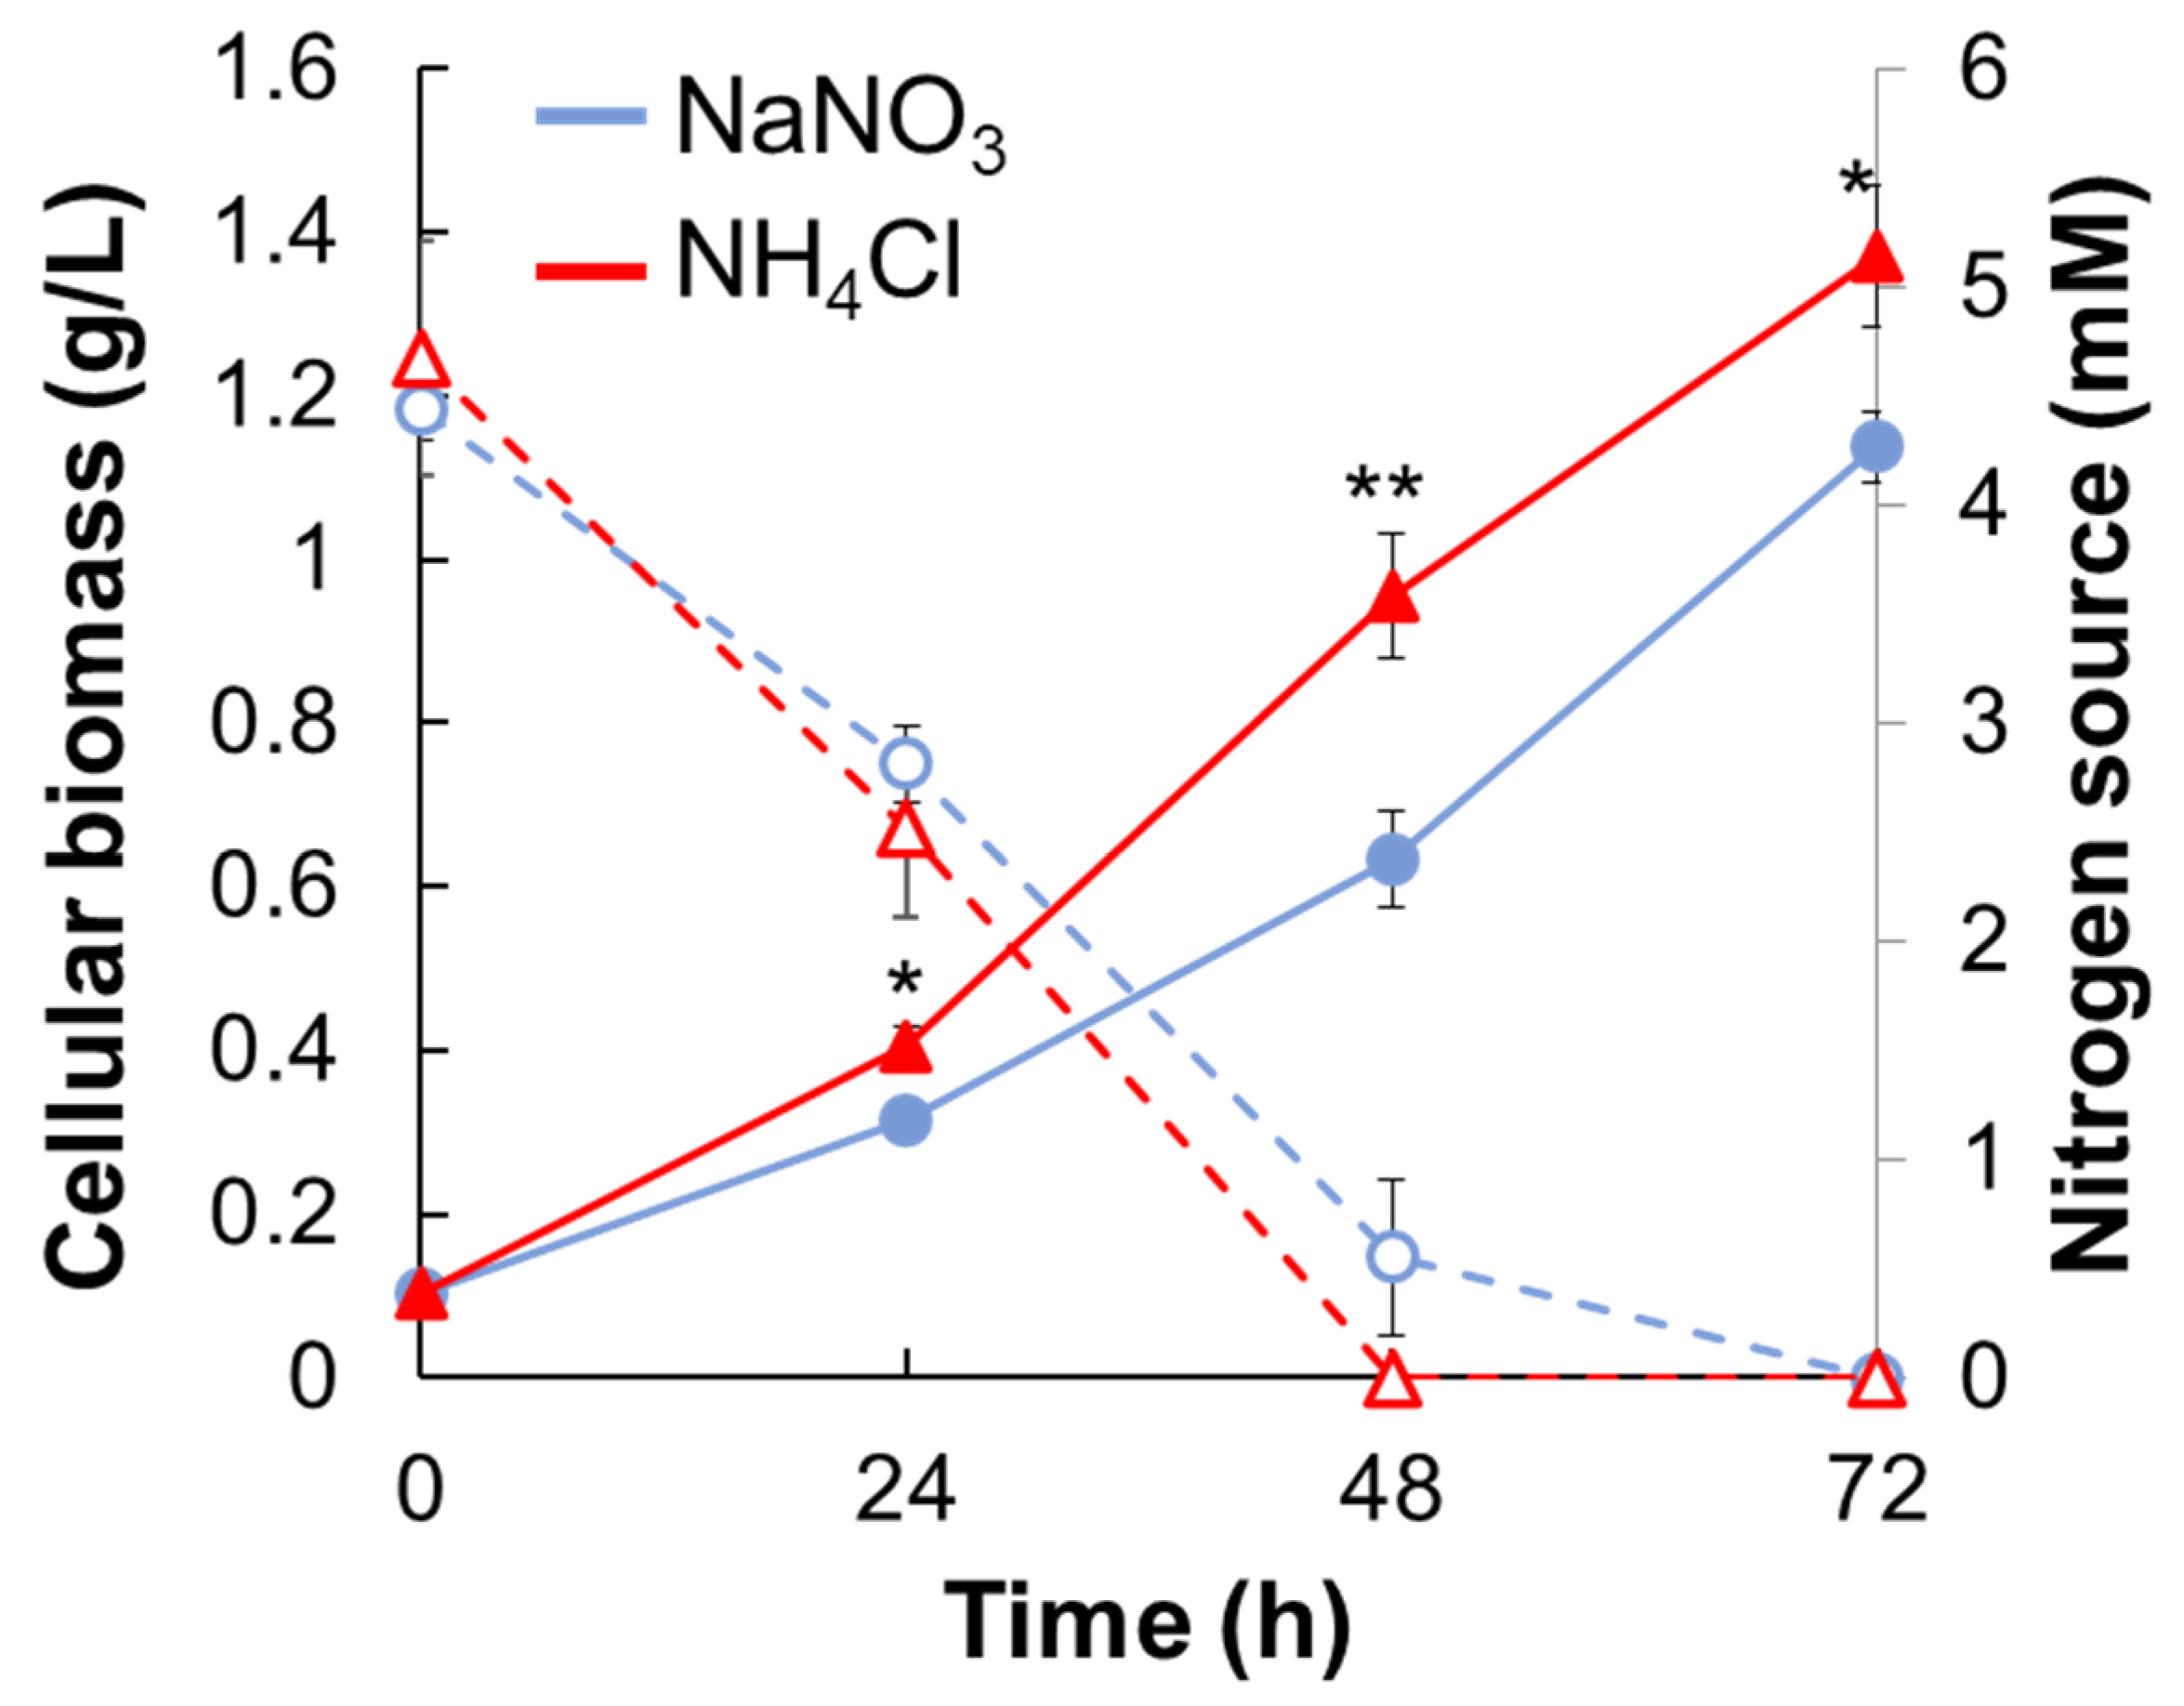
2.1. Growth in Different Types of Nitrogen Source

Synechocystis sp. PCC 6803 (hereafter Synechocystis) was cultivated in BG11 medium with 5 mM NaNO3 or NH4Cl (hereafter NaNO3 medium or NH4Cl medium) under phototrophic growth conditions (Figure 1 and Figure S1). The growth rate of Synechocystis was also calculated based on the growth data by 48 h when there are the residual nitrogen sources. The growth rate of Synechocystis grown in NaNO3 medium or NH4Cl medium was 0.028 ± 0.002 h−1 and 0.036 ± 0.002 h−1. The growth rate of Synechocystis in NH4Cl medium was significantly faster than that in NaNO3 medium throughout the cultivation. In contrast, there was no significant difference in the residual amounts of NaNO3 and NH4Cl in either medium.

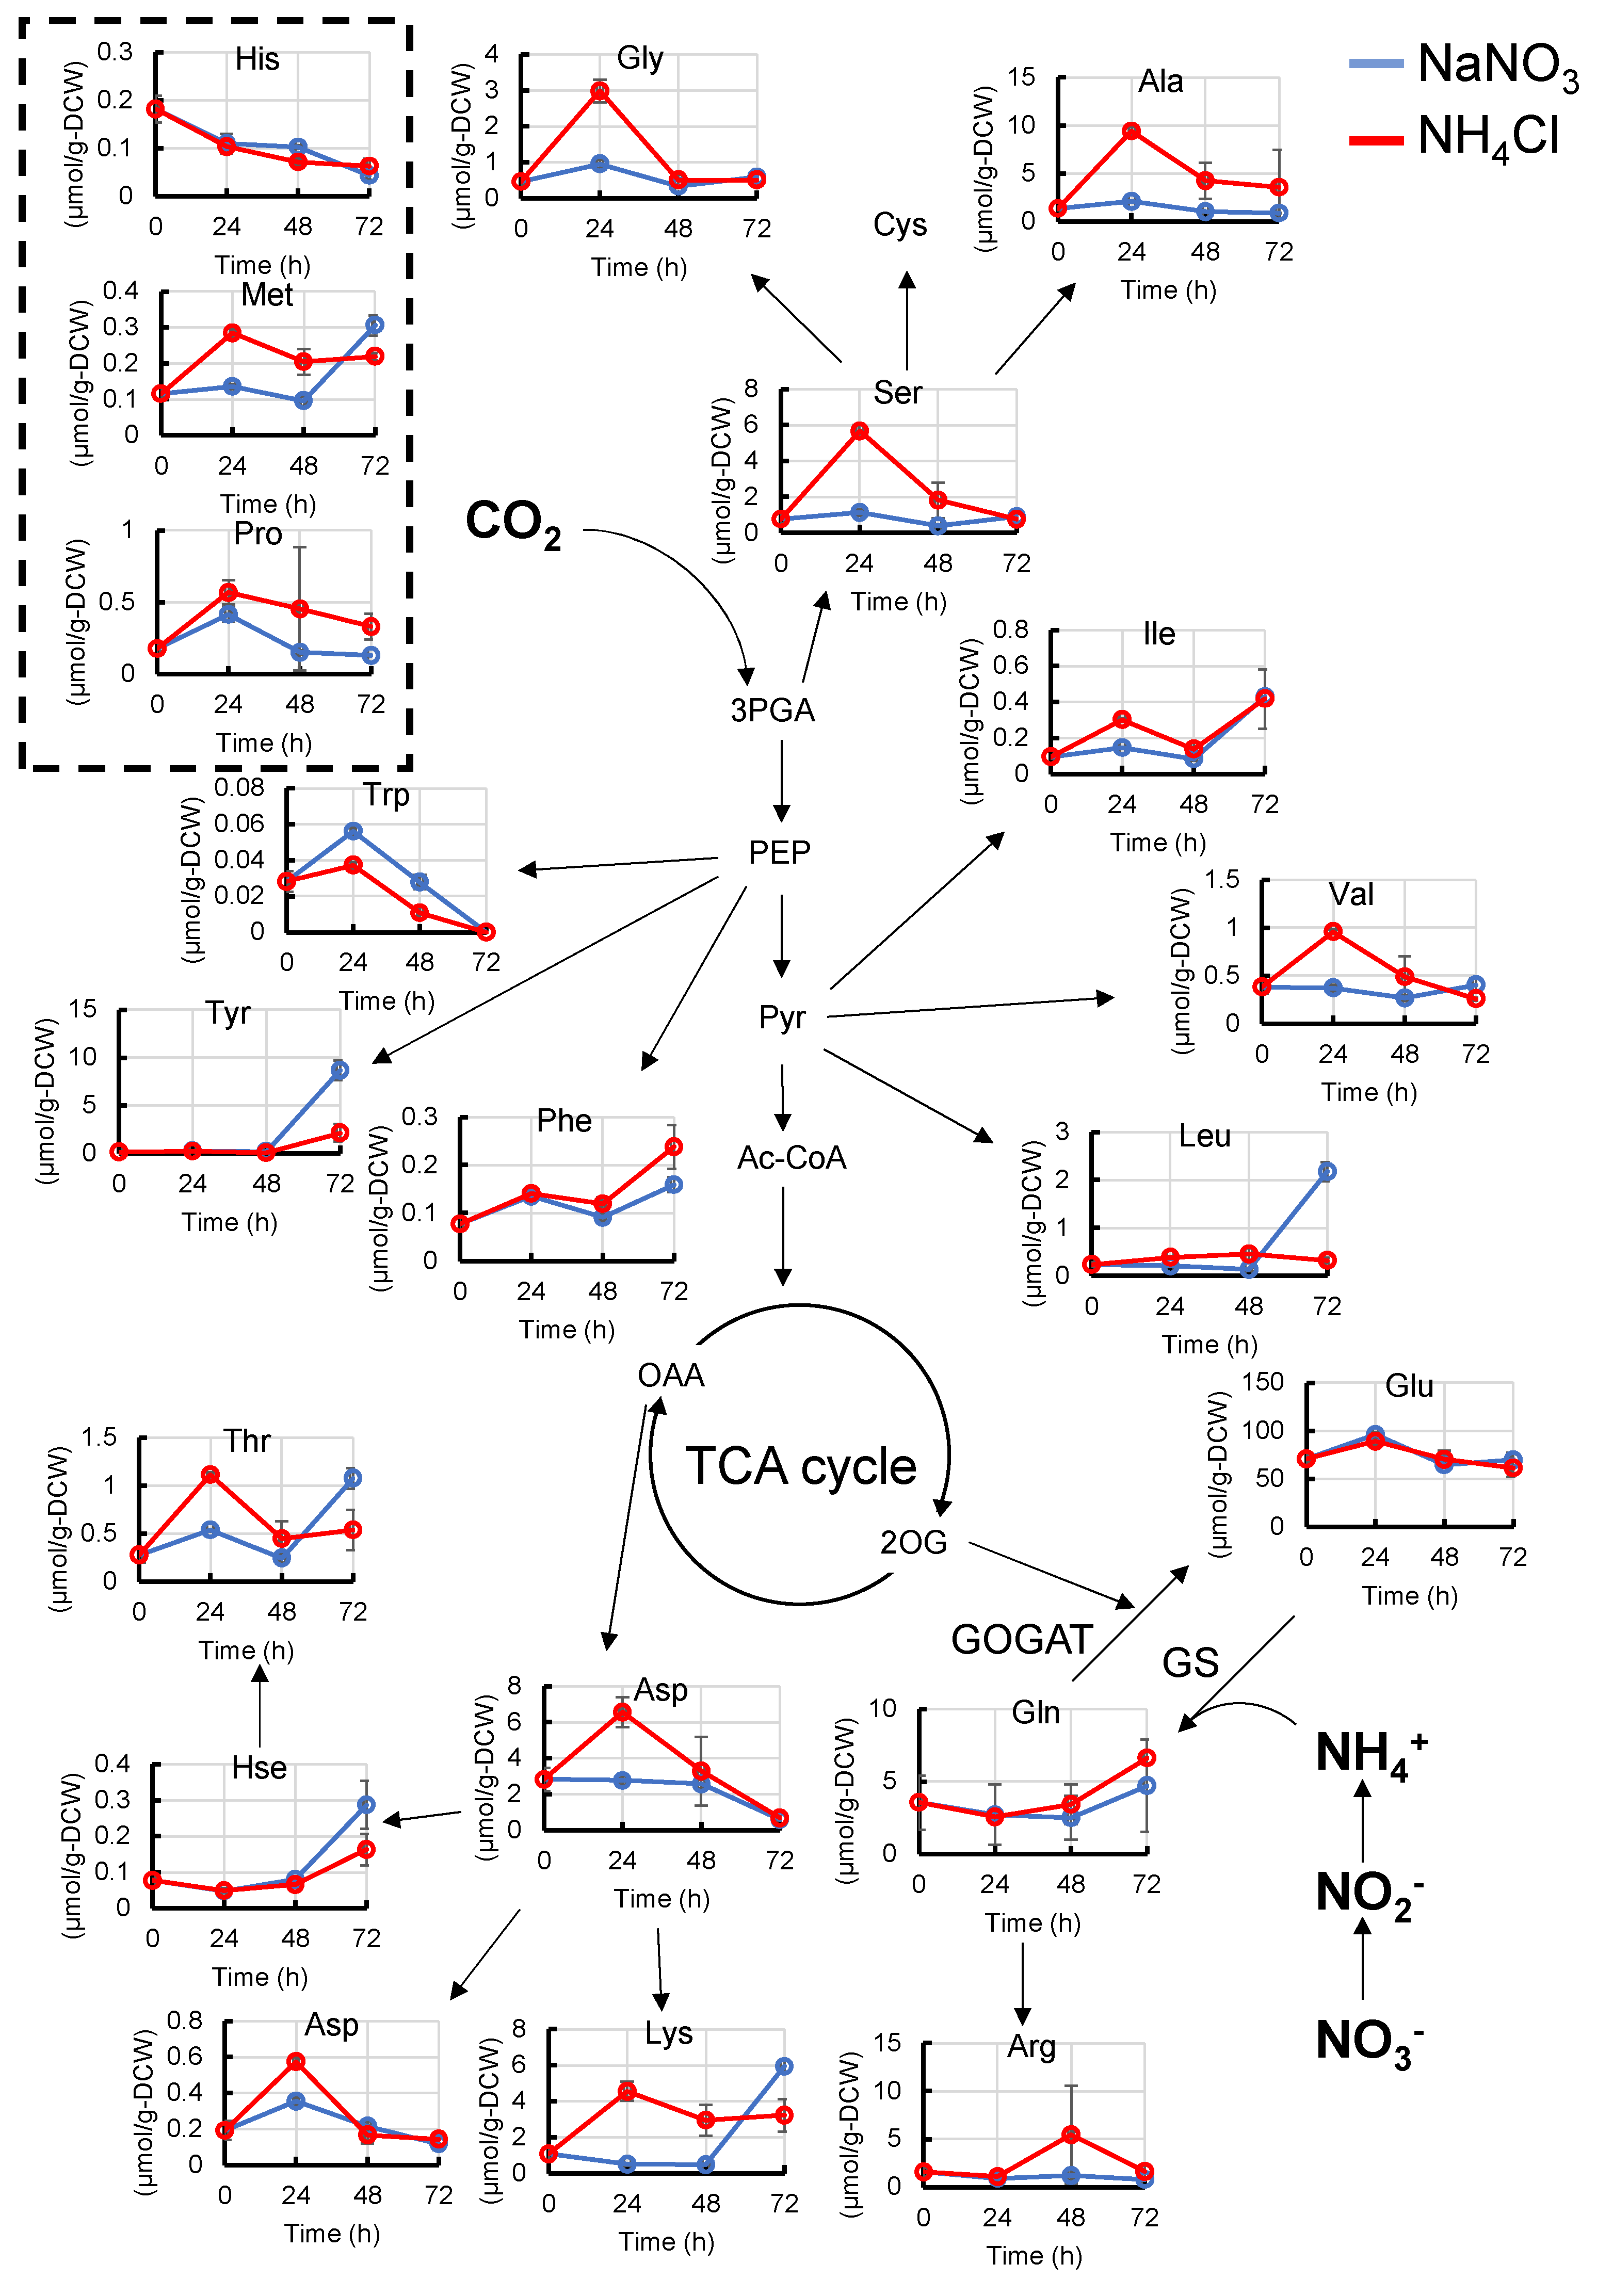
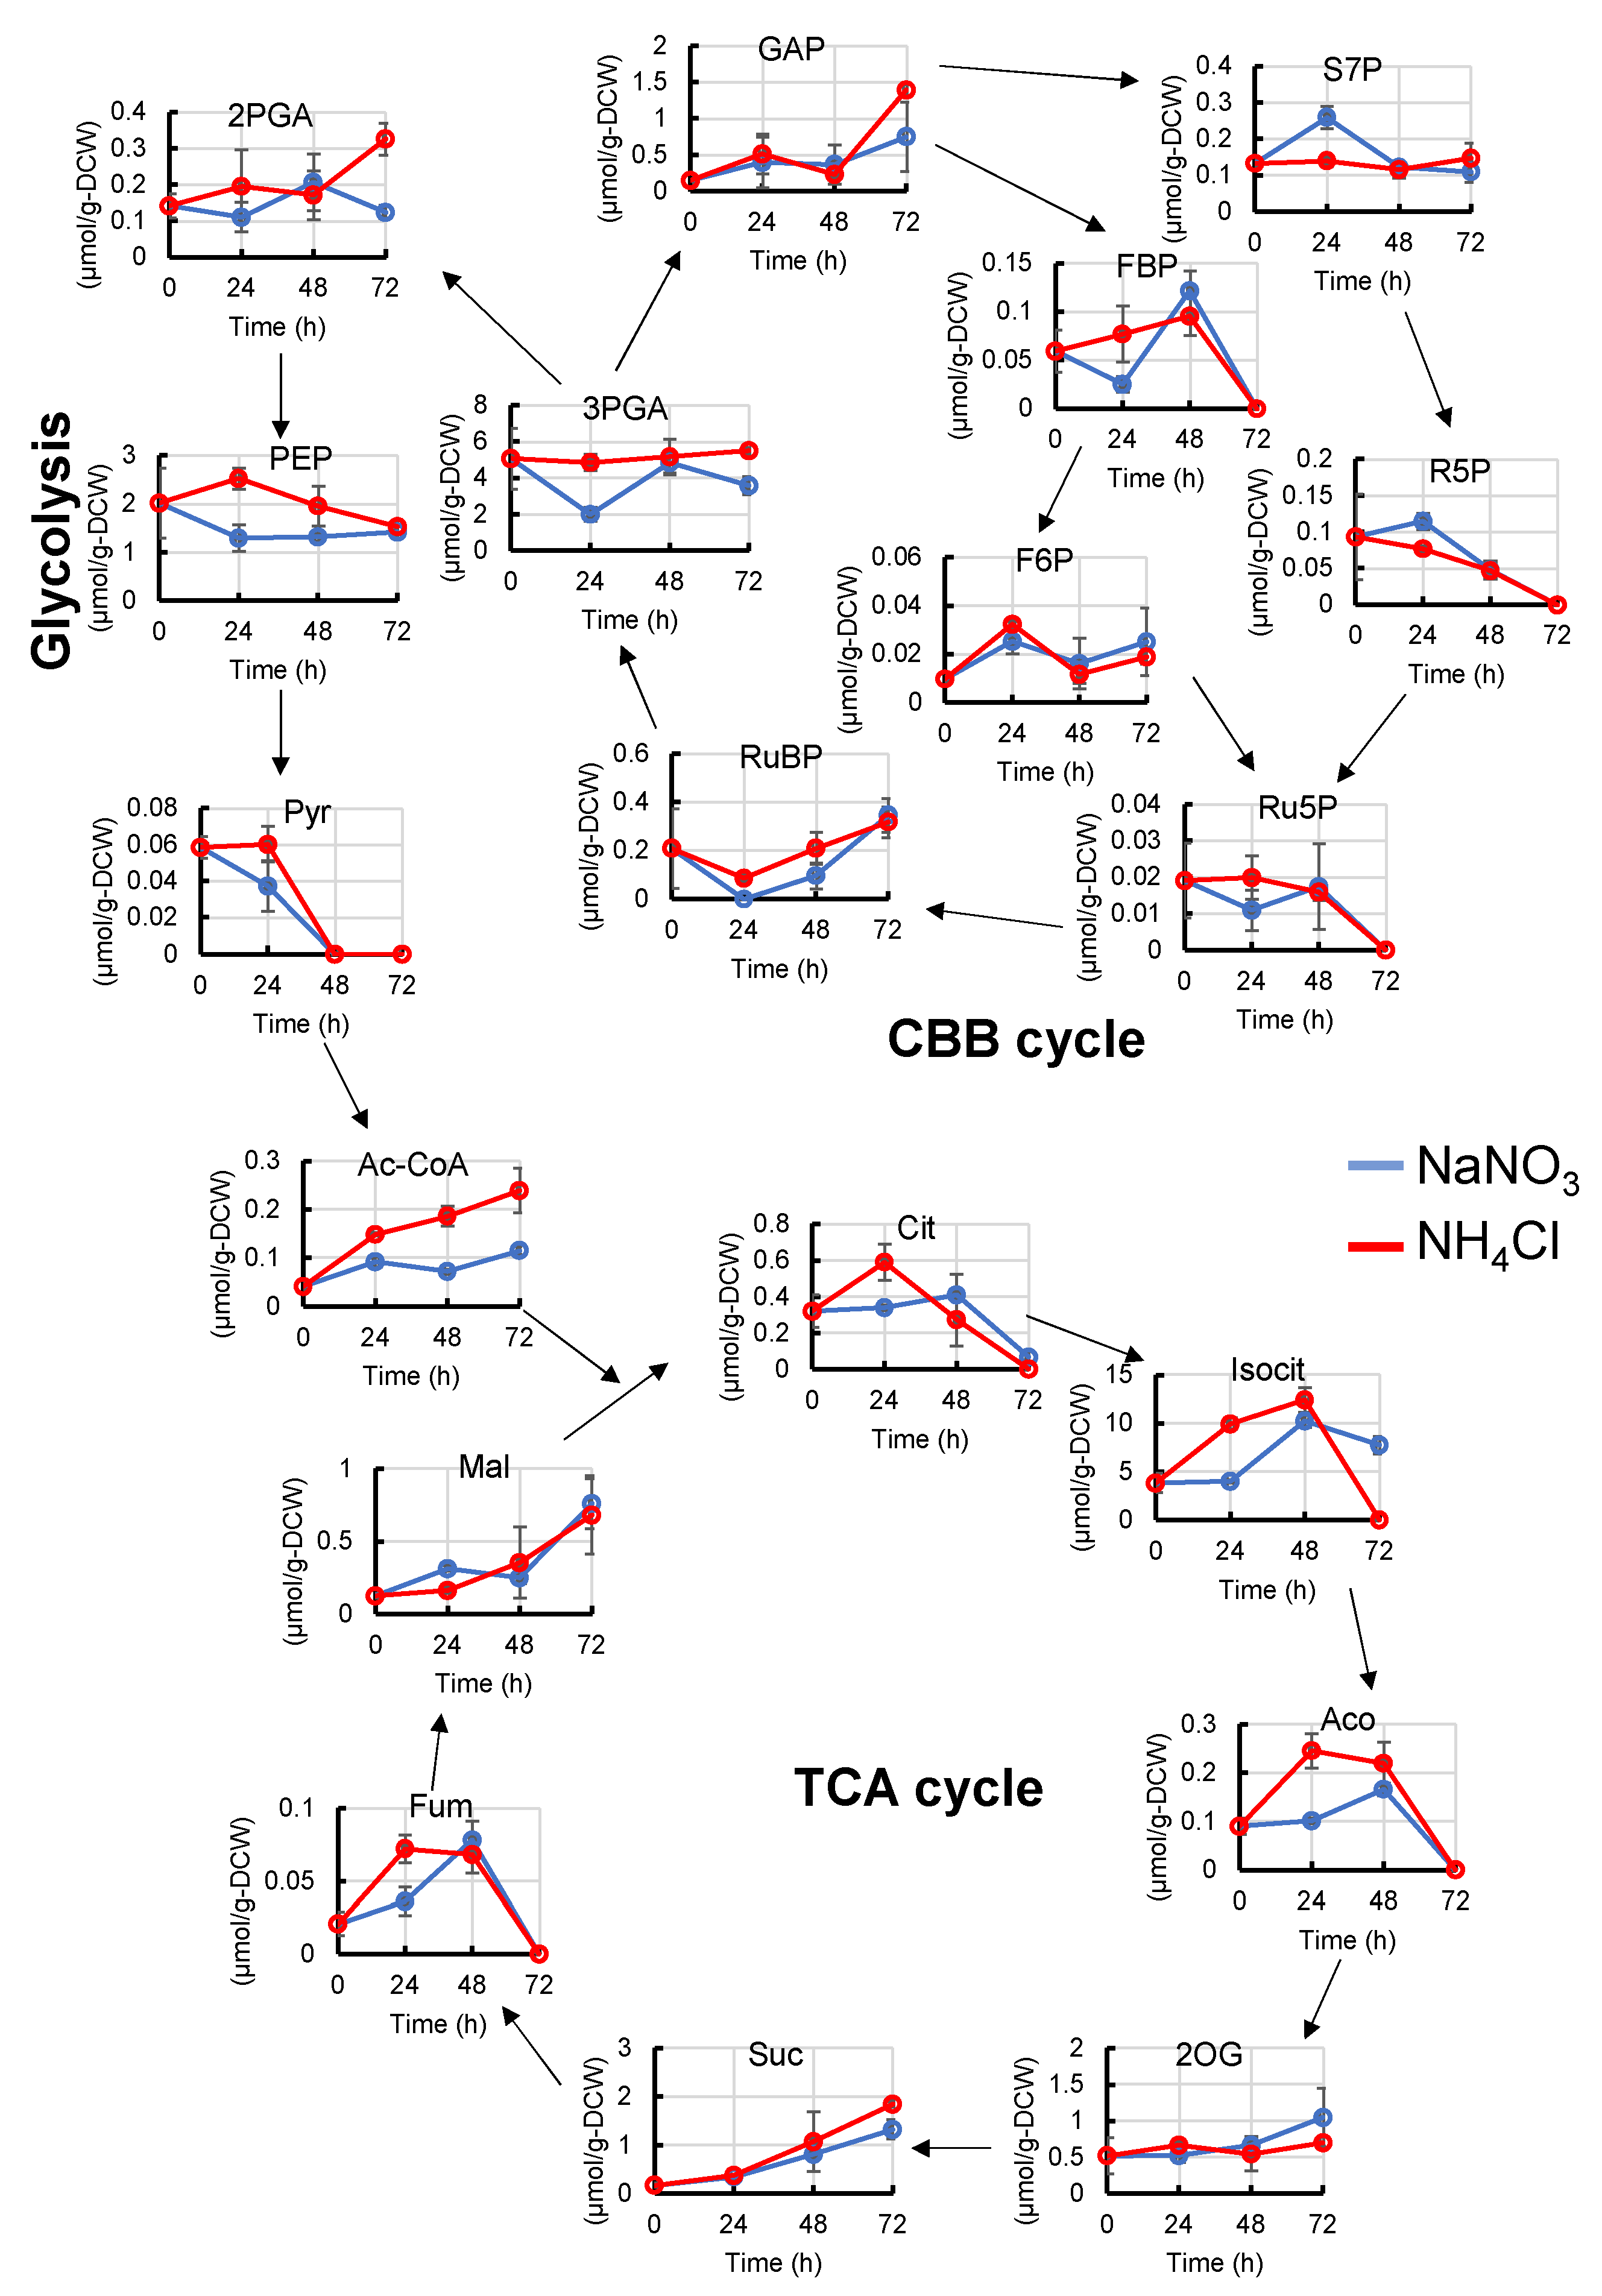
2.2. Metabolome Analysis with Different Types of Nitrogen Source

As nitrogen is thought to be assimilated mainly through the GS-GOGAT cycle, which synthesizes glutamate (Glu) and glutamine (Gln) from NH4 and 2OG, we first compared the amino acid levels with different nitrogen sources (Figure 2 and Figure S2). The pool sizes of serine (Ser), glycine (Gly), threonine (Thr), alanine (Ala), aspartate (Asp), asparagine (Asn), lysine (Lys), valine (Val), and isoleucine (Ile) when grown in NH4Cl medium were higher than those in NaNO3 medium 24 h after the start of cultivation. The pool sizes of methionine (Met) were still high 48 h after the start of cultivation. The pool sizes of Gln and Glu were the same between the NaNO3 and NH4Cl media. On the other hand, the pool size of tryptophan (Trp) when grown in NH4Cl medium was lower than that in NaNO3. Since Thr and Lys are synthesized from Asp, the pool sizes of Thr and Lys increased with an increase in Asp.
To understand why the differences in amino acid levels occur, we also examined some metabolites of the CBB cycle, glycolysis, and TCA cycle (Figure 3). After 24 h from the start of cultivation, the levels of ribulose-1,5-bisphosphate (RuBP), 3-phosphoglycerate (3PGA), phosphoenolpyruvate (PEP), acetyl-coenzyme A (Ac-CoA), citrate (Cit), aconite (Aco), isocitrate (Isocit), and fumarate (Fum) were higher, and sedoheptulose 7-phosphate (S7P) and ribose 5-phosphate (R5P) were lower than those with NaNO3. In contrast, no difference was observed in the pool size of pyruvate (Pyr), although PEP, Ile, Val, and acetyl-CoA were increased. We speculate that Pyr synthesized from PEP may be immediately converted to Val, Ile, and Ac-CoA.

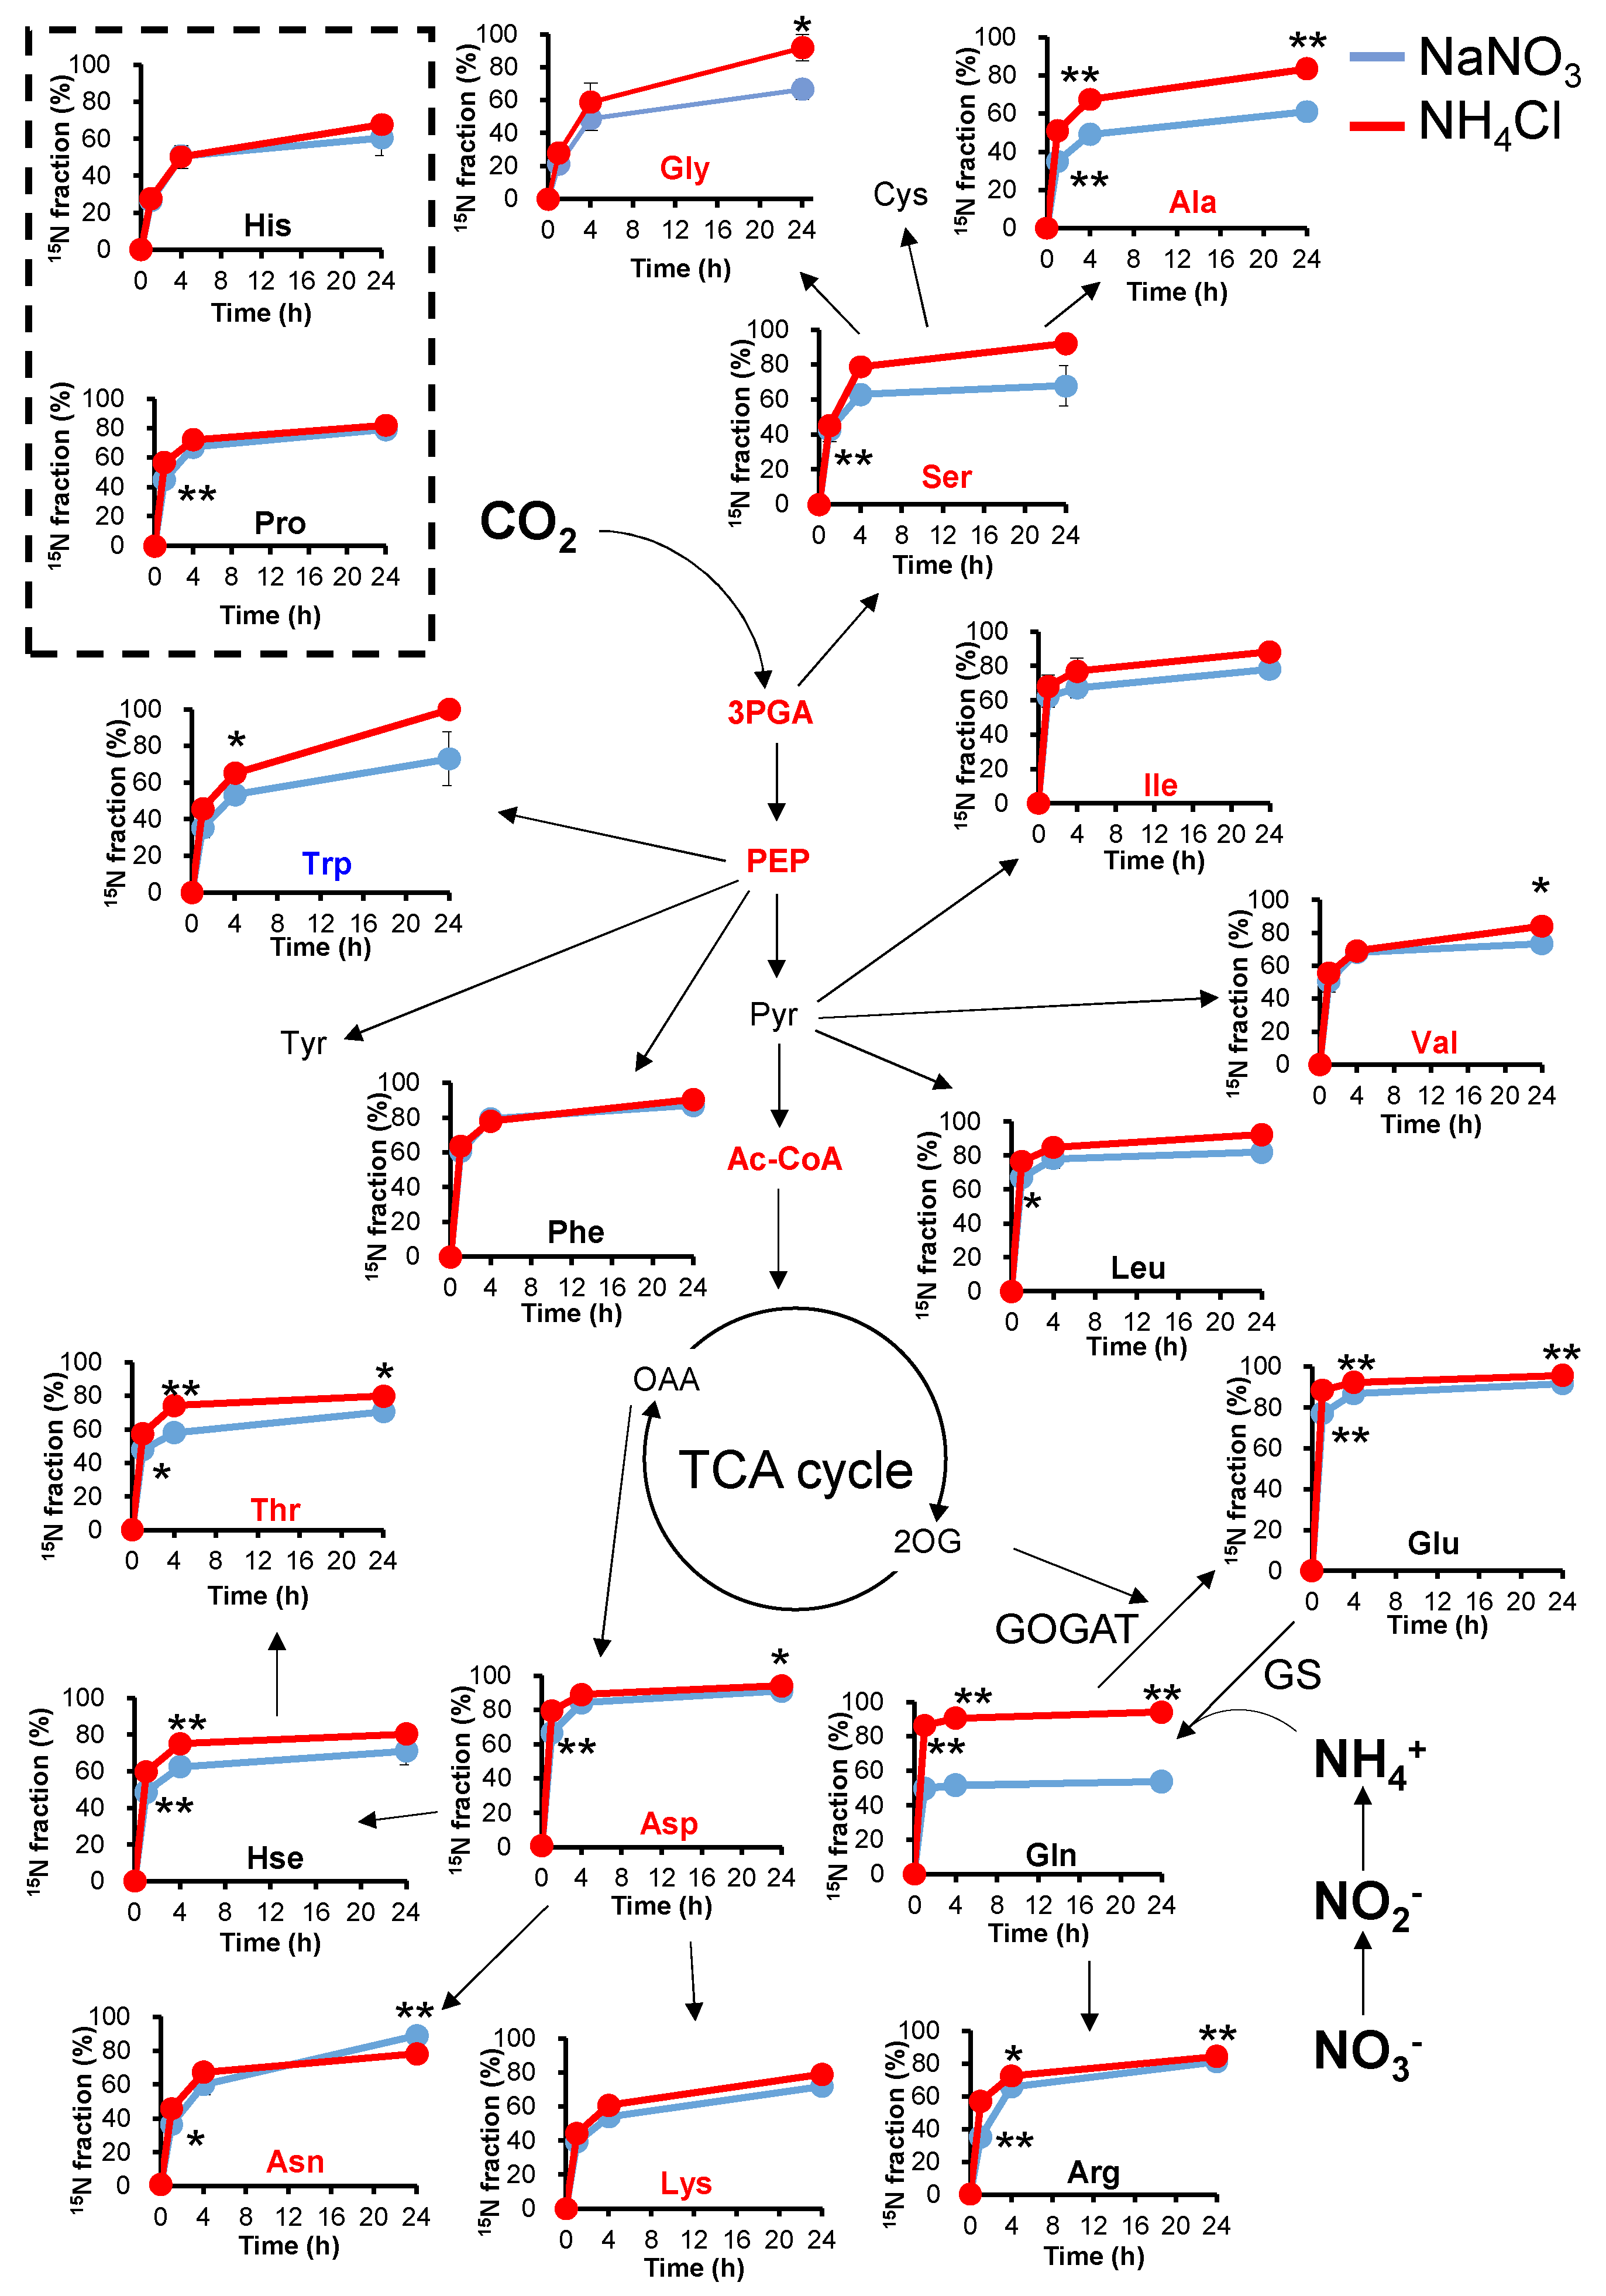
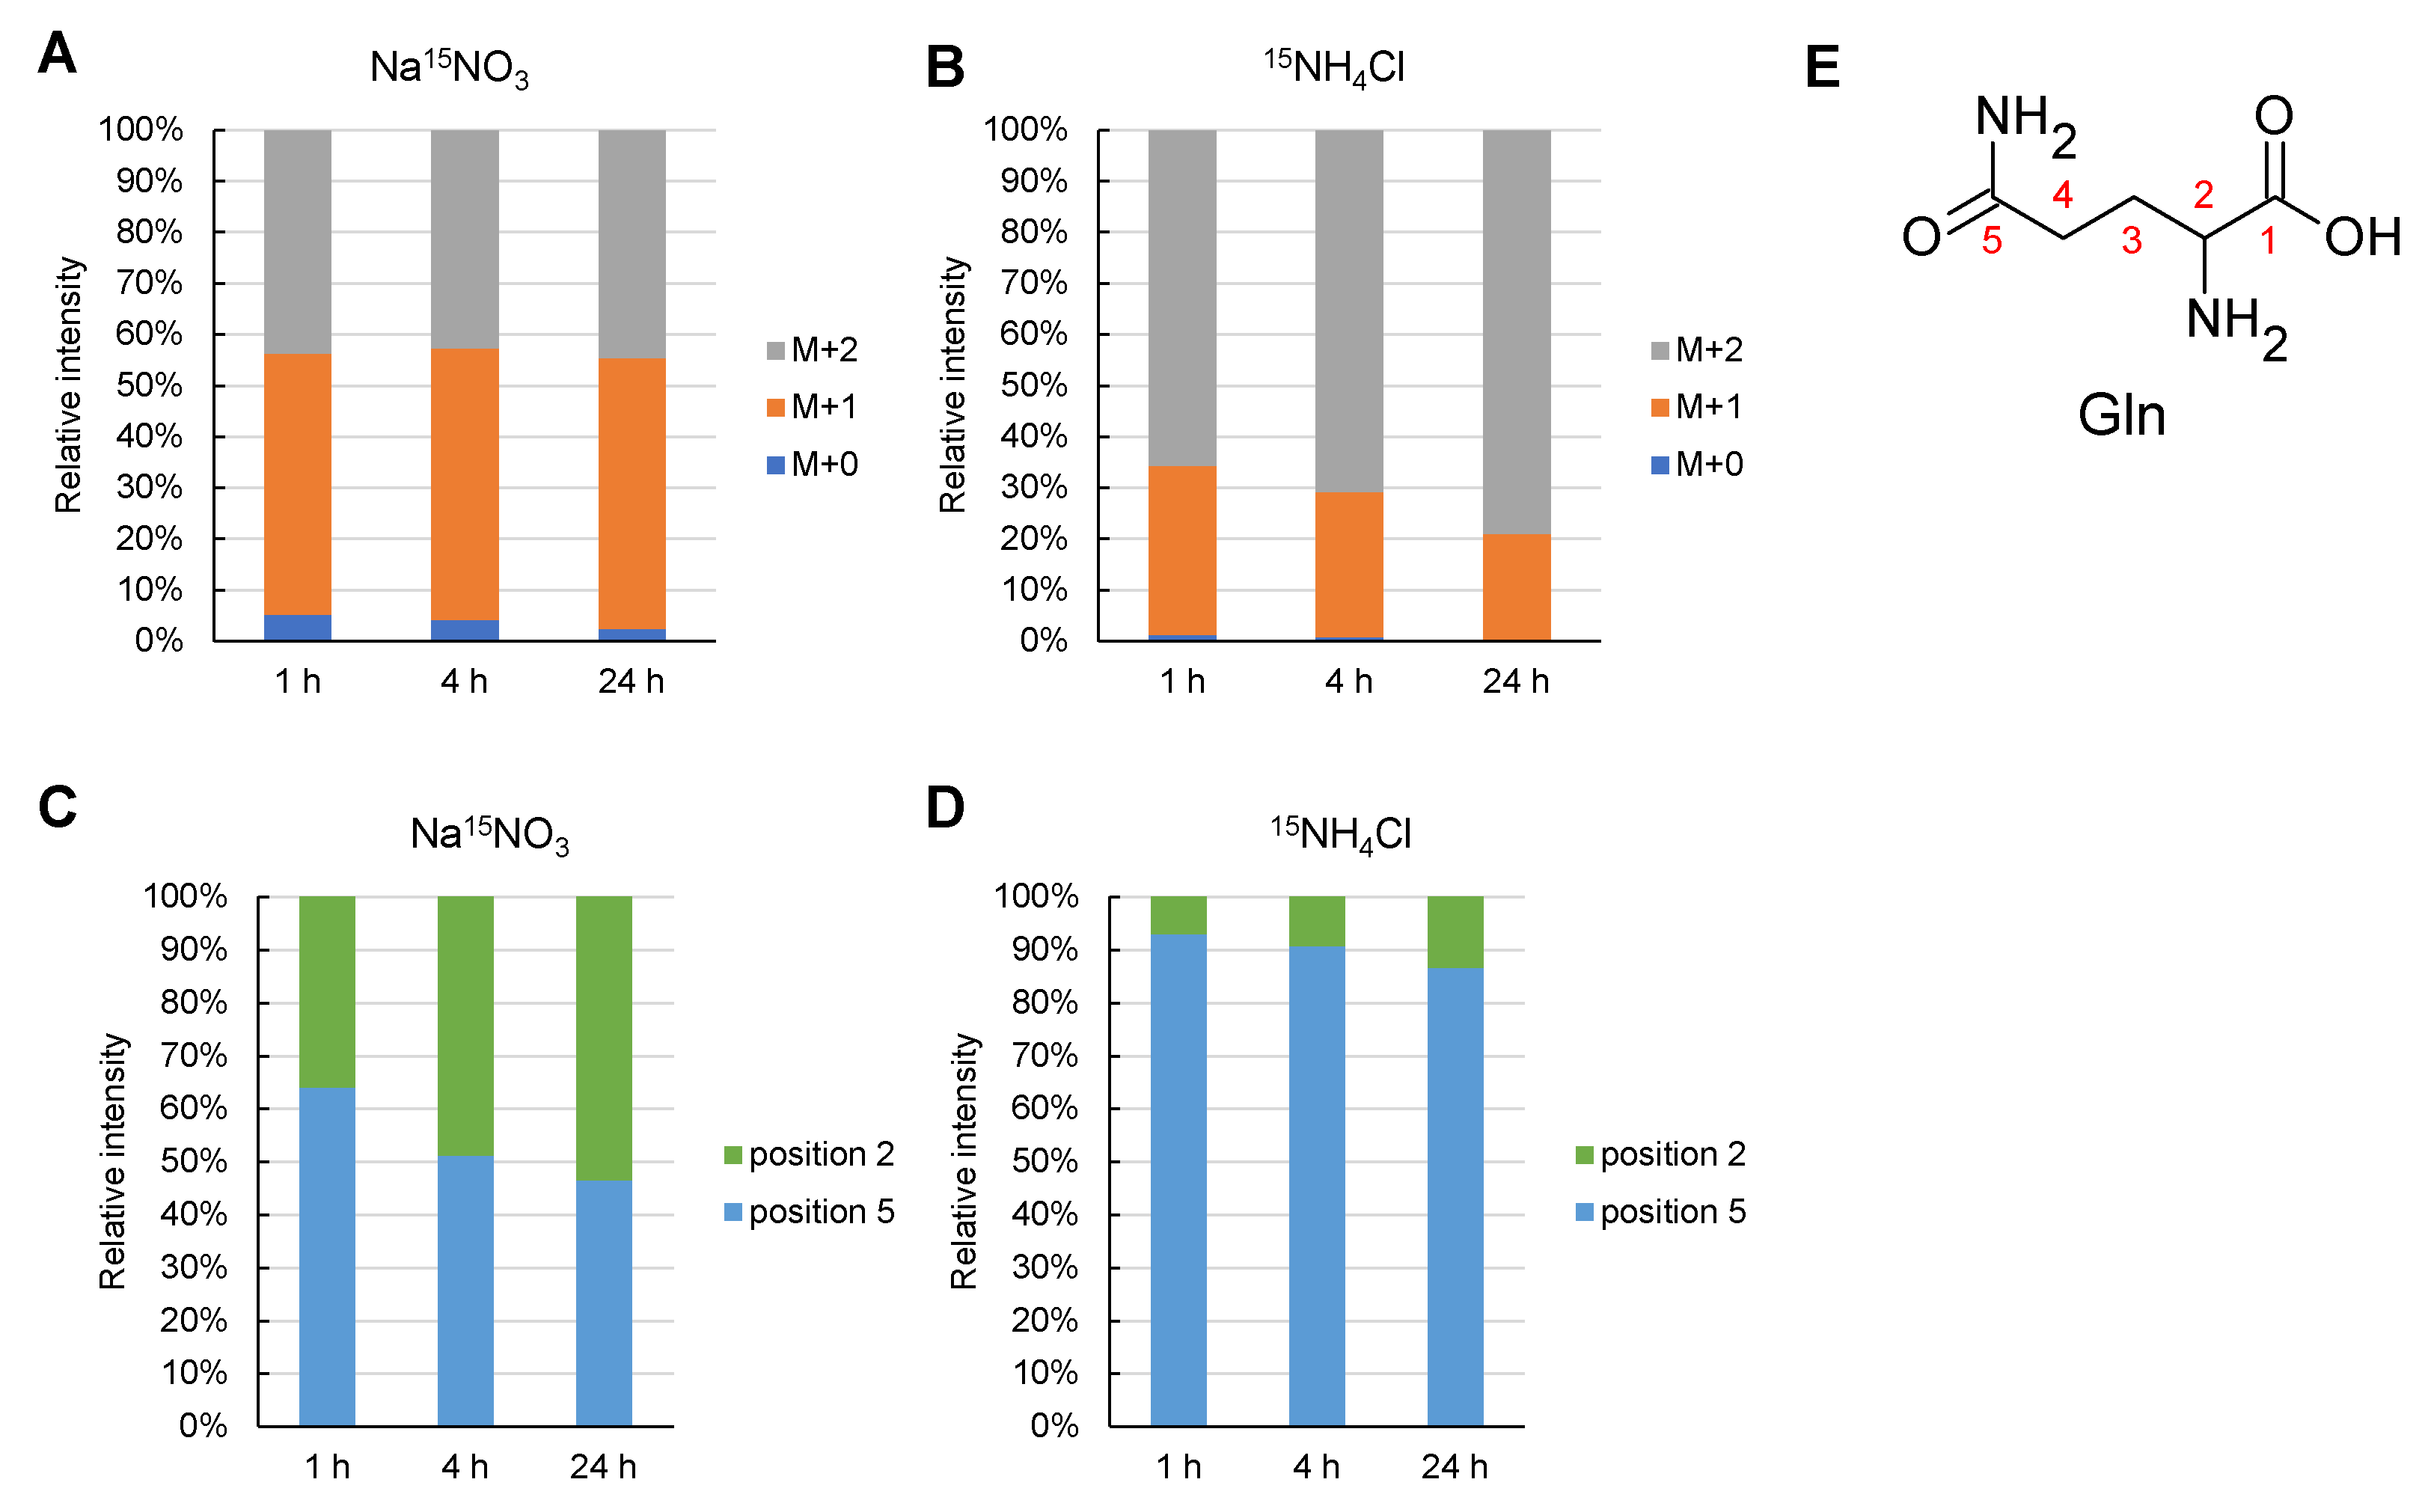
2.3. 15N-Turnover Analysis with Different Types of Nitrogen

The growth rates and pool sizes of the metabolites were different in NaNO3 and NH4Cl. However, the nitrogen flow in the cell when grown in NaNO3 or NH4Cl media remains unclear. To reveal nitrogen flow with different nitrogen sources, we measured the time-resolved labeling rate of amino acids by 15N stable isotope labeling (Figure 4 and Figure S3). For this purpose, Synechocystis cells were taken after 24 h of cultivation and transferred to fresh BG11 medium containing 15NH4Cl or Na15NO3 (labeling time = 0 h). The labeling rates of Ala, Ser, and Gly, which are synthesized from 3PGA, were significantly higher in NH4Cl medium than in NaNO3 medium. The larger pool sizes of Ala, Ser, and Gly when Synechocystis are grown in NH4Cl medium might result from the higher 15N labeling rate. The labeling rate of Glu and Gln were significantly higher in NH4Cl medium than in NaNO3 medium, which is consistent with a previous report [17]. However, the pool sizes of Glu and Gln did not change, as shown in Figure 2. This indicates that when Synechocystis is grown in NaNO3 medium, one of the two nitrogen atoms in Gln is 14NH4+, which can result from cellular nitrogen sources such as amino acids.

2.4. 15N Labelling Rate and Order in Glutamine Synthesis

To elucidate the mechanism underlying the lower labeling rate of glutamine in the NH4Cl medium, the position of the 15N-labeled nitrogen atom in the Gln molecule was examined using liquid chromatography-tandem mass spectrometry with the multiple reaction monitoring method (LC-MS/MS MRM) (Figure 5). 15N labeling conditions were the same as those for the experiments performed in Figure 4 (see Materials and Methods). The 15N labeling rate of Gln when cultured in Na15NO3 was almost constant for 24 h after Synechocystis inoculation (Figure 5A,B). On the other hand, when cultured in 15NH4Cl, the rate of 15N labeling of one of the two nitrogen atoms in Gln gradually decreased, and the unlabeled rate of Gln was 0.23% (2.5% in the presence of Na15NO3). As shown in Figure 4, the total 15N labeling rate of the two nitrogen atoms in Gln was 71% in Na15NO3 and 89% in 15NH4Cl. Next, the position of the 15N-labelled nitrogen atom in glutamine was investigated. The positions of the 15N labeling are described as positions 2 and 5, which are the amino groups of the main and side chains (Figure 5E). Position 5 of Gln was preferentially labeled 1 h after Synechocystis was inoculated under culture conditions with Na15NO3. After an interval of 24 h, the labeling rates of positions 2 and 5 became equal. On the other hand, in 15NH4Cl medium, position 5 was always preferentially labeled during the period of 24 h after Synechocystis inoculation.

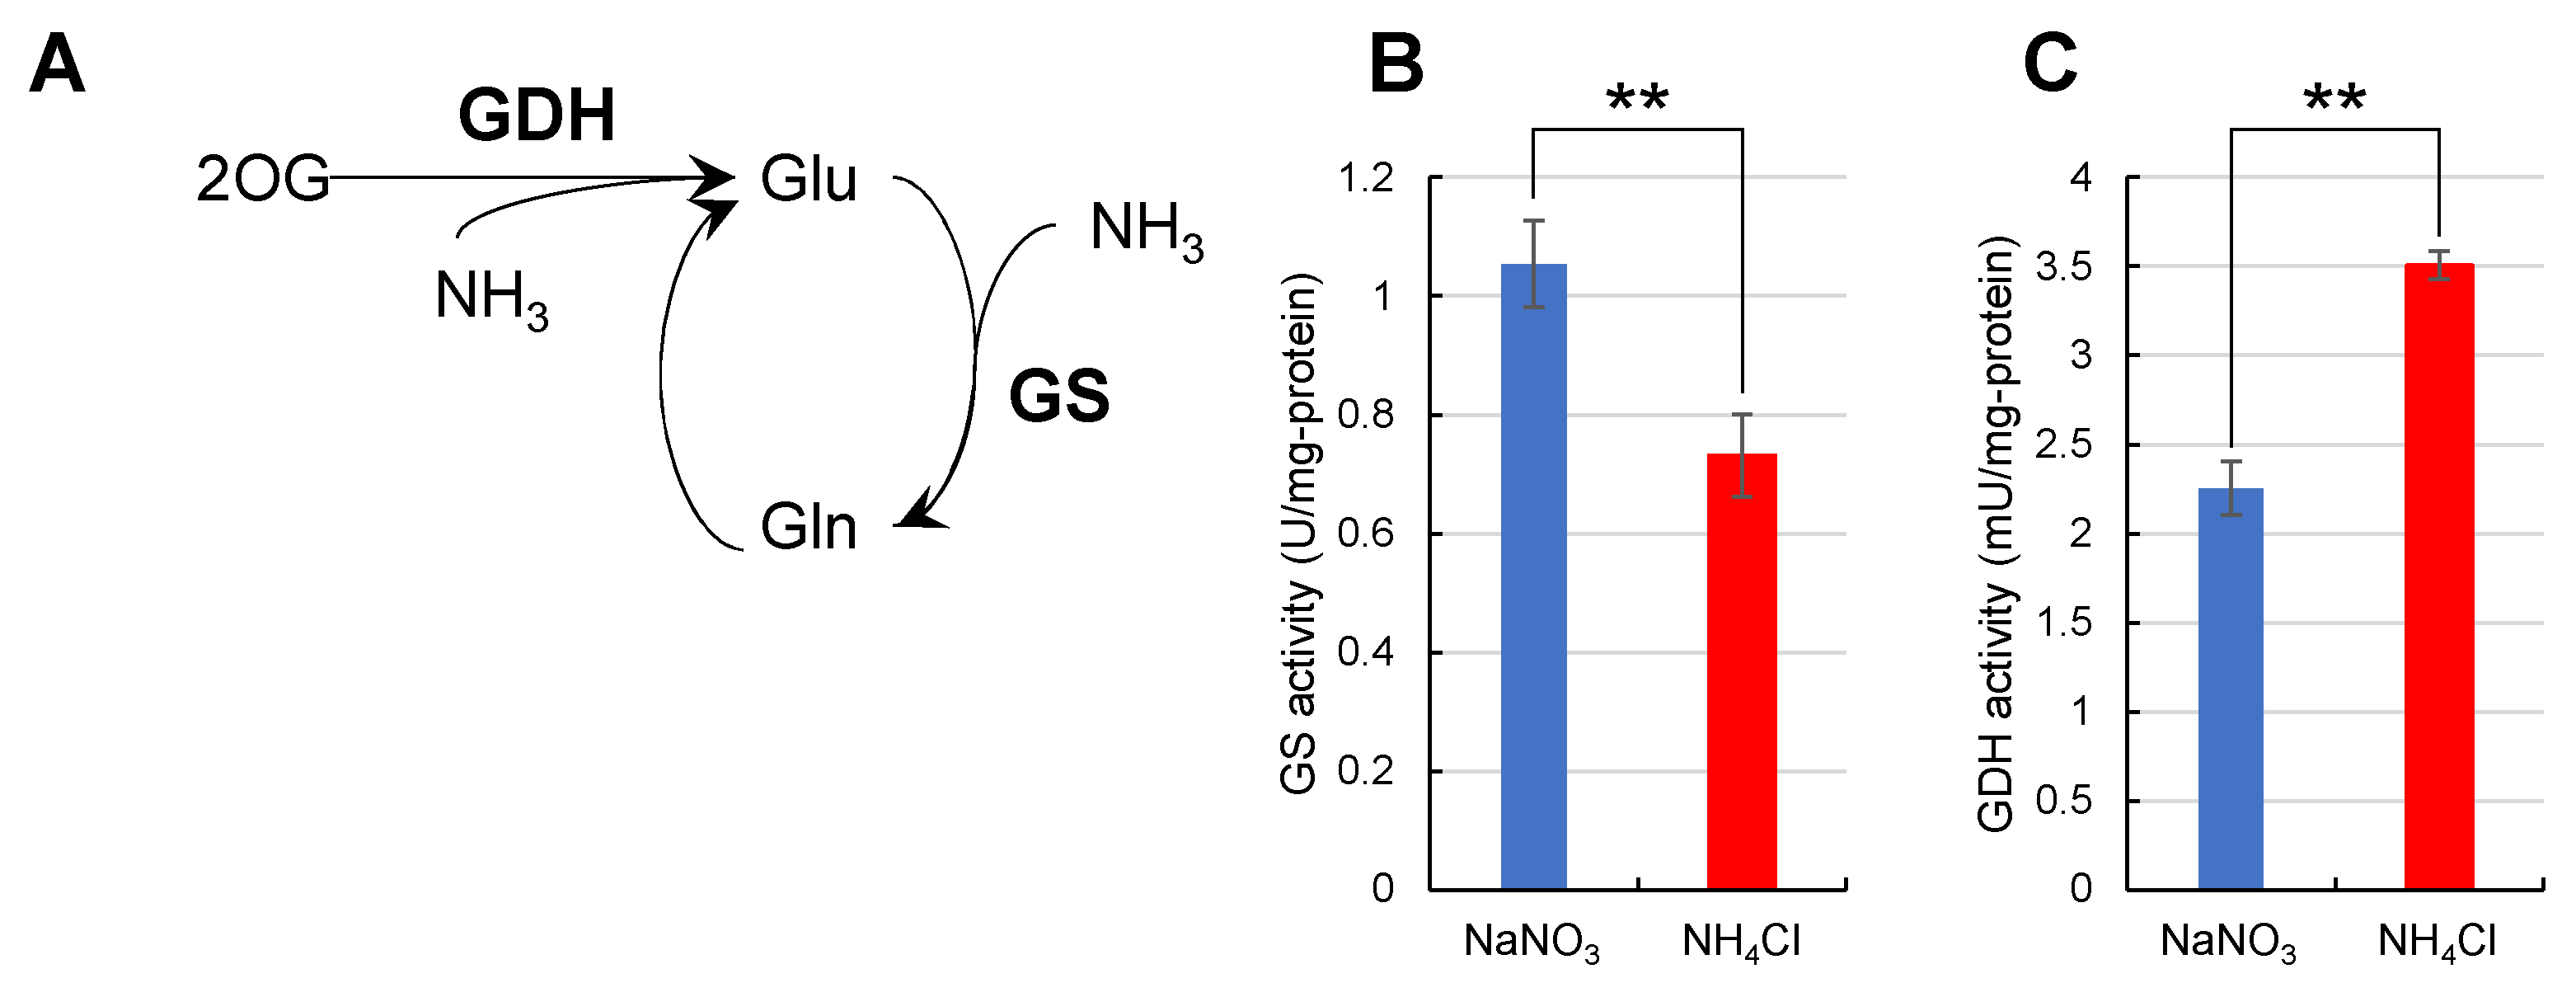
2.5. Nitrogen Assimilation Rate by Glutamine Synthase and Glutamate Dehydrogenase

From these results, the enzymatic activity for Gln synthesis was assumed to be affected by the type of nitrogen source. To test this hypothesis, we measured the catalytic activities of glutamine synthetase (GS) and glutamate dehydrogenase (GDH) from whole-cell lysates (Figure 6). The catalytic activity of GS was 1.1 U/mg-protein when Synechocystis was grown in NaNO3 medium and 0.73 U/mg-protein when grown in NH4Cl medium. In a previous report, the expression level of GS was higher in NaNO3 medium than in NH4Cl medium [14]. When considered with the results from this previous report, the difference in the catalytic activity of GS in Figure 6B reflects the difference in the expression level of GS itself. On the other hand, the activity of GDH was 3.5 mU/mg-protein when Synechocystis was grown in NH4Cl medium and 2.3 mU/mg-protein in NaNO3 medium; the catalytic activity of GDH in NH4Cl was higher than that in NaNO3.

3. Discussion

3.1. Different Assimilation Mechanisms for Nitrogen Depending on the Nitrogen Source

In this study, we wished to elucidate the mechanisms by which Synechocystis grown under different nitrogen sources assimilates nitrogen, and more generally, to clarify how it responds to different nitrogen sources. Different types of nitrogen altered the growth rate, pool sizes of metabolites, and nitrogen assimilation rate of Synechocystis (Figure 1, Figure 2, Figure 3, Figure 4 and Figure 5). In addition, the catalytic activities of GS and GDH were different for different types of nitrogen sources (Figure 6).
Based on the findings of this study, we propose a model for nitrogen assimilation by Synechocystis grown in different nitrogen sources (Figure 7). The model was prompted by 15N labeling experiments. In contrast to the assimilation of NH4+, Synechocystis was unable to assimilate NO3 by itself and required an additional reducing power to convert it to NH4+ (Figure 7A). This means that the reduction of NO3 appears to be the rate-limiting step for nitrogen assimilation. Therefore, at the beginning of the log phase, when there is sufficient photosynthetic reducing power, GS synthesizes Gln with 15NH4+, resulting in the rapid labeling of the side chain of Gln with 15N (Reaction 1 in Figure 7A) [23]. This hypothesis is consistent with the finding that the preferentially 15N-labeled nitrogen was in position 5 until 1 h later (Figure 5C). Subsequently, the 15N labelled NH2 group is rapidly transferred to 2OG by GOGAT, resulting in two Glu molecules (Reaction 2 in Figure 7A) [24]. GS can also synthesize doubly 15N-labeled Gln from newly reduced 15NH4+ and 15N-labeled Glu (Reaction 1 in Figure 7A). Furthermore, 15N-labeled Glu can be used as a nitrogen source in another pathway to generate another amino acid (Reaction 4 in Figure 7A). However, the reducing power gradually decreased as the light transmittance of the culture medium decreased during the transition from the early log phase (Figure 7A) to the late log phase (Figure 7B). It has been previously shown that light is necessary to reduce NO3, and Fd, which accepts the reducing power from the photosystem, reduces NO3 and NO2 to NH4+ [7,8,23,24]. Thus, GS cannot use the newly reduced 15NH4+ but reuses 14NH4+, which derived from amino acids due to the decrease in light (Figure 7B). As a result, Reaction 1 with 15NH4+ in Figure 7 would not occur. In fact, the 15N labeling rate of position 2 in Figure 5C gradually increased and became equal to that of position 5 after 24 h. This can also explain why the 15N labeling rate of Gln was 50% (Figure 4) and 71% (Figure 5A).
In contrast to NO3, reducing power is not required to assimilate NH4+. Figure 5D illustrates that position 5 in Gln is always dominant throughout the 24 h period, and Figure 5B indicates that 90% of nitrogen in all Gln molecules was labeled. The light conditions cannot be the rate-determining step to assimilate NH4+, and Reaction 1 in Figure 7C continues unless NH4+ is lacking. Therefore, we assumed that the 15N labeling rate quickly approached 90%, as shown in Figure 4 and Figure 5B.
We also considered the possibility that the higher labeling rate with 15NH4Cl in Figure 4 and Figure 5 resulted from the higher activity of the GDH pathway, as shown in Figure 6C. However, such possibilities can be excluded because, in Figure 5D,E, position 2 should be preferentially labeled if the GDH pathway is activated when Synechocystis is cultivated in NH4Cl medium. GDH synthesizes Glu from 2OG and NH4+, suggesting that position 5 is not labeled [25] and GS activity was much higher than the activity of GDH (Figure 6).
The catalytic activity of GS was about 1000-fold higher than that of GDH in Figure 6B,C. For Synechocystis, GDH is not essential for growth under the high CO2 conditions [26]. In Escherichia coli, GDH supplies glutamine in the absence of a carbon source because GDH can produce it without ATP originating from carbon utilization [27]. This means that the high CO2 conditions which were adopted in our experiments might have caused the 1000-fold change differences between the catalytic activity of GS and GDH.
In this study, we found that the type of nitrogen sources can affect the metabolic profile of Synechocystis. The altered metabolic profile and labeling rate of Synechocytstis in Figure 2, Figure 3, Figure 4 and Figure 5 when Synechocystis was grown in NaNO3 or NH4Cl media came from the availability of nitrogen. When Synechocystis was grown in NH4Cl medium, NH4+ could be used without limitation unless NH4Cl was absent in the medium. On the other hand, additional reducing power is required to use NaNO3 because Synechocystis cannot use NO3 directly. This means that the amount of light transmitted, which is the source of reducing power, can be the rate-determining step. Thus, Synechocystis switch the main nitrogen sources from the external to internal nitrogen sources which arise from internal amino acids or proteins to produce glutamine during the change of growth stage when grown in NaNO3 medium. This switch between external and internal nitrogen sources might enable Synechocystis to grow at the constant rate. When grown in NH4Cl medium, the residual additional reducing power for Synechocystis to assimilate nitrogen enables it to supply reducing power to other pathways. The pool size of 3PGA increased and that of S7P and R5P decreased, as shown in Figure 3. The altered pool sizes of these metabolites might be caused by the enhanced CBB cycle, consuming the residual additional reducing power that was not used in the reduction of NO3. Accordingly, the abundance of some metabolites in glycolysis and TCA cycle, and amino acids including 3PGA itself increased in Figure 2 and Figure 3. We suspect the high cell growth rate was accomplished by higher abundance of those metabolites.

3.2. The Choice of Nitrogen Source: NO3 or NH4+?

So far, we revealed that Synechocystis switches the main nitrogen sources from the external to internal nitrogen sources during the change of growth stage when grown in NaNO3 medium and does not need to switch the nitrogen sources in NH4Cl medium. This speculation suggests that NH4+ is ideal nitrogen sources for Synechocystis. However, there is a side effect of using NH4+ as a nitrogen source. The electron transport rate in Synechocystis decreased in the presence of over 15 mM NH4Cl according to a previous report [11]. This means that excess NH4+ can potentially inhibit photosynthesis in Synechocystis. In addition, GS-GOGAT cycle also requires the reducing power to assimilate nitrogen sources [1]. If the amount of NH4+ supplied exceeds the reducing power from photosynthesis, the accumulation of NH4+ would inhibit photosynthesis.
On the other hand, it is confirmed that there was no influence on photosynthesis over 15 mM NaNO3 in the same previous report. We guess the reason the excess amount of NH4+ cannot accumulate in the cell because the production of NH4+ is dependent on the availability of reducing power arisen from photosynthesis. This means that all the nitrogen assimilation pathway is dependent on the photosynthesis when grown in NaNO3, and it is beneficial for Synechocystis to perform the nitrogen assimilation in concert with photosynthesis and cell growth, preventing the excess accumulation of NH4+ in the cell.
The proper type of nitrogen depends on the species of cyanobacteria, given that they can assimilate various types of nitrogen sources, such as NO3 and NH4+, as shown in this paper. NH4+ stimulated the growth of Synechocystis, as shown in Figure 1. In contrast, it attenuated the growth of Arthrospira (Spirulina) sp. [12,16] and did not affect the growth of Microcystis aeruginosa NIES-843 [17]. The reasons for the differing responses of cyanobacteria species to different types of nitrogen sources remain unclear. However, we revealed that the enhancement of metabolite pool size and nitrogen turnover by NH4+ stimulated the growth of Synechocystis in this study. A comparison of the comprehensive metabolic profiles of these cyanobacteria species under different types of nitrogen might reveal the reasons for the different responses of cyanobacteria species.

4. Materials and Methods

4.1. Strain and Cultivation Conditions

Synechocystis sp. PCC 6803 strain was pre-cultivated in BG11 medium containing 20 mM HEPES-KOH (pH 7.7) and 17.6 mM NaNO3 under 50 μmol photons m−2 s−1 at 30 °C for 4 days, as described previously [18]. After pre-cultivation, Synechocystis was inoculated into modified BG11 medium containing 50 mM HEPES-KOH (pH 7.7) and 5 mM NaNO3 or NH4Cl (NaNO3 medium or NH4Cl medium) and cultivated under 1% (v/v) CO2 and 100 μmol photons m−2 s−1 at 30 °C. The culture medium was recovered at the indicated times described below for further analysis. Statistical analysis was conducted using Welch’s t-test (* <0.05, ** <0.01).

4.2. Measurement of the Intracellular Metabolite Concentration

Extraction and analysis of the intracellular metabolites was performed as previously reported [18]. The procedure is described briefly. For the analysis of the intracellular metabolite concentration, the culture medium corresponding to 5 mg of dry cell weight was recovered at 0, 24, 48, and 72 h after inoculation with Synechocystis. After filtration, the collected cells were washed with 20 mM (NH4)2CO3. The intracellular metabolite was extracted using pre-cooled methanol containing the internal standard, and the water-soluble phase was collected by mixing chloroform. The soluble protein was removed by filtration, and the resultant water phase containing the metabolite was evaporated under vacuum. The dried metabolites were dissolved in pure water and subjected to CE-MS analysis.

4.3. 15N-Metabolic Turnover Analysis

The assimilation ratio of newly added nitrogen sources at each time point was determined using stable isotope 15N-labelled Na15NO3 or 15NH4Cl. Synechocystis was transferred to the modified BG11 medium containing 5 mM Na15NO3 or 15NH4Cl 24 h after inoculation and cultivated under 1% (v/v) CO2 and 100 μ mol photons m−2 s−1 at 30 °C. The culture medium corresponding to 5 mg of dry cell weight was recovered at 0, 4, and 24 h, and the intracellular metabolites were analyzed by CE-MS as described above or by LC-MS/MS MRM. The procedure of sample preparation was the same as described above Section 4.2 (measurement of the intracellular metabolite concentration) and LC-MS/MS MRM analysis was performed by employing Nexera X2 high-performance liquid chromatography system and a LCMS-8060 triple quadrupole mass spectrometer (Shimadzu Corporation, Kyoto, Japan), as described previously [28]. The 15N labeling rate was calculated as performed in 13C labeling experiments in previous reports [18]. The relative isotopomer abundance (mi) for each metabolite in which the i15N atoms were incorporated is calculated as follows:
m i ( % ) = M i j = 0 n M j × 100
N 15   fraction ( % ) = i = 1 n i × m i n  
where Mi represents the isotopomer abundance of metabolite incorporating i15N atoms, and n is the number of nitrogen atoms in the metabolite. Statistical analysis was conducted using Welch’s t-test (* <0.05, ** <0.01).

4.4. Enzymatic Assay of Whole Cell Lysate

Synechocystis cells that were cultured in the presence of NaNO3 or NH4Cl were collected by centrifugation (3000× g, 4 °C, 10 min) and washed with nitrogen-free BG11 medium. The cells were collected by centrifugation and resuspended in 60 mM HEPES-KOH (pH 7.0). The suspended cells were disrupted by sonication, and the cell debris was removed by centrifugation (20,000× g, 4 °C, 20 min). After centrifugation, the supernatant was collected, and the protein concentration was determined using the Takara BCA Protein assay kit (Takara, Shiga, Japan). Glutamine synthetase (GS) assays were performed as described previously with some modifications [15]. Fifteen microliters of whole cell lysate containing 16 μg of protein was mixed well with 185 μL reaction solution 1 containing 60 mM HEPES-KOH (pH 7.0), 40 mM glutamine, 4 mM MnCl2, 60 mM hydroxylamine, 1 mM ADP, and 20 mM sodium arsenate. Reaction solution 1 was incubated at 30 °C for 20 min and terminated by the addition of an equal volume of FeCl3 solution containing 0.5 M HCl, 247 mM FeCl3, and 196 mM trichloroacetate. GS activity (units/mg protein) was calculated at an absorption wavelength of 500 nm to determine the amount of γ-glutamylhydroxamate. The glutamate dehydrogenase (GDH) assay was performed as described previously with some modifications [29]. Whole cell lysate containing 0.24 mg of protein was mixed well with 875 μL reaction solution 2 containing 85 mM Tris-HCl (pH 8.0), 10 mM 2OG, and 50 mM NH4Cl. The catalytic reaction of GDH was initiated by the addition of 50 μL of 0.2 mM NADPH, and the decrease in NADPH at absorption at 340 nm was monitored using a spectrophotometer V-670 (JASCO, Tokyo, Japan) to calculate GDH activity (mUnits/mg-protein). Statistical analysis was conducted using Welch’s t-test (* <0.05, ** <0.01).

Supplementary Materials

The following are available online at https://0-www-mdpi-com.brum.beds.ac.uk/article/10.3390/metabo11120867/s1, Figure S1: Growth curve of Synechocystis during 168 h in NaNO3 medium or NH4Cl medium under phototrophic conditions, Figure S2: Comparison of metabolic profiles in the Urea cycle. The pool sizes of some metabolites of the Urea cycle were examined. Blue lines, cultivation with NaNO3; Red lines, cultivation with NH4Cl.; Arg, Arginine; CPS, Carbamoyl phosphate; Glu, Glutamate; Orn, Ornithine, Figure S3: 15N labelling rates of metabolites of the Urea cycle, 15N labelling rates of the Urea cycle was compared at each time point. Blue lines, cultivation with NaNO3; Red lines, cultivation with NH4Cl.; Arg, Arginine; CPS, Carbamoyl phosphate; Glu, Glutamate; Orn, Ornithine.

Author Contributions

Conceptualization, T.H.; methodology, T.H. and R.H.; formal analysis, K.I., A.M., M.M. and T.Y.; investigation, K.I. and A.M.; data curation, K.I., A.M., M.M. and T.Y.; writing—original draft preparation, K.I., Y.K., R.H. and T.H.; writing—review and editing, K.I., Y.K., R.H. and T.H.; supervision, A.K.; project administration, T.H.; funding acquisition, T.H. All authors have read and agreed to the published version of the manuscript.

Funding

This work was supported by the Mirai Program Grant Number JPMJMI19E4 and the Advanced Low Carbon Technology Research and Development Program (ALCA) [grant numbers JPMJAL1306 and JPMJAL1608] from the Japan Science and Technology Agency (JST) of the Ministry of Education, Culture, Sports, Science, and Technology (MEXT), Japan.

Institutional Review Board Statement

Not applicable.

Informed Consent Statement

Not applicable.

Data Availability Statement

Data is contained within the article or Supplementary Material.

Acknowledgments

This work was supported by the Advanced Low Carbon Technology Research and Development Program (ALCA) of the Japan Science and Technology Agency (JST), Ministry of Education, Culture, Sports, Science, and Technology (MEXT), Japan.

Conflicts of Interest

The authors declare no conflict of interest.

References

  1. Mills, L.A.; McCormick, A.J.; Lea-Smith, D.J. Current knowledge and recent advances in understanding metabolism of the model cyanobacterium Synechocystis sp. PCC 6803. Biosci. Rep. 2020, 40, BSR20193325. [Google Scholar] [CrossRef] [Green Version]
  2. Zhang, H.; Liu, Y.; Nie, X.; Liu, L.; Hua, Q.; Zhao, G.P.; Yang, C. The cyanobacterial ornithine-ammonia cycle involves an arginine dihydrolase article. Nat. Chem. Biol. 2018, 14, 575–581. [Google Scholar] [CrossRef]
  3. Masukawa, H.; Inoue, K.; Sakurai, H.; Wolk, C.P.; Hausinger, R.P. Site-directed mutagenesis of the anabaena sp. strain PCC 7120 nitrogenase active site to increase photobiological hydrogen production. Appl. Environ. Microbiol. 2010, 76, 6741–6750. [Google Scholar] [CrossRef] [Green Version]
  4. Omata, T.; Andriesse, X.; Hirano, A. Identification and characterization of a gene cluster involved in nitrate transport in the cyanobacterium Synechococcus sp. PCC7942. MGG Mol. Genet. Genom. 1993, 236, 193–202. [Google Scholar] [CrossRef]
  5. Montesinos, M.L.; Muro-Pastor, A.M.; Herrero, A.; Flores, E. Ammonium/methylammonium permeases of a cyanobacterium: Identification and analysis of three nitrogen-regulated amt genes in Synechocystis sp. PCC 6803. J. Biol. Chem. 1998, 273, 31463–31470. [Google Scholar] [CrossRef] [PubMed] [Green Version]
  6. Veaudor, T.; Cassier-Chauvat, C.; Chauvat, F. Genomics of Urea Transport and Catabolism in Cyanobacteria: Biotechnological Implications. Front. Microbiol. 2019, 10, 1–14. [Google Scholar] [CrossRef] [Green Version]
  7. Rubio, L.M.; Herrero, A.; Flores, E. A cyanobacterial narB gene encodes a ferredoxin-dependent nitrate reductase. Plant Mol. Biol. 1996, 30, 845–850. [Google Scholar] [CrossRef] [PubMed]
  8. Flores, E.; Frías, J.E.; Rubio, L.M.; Herrero, A. Photosynthetic nitrate assimilation in cyanobacteria. Photosynth. Res. 2005, 83, 117–133. [Google Scholar] [CrossRef] [PubMed]
  9. Herrero, A.; Flores, E. Genetic responses to carbon and nitrogen availability in Anabaena. Environ. Microbiol. 2019, 21, 1–17. [Google Scholar] [CrossRef] [PubMed] [Green Version]
  10. Herrero, A.; Muro-Pastor, A.M.; Flores, E. Nitrogen control in cyanobacteria. J. Bacteriol. 2001, 183, 411–425. [Google Scholar] [CrossRef] [Green Version]
  11. Drath, M.; Kloft, N.; Batschauer, A.; Marin, K.; Novak, J.; Forchhammer, K. Ammonia triggers photodamage of photosystem II in the cyanobacterium Synechocystis sp. strain PCC 6803. Plant Physiol. 2008, 147, 206–215. [Google Scholar] [CrossRef] [Green Version]
  12. Rodrigues, M.S.; Ferreira, L.S.; Converti, A.; Sato, S.; Carvalho, J.C.M. Fed-batch cultivation of Arthrospira (Spirulina) platensis: Potassium nitrate and ammonium chloride as simultaneous nitrogen sources. Bioresour. Technol. 2010, 101, 4491–4498. [Google Scholar] [CrossRef]
  13. Moore, L.R.; Post, A.F.; Rocap, G.; Chisholm, S.W. Utilization of different nitrogen sources by the marine cyanobacteria Prochlorococcus and Synechococcus. Limnol. Oceanogr. 2002, 47, 989–996. [Google Scholar] [CrossRef]
  14. Reyes, J.C.; Muro-Pastor, M.I.; Florencio, F.J. Transcription of glutamine synthetase genes (glnA and glnN) from the cyanobacterium Synechocystis sp. strain PCC 6803 is differently regulated in response to nitrogen availability. J. Bacteriol. 1997, 179, 2678–2689. [Google Scholar] [CrossRef] [Green Version]
  15. Merida, A.; Candau, P.; Florencio, F.J. Regulation of glutamine synthetase activity in the unicellular cyanobacterium Synechocystis sp. strain PCC 6803 by the nitrogen source: Effect of ammonium. J. Bacteriol. 1991, 173, 4095–4100. [Google Scholar] [CrossRef] [Green Version]
  16. Deschoenmaeker, F.; Bayon-Vicente, G.; Sachdeva, N.; Depraetere, O.; Cabrera Pino, J.C.; Leroy, B.; Muylaert, K.; Wattiez, R. Impact of different nitrogen sources on the growth of Arthrospira sp. PCC 8005 under batch and continuous cultivation—A biochemical, transcriptomic and proteomic profile. Bioresour. Technol. 2017, 237, 78–88. [Google Scholar] [CrossRef]
  17. Krausfeldt, L.E.; Farmer, A.T.; Castro, H.F.; Boyer, G.L.; Campagna, S.R.; Wilhelm, S.W. Nitrogen flux into metabolites and microcystins changes in response to different nitrogen sources in Microcystis aeruginosa NIES-843. Environ. Microbiol. 2020, 22, 2419–2431. [Google Scholar] [CrossRef]
  18. Hasunuma, T.; Matsuda, M.; Kondo, A. Improved sugar-free succinate production by Synechocystis sp. PCC 6803 following identification of the limiting steps in glycogen catabolism. Metab. Eng. Commun. 2016, 3, 130–141. [Google Scholar] [CrossRef]
  19. Hasunuma, T.; Kikuyama, F.; Matsuda, M.; Aikawa, S.; Izumi, Y.; Kondo, A. Dynamic metabolic profiling of cyanobacterial glycogen biosynthesis under conditions of nitrate depletion. J. Exp. Bot. 2013, 64, 2943–2954. [Google Scholar] [CrossRef] [PubMed] [Green Version]
  20. Osanai, T.; Oikawa, A.; Shirai, T.; Kuwahara, A.; Iijima, H.; Tanaka, K.; Ikeuchi, M.; Kondo, A.; Saito, K.; Hirai, M.Y. Capillary electrophoresis-mass spectrometry reveals the distribution of carbon metabolites during nitrogen starvation in Synechocystis sp. PCC 6803. Environ. Microbiol. 2014, 16, 512–524. [Google Scholar] [CrossRef] [PubMed]
  21. Kinnel, R.B.; Esquenazi, E.; Leao, T.; Moss, N.; Mevers, E.; Pereira, A.R.; Monroe, E.A.; Korobeynikov, A.; Murray, T.F.; Sherman, D.; et al. A Maldiisotopic Approach to Discover Natural Products: Cryptomaldamide, a Hybrid Tripeptide from the Marine Cyanobacterium Moorea producens. J. Nat. Prod. 2017, 80, 1514–1521. [Google Scholar] [CrossRef] [PubMed] [Green Version]
  22. May, D.S.; Crnkovic, C.M.; Krunic, A.; Wilson, T.A.; Fuchs, J.R.; Orjala, J.E. 15N Stable Isotope Labeling and Comparative Metabolomics Facilitates Genome Mining in Cultured Cyanobacteria. ACS Chem. Biol. 2020, 15, 758–765. [Google Scholar] [CrossRef]
  23. Grant, B.R.; Turner, I.M. Light-stimulated nitrate and nitrite assimilation in several species of algae. Comp. Biochem. Physiol. 1969, 29, 995–1004. [Google Scholar] [CrossRef]
  24. Manzano, C.; Candau, P.; Gomez-Moreno, C.; Relimpio, A.M.; Losada, M. Ferredoxin-dependent photosynthetic reduction of nitrate and nitrite by particles of anacystis nidulans. Mol. Cell. Biochem. 1976, 10, 161–169. [Google Scholar] [CrossRef] [PubMed]
  25. Prakash, P.; Punekar, N.S.; Bhaumik, P. Structural basis for the catalytic mechanism and -ketoglutarate cooperativity of glutamate dehydrogenase. J. Biol. Chem. 2018, 293, 6241–6258. [Google Scholar] [CrossRef] [Green Version]
  26. Chávez, S.; Lucena, J.M.; Reyes, J.C.; Florencio, F.J.; Candau, P. The presence of glutamate dehydrogenase is a selective advantage for the cyanobacterium Synechocystis sp. strain PCC 6803 under nonexponential growth conditions. J. Bacteriol. 1999, 181, 808–813. [Google Scholar] [CrossRef] [Green Version]
  27. Helling, R.B. Pathway choice in glutamate synthesis in Escherichia coli. J. Bacteriol. 1998, 180, 4571–4575. [Google Scholar] [CrossRef] [PubMed] [Green Version]
  28. Takenaka, M.; Yoshida, T.; Hori, Y.; Bamba, T.; Mochizuki, M.; Vavricka, C.J.; Hattori, T.; Hayakawa, Y.; Hasunuma, T.; Kondo, A. An ion-pair free LC-MS/MS method for quantitative metabolite profiling of microbial bioproduction systems. Talanta 2021, 222, 121625. [Google Scholar] [CrossRef]
  29. Florencio, F.J.; Marqués, S.; Candau, P. Identification and characterization of a glutamate dehydrogenase in the unicellular cyanobacterium Synechocystis PCC 6803. FEBS Lett. 1987, 223, 37–41. [Google Scholar] [CrossRef] [Green Version]
Figure 1. Cell growth of Synechocystis and the residual nitrogen concentration under different types of nitrogen. The cell growth of Synechocystis cultivated in NaNO3 medium or NH4Cl medium under phototrophic conditions was compared. Blue lines, NaNO3 medium; red lines, NH4Cl medium; solid lines, the cellular biomass (dried cell weight); dotted lines, the residual nitrogen concentration in the medium. Error bars indicate the standard deviation of three replicate experiments. Statistical significance was determined using Welch’s t-test (* <0.05, ** <0.01).
Metabolites 11 00867 g001
Figure 2. Metabolic profiles (amino acids) of Synechocystis cultured with NaNO3 or NH4Cl. The abundance of amino acids when Synechocystis was cultivated in NaNO3 medium or NH4Cl medium were compared at each time point. Error bars indicate the standard deviation of three replicate experiments. Blue lines, cultivation in NaNO3 medium; red lines, cultivation in NH4Cl medium. 3PGA, 3-phosphoglycerate; Ac-CoA, acetyl-CoA; Ala, alanine; Arg, arginine; Asp, aspartate; Asn, asparagine; Cys, cysteine; Glu, glutamate; Gln, glutamine; His, histidine; Hse, homoserine; Ile, isoleucine; Leu, leucine; Met, methionine; PEP, phosphoenolpyruvate; Phe, phenylalanine; Pro, proline; Pyr, pyruvate; Ser, serine; Thr, threonine; Trp, tryptophan; Tyr, tyrosine; Val, valine.
Metabolites 11 00867 g002
Figure 3. Metabolic profiles (CBB cycle, glycolysis and TCA cycle) of Synechocystis cultured with NaNO3 or NH4Cl. The abundance of some metabolites in the CBB cycle, glycolysis, and TCA cycle were compared at each time point. Error bars indicate the standard deviation of three replicate experiments. Blue lines, cultivation with NaNO3; red lines, cultivation with NH4Cl. 2PGA, 2-phosphoglycerate; 2OG, 2-oxoglutarate; 3PGA, 3-phosphoglycerate; Ac-CoA, acetyl-Coenzyme A; Cit, Citrate; F6P, fructose 6-phosphate; FBP, fructose 1,6-phosphate; Fum, fumarate; GAP, glyceraldehyde 3-phosphate; Isocit, isocitrate; PEP, phosphoenolpyruvate; Pyr, pyruvate; R5P, ribose 5-phosphate; Ru5P, ribulose 5-phosphate; RuBP, ribulose 1,5-bisphosphate; S7P, sedoheptulose 7-phosphate; Suc, succinate.
Metabolites 11 00867 g003
Figure 4. Analysis of 15N turnover under different nitrogen conditions. Synechocystis was cultivated in Na15NO3 or 15NH4Cl media after cell inoculation. The 15N labeling rates of amino acids and their related metabolites were compared at each time point. Values represent the mean ± standard deviation of three independent experiments. Blue lines, cultivation with NaNO3; red lines, cultivation with NH4Cl. Red and blue characters indicate higher and lower amounts of metabolites when grown in NH4Cl. Statistical significance was determined using Welch’s t-test (* <0.05, ** <0.01). 3PGA, 3-phosphoglycerate; Ac-CoA, acetyl-coenzyme A; Ala, alanine; Arg, arginine; Asp, aspartate; Asn, asparagine; Cys, cysteine; Glu, glutamate; Gln, glutamine; His, histidine; Hse, homoserine; Ile, isoleucine; Leu, leucine; Met, methionine; PEP, phosphoenolpyruvate; Phe, phenylalanine; Pro, proline; Pyr, pyruvate; Ser, serine; Thr, threonine; Trp, tryptophan; Tyr, tyrosine; Val, valine.
Metabolites 11 00867 g004
Figure 5. 15N labelling rate and its position in Gln. The 15N labeling rate and its position in Gln (glutamine) were examined by LC-MS/MS. A and B indicate the number of the 15N-labelled NH2 group in glutamine and 15N-labelled rate in each 15N-labelled number of all Gln. (A), Cultivation in Na15NO3 medium; (B), Cultivation in 15NH4Cl medium. (C,D) indicate the position of the two NH2 groups in Gln when one of the two was labeled at M+1 in (AC), Cultivation in Na15NO3 medium; (D), Cultivation in 15NH4Cl medium. (E), the position number in Gln, as indicated in (C,D).
Metabolites 11 00867 g005
Figure 6. Catalytic activity of GS and GDH in whole cell lysates. The catalytic activity of GS and GDH in whole cell lysates of Synechocystis grown in different nitrogen sources was examined. Values represent the mean ± standard deviation of three independent experiments. (A), Reaction scheme for each enzyme. (B), GS activity when grown in NaNO3 or NH4Cl media. (C), GDH activity when grown in NaNO3 or NH4Cl media. GS, glutamine synthase; GDH, glutamate dehydrogenase. Statistical significance was determined using Welch’s t-test (** <0.01).
Metabolites 11 00867 g006
Figure 7. Reaction scheme with different nitrogen sources. The reaction scheme around the GS-GOGAT cycle and the GDH pathway was constructed based on the results obtained. The bold arrows, thin arrows, and dotted arrows indicate the enhanced, not changed, and weakened fluxes in each reaction. (A), the reaction scheme during the early log phase when Synechocystis was grown in Na15NO3 medium; (B), the reaction scheme during late log phase when Synechocystis was grown in Na15NO3 medium; (C), the reaction scheme when Synechocystis was grown in 15NH4Cl medium. The enlarged characters and molecular structure represent larger pool sizes of the molecule.
Metabolites 11 00867 g007
Publisher’s Note: MDPI stays neutral with regard to jurisdictional claims in published maps and institutional affiliations.

