Article

Effects of Spore-Displayed p75 Protein from Lacticaseibacillus rhamnosus GG on the Transcriptional Response of HT-29 Cells

Department of Food Science and Biotechnology, College of Life Science and Biotechnology, Dongguk University, Goyang-si 10326, Korea
*
Author to whom correspondence should be addressed.
Submission received: 30 May 2022 / Revised: 20 June 2022 / Accepted: 22 June 2022 / Published: 23 June 2022
(This article belongs to the Special Issue Probiotics and Their Metabolism)

Abstract

:
A Lacticaseibacillus rhamnosus GG-derived protein, p75, is one of the key molecules exhibiting probiotic activity. However, the molecular mechanism and transcriptional response of p75 in human intestinal epithelial cells are not completely understood. To gain a deeper understanding of its potential probiotic action, this study investigated genome-wide responses of HT-29 cells to stimulation by spore-displayed p75 (CotG-p75) through a transcriptome analysis based on RNA sequencing. Analysis of RNA-seq data showed significant changes of gene expression in HT-29 cells stimulated by CotG-p75 compared to the control. A total of 189 up-regulated and 314 down-regulated genes was found as differentially expressed genes. Gene ontology enrichment analysis revealed that a large number of activated genes was involved in biological processes, such as epithelial cell differentiation, development, and regulation of cell proliferation. A gene–gene interaction network analysis showed that several DEGs, including AREG, EREG, HBEGF, EPGN, FASLG, GLI2, CDKN1A, FOSL1, MYC, SERPINE1, TNFSF10, BCL6, FLG, IVL, SPRR1A, SPRR1B, SPRR3, and MUC5AC, might play a critical role in these biological processes. RNA-seq results for selected genes were verified by reverse transcription-quantitative polymerase chain reaction. Overall, these results provide extensive knowledge about the transcriptional responses of HT-29 cells to stimulation by CotG-p75. This study showed that CotG-p75 can contribute to cell survival and epithelial development in human intestinal epithelial cells.

1. Introduction

Probiotics are live microorganisms that can confer several health benefits on the host when administered in appropriate amounts [1]. Several studies have demonstrated that probiotics can promote host health by maintaining intestinal epithelial homeostasis and improving barrier integrity [2]. However, they have some limitations, such as unknown molecular mechanism, strain-specificity, low survival rate, and risks of bacterial infection [3]. Postbiotics are proposed as promising alternatives to overcome these limitations. They are a complex mixture of metabolic products secreted by probiotics, such as soluble proteins, which can enhance the survival and proliferation of intestinal epithelial cells (IECs) [4,5,6,7]. Soluble proteins have several advantages over traditional probiotics, such as known molecular structure, use in pure forms, the specific mechanism of action, and ease of production and storage [3]. They could address concerns associated with the use of “live” probiotics [8]. Further, investigating soluble proteins is crucial for elucidating the mechanisms of probiotics that have not yet been clarified [9,10].
p40 and p75 are major secreted proteins produced by Lacticaseibacillus rhamnosus GG (LGG), which is the best-studied probiotic bacterium [11,12]. They were found in numerous Lacticaseibacillus species, such as L. casei, L. paracasei, and L. rhamnosus [13,14]. p40 and p75 in L. casei BL23 are located at the bacterial cell surface (predominantly at the septum and polar regions) and secreted to the growth medium [13,14]. They are involved in septation and separation of daughter cells [13,14]. Recombinant p40 and p75 proteins bound to mucin, collagen, and intestinal epithelial cells [13]. They stimulated epidermal growth factor receptor (EGFR) phosphorylation in the ex vivo mouse colon organ [13]. They can prevent cytokine-induced apoptosis and promote intestinal epithelial cell homeostasis by stimulating Akt activation in mouse and human intestinal epithelial cells [11,12]. Furthermore, they can attenuate the disruption of epithelial barrier function induced by hydrogen peroxide through protein kinase C (PKC)- and mitogen-activated protein kinase-dependent mechanisms [15]. For p40, its mechanism and regulation of gene expression have been extensively investigated in epithelial intestinal cells and animal models. p40 promotes IgA production via upregulation of a proliferation-inducing ligand (APRIL) and stimulates mucin gene expression and production in LS174T cells and the mouse colonic epithelium [16]. p40 has beneficial effects on prevention or treatment of dextran sulfate sodium (DSS)-induced intestinal epithelial injury and acute colitis and oxazolone-induced T-helper (Th)2 cytokine-driven and 2,4,6-trinitrobenzene sulfonic acid (TNBS)-induced Th1 cytokine-driven chronic colitis in mice [6]. However, the mechanism and transcriptional response of human intestinal epithelial cells to the stimulation by p75 have not been studied. Therefore, studies on p75 may uncover novel probiotic actions not identified in many probiotic strains.
Spore surface display technology is an economical and efficient approach for expressing heterologous proteins on the spore surface [17]. Bacillus spores are ideal carriers for oral administration due to their unique properties. Bacillus spores have a rigid structure encased in a thick peptidoglycan layer and numerous coat proteins [18]. They can germinate, outgrow, replicate, and re-sporulate in the gastrointestinal (GI) tract [19]. These characteristics help them survive under the harsh environmental conditions of the GI tract [20]. Bacillus subtilis spores are used in human and animal food preparations as food additives and prescription or non-prescription products to treat GI disorders [21,22]. Furthermore, the spore formation and purification process are simple and economical [23]. The protein displayed on the spore can be easily purified via simple centrifugation with a high recovery rate [24]. It can display multiple foreign proteins on a single spore. Approximately 103 molecules can be displayed when CotG is used as an anchor protein [25,26]. Although clinical trials in humans have not yet been conducted, this technology has been widely applied for development of oral vaccines and peptides, and its efficacy has been proven in animal models [27,28,29,30].
In a previous study, we have displayed p75 on the spore surface of B. subtilis using spore coat protein G (CotG) as an anchor [31]. Evaluating the effects of spore-displayed p75 (CotG-p75), identification of its probiotic action in human intestinal epithelial cells is essential. Furthermore, transcriptional analysis of CotG-p75 may provide clues to elucidate the mechanism involved in the effect of p75 or LGG on human intestinal epithelial cells. Therefore, the aim of this study was to determine the probiotic ability of CotG-p75 in human intestinal epithelial cell line HT-29 through transcriptional analysis using RNA sequencing (RNA-seq). Biological processes and genes involved in important properties of probiotics, such as cell proliferation and cell development, were then characterized through functional analyses of differentially expressed genes (DEGs) and gene ontology (GO) enrichment. Herein, the comprehensive results of gene expression and GO enrichment analyses help to elucidate the potential probiotic action of CotG-p75 in human intestinal epithelial cells.

2. Materials and Methods

2.1. Spore Preparation

Recombinant B. subtilis 168 spores containing pUB19-cotG-p75 were constructed and prepared according to the protocol mentioned in our previous study [31]. Briefly, sporulation of B. subtilis 168 wild-type spores and recombinant spores (CotG-p75) was induced with Difco sporulation medium (DSM). After incubation at 37 °C for 62 h, spores were harvested and resuspended in 50 mM sodium phosphate buffer (pH 7.2). Thereafter, spores were treated with lysozyme for 1 h at 4 °C to destroy remaining vegetative cells and then washed 5 times with 50 mM sodium phosphate buffer to remove any residual lysozyme. After centrifugation for 10 min at 4 °C and 5000 rpm, collected spores were resuspended in 1–2 mL of phosphate-buffered saline (PBS). Final spore suspensions were titrated on LB agar to determine spores/mL and adjusted to 108 spores/mL.

2.2. Cell Culture and Treatment

Human intestinal epithelial cell line HT-29 was purchased from the American Type Culture Collection (ATCC). These cells were cultured in Dulbecco’s modified Eagle’s medium (DMEM) supplemented with 10% (v/v) fetal bovine serum (FBS) and 1% (v/v) penicillin–streptomycin and maintained at a 37 °C in a humidified atmosphere of 95% air and 5% CO2. The culture medium was changed 2–3 day. For experiments, HT-29 cells were seeded into 12-well plates at a density of 5 × 10⁵ cells per well. When cells reached 90% confluence, the medium was replaced with 900 μL of serum-free medium. These cells were then treated with 100 μL of 1 × 10⁸ spores/mL of wild-type spores or CotG-p75 and incubated for 3 h. Cells treated with PBS instead of spores were used as controls. After treatment, cells were harvested for subsequent experiments.

2.3. Cell Viability Assay

The effect of CotG-p75 on the cell viability of HT-29 cells was determined using a D-Plus CCK Cell Viability Assay Kit (DonginLS, Seoul, Korea) according to the manufacturer’s instructions. Briefly, the cells were seeded at 5 × 10⁴ cells/well in 100 μL of cDMEM in 96 well plates. When HT-29 cells were grown to 70–80% confluency, CotG-p75 was added to final concentrations of 105–107 spores/mL. After 24 h cultivation, the used medium was removed, and a serum-free medium was added. Then, 10 μL of CCK reagent was added per well, and the cells were incubated for 4 h. The optical density was measured at 450 nm using an automated ELISA reader (Thermo Scientific, Waltham, MA, USA). The percentage of living cells was calculated as previously described [32]. The results are presented in Figure S1.

2.4. Total RNA Isolation, cDNA Library Construction, and RNA-Sequencing

Total RNAs were extracted from HT-29 cells treated or untreated with spores using TRIzol reagent (Invitrogen, Waltham, MA, USA) following the manufacturer’s protocol. Total RNAs from each sample were isolated in triplicate independently. Isolated total RNA was treated with RNase-free DNaseI to remove potential genomic DNA contaminants. The concentration and quality of total RNA were then determined with a Nanodrop 2000 spectrophotometer (Thermo Fisher Scientific, Waltham, MA, USA). Final total RNA was used for RNA-seq and RT-qPCR.
Sequencing libraries were generated with a TruSeq Stranded mRNA LT Sample Prep Kit (Illumina, San Diego, CA, USA) in accordance with the TruSeq Stranded mRNA Sample Preparation Guide (part # 15031047 Rev. E). Briefly, mRNA was purified from 1 μg of total RNA with poly-T oligo-attached magnetic beads and fragmented into small pieces. These mRNA fragments were transcribed into first-strand complementary DNAs (cDNAs) using reverse transcriptase and random primers, followed by second-strand cDNA synthesis. After purification of double-stranded cDNA, 3′ end adenylation and adapter ligation were performed subsequently. To generate the final cDNA library, products were amplified with PCR, size selected, and purified.
Library preparations and sequencing were carried out by a Macrogen sequencing service (Macrogen Inc., Seoul, Korea). Sequencing was performed on an Illumina NovaSeq 6000 system using a NovaSeq 6000 S4 reagent kit (Illumina, San Diego, CA, USA). Sequencing quality control (QC) was performed using FastQC v 0.11.7 (http://www.bioinformatics.babraham.ac.uk/projects/fastqc/ accessed on 16 February 2022). Trimmomatic 0.38 was used to eliminate 3′ end adaptors and low-quality bases [33]. After trimming, cleaned reads were aligned to the human reference genome (hg19) from the University of California Santa Cruz (UCSC) genome browser using HISAT2 version 2.1.0 software. The sequence data from this study have been deposited into the Sequence Read Archive (http://0-www-ncbi-nlm-nih-gov.brum.beds.ac.uk/sra accessed on 26 May 2022) under accession number PRJNA792019.

2.5. Identification of Differentially Expressed Genes

The mapped reads of each sample were assembled using StringTie (http://0-ccb-Jhu-edu.brum.beds.ac.uk/software/stringtie/ accessed on 2 March 2022). After the final transcriptome was generated, StringTie and edgeR (http://bioconductor.org/packages/release/bioc/html/edgeR.html accessed on 2 March 2022) were used to estimate the expression levels of all the transcripts. StringTie was used to examine the expression levels by calculating the FPKM (fragments per kilobase of transcripts per million mapped reads). Genes were considered to be differentially expressed between different samples if they met the following criteria: (1) absolute value of fold change (FC) ≥ 2; and (2) raw p-value < 0.05. DEGs were investigated for two comparison groups: wild-type treated cells (WT) vs. control (CON) and CotG-p75 (G75) treated cells vs. control (CON).

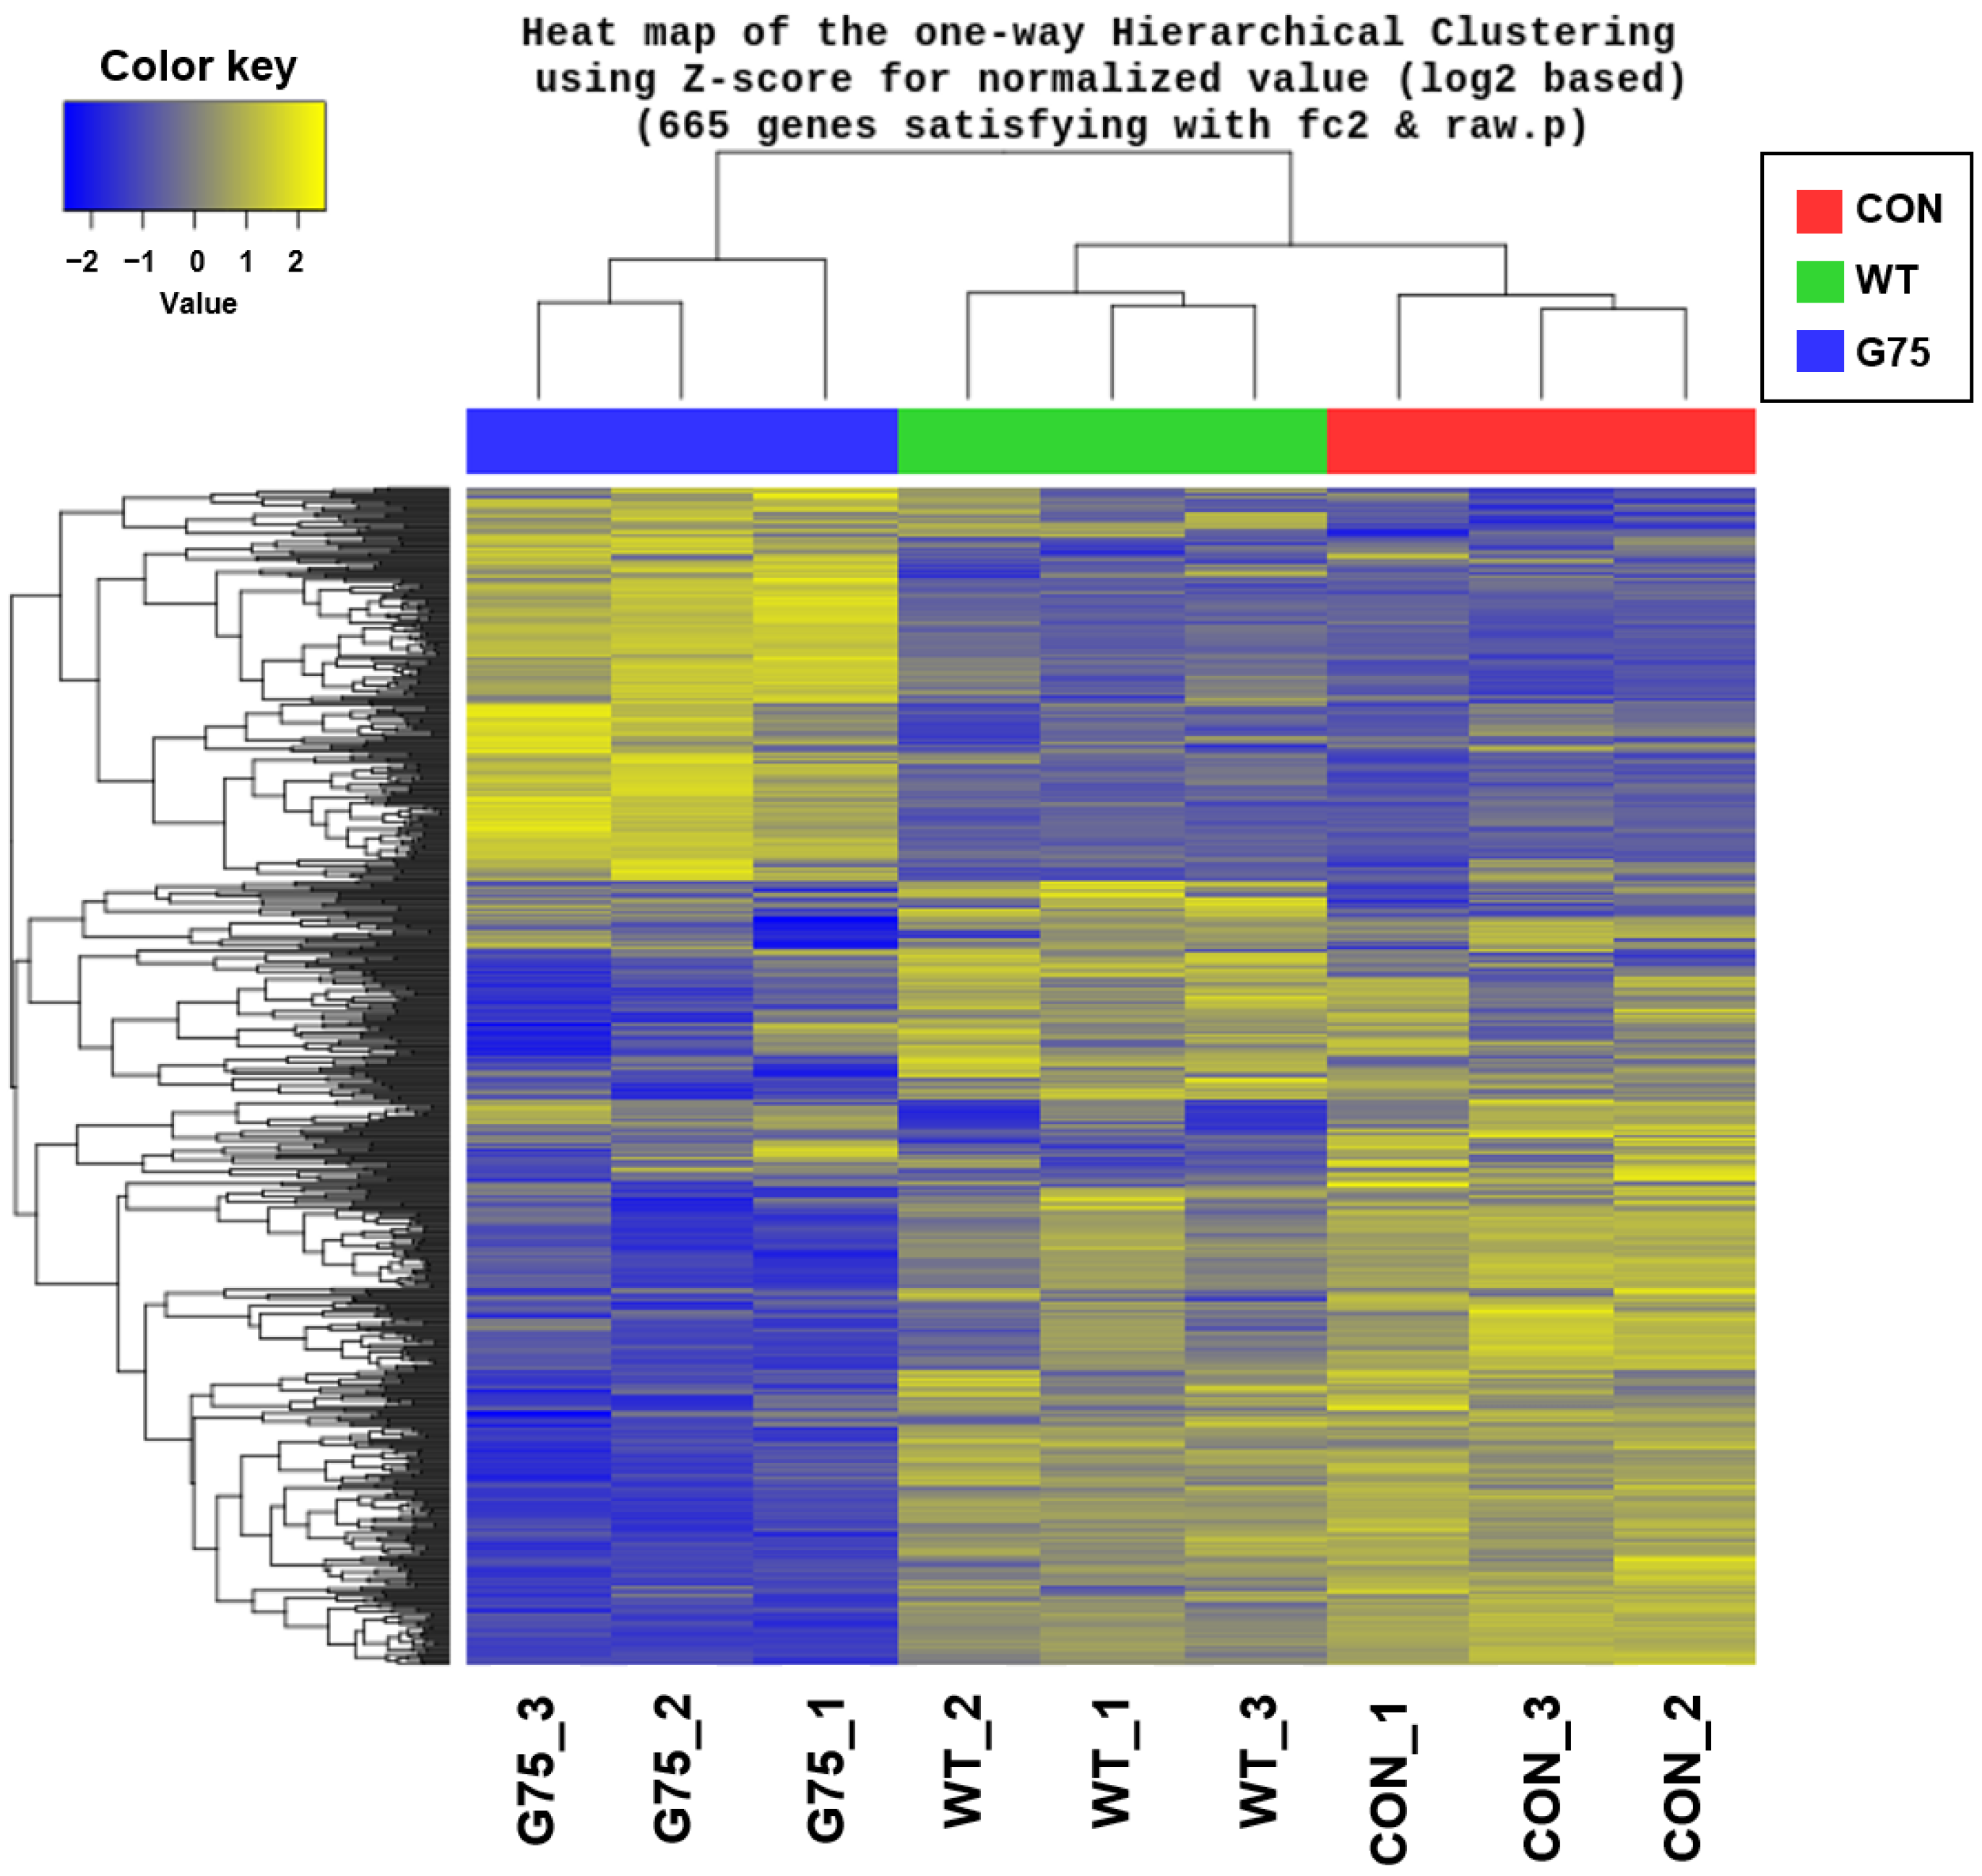
2.6. Hierarchical Clustering

Hierarchical clustering was performed in R Bioconductor using the heatmap.2 function of the gplots package (http://cran.r-project.org/web/packages/gplots/index.html accessed on 14 March 2022). A heatmap was generated by clustering of the 665 genes satisfying the absolute value of FC ≥ 2 and raw p-value < 0.05 expressed in all treatment conditions. Calculation of the Z-score was determined as follows: Z = (X−μ)/s, where X is the normalized read counts of a gene for a specific treatment condition, μ is the row mean normalized read counts of a gene across all treatment conditions, and s is the row standard deviation of a gene across all treatment conditions.

2.7. Gene Ontology (GO) Enrichment Analysis and Gene–Gene Interaction Network Analysis

To characterize DEGs based on specific biological functions, GO enrichment analysis was carried out using an annotation tool (DAVID; https://david.ncifcrf.gov accessed on 18 March 2022) and visualized with Cytoscape BiNGO (Version 3.2.1) [34]. A hypergeometric test was used as a statistical test. Then, Benjamini and Hochberg false discovery rate (FDR) correction was used for multiple testing correction. GO terms with FDR < 0.05 were considered enriched significantly. The gene–gene network for DEGs was constructed using STRING search tool (https://string-db.org/ accessed on 1 April 2022) with a minimum required interaction score set at >0.4 [35,36].

2.8. Reverse Transcription-Quantitative Polymerase Chain Reaction (RT-qPCR) Confirmation

A total of 18 genes related to cell survival and epithelial development (AREG, EREG, HBEGF, EPGN, FASLG, GLI2, CDKN1A, FOSL1, MYC, SERPINE1, TNFSF10, BCL6, FLG, IVL, SPRR1A, SPRR1B, SPRR3, and MUC5AC) were selected and validated by RT-qPCR. Total RNAs (2 μg) were transcribed to cDNAs using random hexamer (Roche, Basel, Switzerland) and M-MLV reverse transcriptase (Promega, Madison, WI, USA) according to the manufacturer’s protocols. RT-qPCR was carried out under the condition at 95 °C for 10 s, followed by 40 cycles of 95 °C for 5 s and 60 °C for 30 s using a SYBR-Green PCR Master Mix kit (Takara, Shiga, Japan) on a CFX Connect Real-Time System (Bio-Rad, Hercules, CA, USA). Gene-specific primer sets for these selected genes were obtained from OriGene technologies (Rockville, MD, USA). They are listed in Table S1. RT-qPCR analysis was performed in triplicate independently. Target genes were normalized against GAPDH gene as a reference. Relative expression levels of targeted genes were calculated with the 2−ΔΔCt method [37].

2.9. HBEGF and MUC5AC Protein Expression Verification

The level of HBEGF and MUC5AC protein was measured using an HBEGF ELISA kit (Assay Genie, Dublin, Ireland) and MUC5AC ELISA assay kit (Cusabio Biotech, Houston, TX, USA) following the manufacturer’s protocol. HT-29 cells were stimulated by CotG-p75 (107 spores/mL) for 0, 3, 6, and 12 h. The cells treated with no spores or wild-type spores were used as controls. The amount of HBEGF and MUC5AC protein in cell lysates and culture supernatants was normalized to total protein in cell lysates and culture supernatants. The amount of total protein was determined using the BCA protein assay (Pierce, Thermo Scientific, Waltham, MA, USA). The results were expressed as relative expression by normalizing protein expression levels for CotG-p75-treated conditions versus control at all time courses.

2.10. Statistical Analysis

All experiments were performed independently in biological triplicates. For RNA-seq data, all reads obtained from libraries were normalized to FPKM. A raw p-value < 0.05 and FDR < 0.05 were considered statistically significant in DEG analysis and GO enrichment analysis, respectively.
For RT-qPCR analysis, data were expressed as mean ± standard deviation (SD). Statistical analysis was carried out by a one-way ANOVA and Tukey–Kramer post hoc analysis using GraphPad Prism 5.0 software (GraphPad, San Diego, CA, USA). A p-value < 0.05 indicated a statistically significant difference.

3. Results

3.1. Summary of Transcriptome Sequencing Data

To evaluate the effects of CotG-p75 on human intestinal epithelial cells, transcriptome responses of HT-29 cells to stimulation with wild-type spores or CotG-p75 for 3 h were analyzed through RNA-seq. Prior to in-depth functional analysis, the quality of RNA-seq data was confirmed to remove technical biases in the experiment. The average ratio of clean reads was greater than 95%, and the quality score of all bases was more than 30 in all samples. The GC content of all samples was also very similar to the ideal GC distribution. In addition, the mapping rate was above 95% for all samples, demonstrating the sequencing accuracy. Based on the quality analysis results of RNA-seq data, the sequencing quality was sufficient for the following research. The quality control results for all samples are provided in Table S2.

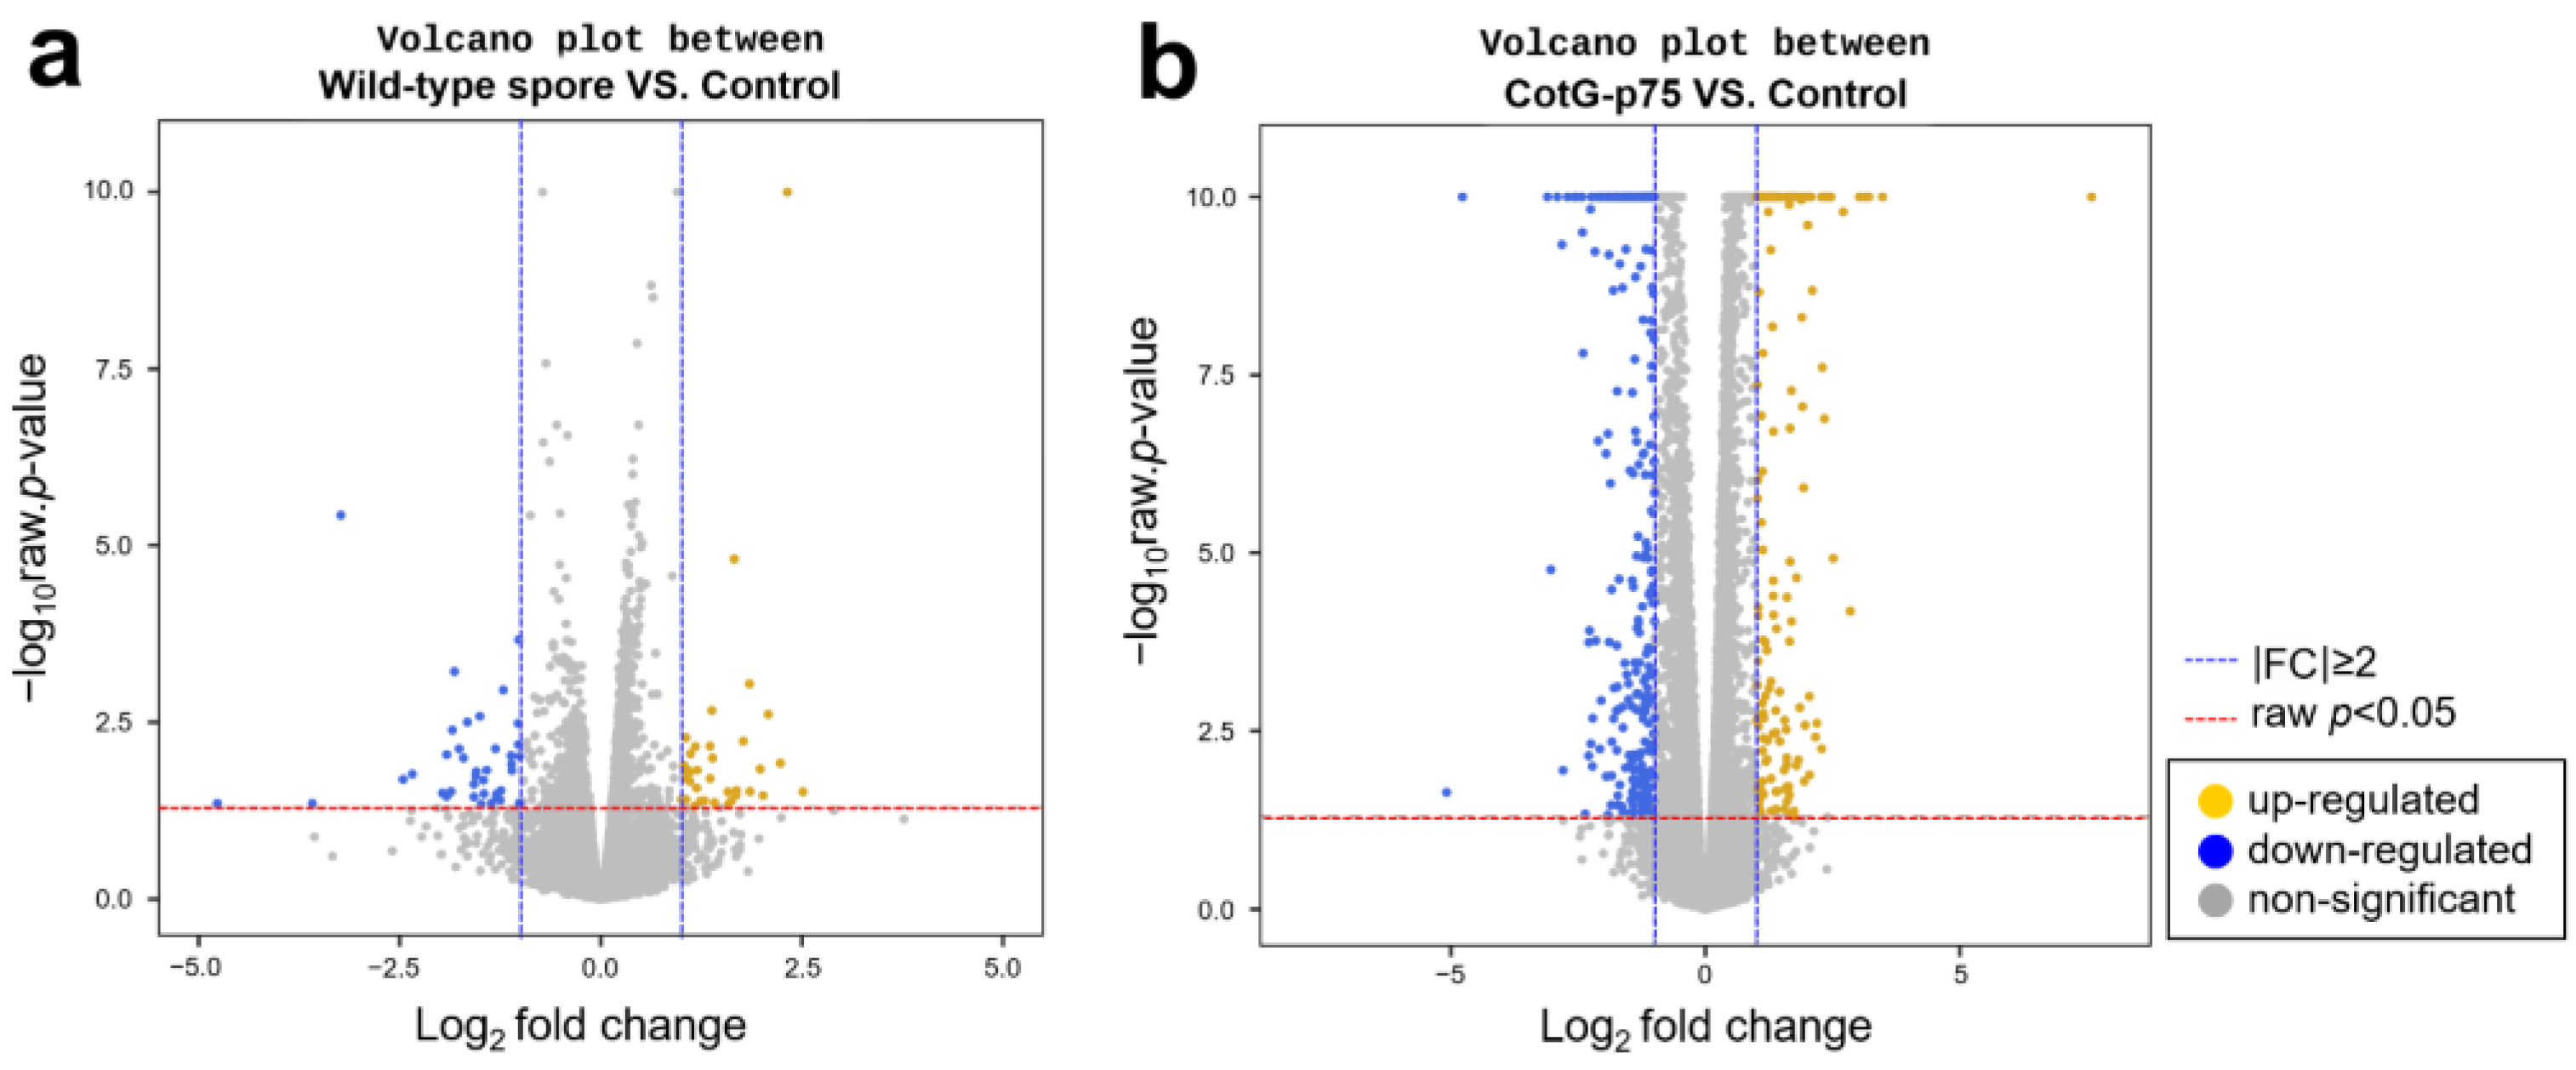
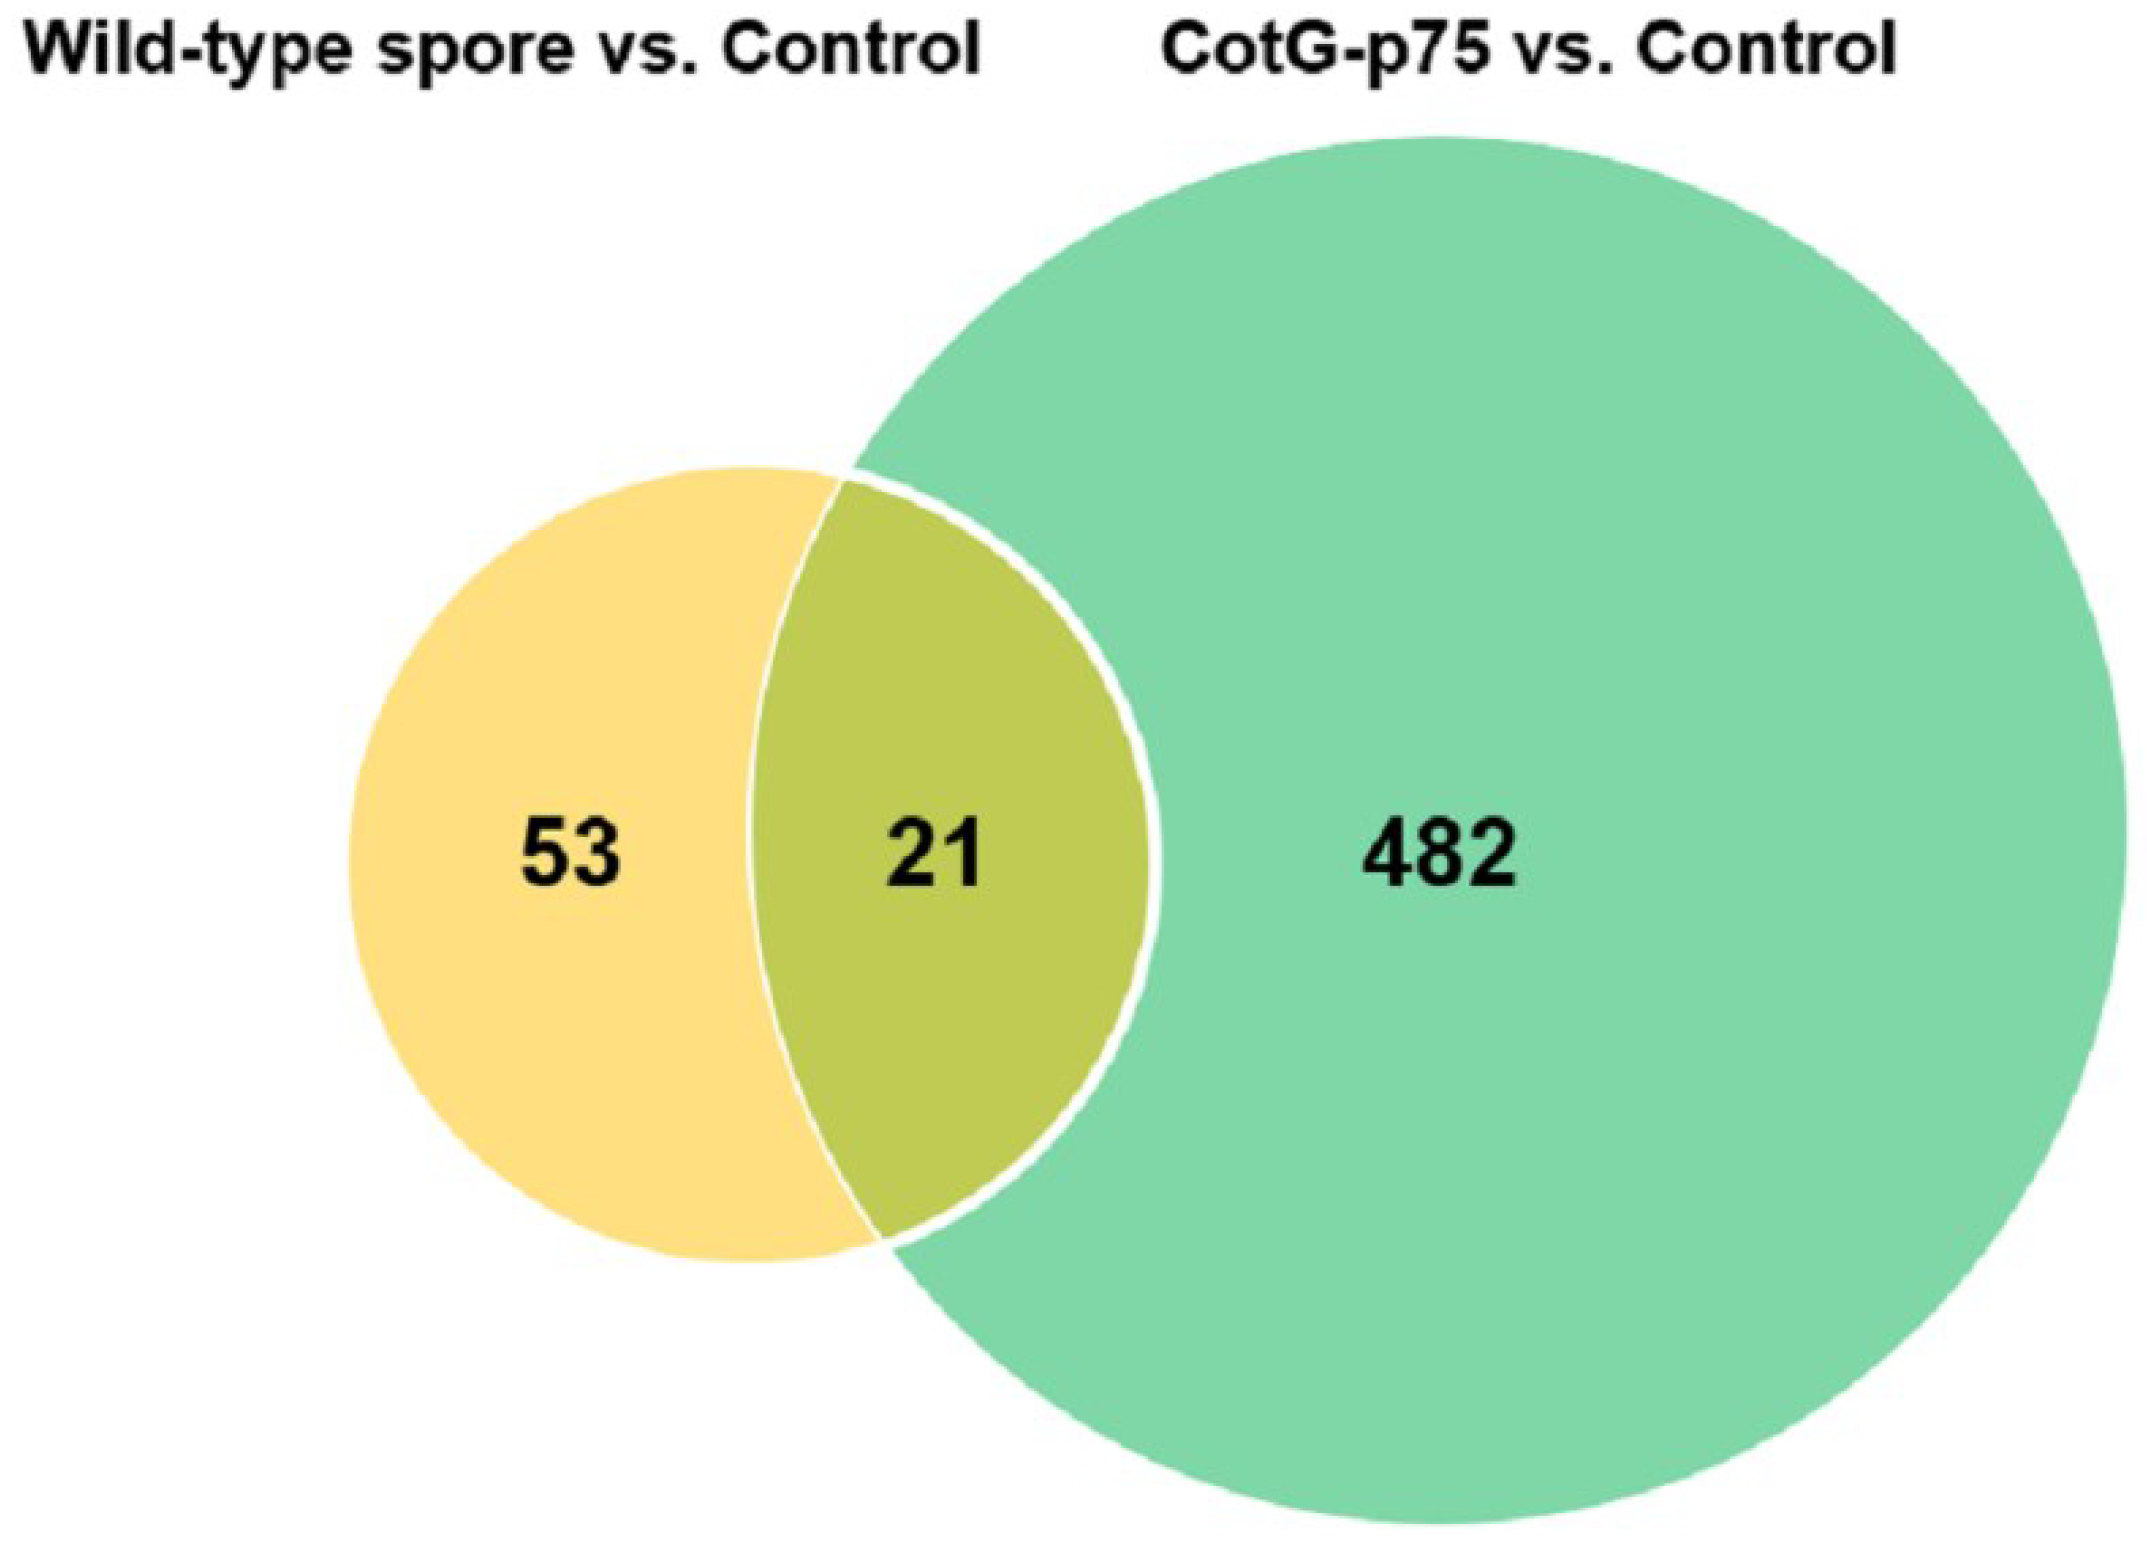
3.2. Differential Gene Expression in HT-29 Cells Stimulated with CotG-p75

To identify changes in gene expression that might be related to the probiotic action in human intestinal epithelial cells, DEGs were monitored by RNA-seq. After stimulating HT-29 cells with wild-type spore or CotG-p75 for 3 h, gene expression profiles were compared to those of the control. Genes satisfying the absolute value of FC ≥ 2 and raw p-value < 0.05 were considered to be statistically significant. The volcano plot in Figure 1 shows DEGs for two comparison groups: wild-type spore-stimulated cells vs. control cells (Figure 1a) and CotG-p75-stimulated cells vs. control cells (Figure 1b). Yellow and blue dots indicate significantly up- and down-regulated DEGs, respectively. A total of 74 (35 up-regulated and 39 down-regulated) and 503 (189 up-regulated and 314 down-regulated) DEGs was found in cells stimulated by wild-type spores and CotG-p75, respectively.
A Venn diagram showed shared DEGs between wild-type spore-treated cells and CotG-p75-treated cells. As shown in Figure 2, wild-type spores and CotG-p75 affected the expression levels of 74 and 503 genes, respectively. Of these genes, 21 were commonly affect by both wild-type spores and CotG-p75. This result shows that gene expression in HT-29 cells is affected more by CotG-p75 than by wild-type spores. Furthermore, hierarchical clustering was carried out to compare gene expression patterns among control, wild-type spore-treated, and CotG-p75-treated cells. The results were visualized as a heat-map (Figure 3). The heatmap showed a distinct difference in gene expression patterns between CotG-p75-treated cells and untreated control cells. The overall gene expression profile of HT-29 cells stimulated with CotG-p75 was significantly different from that of wild-type spore-treated cells or control cells. This indicated that CotG-p75 mediated transcriptome alterations in HT-29 cells. DEG analysis results for all investigated comparison groups, namely, wild-type spore treated cells vs. control, CotG-p75 treated cells vs. control, and CotG-p75 treated cells vs. wild-type spore treated cells, are provided in Tables S3–S5, respectively.

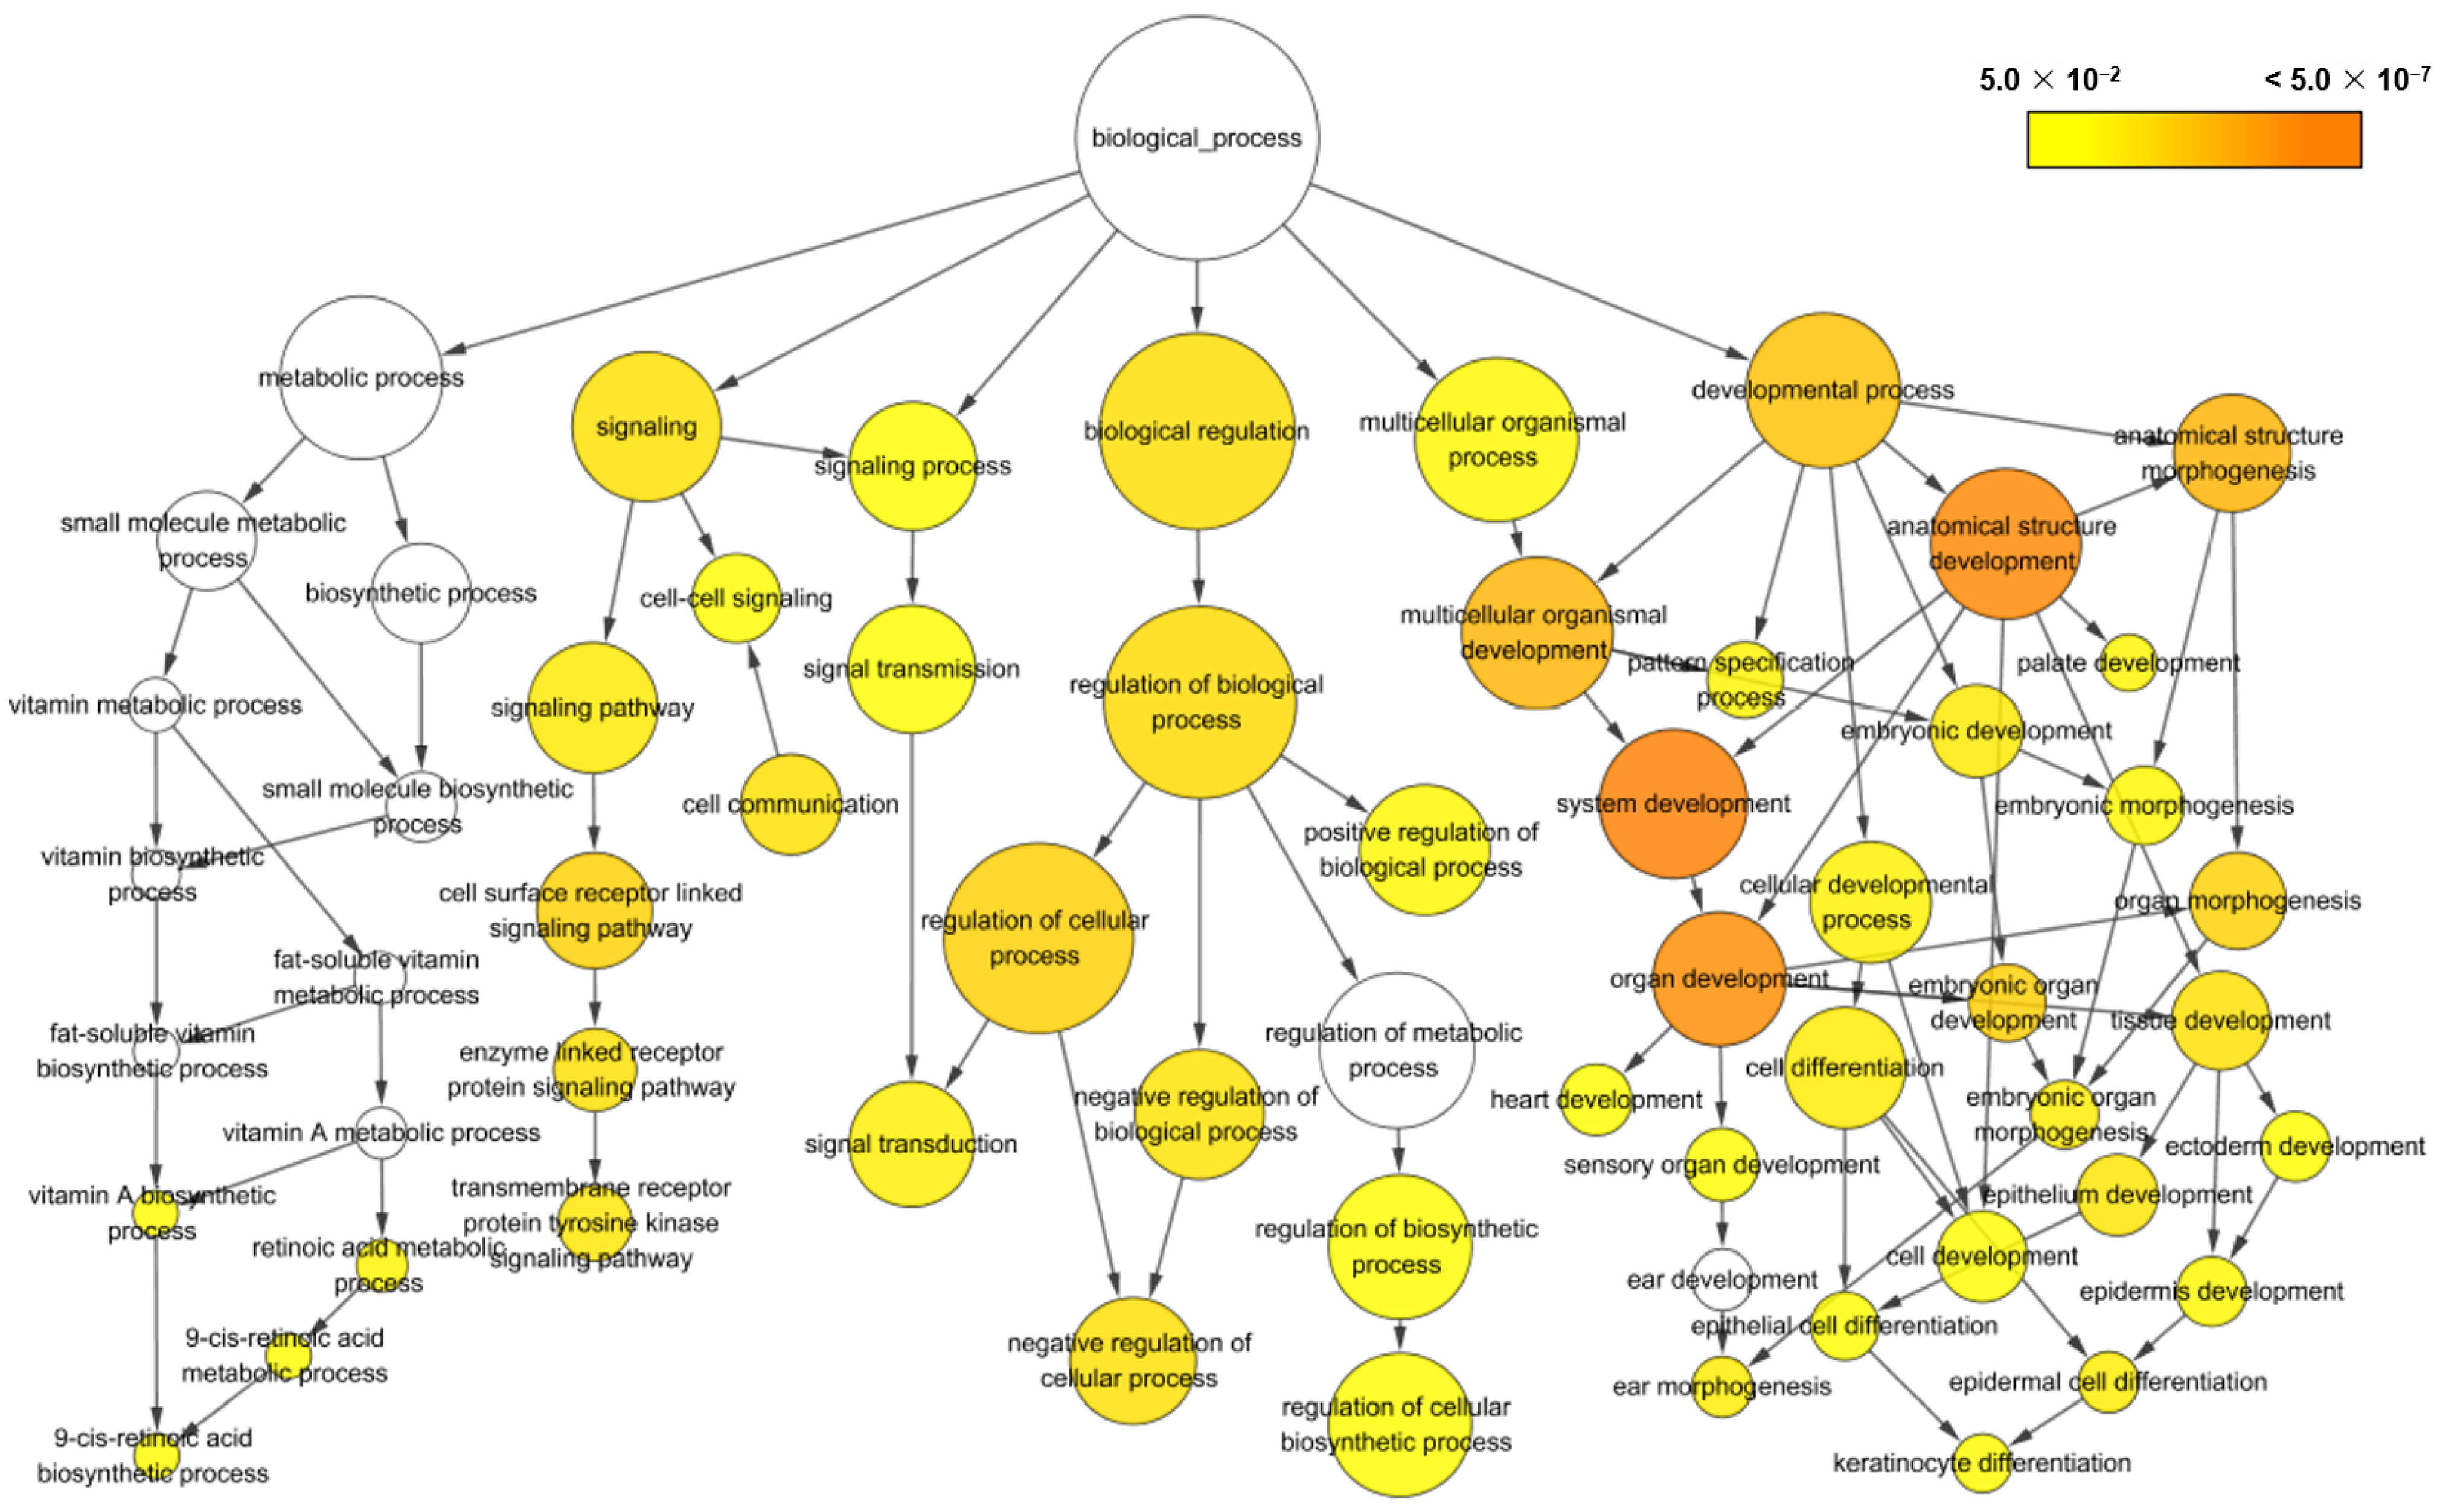
3.3. Gene Ontology (GO) Enrichment Analysis

To investigate the biological functions of genes in HT-29 cells affected by wild-type spores and CotG-p75, a GO enrichment analysis of the filtered DEGs was conducted using the Cytoscape BiNGO annotation tool. GO terms with FDR < 0.05 were considered enriched significantly. Analysis of all 503 DEGs found in CotG-p75-stimulated cells revealed 135 significantly enriched GO terms, which were separated into the main categories: biological process (124), molecular function (9), and cellular component (2). Among them, the 27 GO terms satisfying an FDR ≤ 0.01 are presented in Table 1. The relationship among GO terms as a network is shown in Figure 4. The DEGs enriched in biological process ontology were mainly related to the developmental process (GO:0032502), multicellular organismal process (GO:0032501), biological regulation (GO:0065007), signaling (GO:0023052), signaling process (GO:0023046), and the metabolic process (GO:0008152). Most DEGs were involved in the developmental process and associated with cell development and differentiation in the multicellular organismal process. In addition, CotG-p75 influenced signaling processes, including signal transduction and signal pathways. Some DEGs also participated in the vitamin A biosynthetic processes and the retinoic acid metabolic process. However, we could find only a few minor enriched GO terms in the wild-type spore-treated group (Figure S2). Our results suggested that treatment with CotG-p75 mainly affects biological processes of HT-29 cells, especially cell development, cell differentiation, and cell survival. GO enrichment analysis results for all GO terms and related genes are provided in Table S6 for wild-type-stimulated cells and Table S7 for CotG-p75 stimulated cells.

3.4. Identification of DEGs Related to Cell Survival and Development

The GO enrichment analysis revealed that most DEGs were related to cell survival and cell development in HT-29 cells. As cell proliferation and development are important factors of probiotic action, we focused on DEGs associated with these properties. These DEGs were clustered into two major categories: “epithelial cell differentiation and development” (16 genes), and “cell proliferation” (20 genes). The genes included in these categories are listed in Table 2, and their interactions are presented in Figure 5. Specifically, epithelial barrier- and tissue remodeling-related genes, such as FLG, IVL, SPPR1A, SPPR1B, and SPRR3, were up-regulated and involved in epithelial cell differentiation and development processes. Moreover, genes associated with cell survival and proliferation were up-regulated, such as MYC, EREG, FASLG, GLI2, EPGN, FOSL1, and SERPINE1. On the contrary, pro-apoptotic genes, such as BCL6, TNFSF10, and BTG2, were down-regulated. Among these genes, seven major genes (FASLG, CDKN1A, CSF2, SERPINE1, EREG, CXCL8, and MYC) showed the highest connectivity in the network. Thus, they might play a pivotal role in cell survival and development.

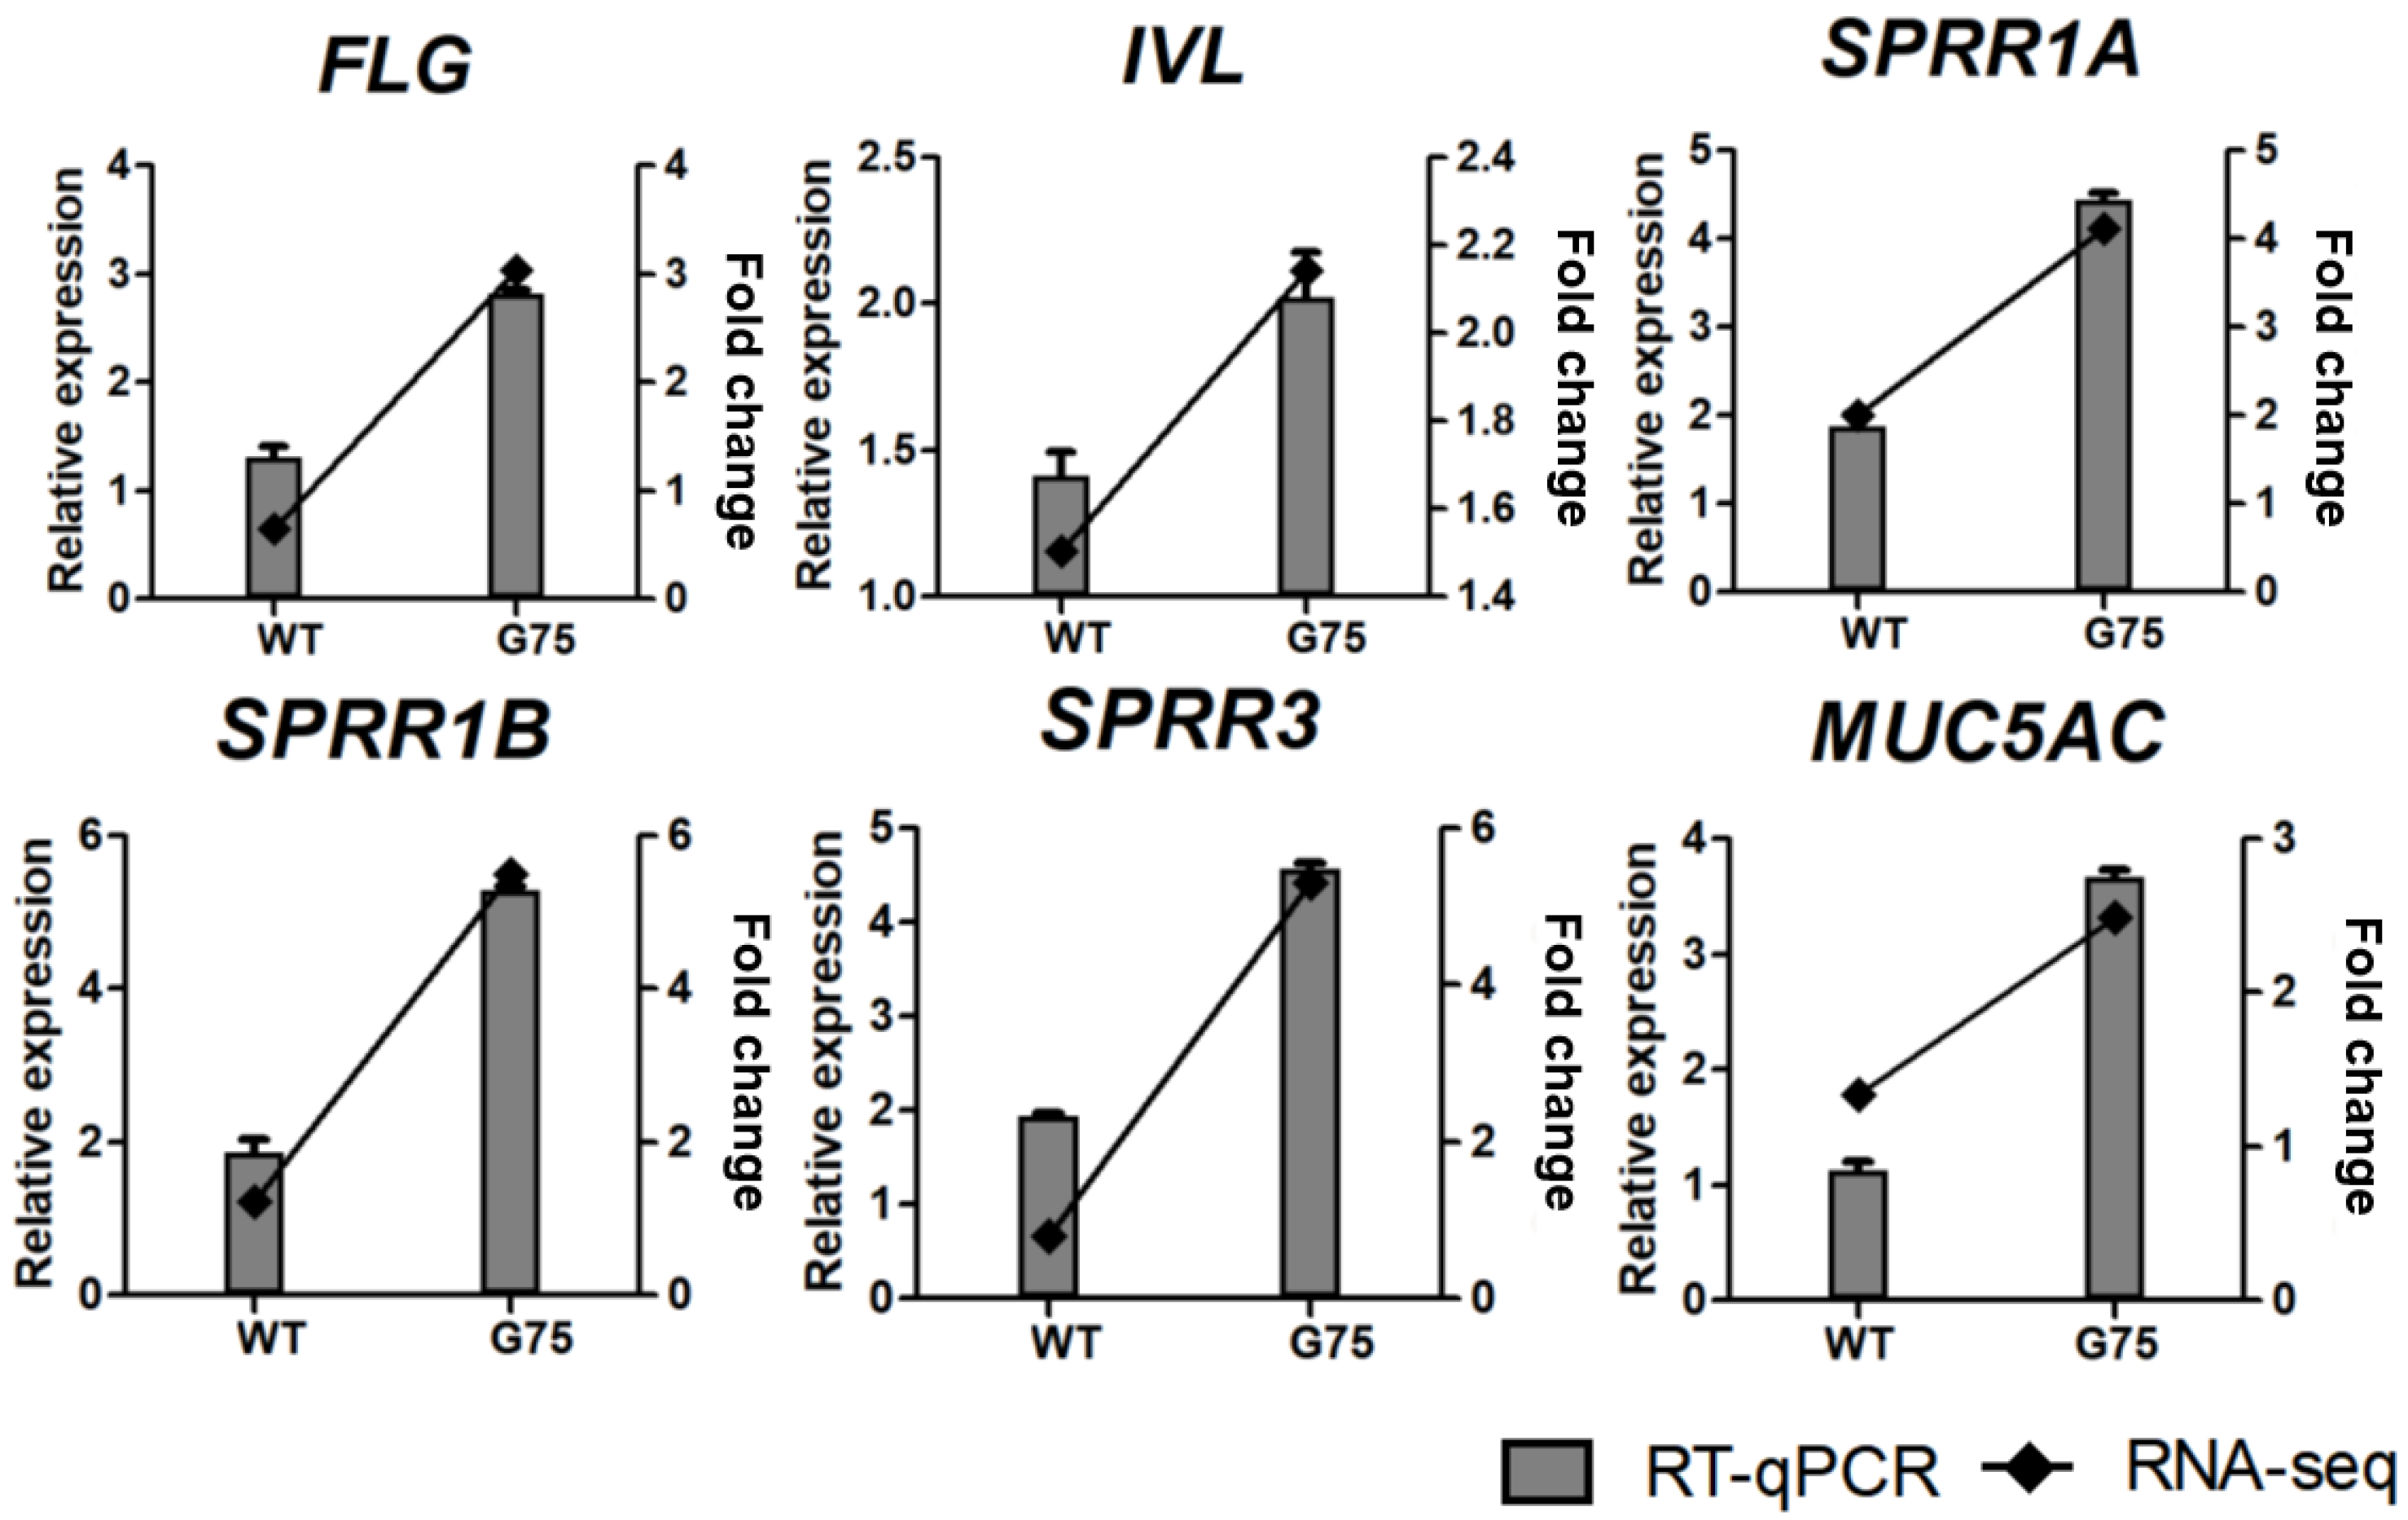
3.5. Validation of RNA-seq Data by RT-qPCR

To validate the results of DEGs identified by RNA-seq, we performed RT-qPCR for 18 selected genes, including 12 genes related to cell survival and proliferation (AREG, EREG, HBEGF, EPGN, FASLG, GLI2, CDKN1A, FOSL1, MYC, SERPINE1, TNFSF10, and BCL6) and 6 genes related to epithelial development and differentiation (FLG, IVL, SPRR1A, SPRR1B, SPRR3, and MUC5AC). RT-qPCR analysis showed that the tendency of DEG expression was consistent with the RNA-seq results (Figure 6 and Figure 7). The mRNA levels of selected genes were dose-dependently increased or decreased by CotG-p75 (Figures S3 and S4). Therefore, the accuracy and reliability of the RNA-seq data were confirmed by RT-qPCR.

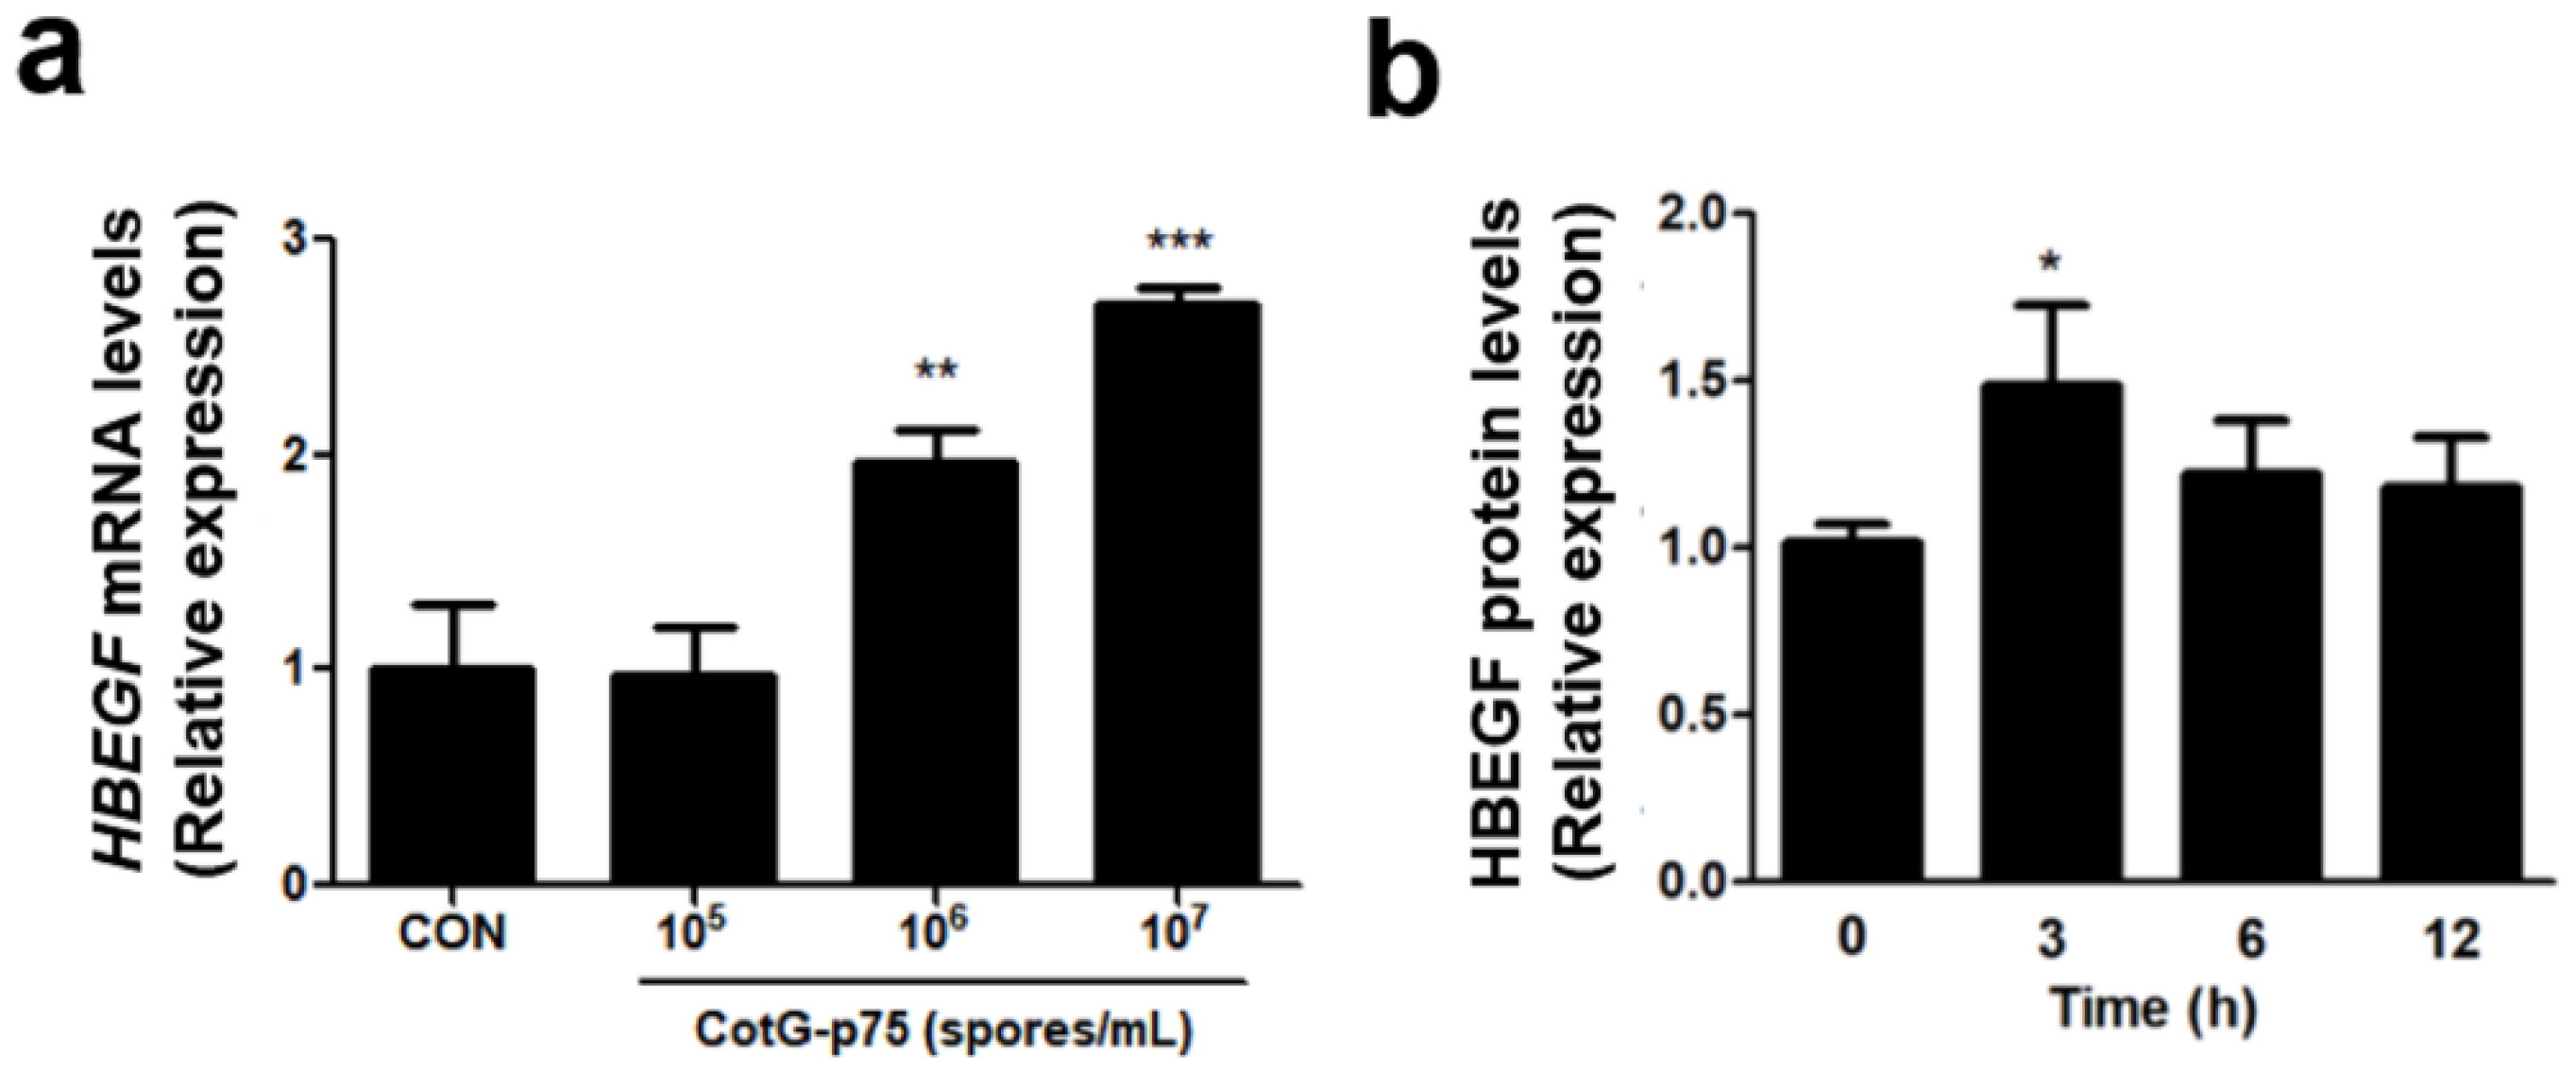
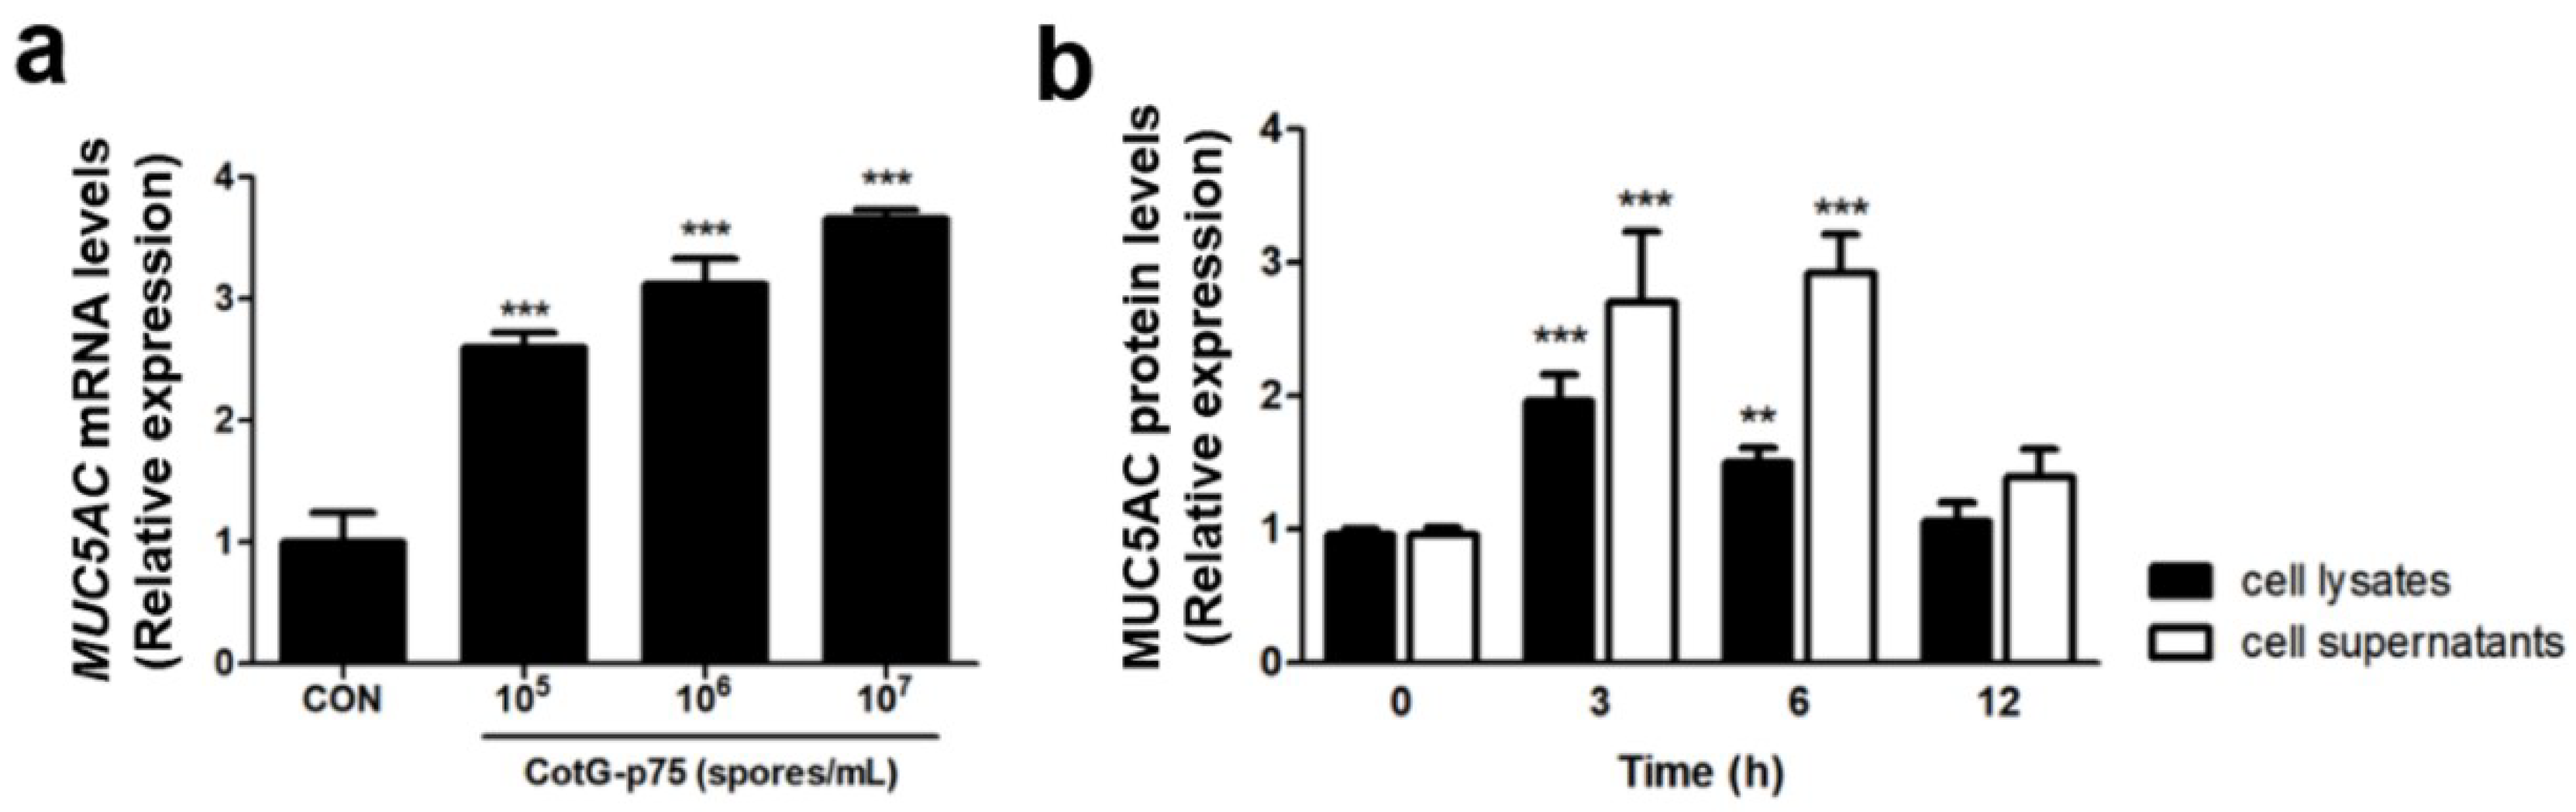
3.6. Effect of CotG-p75 on Heparin-Binding Epidermal Growth Factor (HBEGF) and MUC5AC Protein Expression

HBEGF and MUC5AC genes associated with the EGFR signaling pathway and mucin production were selected for RNA-seq analysis to verify the DEGs results. The mRNA expression of HBEGF was increased dose-dependently in cells treated with CotG-p75 (Figure 8a). The protein expression of HBEGF was increased significantly by CotG-p75 (Figure 8b). The maximum induction was reached at 3 h and was maintained until 6 h. CotG-p75 induced the expression of MUC5AC mRNA in a dose-dependent manner (Figure 9a) and induced the expression of MUC5AC protein in HT-29 cells (Figure 9b). The highest protein level of MUC5AC in cell lysates was observed at 3 h. The maximal protein level of MUC5AC in cell supernatants was observed at 6 h. However, the MUC5AC protein level returned to baseline after CotG-p75 treatment for 12 h. These data indicated that CotG-p75 induced HBEGF release and mucin production.

4. Discussion

In our previous study, we displayed p75 protein on the surface of B. subtilis spores using CotG as an anchor [31]. In the present study, we investigated the effects of CotG-p75 on transcriptional responses of the human intestinal epithelial cell line HT-29. We focused on biological processes involved in the probiotic properties, especially cell survival and development. Our results demonstrated that CotG-p75 affected genes involved in cell survival and development. We also discovered genes involved in these processes through DEG and GO enrichment analyses.
An interesting finding from GO enrichment analysis was the prevalence of GO terms related to cell developmental processes, especially cell proliferation and differentiation. Notably, genes involved in the tumor necrosis factor (TNF) superfamily were regulated by CotG-p75. This superfamily regulates a variety of cellular functions, including immune response, inflammation, proliferation, differentiation, and apoptosis [38]. FASLG and TNFSF10 (also known as TRAIL) are reported to contribute to apoptosis induction as ligands of the TNF pathway [39,40]. Moreover, TNFSF10 has a pro-inflammatory effect. Its up-regulation has been observed in intestinal inflammatory conditions, such as inflammatory bowel disease (IBD) [41]. TNFRSF1B is a receptor of the TNF superfamily and a critical signaling protein in the immune system [42,43]. In the present work, CotG-p75 up-regulated the expression of FASLG and TNFRSF1B but down-regulated the expression of TNFSF10. It also up-regulated CCL20 and CSF2 known to play important roles in leukocyte recruitment and activation of downstream signals of the TNF signaling pathway (Figure S5). Additionally, CotG-p75 down-regulated pro-apoptotic and antiproliferation genes such as BCL6, TNFSF10, and BTG2. By contrast, CotG-p75 up-regulated anti-apoptotic and pro-proliferation genes in the Hippo signaling pathway, such as GLI2, AREG, SERPINE1, NKD2, and MYC (Figure S6). These alterations in gene expression indicated that CotG-p75 could modulate cell apoptosis, proliferation, and immune responses in human intestinal epithelial cells.
Notably, genes encoding EGFR ligands, such as HBEGF, EREG, AREG, and EPGN, were all up-regulated in CotG-p75-stimulated cells. The EGFR signaling pathway is critical to maintaining epithelial homeostasis by promoting cell proliferation, differentiation, migration, and survival [44,45]. EGFR activation also contributes to ameliorating chronic inflammation, limiting colitis-associated tumorigenesis [46]. It has also been reported to regulate mucin production [47]. Similar to our results, many studies have shown that p40, another secreted protein of LGG, modulates intestinal epithelial cell homeostasis through HBEGF release, leading to EGFR activation [6,16,48]. p75 activates Akt, a downstream target of the EGFR signaling pathway, in intestinal epithelial cells [15]. Therefore, we could speculate that CotG-p75 may affect EGFR activation by stimulating the EGFR ligand genes, thereby contributing to cell proliferation.
Fortification of the epithelial barrier is crucial for gut health because the major function of the epithelial barrier is to prevent the invasion of microorganisms and their products [49]. We found that epithelial barrier-associated genes, such as FLG, IVL, SPRR1A, SPRR1B, and SPRR3, were up-regulated in CotG-p75-stimulated cells and were involved in epithelial cell development and differentiation processes. These barrier-related molecules belong to the epidermal differentiation complex and are essential for maintaining appropriate barrier function [50]. FLG (filaggrin) and IVL (involucrin) are major proteins that affect the skin barrier [51,52]. A loss-of-function mutation in these proteins is closely associated with atopic dermatitis [52,53]. Some studies have suggested that FLG might affect the barrier function of the GI tract and alter the risk of various GI disorders, such as IBD [54].
The small proline-rich protein (SPRR) family is a cornified cell envelope precursor. It is associated with epithelial proliferation and barrier function [55]. SPRRs can lead to reduced hydration, antioxidant defense, wound healing, drug permeability, and resistance to infection [56]. Many previous studies have provided evidence that SPRR2 plays an important role in barrier development and function in the intestinal epithelium. They showed that the SPRR2 participates in fortifying the intestinal epithelial barrier in response to bacterial infection [57,58,59]. A study suggested that SPRR2 may be crucial for cross-bridge formation in the serosa or between newly produced enterocytes [60].
Up-regulation of polymeric gel-forming mucin MUC5AC, encoded by the MUC5AC gene, and promoted mucin production were observed in CotG-p75-treated cells. Mucins are key components in maintaining intestinal epithelial homeostasis and improving epithelial barrier integrity [61,62]. The mucus layer prevents the adhesion and binding of pathogenic microorganisms, thereby preventing the invasion of intestinal pathogens [63]. LGG induces mucin gene expression and mucin production in human colon cells, including LS174T, Caco-2, and HT-29 [64,65,66]. p40 induces mucin gene expression and mucin production in LS174T cells and mouse colonic epithelium in an EFGR-dependent manner [15]. Moreover, EGFR signaling regulates mucin production [47]. These results are consistent with our findings that CotG-p75 increases gene expression of EGFR ligands. Therefore, these results suggested that CotG-p75 might play a critical role in protecting the intestinal epithelium and maintaining barrier homeostasis by promoting mucin production. Overall, our results suggested that CotG-p75 might participate in cell proliferation and differentiation by stimulating these epithelial barrier fortification-related molecules in human intestinal epithelial cells.
In conclusion, transcriptome analysis of HT-29 cells stimulated with CotG-p75 suggested that several genes activated by CotG-p75 are involved in biological processes, especially cell survival and epithelial development. Our findings provide novel insight into the transcriptional response of human intestinal epithelial cells to stimulation by CotG-p75. Since we identified transcriptional responses only in the HT-29 cell line, we cannot predict whether CotG-p75 will act in the same way in vivo. Therefore, further studies are needed to investigate whether these responses can activate related factors in the signaling pathway or induce differential phenotype expression in other human intestinal epithelial cell lines or animal models. The transcriptomic-based approach of this study may help determine the targets of several signal transduction pathways for in vivo studies. These results indicate that CotG-p75 can contribute to the improvement of survival and development of human intestinal epithelial cells.

Supplementary Materials

The following supporting information can be downloaded at: https://0-www-mdpi-com.brum.beds.ac.uk/article/10.3390/microorganisms10071276/s1. Table S1: Primers used for RT-qPCR for selected genes, Table S2: Throughput and quality of RNA-seq data, Table S3: List of differentially expressed genes between wild-type spore-stimulated HT-29 cells and control, Table S4: List of differentially expressed genes between CotG-p75-stimulated HT-29 cells and control, Table S5: List of differentially expressed genes between CotG-p75-stimulated and wild-type spore-stimulated HT-29 cells, Table S6: Gene ontology (GO) enrichment analysis of differentially expressed genes in HT-29 stimulated with wild-type spore, Table S7: Gene ontology (GO) enrichment analysis of differentially expressed genes in HT-29 stimulated with CotG-p75, Figure S1: Effect of wild-type spores (a) and CotG-p75 (b) on cell viability of intestinal epithelial HT-29 cells, Figure S2: Illustration of gene ontology (GO) term networks of differentially expressed genes between wild-type spore-stimulated HT-29 cells and control, Figure S3: The mRNA expression of the genes involved in cell survival and proliferation from HT-29 stimulated by different doses of CotG-p75, Figure S4: The mRNA expression of the genes involved in epithelium development and differentiation from HT-29 stimulated by different doses of CotG-p75, Figure S5: TNF signaling pathway in KEGG pathway analysis., Figure S6: Hippo signaling pathway in KEGG pathway analysis.

Author Contributions

Conceptualization, S.-J.K., S.-S.K. and K.-W.H.; Data curation, S.-J.K. and K.-W.H.; Formal analysis, S.-J.K., M.-J.K. and D.-Y.S.; Investigation, S.-J.K., M.-J.K. and D.-Y.S.; Writing—original draft, S.-J.K.; Writing—review and editing, S.-S.K. and K.-W.H. All authors have read and agreed to the published version of the manuscript.

Funding

This work was supported under the framework of international cooperation program managed by National Research Foundation of Korea (NRF-2018R1D1A1A02086040).

Institutional Review Board Statement

Not applicable.

Informed Consent Statement

Not applicable.

Data Availability Statement

The datasets supporting the conclusions of this article are included within the article and its additional files. The raw sequence data have been submitted to the Sequence Read Archive (SRA) under Bioproject accession number PRJNA792019 (https://0-www-ncbi-nlm-nih-gov.brum.beds.ac.uk/sra/ PRJNA792019 (accessed on 26 May 2022)) and reference BioSample accession number SAMN24371861–9 (https://0-www-ncbi-nlm-nih-gov.brum.beds.ac.uk/biosample/24371861–9 (accessed on 26 May 2022)).

Conflicts of Interest

The authors declare no conflict to interest.

References

  1. Hotel, A.C.P.; Cordoba, A. Health and nutritional properties of probiotics in food including powder milk with live lactic acid bacteria. Prevention 2001, 5, 1–10. [Google Scholar]
  2. Singh, R.; Chandrashekharappa, S.; Bodduluri, S.R.; Baby, B.V.; Hegde, B.; Kotla, N.G.; Hiwale, A.A.; Saiyed, T.; Patel, P.; Vijay-Kumar, M. Enhancement of the gut barrier integrity by a microbial metabolite through the Nrf2 pathway. Nat. Commun. 2019, 10, 89. [Google Scholar] [CrossRef] [PubMed] [Green Version]
  3. Nataraj, B.H.; Ali, S.A.; Behare, P.V.; Yadav, H. Postbiotics-parabiotics: The new horizons in microbial biotherapy and functional foods. Microb. Cell Factories 2020, 19, 168. [Google Scholar] [CrossRef] [PubMed]
  4. Sanchez, B.; Bressollier, P.; Urdaci, M.C. Exported proteins in probiotic bacteria: Adhesion to intestinal surfaces, host immunomodulation and molecular cross-talking with the host. FEMS Immunol. Med. Microbiol. 2008, 54, 1–17. [Google Scholar] [CrossRef] [Green Version]
  5. Sánchez, B.; Urdaci, M.C. Extracellular proteins from Lactobacillus plantarum BMCM12 prevent adhesion of enteropathogens to mucin. Curr. Microbiol. 2012, 64, 592–596. [Google Scholar] [CrossRef]
  6. Yan, F.; Cao, H.; Cover, T.L.; Washington, M.K.; Shi, Y.; Liu, L.; Chaturvedi, R.; Peek, R.M.; Wilson, K.T.; Polk, D.B. Colon-specific delivery of a probiotic-derived soluble protein ameliorates intestinal inflammation in mice through an EGFR-dependent mechanism. J. Clin. Investig. 2011, 121, 2242–2253. [Google Scholar] [CrossRef] [Green Version]
  7. Wang, Y.; Liu, L.; Moore, D.J.; Shen, X.; Peek, R.; Acra, S.A.; Li, H.; Ren, X.; Polk, D.B.; Yan, F. An LGG-derived protein promotes IgA production through upregulation of APRIL expression in intestinal epithelial cells. Mucosal Immunol. 2017, 10, 373–384. [Google Scholar] [CrossRef] [Green Version]
  8. Yan, F.; Polk, D.B. Lactobacillus rhamnosus GG: An updated strategy to use microbial products to promote health. Funct. Food Rev. 2012, 4, 77–84. [Google Scholar]
  9. Delgado, S.; Sánchez, B.; Margolles, A.; Ruas-Madiedo, P.; Ruiz, L. Molecules produced by probiotics and intestinal microorganisms with immunomodulatory activity. Nutrients 2020, 12, 391. [Google Scholar] [CrossRef] [Green Version]
  10. Liu, Q.; Yu, Z.; Tian, F.; Zhao, J.; Zhang, H.; Zhai, Q.; Chen, W. Surface components and metabolites of probiotics for regulation of intestinal epithelial barrier. Microb. Cell Factories 2020, 19, 23. [Google Scholar] [CrossRef]
  11. Yan, F.; Polk, D.B. Probiotic bacterium prevents cytokine-induced apoptosis in intestinal epithelial cells. J. Biol. Chem. 2002, 277, 50959–50965. [Google Scholar] [CrossRef] [PubMed] [Green Version]
  12. Yan, F.; Cao, H.; Cover, T.L.; Whitehead, R.; Washington, M.K.; Polk, D.B. Soluble proteins produced by probiotic bacteria regulate intestinal epithelial cell survival and growth. Gastroenterology 2007, 132, 562–575. [Google Scholar] [CrossRef] [PubMed] [Green Version]
  13. Bäuerl, C.; Pérez-Martínez, G.; Yan, F.; Polk, D.B.; Monedero, V. Functional analysis of the p40 and p75 proteins from Lactobacillus casei BL23. Microb. Physiol. 2010, 19, 231–241. [Google Scholar] [CrossRef] [Green Version]
  14. Bäuerl, C.; Abitayeva, G.; Sosa-Carrillo, S.; Mencher-Beltrán, A.; Navarro-Lleó, N.; Coll-Marqués, J.M.; Zúñiga-Cabrera, M.; Shaikhin, S.; Pérez-Martinez, G. P40 and P75 are singular functional muramidases present in the Lactobacillus casei/paracasei/rhamnosus taxon. Front. Microbiol. 2019, 10, 1420. [Google Scholar] [CrossRef] [PubMed]
  15. Seth, A.; Yan, F.; Polk, D.B.; Rao, R. Probiotics ameliorate the hydrogen peroxide-induced epithelial barrier disruption by a PKC- and MAP kinase-dependent mechanism. Am. J. Physiol. Gastrointest. Liver Physiol. 2008, 294, G1060–G1069. [Google Scholar] [CrossRef] [PubMed] [Green Version]
  16. Wang, L.; Cao, H.; Liu, L.; Wang, B.; Walker, W.A.; Acra, S.A.; Yan, F. Activation of epidermal growth factor receptor mediates mucin production stimulated by p40, a Lactobacillus rhamnosus GG-derived protein. J. Biol. Chem. 2014, 289, 20234–20244. [Google Scholar] [CrossRef] [Green Version]
  17. Isticato, R.; Cangiano, G.; Tran, H.T.; Ciabattini, A.; Medaglini, D.; Oggioni, M.R.; De Felice, M.; Pozzi, G.; Ricca, E. Surface display of recombinant proteins on Bacillus subtilis spores. J. Bacteriol. 2001, 183, 6294–6301. [Google Scholar] [CrossRef] [Green Version]
  18. Henriques, A.O.; Moran, J.; Charles, P. Structure, assembly, and function of the spore surface layers. Annu. Rev. Microbiol. 2007, 61, 555–588. [Google Scholar] [CrossRef]
  19. Jadamus, A.; Vahjen, W.; Simon, O. Growth behaviour of a spore forming probiotic strain in the gastrointestinal tract of broiler chicken and piglets. Arch. Anim. Nutr. 2001, 54, 1–17. [Google Scholar] [CrossRef]
  20. Hong, H.A.; Duc, L.H.; Cutting, S.M. The use of bacterial spore formers as probiotics. FEMS Microbiol. Rev. 2005, 29, 813–835. [Google Scholar] [CrossRef] [Green Version]
  21. Hoa, N.T.; Baccigalupi, L.; Huxham, A.; Smertenko, A.; Van, P.H.; Ammendola, S.; Ricca, E.; Cutting, S.M. Characterization of Bacillus species used for oral bacteriotherapy and bacterioprophylaxis of gastrointestinal disorders. Appl. Environ. Microbiol. 2000, 66, 5241–5247. [Google Scholar] [CrossRef] [PubMed] [Green Version]
  22. Cutting, S.M. Bacillus probiotics. Food Microbiol. 2011, 28, 214–220. [Google Scholar] [CrossRef] [PubMed]
  23. Guoyan, Z.; Yingfeng, A.; Zabed, H.M.; Qi, G.; Yang, M.; Jiao, Y.; Li, W.; Wenjing, S.; Xianghui, Q. Bacillus subtilis spore surface display technology: A review of its development and applications. J. Microbiol. Biotechnol. 2019, 29, 179–190. [Google Scholar] [CrossRef] [PubMed]
  24. Guo, Q.; An, Y.; Yun, J.; Yang, M.; Magocha, T.A.; Zhu, J.; Xue, Y.; Qi, Y.; Hossain, Z.; Sun, W. Enhanced D-tagatose production by spore surface-displayed L-arabinose isomerase from isolated Lactobacillus brevis PC16 and biotransformation. Bioresour. Technol. 2018, 247, 940–946. [Google Scholar] [CrossRef] [PubMed]
  25. Hinc, K.; Isticato, R.; Dembek, M.; Karczewska, J.; Iwanicki, A.; Peszyńska-Sularz, G.; De Felice, M.; Obuchowski, M.; Ricca, E. Expression and display of UreA of Helicobacter acinonychis on the surface of Bacillus subtilis spores. Microb. Cell Factories 2010, 9, 2. [Google Scholar] [CrossRef] [Green Version]
  26. Wang, H.; Yang, R.; Hua, X.; Zhang, W.; Zhao, W. An approach for lactulose production using the CotX-mediated spore-displayed β-galactosidase as a biocatalyst. J. Microbiol. Biotechnol. 2016, 26, 1267–1277. [Google Scholar] [CrossRef]
  27. Das, K.; Thomas, T.; Garnica, O.; Dhandayuthapani, S. Recombinant Bacillus subtilis spores for the delivery of Mycobacterium tuberculosis Ag85B-CFP10 secretory antigens. Tuberculosis 2016, 101, S18–S27. [Google Scholar] [CrossRef]
  28. Dai, X.; Liu, M.; Pan, K.; Yang, J. Surface display of OmpC of Salmonella serovar Pullorum on Bacillus subtilis spores. PLoS ONE 2018, 13, e0191627. [Google Scholar] [CrossRef] [Green Version]
  29. Li, W.; Feng, J.; Li, J.; Li, J.; Wang, Z.; Khalique, A.; Yang, M.; Ni, X.; Zeng, D.; Zhang, D. Surface display of antigen protein VP8* of porcine rotavirus on Bacillus Subtilis spores using CotB as a fusion partner. Molecules 2019, 24, 3793. [Google Scholar] [CrossRef] [Green Version]
  30. Kang, M.; Feng, F.; Ge, Q.; Zhu, F.; Chen, L.; Lv, P.; Ma, S.; Yao, Q.; Chen, K. Display of quintuple glucagon-like peptide 1 (28–36) nonapeptide on Bacillus subtilis spore for oral administration in the treatment of type 2 diabetes. J. Appl. Microbiol. 2021, 130, 314–324. [Google Scholar] [CrossRef]
  31. Kang, S.J.; Jun, J.S.; Moon, J.A.; Hong, K.W. Surface display of p75, a Lactobacillus rhamnosus GG derived protein, on Bacillus subtilis spores and its antibacterial activity against Listeria monocytogenes. AMB Express 2020, 10, 139. [Google Scholar] [CrossRef] [PubMed]
  32. Mosmann, T. Rapid colorimetric assay for cellular growth and survival: Application to proliferation and cytotoxicity assays. J. Immunol. Methods 1983, 65, 55–63. [Google Scholar] [CrossRef]
  33. Bolger, A.M.; Lohse, M.; Usadel, B. Trimmomatic: A flexible trimmer for Illumina sequence data. Bioinformatics 2014, 30, 2114–2120. [Google Scholar] [CrossRef] [PubMed] [Green Version]
  34. Maere, S.; Heymans, K.; Kuiper, M. BiNGO: A Cytoscape plugin to assess overrepresentation of gene ontology categories in biological networks. Bioinformatics 2005, 21, 3448–3449. [Google Scholar] [CrossRef] [Green Version]
  35. Shannon, P.; Markiel, A.; Ozier, O.; Baliga, N.S.; Wang, J.T.; Ramage, D.; Amin, N.; Schwikowski, B.; Ideker, T. Cytoscape: A software environment for integrated models of biomolecular interaction networks. Genome Res. 2003, 13, 2498–2504. [Google Scholar] [CrossRef]
  36. Von Mering, C.; Jensen, L.J.; Snel, B.; Hooper, S.D.; Krupp, M.; Foglierini, M.; Jouffre, N.; Huynen, M.A.; Bork, P. STRING: Known and predicted protein–protein associations, integrated and transferred across organisms. Nucleic Acids Res. 2005, 33, D433–D437. [Google Scholar] [CrossRef]
  37. Livak, K.J.; Schmittgen, T.D. Analysis of relative gene expression data using real-time quantitative PCR and the 2−ΔΔCT method. Methods 2001, 25, 402–408. [Google Scholar] [CrossRef]
  38. Croft, M.; Siegel, R.M. Beyond TNF: TNF superfamily cytokines as targets for the treatment of rheumatic diseases. Nat. Rev. Rheumatol. 2017, 13, 217–233. [Google Scholar] [CrossRef] [Green Version]
  39. Strater, J.; Wellisch, I.; Riedl, S.; Walczak, H.; Koretz, K.; Tandara, A.; Krammer, P.H.; Moller, P. CD95 (APO-1/Fas)-mediated apoptosis in colon epithelial cells: A possible role in ulcerative colitis. Gastroenterology 1997, 113, 160–167. [Google Scholar] [CrossRef]
  40. Janssen, E.M.; Droin, N.M.; Lemmens, E.E.; Pinkoski, M.J.; Bensinger, S.J.; Ehst, B.D.; Griffith, T.S.; Green, D.R.; Schoenberger, S.P. CD4+ T-cell help controls CD8+ T-cell memory via TRAIL-mediated activation-induced cell death. Nature 2005, 434, 88–93. [Google Scholar] [CrossRef]
  41. Begue, B.; Wajant, H.; Bambou, J.C.; Dubuquoy, L.; Siegmund, D.; Beaulieu, J.F.; Canioni, D.; Berrebi, D.; Brousse, N.; Desreumaux, P. Implication of TNF-related apoptosis-inducing ligand in inflammatory intestinal epithelial lesions. Gastroenterology 2006, 130, 1962–1974. [Google Scholar] [CrossRef] [PubMed]
  42. Brown, G.R.; Thiele, D.L. Enhancement of MHC class I-stimulated alloresponses by TNF/TNF receptor (TNFR) 1 interactions and of MHC class II-stimulated alloresponses by TNF/TNFR2 interactions. Eur. J. Immunol. 2000, 30, 2900–2907. [Google Scholar] [CrossRef]
  43. Hamano, R.; Huang, J.; Yoshimura, T.; Oppenheim, J.J.; Chen, X. TNF optimally activatives regulatory T cells by inducing TNF receptor superfamily members TNFR2, 4-1BB and OX40. Eur. J. Immunol. 2011, 41, 2010–2020. [Google Scholar] [CrossRef] [PubMed] [Green Version]
  44. Yarden, Y. The EGFR family and its ligands in human cancer: Signalling mechanisms and therapeutic opportunities. Eur. J. Cancer 2001, 37, 3–8. [Google Scholar] [CrossRef]
  45. Yarden, Y.; Sliwkowski, M.X. Untangling the ErbB signalling network. Nat. Rev. Mol. Cell Biol. 2001, 2, 127–137. [Google Scholar] [CrossRef]
  46. Dubé, P.E.; Yan, F.; Punit, S.; Girish, N.; McElroy, S.J.; Washington, M.K.; Polk, D.B. Epidermal growth factor receptor inhibits colitis-associated cancer in mice. J. Clin. Investig. 2012, 122, 2780–2792. [Google Scholar] [CrossRef]
  47. Nadel, J.A. Role of epidermal growth factor receptor activation in regulating mucin synthesis. Respir. Res. 2001, 2, 85–89. [Google Scholar] [CrossRef] [Green Version]
  48. Yan, F.; Liu, L.; Dempsey, P.J.; Tsai, Y.-H.; Raines, E.W.; Wilson, C.L.; Cao, H.; Cao, Z.; Liu, L.; Polk, D.B. A Lactobacillus rhamnosus GG-derived soluble protein, p40, stimulates ligand release from intestinal epithelial cells to transactivate epidermal growth factor receptor. J. Biol. Chem. 2013, 288, 30742–30751. [Google Scholar] [CrossRef] [Green Version]
  49. Marchiando, A.M.; Graham, W.V.; Turner, J.R. Epithelial barriers in homeostasis and disease. Annu. Rev. Pathol. Mech. Dis. 2010, 5, 119–144. [Google Scholar] [CrossRef]
  50. Kalinin, A.; Marekov, L.N.; Steinert, P.M. Assembly of the epidermal cornified cell envelope. J. Cell Sci. 2001, 114, 3069–3070. [Google Scholar] [CrossRef]
  51. Kypriotou, M.; Huber, M.; Hohl, D. The human epidermal differentiation complex: Cornified envelope precursors, S100 proteins and the ‘fused genes’ family. Exp. Dermatol. 2012, 21, 643–649. [Google Scholar] [CrossRef] [PubMed]
  52. Furue, M. Regulation of filaggrin, loricrin, and involucrin by IL-4, IL-13, IL-17A, IL-22, AHR, and NRF2: Pathogenic implications in atopic dermatitis. Int. J. Mol. Sci. 2020, 21, 5382. [Google Scholar] [CrossRef]
  53. Kezic, S.; Jakasa, I. Filaggrin and skin barrier function. Ski. Barrier Funct. 2016, 49, 1–7. [Google Scholar]
  54. Thyssen, A.P.; Thyssen, E.P. Filaggrin Dysfunction and Its Association with Inflammatory Conditions of the GI Tract. In Filaggrin; Springer: Berlin/Heidelberg, Germany, 2014; pp. 327–331. [Google Scholar]
  55. Carregaro, F.; Stefanini, A.C.B.; Henrique, T.; Tajara, E.H. Study of small proline-rich proteins (SPRRs) in health and disease: A review of the literature. Arch. Dermatol. Res. 2013, 305, 857–866. [Google Scholar] [CrossRef] [PubMed]
  56. Rinnerthaler, M.; Duschl, J.; Steinbacher, P.; Salzmann, M.; Bischof, J.; Schuller, M.; Wimmer, H.; Peer, T.; Bauer, J.W.; Richter, K. Age-related changes in the composition of the cornified envelope in human skin. Exp. Dermatol. 2013, 22, 329–335. [Google Scholar] [CrossRef] [PubMed]
  57. Hooper, L.V.; Wong, M.H.; Thelin, A.; Hansson, L.; Falk, P.G.; Gordon, J.I. Molecular analysis of commensal host-microbial relationships in the intestine. Science 2001, 291, 881–884. [Google Scholar] [CrossRef] [Green Version]
  58. Hooper, L.V.; Gordon, J.I. Commensal host-bacterial relationships in the gut. Science 2001, 292, 1115–1118. [Google Scholar] [CrossRef]
  59. Knight, P.A.; Pemberton, A.D.; Robertson, K.A.; Roy, D.J.; Wright, S.H.; Miller, H.R. Expression profiling reveals novel innate and inflammatory responses in the jejunal epithelial compartment during infection with Trichinella spiralis. Infect. Immun. 2004, 72, 6076–6086. [Google Scholar] [CrossRef] [Green Version]
  60. Stern, L.E.; Erwin, C.R.; Falcone, R.A., Jr.; Huang, F.S.; Kemp, C.J.; Williams, J.L.; Warner, B.W. cDNA microarray analysis of adapting bowel after intestinal resection. J. Pediatr. Surg. 2001, 36, 190–195. [Google Scholar] [CrossRef]
  61. Bergstrom, K.S.; Xia, L. Mucin-type O-glycans and their roles in intestinal homeostasis. Glycobiology 2013, 23, 1026–1037. [Google Scholar] [CrossRef]
  62. Johansson, M.E.; Hansson, G.C. Immunological aspects of intestinal mucus and mucins. Nat. Rev. Immunol. 2016, 16, 639–649. [Google Scholar] [CrossRef] [PubMed]
  63. Forstner, J.; Forstner, G. Gastrointestinal mucus. In Physiology of the Gastrointestinal Tract; Johnson, L.R., Ed.; Raven Press: New York, NY, USA, 1994. [Google Scholar]
  64. Mack, D.R.; Michail, S.; Wei, S.; McDougall, L.; Hollingsworth, M.A. Probiotics inhibit enteropathogenic E. coli adherence in vitro by inducing intestinal mucin gene expression. Am. J. Physiol. Gastrointest. Liver Physiol. 1999, 276, G941–G950. [Google Scholar] [CrossRef] [PubMed]
  65. Mattar, A.; Teitelbaum, D.H.; Drongowski, R.; Yongyi, F.; Harmon, C.; Coran, A. Probiotics up-regulate MUC-2 mucin gene expression in a Caco-2 cell-culture model. Pediatr. Surg. Int. 2002, 18, 586–590. [Google Scholar]
  66. Mack, D.R.; Ahrne, S.; Hyde, L.; Wei, S.; Hollingsworth, M.A. Extracellular MUC3 mucin secretion follows adherence of Lactobacillus strains to intestinal epithelial cells in vitro. Gut 2003, 52, 827–833. [Google Scholar] [CrossRef] [PubMed] [Green Version]
Figure 1. Differentially expressed gene (DEG) distribution trends in HT-29 cells in two comparison groups: wild-type spore-stimulated cells versus control cells (a), and CotG-p75-stimulated cells versus control cells (b). Blue vertical dashed lines indicate | Log 2   ( fold   change ) | = 1. Red horizontal dashed lines indicate the preset statistical threshold corresponding to an adjusted p-value < 0.05. Yellow and blue dots represent up-regulated and down-regulated DEGs, respectively. Gray dots represent non-differentially expressed genes.
Microorganisms 10 01276 g001
Figure 2. Venn diagram of differentially expressed genes (DEGs) in HT-29 cells stimulated with wild-type spore or CotG-p75 compared to control. Overlapping portions of different circles represent the number of DEGs that are common, and non-overlapping portions represent the number of DEGs that are unique to the comparison group.
Microorganisms 10 01276 g002
Figure 3. Hierarchical clustering of differentially expressed genes (DEGs) in HT-29 cells stimulated by wild-type spores (WT) or CotG-p75 (G75) compared to control (CON). Each row represents one of the common genes, and each column represents each sample. The color scale means gene expression standard deviations from the mean represented as Z-score. Yellow indicates up-regulation, and blue indicates down-regulation.
Microorganisms 10 01276 g003
Figure 4. Gene ontology (GO) networks of differentially expressed genes generated by Cytoscape BiNGO. All significantly enriched GO terms in biological processes are presented. Circle size represents GO hierarchy. Yellow shade represents enrichment level. The threshold of hypergeometric distribution of the functional annotation was set at corrected p-value < 0.01.
Microorganisms 10 01276 g004
Figure 5. Networks of gene–gene interactions involved in epithelial cell differentiation and development (a) and cell proliferation (b). These networks were visualized with a search tool for the retrieval of interacting genes (STRING) and constructed with a required confidence score of 0.4. Nodes and lines represent genes and interactions between genes, respectively.
Microorganisms 10 01276 g005
Figure 6. Real-time quantitative PCR validation of RNA-seq data for genes involved in cell survival and proliferation from HT-29 stimulated by CotG-p75. The right and left y-axis represent the fold change of RNA-seq data and relative expression of RT-qPCR data, respectively. The relative mRNA expression was compared with spore-untreated control. RT-qPCR analysis for mRNA expression of selected genes was normalized against GAPDH. RT-qPCR data are presented as mean ± standard deviation (n = 3).
Microorganisms 10 01276 g006
Figure 7. Real-time quantitative PCR validation of RNA-seq data for genes involved in epithelium development and differentiation from HT-29 stimulated by CotG-p75. The right and left y-axis represent the fold change of RNA-seq data and relative expression of RT-qPCR data, respectively. The relative mRNA expression was compared with spore-untreated control. RT-qPCR analysis for mRNA expression of selected genes was normalized against GAPDH. RT-qPCR data are presented as mean ± standard deviation (n = 3).
Microorganisms 10 01276 g007
Figure 8. Effect of CotG-p75 on HBEGF mRNA expression (a) and HBEGF protein production (b). In panel (a), cells were treated with various concentrations of CotG-p75 (105 to 107 spores/mL) for 3 h. In panel (b), cells were treated with CotG-p75 (107 spores/mL) during various times (0, 3, 6, and 12 h). The mRNA expression levels and protein production levels in treated groups were compared with the control group. All data are expressed as mean ± standard deviation (n = 3). Asterisks (*) indicate a significance difference from the control (* p < 0.05, ** p < 0.01, *** p < 0.001).
Microorganisms 10 01276 g008
Figure 9. Effect of CotG-p75 on MUC5AC mRNA expression (a) and MUC5AC protein production (b). In panel (a), cells were treated with various concentrations of CotG-p75 (105 to 107 spores/mL) for 3 h. In panel (b), cells were treated with CotG-p75 (107 spores/mL) during various times (0, 3, 6, and 12 h). The mRNA expression levels and protein production levels in treated groups were compared with the control group. All data are expressed as mean ± standard deviation (n = 3). Asterisks (*) indicate a significance difference from the control (** p < 0.01, *** p < 0.001).
Microorganisms 10 01276 g009
Table 1. Gene ontology (GO) enrichment analysis of differentially expressed genes in HT-29 stimulated with CotG-p75.
GO IDGO DescriptionAdjusted p-Value aCluster Frequency bTotal Frequency c
GO:0048731system development2.04 × 10−8103/387 (26.6%)2421/17,777 (13.6%)
GO:0048856anatomical structure development2.14 × 10−7106/387 (27.3%)2655/17,777 (14.9%)
GO:0048513organ development3.23 × 10−780/387 (20.6%)1791/17,777 (10.0%)
GO:0009653anatomical structure morphogenesis1.12 × 10−558/387 (14.9%)1217/17,777 (6.8%)
GO:0007275multicellular organismal development1.16 × 10−5108/387 (27.9%)2970/17,777 (16.7%)
GO:0032502developmental process3.53 × 10−5113/387 (29.1%)3233/17,777 (18.1%)
GO:0048568embryonic organ development1.27 × 10−419/387 (4.9%)215/17,777 (1.2%)
GO:0050794regulation of cellular process1.35 × 10−4183/387 (47.2%)6218/17,777 (34.9%)
GO:0007166cell surface receptor linked signaling pathway1.55 × 10−456/387 (14.4%)1279/17,777 (7.1%)
GO:0009887organ morphogenesis1.62 × 10−435/387 (9.0%)634/17,777 (3.5%)
GO:0050789regulation of biological process3.76 × 10−4188/387 (48.5%)6548/17,777 (36.8%)
GO:0065007biological regulation5.21 × 10−4196/387 (50.6%)6937/17,777 (39.0%)
GO:0007167enzyme linked receptor protein signaling pathway6.06 × 10−423/387 (5.9%)346/17,777 (1.9%)
GO:0048523negative regulation of cellular process6.13 × 10−470/387 (18.0%)1844/17,777 (10.3%)
GO:0023052signaling6.46 × 10−4104/387 (26.8%)3130/17,777 (17.6%)
GO:0009888tissue development6.46 × 10−437/387 (9.5%)748/17,777 (4.2%)
GO:0007154cell communication6.58 × 10−439/387 (10.0%)812/17,777 (4.5%)
GO:0048519negative regulation of biological process8.37 × 10−474/387 (19.1%)2019/17,777 (11.3%)
GO:0060429epithelium development8.69 × 10−422/387 (5.6%)336/17,777 (1.8%)
GO:0007169transmembrane receptor protein tyrosine kinase signaling pathway8.69 × 10−460/387 (15.5%)1526/17,777 (8.5%)
GO:0009790embryonic development1.06 × 10−317/387 (4.3%)219/17,777 (1.2%)
GO:0023033signaling pathway1.39 × 10−331/387 (8.0%)602/17,777 (3.3%)
GO:0030154cell differentiation1.39 × 10−375/387 (19.3%)2099/17,777 (11.8%)
GO:0048562embryonic organ morphogenesis1.47 × 10−363/387 (16.2%)1668/17,777 (9.3%)
GO:0042471ear morphogenesis1.64 × 10−313/387 (3.3%)140/17,777 (0.7%)
GO:0009913epidermal cell differentiation1.64 × 10−39/387 (2.3%)66/17,777 (0.3%)
GO:0007165signal transduction2.02 × 10−39/387 (2.3%)68/17,777 (0.3%)
GO:0048869cellular developmental process2.09 × 10−368/387 (17.5%)1877/17,777 (10.5%)
GO:0007389pattern specification process2.78 × 10−363/387 (16.2%)1714/17,777 (9.6%)
GO:0042573retinoic acid metabolic process2.78 × 10−360/387 (15.5%)1607/17,777 (9.0%)
GO:0060021palate development3.25 × 10−318/387 (4.6%)271/17,777 (1.5%)
GO:0048598embryonic morphogenesis3.47 × 10−35/387 (1.2%)18/17,777 (0.1%)
GO:0048518positive regulation of biological process3.75 × 10−37/387 (1.8%)43/17,777 (0.2%)
GO:0032501multicellular organismal process5.09 × 10−320/387 (5.1%)336/17,777 (1.8%)
GO:0008544epidermis development5.09 × 10−375/387 (19.3%)2207/17,777 (12.4%)
GO:0030216keratinocyte differentiation5.50 × 10−3129/387 (33.3%)4374/17,777 (24.6%)
GO:0030855epithelial cell differentiation5.50 × 10−314/387 (3.6%)186/17,777 (1.0%)
GO:0031326regulation of cellular biosynthetic process5.78 × 10−38/387 (2.0%)63/17,777 (0.3%)
GO:0007267cell–cell signaling6.60 × 10−317/387 (4.3%)265/17,777 (1.4%)
GO:00429049-cis-retinoic acid biosynthetic process7.01 × 10−313/387 (3.3%)168/17,777 (0.9%)
GO:00429059-cis-retinoic acid metabolic process7.10 × 10−395/387 (24.5%)3021/17,777 (16.9%)
GO:0035238vitamin A biosynthetic process7.10 × 10−38/387 (2.0%)66/17,777 (0.3%)
GO:0007507heart development7.10 × 10−328/387 (7.2%)587/17,777 (3.3%)
GO:0007423sensory organ development7.10 × 10−33/387 (0.7%)5/17,777 (0.0%)
GO:0009889regulation of biosynthetic process7.10 × 10−33/387 (0.7%)5/17,777 (0.0%)
GO:0023046signaling process7.10 × 10−33/387 (0.7%)5/17,777 (0.0%)
GO:0023060signal transmission7.10 × 10−33/387 (0.7%)5/17,777 (0.0%)
GO:0048468cell development7.10 × 10−33/387 (0.7%)5/17,777 (0.0%)
GO:0007398ectoderm development7.40 × 10−315/387 (3.8%)221/17,777 (1.2%)
ap-value in hypergeometric test after correction. b The denominator represents the total number of genes with GO annotation, and the numerator represents the number of genes belonging to each GO term. c The denominator represents the number of reference genes with GO annotation, and the numerator represents the number of references genes annotated in the listed GO term.
Table 2. List of genes involved in epithelial cell differentiation and development and cell proliferation in HT-29 cells stimulated with CotG-p75.
Gene SymbolGene NameFold Changep-Value
Epithelial Cell Differentiation and Development
ALDH1A3aldehyde dehydrogenase 1 family member A38.1540.000
GLI2GLI family zinc finger 25.5240.000
SPRR1Bsmall proline rich protein 1B5.4930.000
DHRS9dehydrogenase/reductase 95.3300.000
SPRR3small proline rich protein 35.3040.000
SPRR1Asmall proline rich protein 1A4.1180.001
EREGepiregulin3.2210.000
FLGfilaggrin3.0370.031
IVLinvolucrin2.1410.000
WNT7BWnt family member 7B2.1340.000
SRFserum response factor2.1240.046
MYCMYC proto-oncogene, bHLH transcription factor2.1200.000
HOXA5homeobox A5−2.0430.000
FZD2frizzled class receptor 2−2.6970.022
PTCH1patched 1−2.9870.000
POU3F1POU class 3 homeobox 1−3.7690.000
Cell proliferation
GLI2GLI family zinc finger 25.5240.000
FASLGFas ligand4.5590.002
EPGNepithelial mitogen4.1320.013
CDKN1Acyclin dependent kinase inhibitor 1A3.4200.000
CSF2colony stimulating factor 23.2250.000
EREGepiregulin3.2210.000
FOSL1FOS like 1, AP-1 transcription factor subunit3.0630.000
FLGfilaggrin3.0370.031
CXCL8C-X-C motif chemokine ligand 22.5100.003
PTGS2prostaglandin-endoperoxide synthase 22.4240.000
FGF19fibroblast growth factor 192.4000.000
MYCN-myc downstream regulated 12.1640.000
SERPINE1serpin family E member 12.1430.000
HOXA5homeobox A5−2.0430.000
ERBB3erb-b2 receptor tyrosine kinase 3−2.1400.000
IRS2insulin receptor substrate 2−2.6050.000
FGFR2fibroblast growth factor receptor 2−2.6130.000
CBLBCbl proto-oncogene B−3.3910.000
BCL6B-cell CLL/lymphoma 6−3.7180.000
BTG2BTG anti-proliferation factor 2−4.7120.000
Publisher’s Note: MDPI stays neutral with regard to jurisdictional claims in published maps and institutional affiliations.

