Rietveld Analysis of Elpidite Framework Flexibility Using in Situ Powder XRD Data of Thermally Treated Samples


1
Institute of Mineralogy and Crystallography, Bulgarian Academy of Sciences, 1113 Sofia, Bulgaria
2
Geological Institute, Bulgarian Academy of Science, 1113 Sofia, Bulgaria
*
Author to whom correspondence should be addressed.
Minerals 2020, 10(7), 639; https://0-doi-org.brum.beds.ac.uk/10.3390/min10070639
Submission received: 19 June 2020
/
Revised: 9 July 2020
/
Accepted: 15 July 2020
/
Published: 19 July 2020
(This article belongs to the Special Issue The Rietveld Method in Geomaterials Characterisation)
Abstract
:The present study demonstrates the capabilities of the Rietveld procedure to track the structural transformations and framework flexibility on the example of the natural water-containing zirconosilicate elpidite, subjected (in bulk) to thermal treatment from room temperature to 300 °C. The methodological approach to the performed refinements and the obtained results are in accordance with the previously reported data from in situ single crystal X-ray diffraction studies on heated samples of the same mineral. More light has been drawn on the temperature interval in which the non-reconstructive topotactic phase transition occurs upon partial dehydration. The framework flexibility observed as a response to the water loss and subsequent thermal expansion was evaluated in terms of intentionally introduced set of geometric parameters characterizing the spatial orientation of symmetrically related zirconium octahedra in the structure, the coordination polyhedra volumes, their distortion indices, and bond angle variances.
1. Introduction
Elpidite is a natural microporous zirconosilicate with heteropolyhedral framework (i.e., a framework formed by SiO4 tetrahedra and ZrO6 octahedra) and ideal formula Na2ZrSi6O15 3H2O. Such compounds attract much attention due to the prospects of their wide application in chemical technologies as ion-exchangers, high-selectivity sorbents, catalysts, ion conductors, etc. [1].
The crystal structure of elpidite was first solved in 1963 by Neronova and Belov [2] in the space group Pbmm on a sample from the Lovozero (L) alkaline complex, Kola Peninsula, Russia. Subsequently, the structure of this mineral from the Lovozero complex was re-refined by different authors, in some cases in the acentric space group Pbm2 [3,4] or in Pbcm with one of the unit-cell parameters doubled [5]. Rietveld powder diffraction analysis has been applied in the latter case. The crystal structures of elpidite samples from another locality—Khan Bogdo (KB), Mongolia—have also been solved either in Pbm2 [6] or in Pbcm [7]. In 1973, Cannillo et al. [8] and in 2016, Cametti et al. [9] determined the elpidite crystal structure on samples from Mont Saint-Hilaire (MSH), Québec, Canada in space group (S.G.) Pbcm. Despite the observed differences in the space groups of different samples belonging to one mineral species and taken from the same or various localities, all studied compounds retain an equal structural topology that can be presented as a heteropolyhedral framework consisting of double Si6O15 chains (ribbons) connected by isolated ZrO6 octahedra [4].
Alternatively, this material structural topology can be presented as columns built up of isolated ZrO6 octahedra interconnected by three pairs of SiO4 tetrahedra. This method provides a better opportunity to illustrate structural modifications in elpidite that affect the framework upon ion-exchange or dehydration processes, and describes them well in terms of rotation and tilt angles (see next section). This approach has recently been used in an attempt to evaluate the structural evolution and framework flexibility exhibited by elpidite samples from the three above-mentioned locations when subjected to various laboratory treatments [10]. For this purpose, the previously reported single crystal structural data on natural elpidites and their modifications—K- and Rb-exchanged forms (KB) [7]; Ag-exchanged forms (L, KB) [4]; and dehydrated elpidite (MSH) [9]—were processed. A set of geometric parameters was introduced in order to evaluate the framework flexibility. The values of twisting and tilting angles of adjacent isolated ZrO6 octahedra, the effective diameters of the zeolitic channels, and certain distortion indices characterizing the status and evolution of the ZrO6 framework units were measured for each particular case and compared in order to evaluate the crystal-structural alterations taking place. In general, the data obtained illustrate that the elpidite structure responds to the applied laboratory procedures through framework modifications, resulting in doubling of the ~7 Å parameter(s) of the initial unit cells (Pma2 or Pbcm) and symmetry change to the Cmce space group with ~14-14-14 Å unit cell dimensions [10]. Regardless of the differences in the space groups of the starting, untreated material and its processed forms, all of them preserve a common framework topology. Another observation that reveals an important crystal structure feature is related entirely to the laboratory-treated elpidites, and can best be summarized through the comments of Cametti et al. [9], who attempted to determine the driving force mechanism of the Pbcm-Cmce transition. The authors interpreted the framework modifications observed upon dehydration of elpidite single crystal samples from the Mont Saint-Hilaire locality as “a rotation of rigid framework units (i.e., ZrO6 octahedra and SiO4 tetrahedra) and not a distortion in terms of strain or compression”. Similar crystal-structural behavior had already been noticed for other zirconosilicates by Pyatenko and Voronkov in 1977 [11]. The authors postulated that these compounds were not so prone to reconstructive polymorph transitions, but rather to those related to inessential distortions of the initial framework and short site shifts of the extra-framework cations (mostly Na+ and K+).
In 2011, Zubkova et al. [5] reported the results of their powder X-ray diffraction investigations on dehydration-induced structural transformations of the microporous zirconosilicate elpidite from the Lovozero (L) alkaline complex from the Kola Peninsula. Applying an ex situ experiment on powdered material from that locality that had previously been thermally dehydrated in an inert gas (argon) medium, the authors concluded that “…the transformation of the heteropolyhedral framework takes places after half of the water is removed from the mineral”. In their single crystal X-ray diffraction study [9], Cametti et al. noted that: “Under dry conditions, the structure started liberating water at 75 °C. At 100 °C, when it lost one H2O molecule, elpidite underwent a structural change from space group Pbcm to Cmce”. Both of these works pay attention to the structural transformations that occur in the studied material after partial water release during the dehydration process.
This study presents powder X-ray diffraction (PXRD) investigations and results obtained by application of the Rietveld method in an attempt to track the structural transformations and to evaluate the framework flexibility of the natural water-containing zirconosilicate elpidite, subjected (in bulk) to thermal treatment from room temperature to 300 °C. Previously, similar work was carried out on sample of another synthetically obtained small-pore hydrous sodium zirconosilicate—Na2ZrSi2O7·H2O [12]. Its structure is made up of Zr2Si6 “composite building units” (CBUs) identical to those that comprise the columns described above of isolated ZrO6 octahedra interconnected by three pairs of SiO4 tetrahedra found for the title compound. Powder X-ray diffraction data and the features of the Rietveld method as implemented in the GSAS software package [13,14] have been successfully used to refine the crystal structure of the synthetic small-pore zirconosilicate, as well as to monitor the occurrence of framework modifications upon the applied laboratory treatments (dehydration and protonation) [15,16]. In the present study, in situ time-resolved powder X-ray diffraction experiments were applied for data collecting. The obtained results were used to clarify the range of the temperature interval in which the Pbcm–Cmce phase transition takes place, and these investigations were accompanied by quantitative analysis, where applicable. A set of geometric parameters was introduced in order to characterize the spatial orientation of symmetrically related zirconium octahedra in the structure, the coordination polyhedra volumes (PV), their distortion indices (DI), and bond angle variances (BAV). Based on the results obtained from the Rietveld refinement, their values were measured and compared in order to track their structural evolution and to evaluate the elpidite framework topology modifications that occurred upon heating.
1.1. Parameters Characterizing the Elpidite Framework Topology
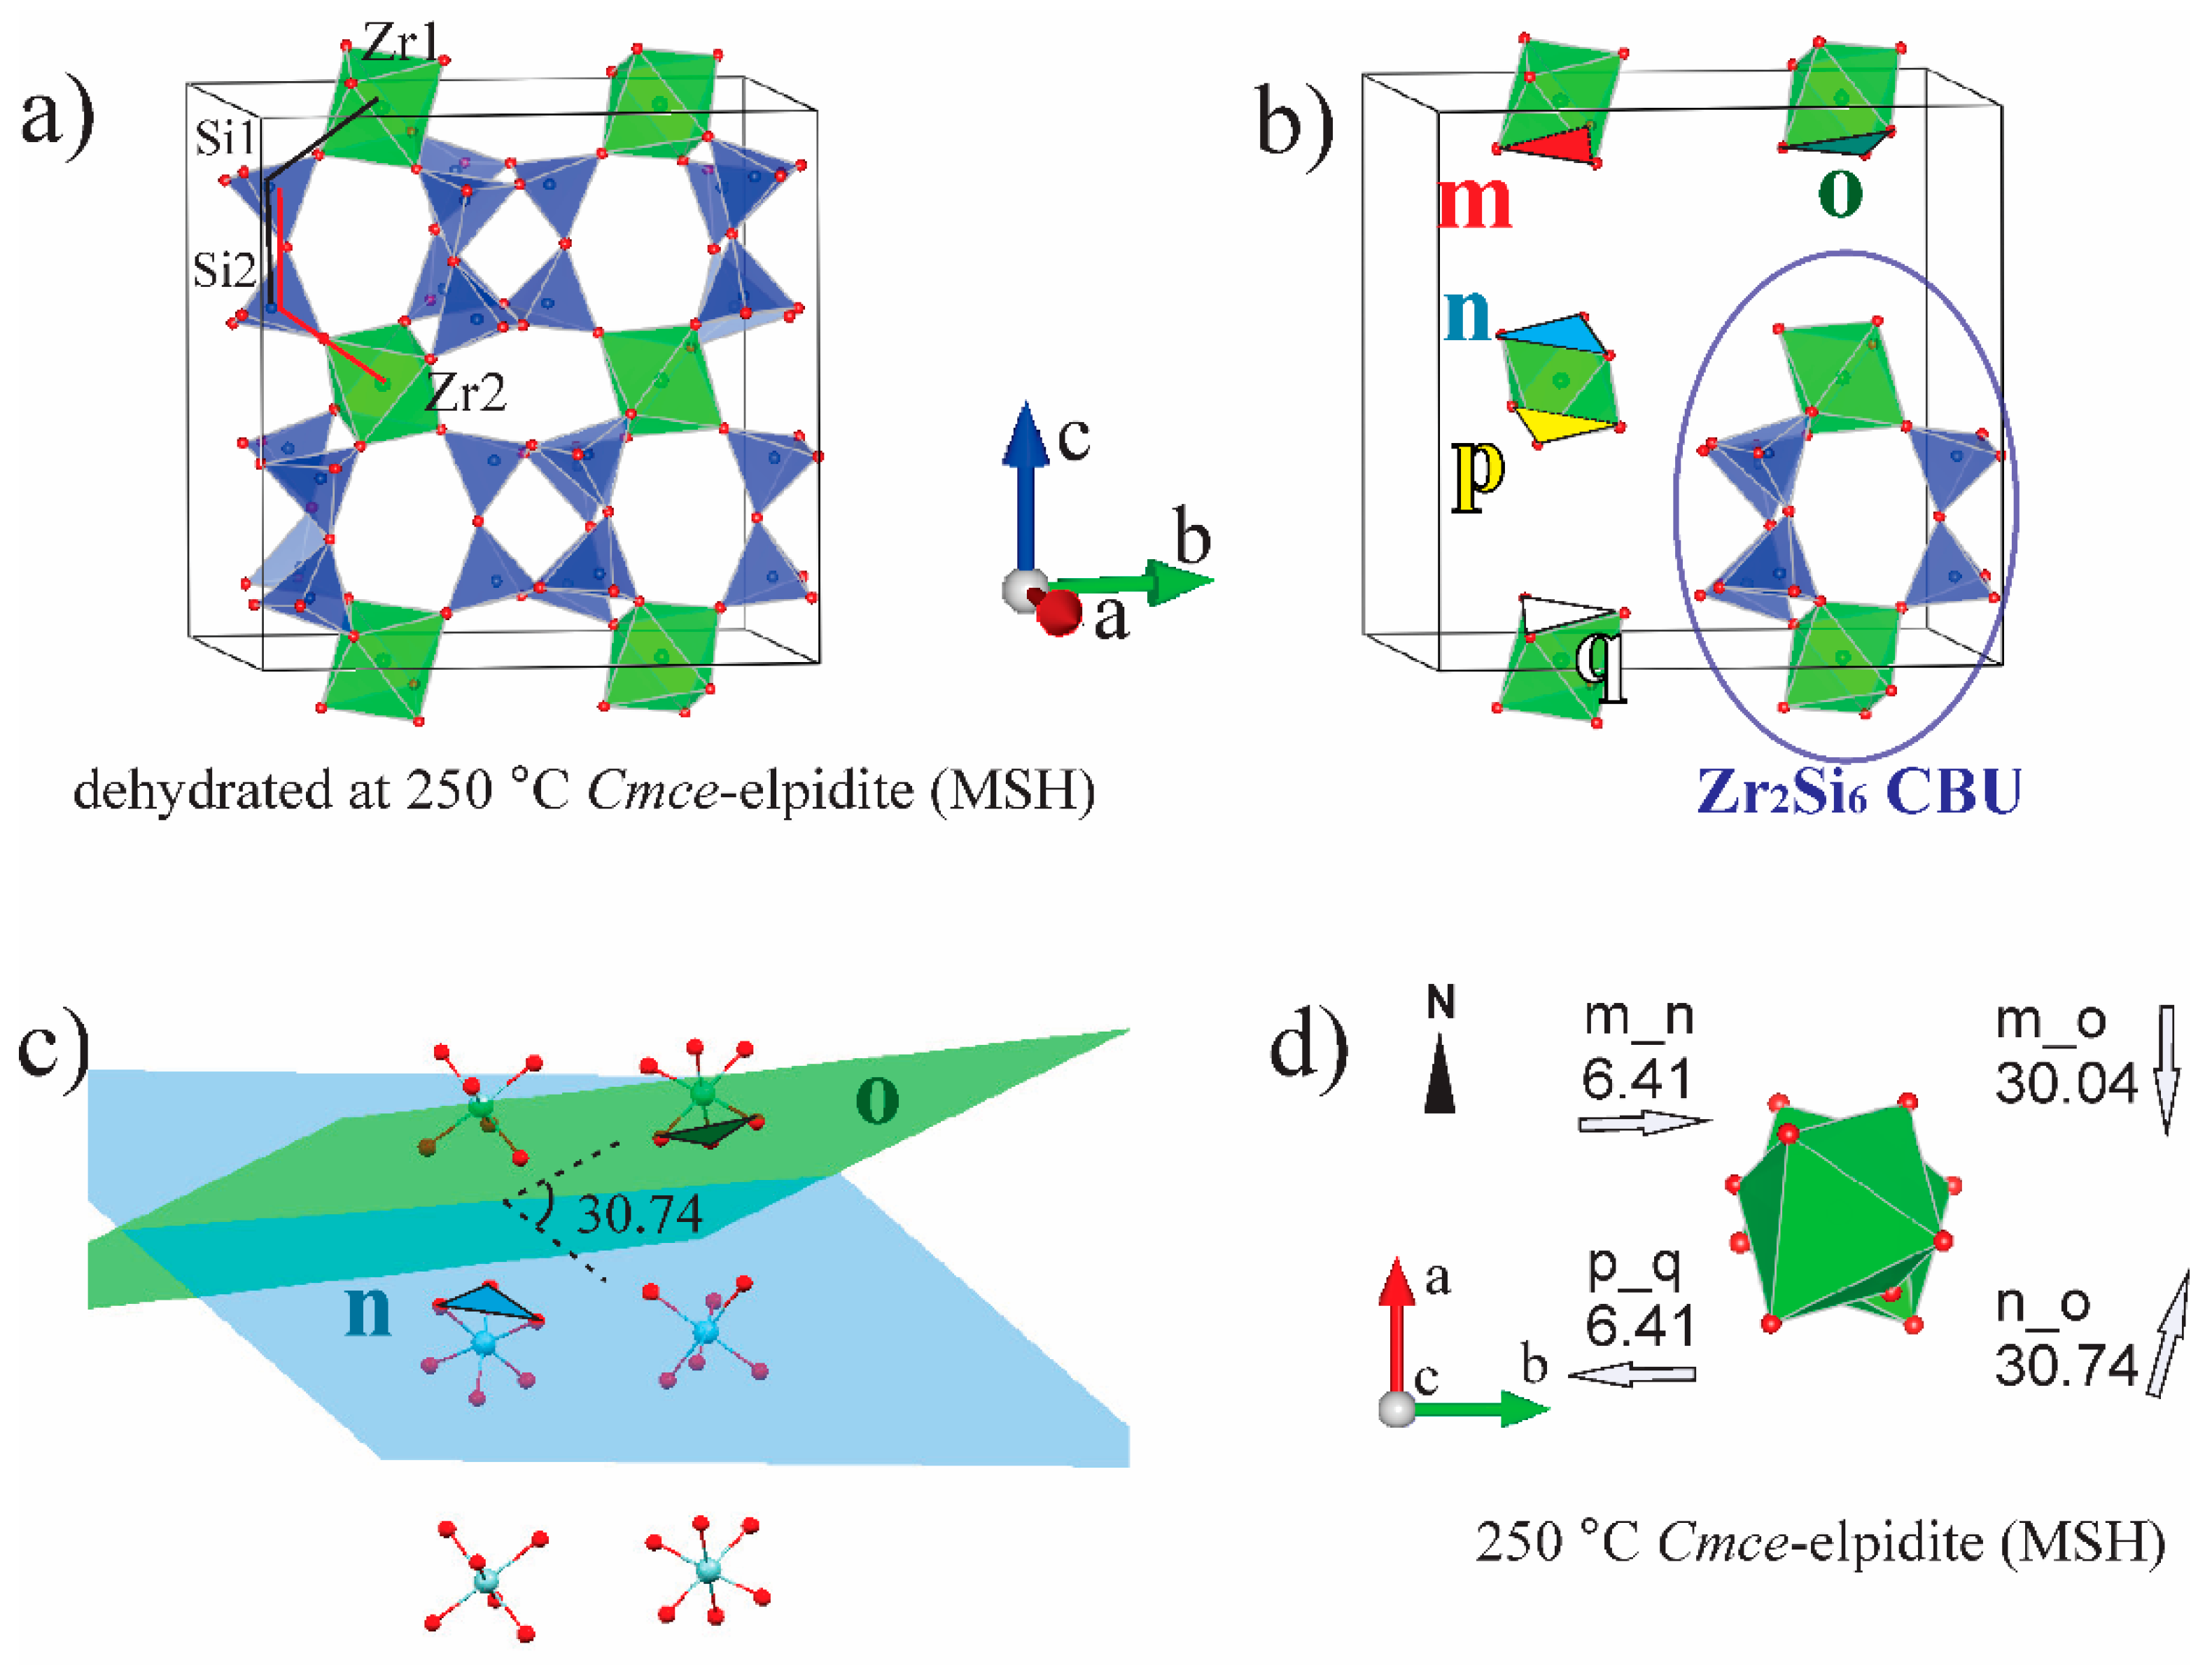
Presentation of the studied material framework topology as columns made up of isolated ZrO6 octahedra interconnected by three pairs of SiO4 tetrahedra provides the opportunity to introduce a set of geometric parameters in order to characterize the spatial orientation of adjacent zirconium octahedra in the structures of initial and thermally treated elpidite samples. Selected angles are presented in Figure 1 based on the example of the crystal structure of dehydrated at 250 °C Cmce-elpidite (MSH) [9].
Three dihedral angles can be measured within a single Zr2Si6 CBU. Every angle is defined by two planes each, set by three consequently positioned framework cations along the Zr-Si-O column length (along the c-axis in Figure 1a). Thus, for example, the three atoms labelled in the same figure as Zr1, Si1, and Si2 define one plane, and Si1, Si2, and Zr2 define another, allowing the measurement of the angle between them. This also holds for each of the other two diorthosilicate groups, together with the two zirconium atoms from the same CBU to which they belong. The values of the as-defined angles could illustrate the mutual rotation of two adjacent twist angles (ρ) along the c-axis zirconium octahedral.
In Figure 1b, certain faces of adjacent zirconium octahedra have been selected and designated as m, n, o, p and q for the Cmce-elpidite. Part of the SiO4 tetrahedra has been omitted for clarity. These faces designate the planes named with the same letters (Figure 1c). The angles between any two of these planes characterizes the mutual inclination between the selected faces of adjacent ZrO6 polyhedra—tilt angles m_n; m_o, n_o, and p_q, respectively.
The gray arrows around the zirconium octahedra presented in Figure 1d mark the direction of the dip angle between the correspondingly designated planes. Directions were measured as azimuth angles with respect to north (N = zero degrees) within the unit cell dimensions of the chosen crystallographic orientation. The numbers beside them present the values of the angles between the selected planes.
In this study, twist-, tilt- and azimuth-angles have also been measured for the crystal structures determined by single crystal X-ray diffraction of the initial unprocessed elpidite samples from Lovozero (Pma2) [4], Khan Bogdo (Pbcm) [7], and Mont Saint-Hilaire (Pbcm) [9], as well as for all reliable crystal structure refinements performed here. Later in this work, they will be used to track the structural evolution and to evaluate the framework flexibility of these materials occurring upon heating.
The angles introduced above can be used not only to illustrate the spatial orientation of adjacent symmetrically related zirconium octahedra, but also to evaluate the elpidite framework modifications taking place when subjected to laboratory treatments, e.g., heating and dehydration in this study. The specificity of each of the space groups describing the elpidite topology in terms of the introduced above angles values is summarized as follows:
- due to symmetry conditions, two of the twist angles within a single Zr2Si6 CBU, designated hereinafter as ρ2, have equal values for all three space groups and, together with the third angle, ρ1, illustrate the zirconium octahedra mutual rotation within the CBU.
- S.G. Pma2—1 = ρ2 = 0; m_n = n_o = p_q ≠ 0; m_o = 0.
- S.G. Pbcm—ρ1 = ρ2 = 0; m_n = p_q ≠ m_o ≠ n_o; all tilt angles ≠ 0.
- S.G. Cmce—ρ1 ≠ ρ2 ≠ 0; m_n = p_q; all tilt angles ≠ 0; m_n azimuth = p_q azimuth + 180 °C.
In addition to the parameters introduced above, the framework cation polyhedra volumes, their distortion indices, and bond angle variances were measured for the elpidite materials considered here. For the crystal structures refined in the present study, their values were also used to control the crystal-chemical plausibility of the results obtained from the applied Rietveld procedures (see Results).
1.2. Spatial Orientation of ZrO6 Octahedra in the Structures of Pma2-, Pbcm-, and Cmce-Elpidites
Three space groups have been established so far that well describe the elpidite topology, regardless of whether the studied samples have been found in this form in nature or whether they have been subjected to certain laboratory treatments. Figure 2 presents the spatial orientation of ZrO6 octahedra in the structures of Pma2-, Pbcm-, and Cmce-elpidites. The top views of four adjacent Zr-Si-O columns refer to: (a)—idealized scheme of elpidite framework topology; (b) crystal structure of unprocessed elpidite (L)—Pma2; (c) crystal structure of unprocessed elpidite (KB)—Pbcm; (d) crystal structure of dehydrated at 250 °C elpidite (MSH)—Cmce. The specificity in the spatial orientation of the four adjacent zirconium octahedra, presented in the respective projection for each space group structure, is represented by their numbering with numbers from 1 to 5. Within each of the crystal structures shown in the figure, polyhedral of the same number are characterized by an identical spatial orientation. For example:
- The case of S.G. Pma2 is characterized by the identical spatial orientation of the ZrO6 polyhedra, which are located adjacently in four neighboring unit cells; therefore, they are all marked with 1 (Figure 2b).
- Although symmetrically related, the two zirconium octahedra (numbered 2 and 3, respectively) that fall within a single unit cell in the (001)-plane of the Pbcm-elpidite (KB) are not identically oriented due to the fact that in this case, the m_o tilt angle ≠ 0 (see previous section, Figure 1b). Translations along the a-direction repeats them in the same order within the neighboring unit cell (Figure 2c). This arrangement leads to a doubling of one of the ~7 Å parameters of the unit cell, as compared with the previously considered space group Pma2.
- At present, S.G. Cmce has only been registered for elpidite materials subjected to certain laboratory treatments (ion-exchange, heating and dehydration). The framework modifications that occur during the application of this procedure lead to a checkerboard arrangement of the Zr2Si6 structural units, subsequently causing the remaining unit cell parameter to be doubled to a value of approximately ~14 Å. Thus, two pairs of ZrO6, labelled 4 and 5, respectively, fall within a single unit cell (Figure 2d).
2. Materials and Methods
The sample used in this study for tracking the structural transformations and evaluating (in bulk) the framework flexibility of the elpidite material upon thermal treatment originated from a hydrothermal occurrence on Mount Alluaiv in the Lovozero alkaline massif (Kola Peninsula, Russia) [5].
2.1. Analytical Procedure
The time-resolved PXRD measurements were collected using a PANalytical Empyrean equipped with a multichannel detector (Pixel 3D) (Malvern Panalytical, Malvern, UK) using Cu Kα, 40 kV–30 mA radiation in the 5–90° 2θ range, with a scan step of 0.026° for 57 s. The in situ HT-XRD measurements were carried out by means of an Anton Paar HT-16 camera (Anton Paar GMBH, Graz, Austria) with a sample directly heated with a heating Pt filament from room temperature to 300 °C. All experiments were conducted in air with heating rate of about 10 °C per minute. PXRD patterns were collected for this material at 25, 45, 60, 75, 90, 100, 125, 140, 165, 200, 250, and 300 °C. The choice of the temperature steps at which the in situ PXRD measurements were performed in this study were strongly influenced by the work of Cametti et al. [9]. The authors reported crystal data for elpidite at the following points: at room temperature (Pbcm); heated to 50 °C (Pbcm); heated to 100 °C and partially dehydrated (Cmce); and heated to 250 °C and anhydrous. These in situ single crystal diffraction studies provided valuable information for the main stages in the thermal evolution of this compound, including its Pbcm-Cmce phase transition, which occurs upon partial dehydration within the temperature interval 50–100 °C. The above-mentioned temperatures were used as guiding markers for the total construction carried out in the present study. Additional steps were carried out in an attempt to shed more light on the temperature range in which the phase transition occurs, as well as to provide new knowledge of the framework flexibility of the studied material.
2.2. General Notes on the Structure Rietveld Refinements
The Rietveld analyses were performed using the GSAS-EXPGUI suite of programs ver. 3.0 (R.B. Von Dreele, B. Toby, Argonne National Laboratory, Lemont, IL, USA) (Larson and Von Dreele [13]; Toby [14]). For all temperature steps, the Bragg peak profile was modelled using a pseudo-Voigt function with a 0.01% cut-off for peak intensity; the background curve was fitted using a Chebyshev polynomial with 16 variable coefficients; the scattering curves of neutral atoms, as stored in GSAS, were used; no corrections were made for absorption; soft constraints were imposed on Zr-O and Si-O distances; and the same Restraint Weighting factor (RWf) was used throughout the refinement procedure. All atoms were refined isotropically. Expecting similar Uiso values for the O atoms, these were refined in a group. The same was performed for the Na and Si atoms.
2.3. Choice of the Starting Crystal Structure Model
As noted previously, the unprocessed natural finds of elpidite crystallize as in the Pma2 and Pbcm space groups. The Pma2 S.G. refers to those cases in which the values of the m_n, n_o, and p_q angles are equal to each other as well as to that of angle m_o = 0 (Section 2 and Section 3). However, the framework flexibility of the studied material allows such values for the m_o angle that may differ from zero, but without excluding it. Consequently, should one need to refine such an initial material structure in bulk, it is appropriate to use the more “flexible” Pbcm space group, especially as Pma2 is its symmetrical subgroup.
Despite the close resemblance between the simulated PXRD patterns of elpidite representatives, the crystal structures of which have been determined in the three above-mentioned space groups (e.g., single crystal data for the unprocessed samples (L—Pma2) and (KB—Pbcm) [4], and the sample dehydrated at 250 °C (MSH—Cmce)), certain subtle differences can still be observed. Thus, a careful inspection of the PXRD pattern of the Lovozero elpidite sample collected at room temperature revealed a low intensity reflection at 22.87° 2Θ that has subsequently been successfully identified as the (131)-reflection for cases in which the Pbcm space group was applied in refinement. This line is, however, missing in terms of its Bragg-position tick in the simulated pattern for the other group. That observation additionally justifies the choice of the Pbcm S.G. crystal structure of elpidite (KB [7]) as a starting model in the Rietveld refinement procedures carried out in the present study.
2.4. Notes on the Strategy Applied for the Structure Refinement Procedures in This Study
An important point in the present study is to clarify the range of the temperature interval in which the Pbcm–Cmce phase transition takes place. For this purpose, the Rietveld refinements for the experiments performed at 45, 60, 75, 90 and 100 °C were applied both as single phase (Pbcm or Cmce structure model) or as two-phase (Pbcm and Cmce starting structure models) procedures. The investigations were accompanied by quantitative analysis, where applicable. The outcomes of this approach are set out in the Results Section.
For the purpose of more objective comparison of the results obtained from the structure refinements at various temperature steps, the Rietveld procedure applied for each of them was performed in a strictly specified sequence. When the process is repeated at each subsequent higher-temperature stage, the structure files obtained for the phase(s) refined at the previous stage are used as starting structural model(s).
In GSAS, so called “soft constraints” or “restraints” are used. This provides opportunities for scientists who wish to “push” the model towards certain expectations (for example, bond lengths), but do not require that expectation to be maintained. Their application requires the specification of a tolerance range for the values of each expectation. Each expectation is weighted by the uncertainty (sometimes s.u. or E.S.D.) of the expectation, as well as the overall Restraint Weighting factor (RWf). The lower the uncertainty and the higher the Restraint Weighting factor, the more strongly the model will be “pushed” towards following that expectation. Soft constraints affect the refinement, and their relative contribution to the total CHI^2 in the final stages of the refinement procedure should be reported [17].
In this study, soft constraints consisting of both Zr–O and Si–O bond distances were introduced for all of the refinement procedures. After preliminary trials, the overall RWf was fixed at 20,000 for all stages of the refinement. The tolerance range was fixed to 1.001 for each bond length value of the corresponding starting structural model. Attempts to decrease this value or to release the restraints in the final refinement cycles for some of the higher-temperature experiments led to substantial structural distortions, unrealistic bond distances and angle values, and/or lack of convergence.
This approach directs the refinement procedures in a way that retains the approximate equivalency of the cation–oxygen bond lengths in the framework-constructing polyhedra, which is an important prerequisite for keeping them non-deformed during thermal treatment actions. This, is consistent with the observations of previous authors regarding the rigidity of the framework units (i.e., ZrO6 octahedra and SiO4 tetrahedra) that is typical for the studied and similar materials [9,11] (see the Introduction). The applied strategy does not provide optimal results in terms of the statistical parameters illustrating the quality of the refinements; however, their values still remain reliable for the correctness of the structural model choice and generally of the procedures carried out (Table 1). In most cases, the crystal structures obtained at various temperature steps provide opportunity to carry out measurements, providing evidence that the bond length deviations of the polyhedra do not exceed 5% of their ideal values (Si-O = 1.61 Å; Zr-O = 2.07 Å). As for the bond angles, the deviations reach values less than 15% removed from their ideal values: O-Si-O = 109.5°; O-Zr-O = 90, 180°. These deviation values have been assumed to be permissible in the present study. Exceptions were observed for the phase transition period observed within the temperature range from 60 to 90 °C. These will be discussed in the Results and the Discussion sections.
2.5. Visualization
The following programs were used for graphic presentations:
- WinPLOTR utilities ver. June 2020 (Thierry Roisnel, Rennes, France) as a Windows tool [18] (powder X-ray diffraction patterns);
- VESTA ver. 3.3.2 (Koichi Momma, Tsukuba, Japan) [19] (visualization of certain structure and topological motives, calculation of torsion/dihedral angles, framework cation polyhedral volumes (PV); distortion indices (DI); and bond angle variances (BAV);
- Mercury ver. 3.7 (Cambridge Crystallographic Data Centre (CCDC), Cambridge, UK) [20] (tilt angle measurements).
3. Results
The PXRD patterns simulated from the in situ single crystal studies of Cametti et al. [9] (CIF files were taken from the supplementary material of the online version) provide valuable guidance as to how to distinguish the elpidite materials before and after the phase transition in this study.
The PXRD pattern heated at 50 °C (Pbcm) (not shown here) exhibits its four strongest lines as follows: (1) (024) at 27.26 2Θ° and d = 3.269 Å; (2) (100) at 12.44 2Θ° and d = 7.11 Å; (3) (221) at 28.53 2Θ° and d = 3.127 Å; (4) (022) at 17.12 2Θ° and d = 5.176 Å.
The PXRD pattern heated and partially dehydrated at 100 °C (Cmce) (not shown here) exhibits its four strongest lines as follows: (1) (200) at 12.53 2Θ° and d = 7.059 Å; (2) (421) at 28.75 2Θ° and d = 3.103 Å; (3) (024) at 27.68 2Θ° and d = 3.22 Å; (4) (022) at 17.32 2Θ° and d = 5.117 Å. A characteristic feature in the pattern of this material indicating the occurrence of this phase is the low-intensity reflection (111) at 10.67 2Θ° and d = 8.286 Å.
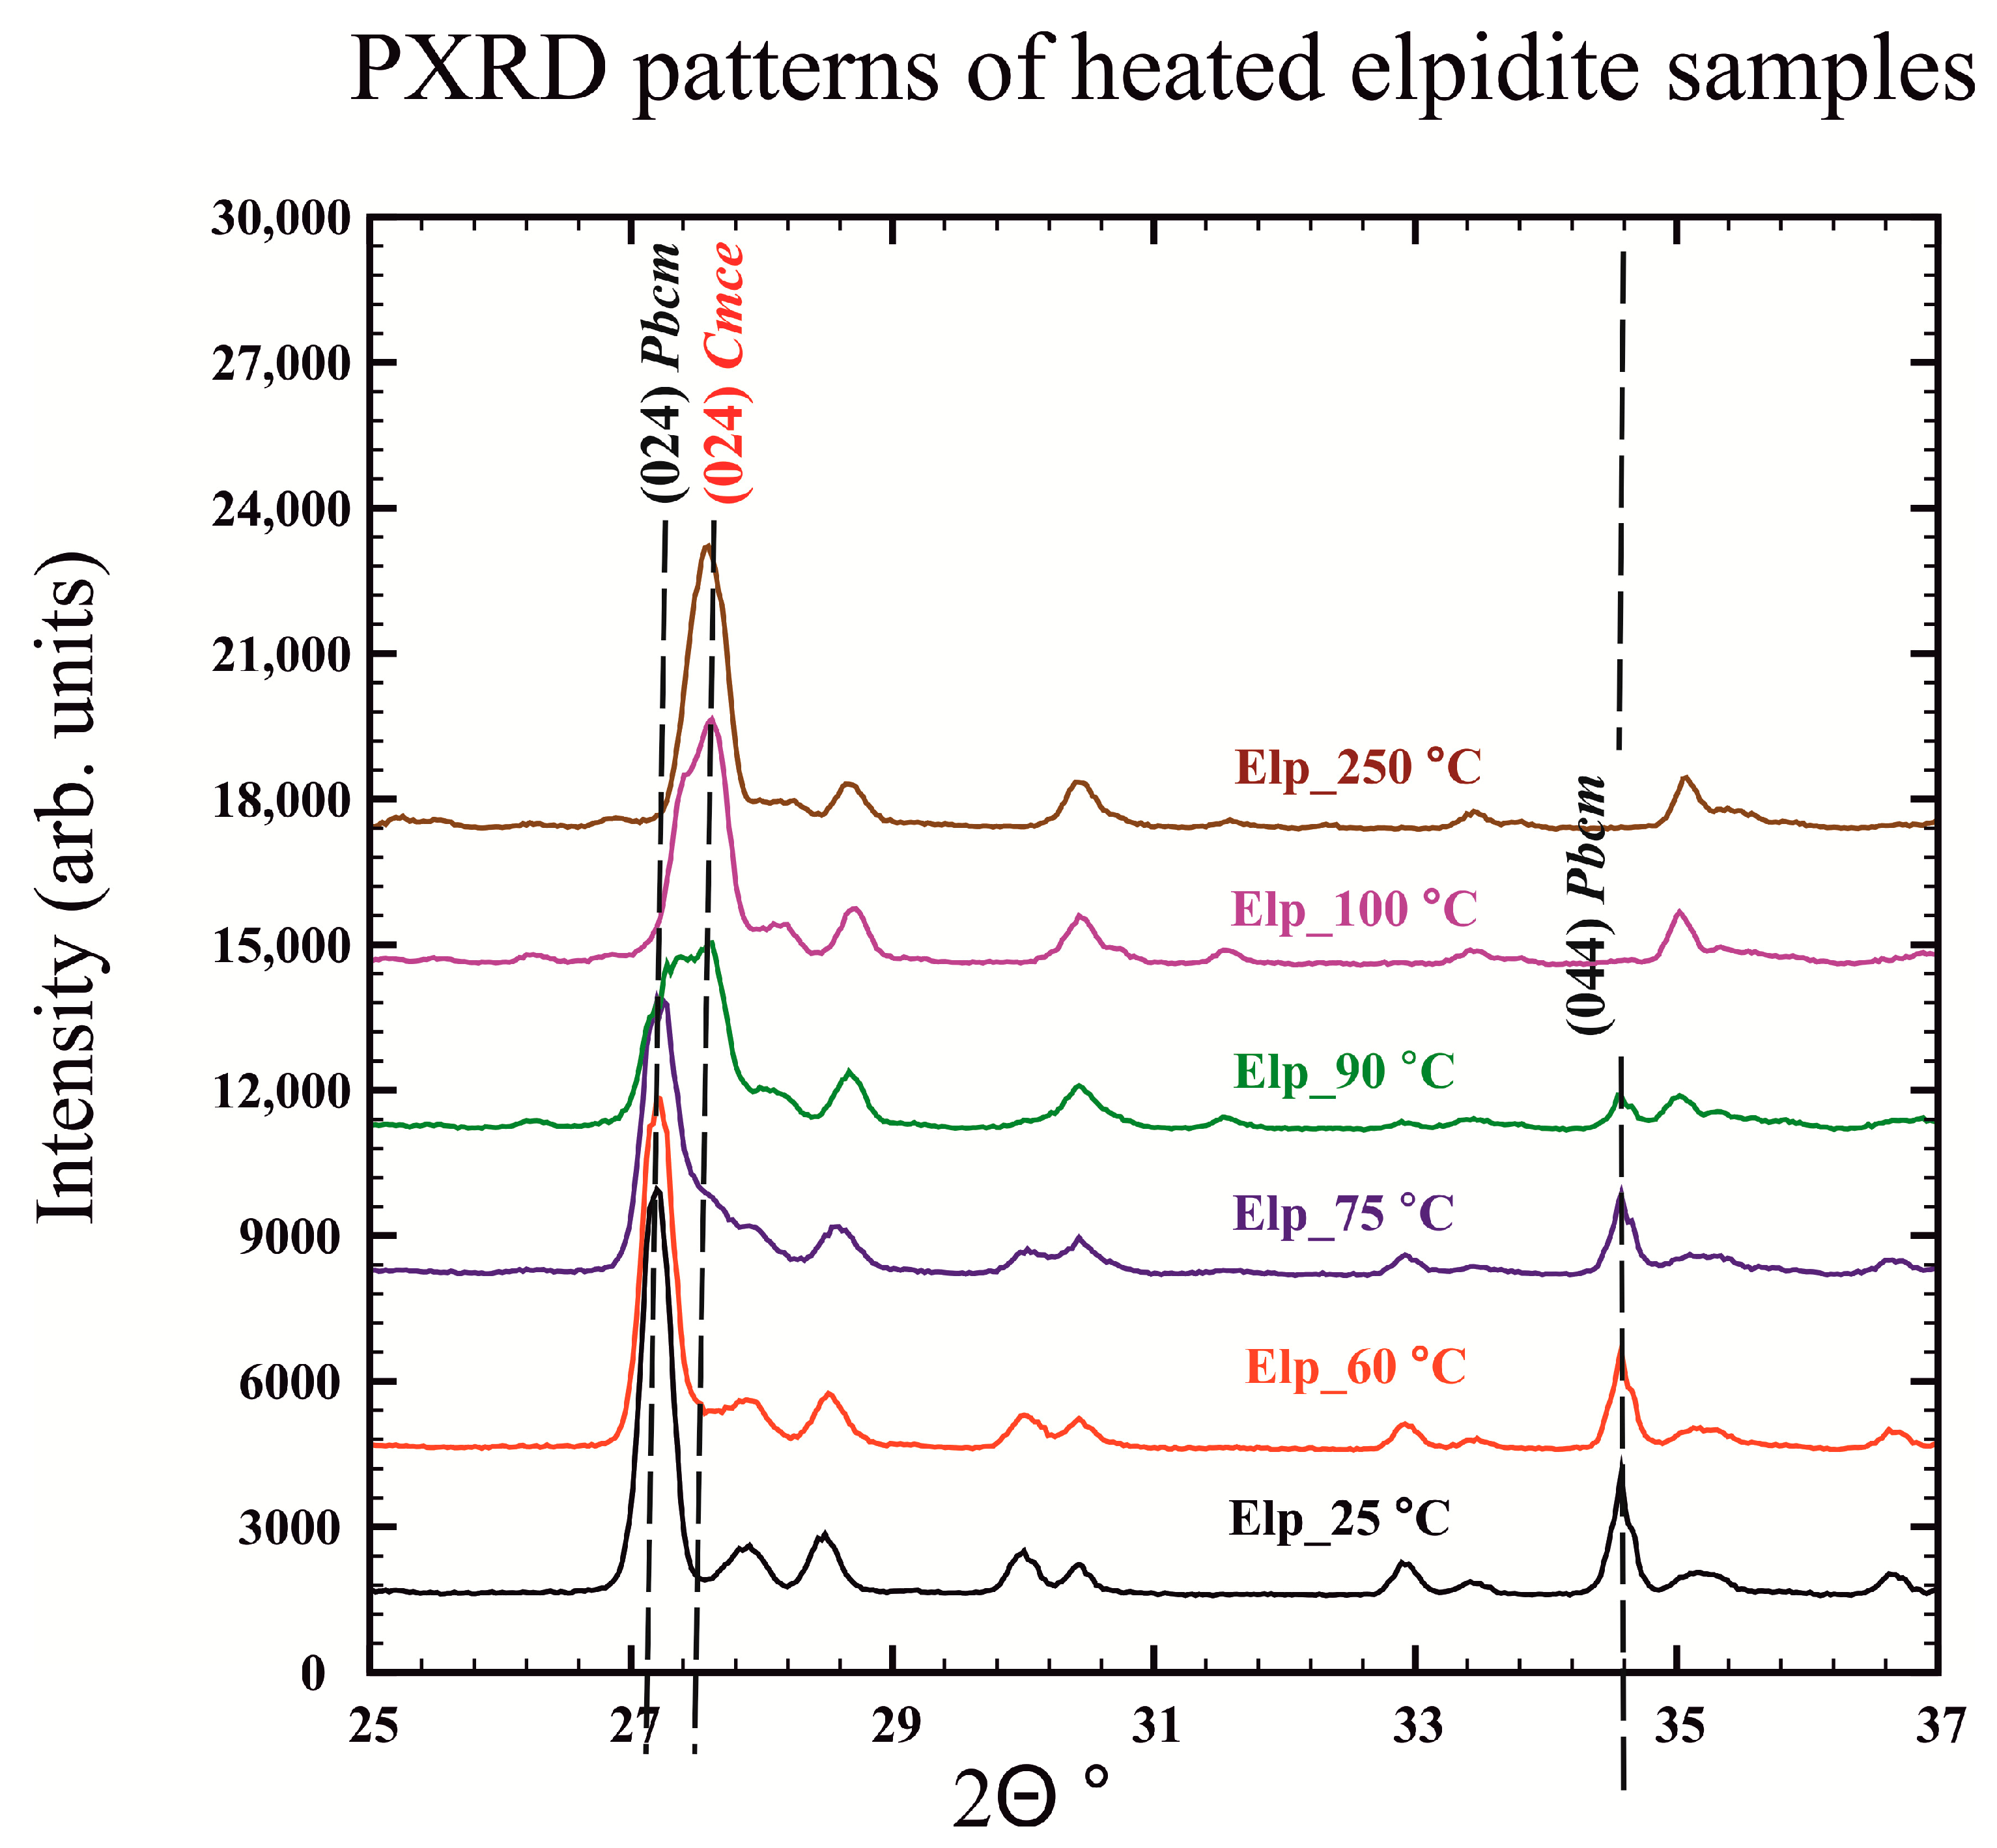
The above data reveal that reliable distinguishing between the two materials in the real PXRD patterns collected in situ in this study is possible in the middle-angle 2Θ° range. Figure 3 presents the PXRD patterns of heated elpidite samples in the 2Θ range between 25 and 37°. The occurrence of the Cmce-phase is evidenced by the appearance (initially as a “shoulder” of its adjacent peak) of its strong intensity (024) reflection at approximately 27.7° 2Θ. Preservation of the Pbcm-phase is marked by its (044) reflection at approximately 34.6° 2Θ, which can be observed at least within the temperature interval between room temperature and 90 °C. The two-phase structural refinement procedures as described in the previous section, and which were applied for the experiments at temperatures of between 45 and 100 °C, appeared to be successful only for the temperature range 60–90 °C. At 45 °C, only (Pbcm)-elpidite could be reliably refined. The same holds for the (Cmce)-elpidite at 100 °C.
For those cases in which a quantitative phase analysis could have been performed, the results are as follows:
- approximately 70% (Pbcm) vs. 30% (Cmce) weight fractions for the 60 °C experiment;
- approximately 50% (Pbcm) vs. 50% (Cmce) weight fractions for the 75 °C experiment;
- approximately 24% (Pbcm) vs. 76% (Cmce) weight fractions for the 90 °C experiment.
Inspection of the crystal chemical plausibility of the results obtained after the structure measurements of both elpidites for the same temperature range reveal that:
- For the 60 °C experiment, only for the Pbcm-phase measurements provide evidence that the polyhedra bond length deviations do not exceed 5% of their ideal values and that the bond angle deviations reach values of less than 15% from their ideal values. The Cmce-phase undergoes considerable structure distortions in terms of bond angle values, and was subsequently excluded from consideration in the present study;
- For the 75 °C experiment, both phase structures were seriously affected by distortions, which makes their crystal chemistry implausible, and their results have not been reported further, here;
- For the 90 °C experiment, only the structure data for the Cmce-phase appear to be reliable, and those for the Pbcm-phase were defined as implausible and excluded from further consideration.
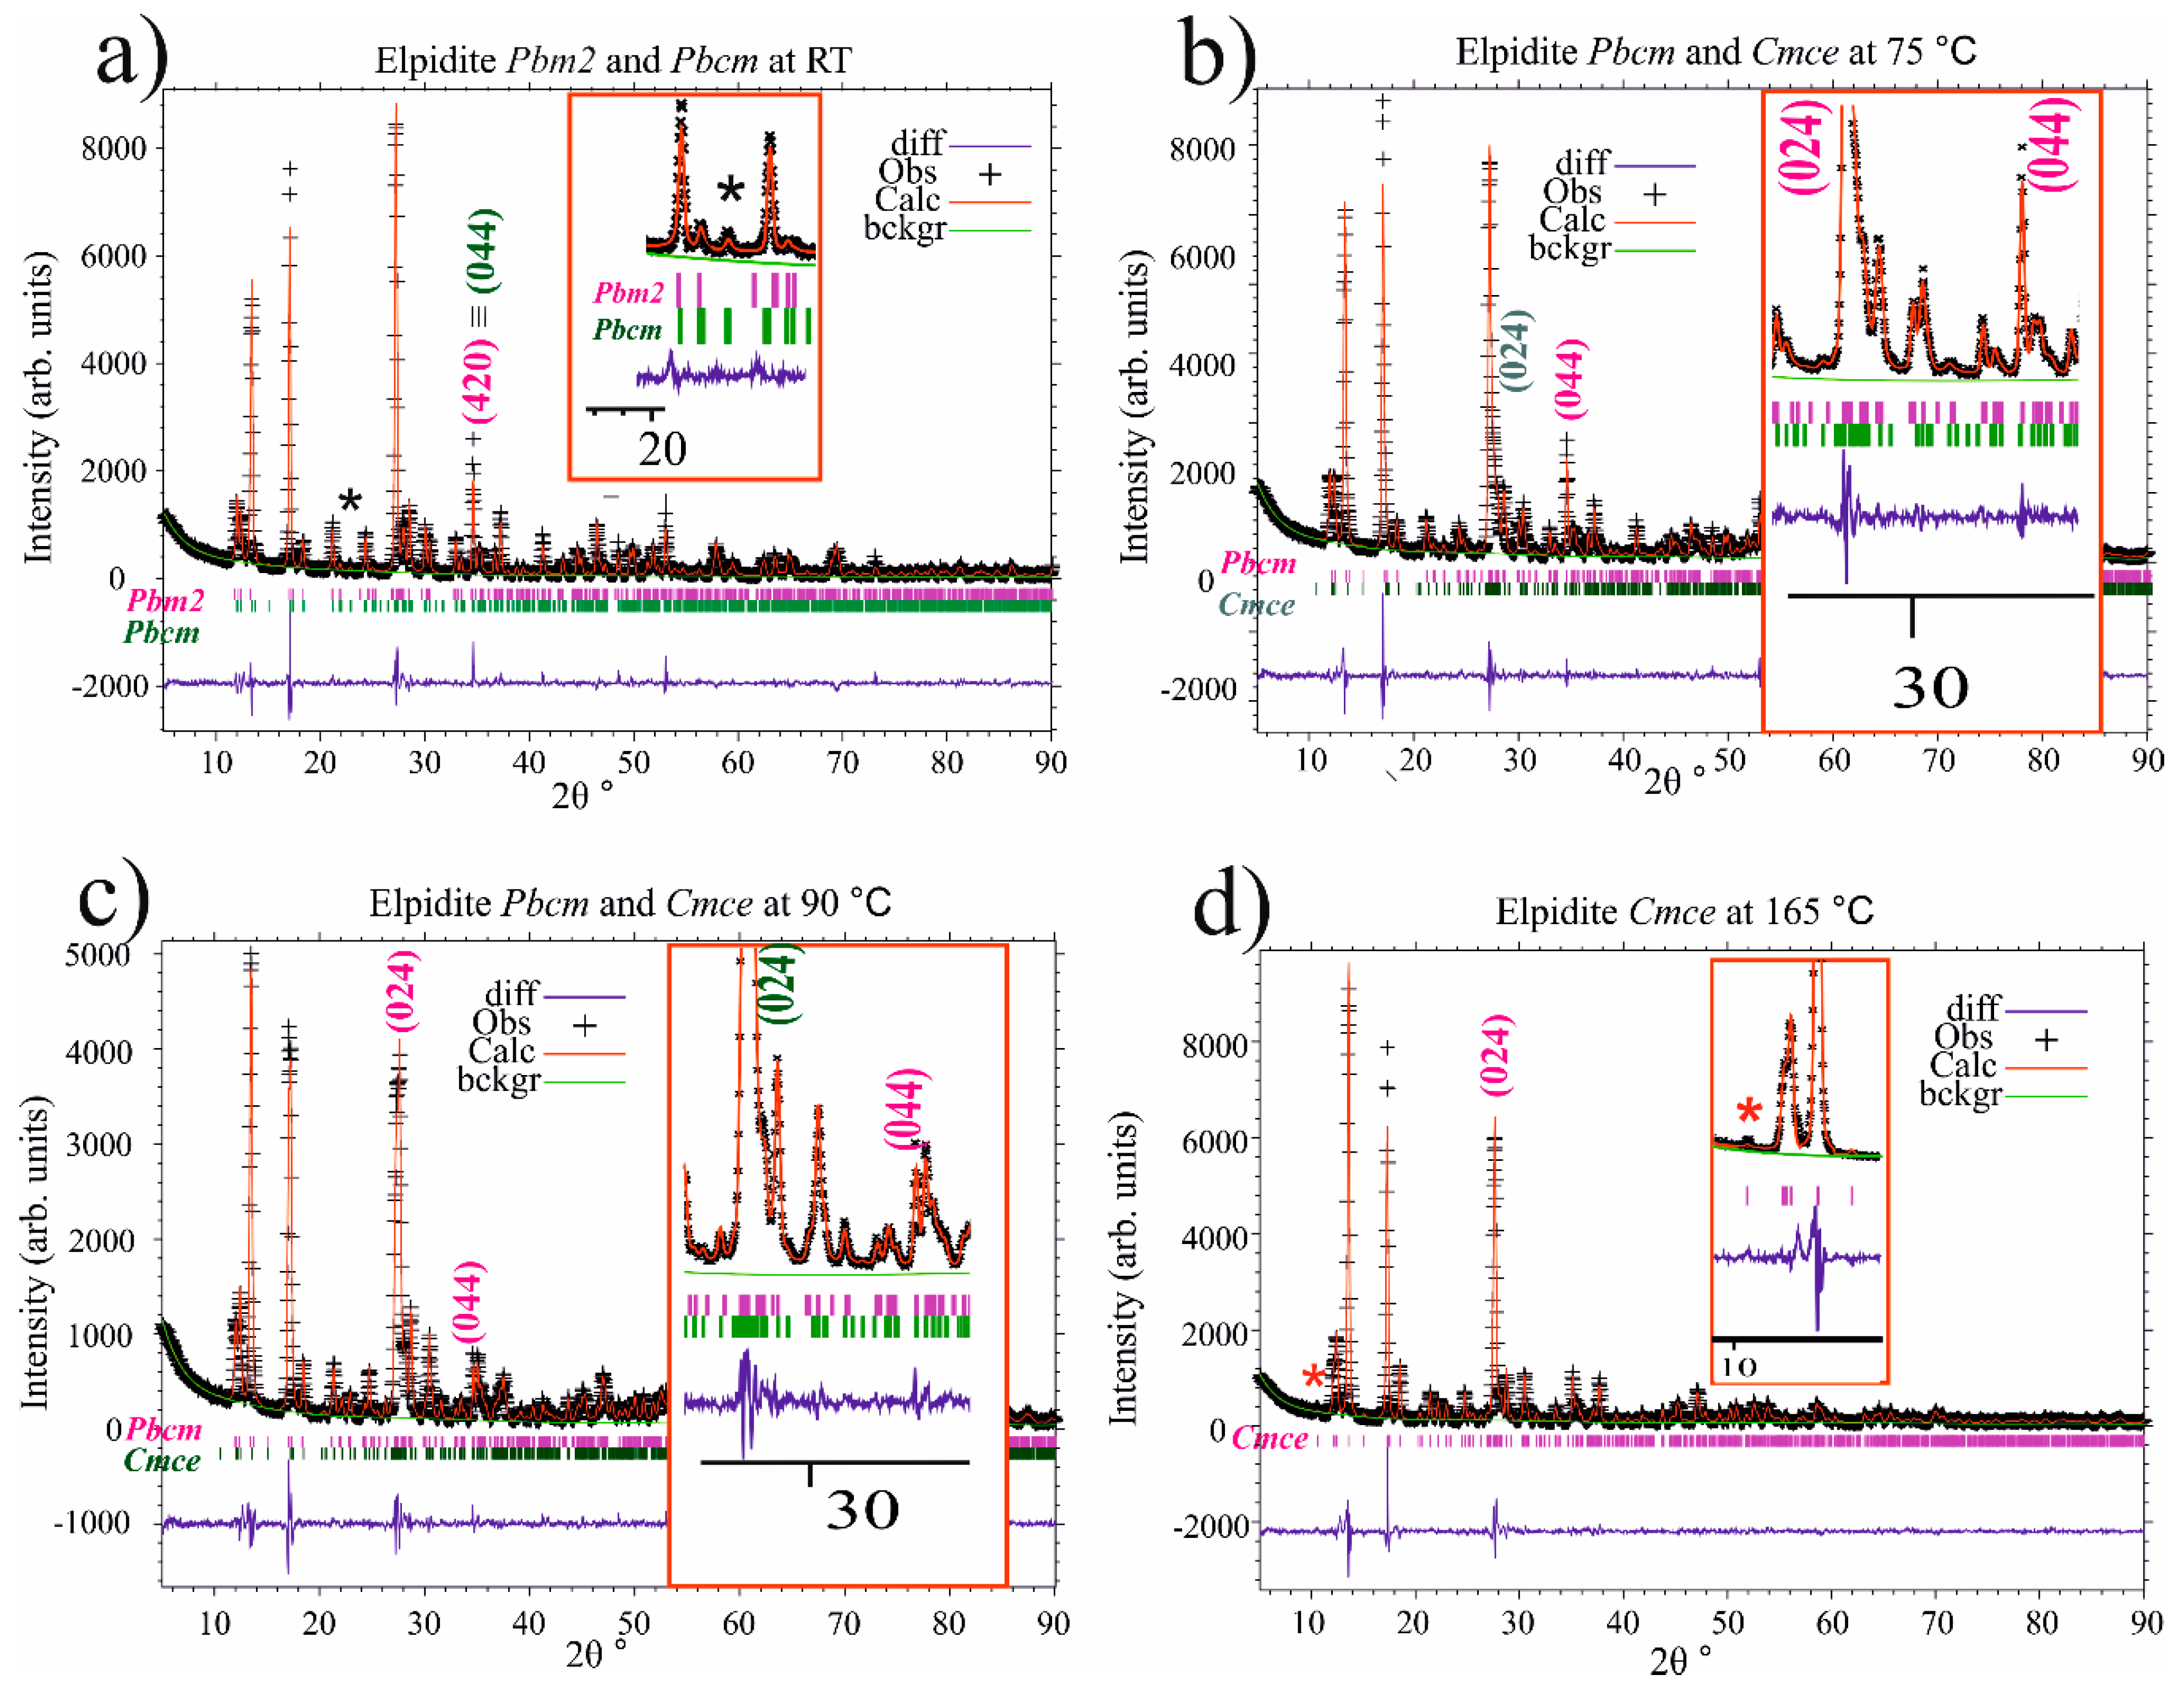
Figure 4 presents selected Rietveld refinement plots for thermally treated elpidites that best illustrate the occurrence of structural transformations in the studied material. Figure 4a is a graphical image of an attempt to apply a simultaneous two-phase structural refinement including the Pbcm- and the Pma2-phases as starting structure models. The results from this were not as satisfactory as using the Pbcm model as a single starting one point. The inset, however, reveals the low-intensity reflection at 22.87° 2Θ, which was successfully identified as the (131)-reflection when the Pbcm space group was applied in the refinement, and which was missing from the theoretical pattern for the Pma2 space group. The insets of Figure 4b,c provide additional evidence for the two-phase coexistence within the temperature range 60–90 °C. The lack of an amorphous halo was noted for all of the PXRD patterns presented in Figure 3 and Figure 4.
Table 1 contains data for the lattice parameters and some refinement details (powder data statistics) for selected elpidite samples thermally treated within the investigated temperature range.
The following two tables (Table 2 and Table 3) present the positional and thermal parameters of the atoms in the structure of elpidite (Pbcm) at 25 °C and heated to 60 °C (Table 2) and elpidite (Cmce) heated to 90 °C and to 165 °C (Table 3), as obtained from the in situ time-resolved PXRD studies.
Uiso for elpidite (Pbcm) at 60 °C not refined; values taken from the previous refinement stage conducted at 45 °C.
Table 4 contains data for selected bond distances (measured only for framework cations and oxygen atoms) for representative elpidite samples, revealing the impact of the chosen Restraint Weighting factor (RWf) over the obtained values in terms of their deviation from the corresponding ideal ones.
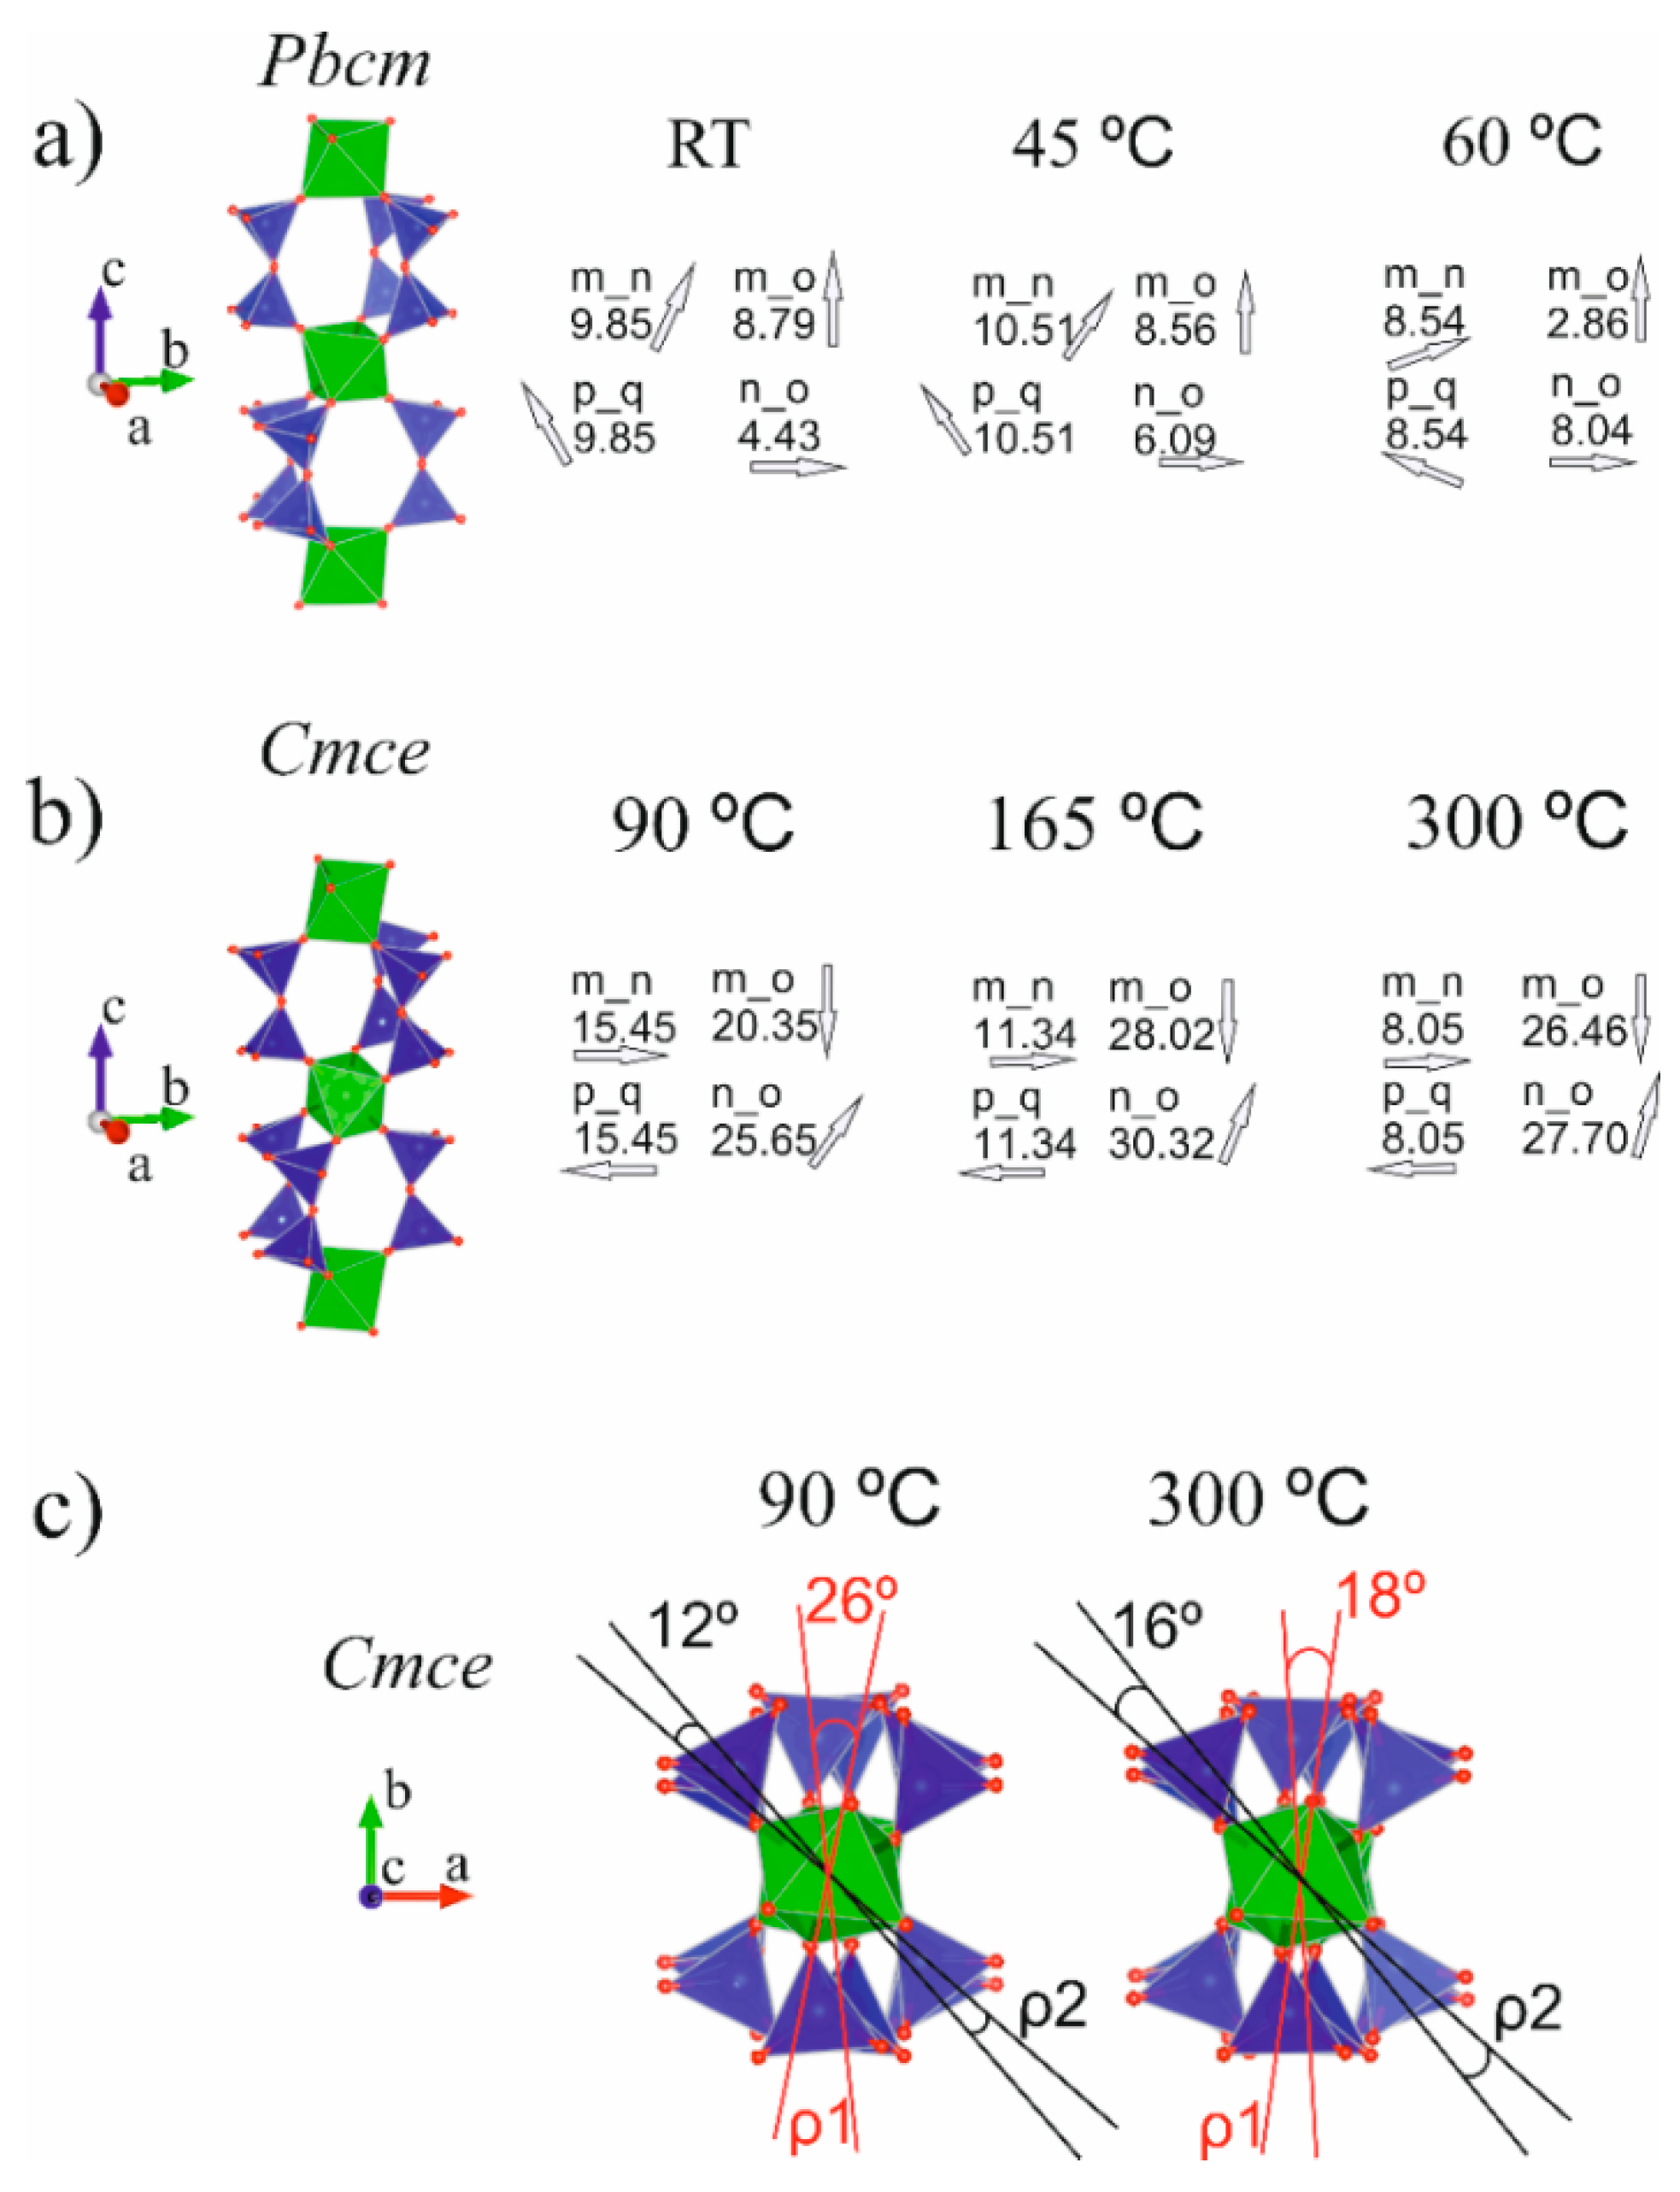
Figure 5 illustrates the elpidite framework topology evolution upon thermal treatment in terms of the twist- tilt- and azimuth-angles introduced above (see also Figure 1d).
Table 5 presents data for the geometric parameters introduced in Section 2 with respect to the framework topology evolution of the studied material. It also allows comparison between selected angles and the distances measured from single crystal structural data provided by previous investigations (upper part of Table 5) and those obtained in the PXRD studies presented here (lower part). In the course of the measurements performed in this study, it became clear that the bond angle variances (BAV) values are able to serve as criteria for the crystal chemical plausibility of the obtained structures. It was established that when they exceed magnitudes of approximately 30 (°)2 (BAV for ZrO6, column 10) and approximately 60 (°)2 (BAV for SiO4, column 13), the bond angle deviations significantly exceed 15% with respect to their ideal values. The measured coordination polyhedra volumes (PV) and their distortion indices (DI) (columns 8, 9, 11, and 12) generally reveal the compatibility of the single crystal and the powder X-ray diffraction results. Rows 8 and 9 contain only data for the most abundant phase derived from the two-phase procedures.
4. Discussion
The results presented here show that the framework construction of the studied mineral responds to the applied thermal treatment by twisting and tilting its more-or-less rigid units (i.e., ZrO6 octahedra and SiO4 tetrahedra), which results in symmetry changes, while the overall structural topology remains preserved. Two stages in structural evolution were clearly outlined: (i) phase transition at 25–100 °C; and (ii) thermal expansion at 100–300 °C.
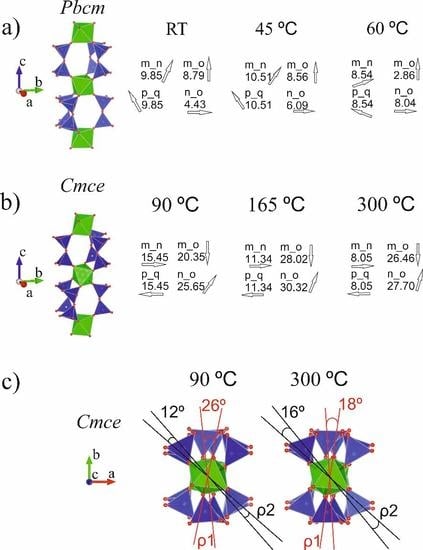
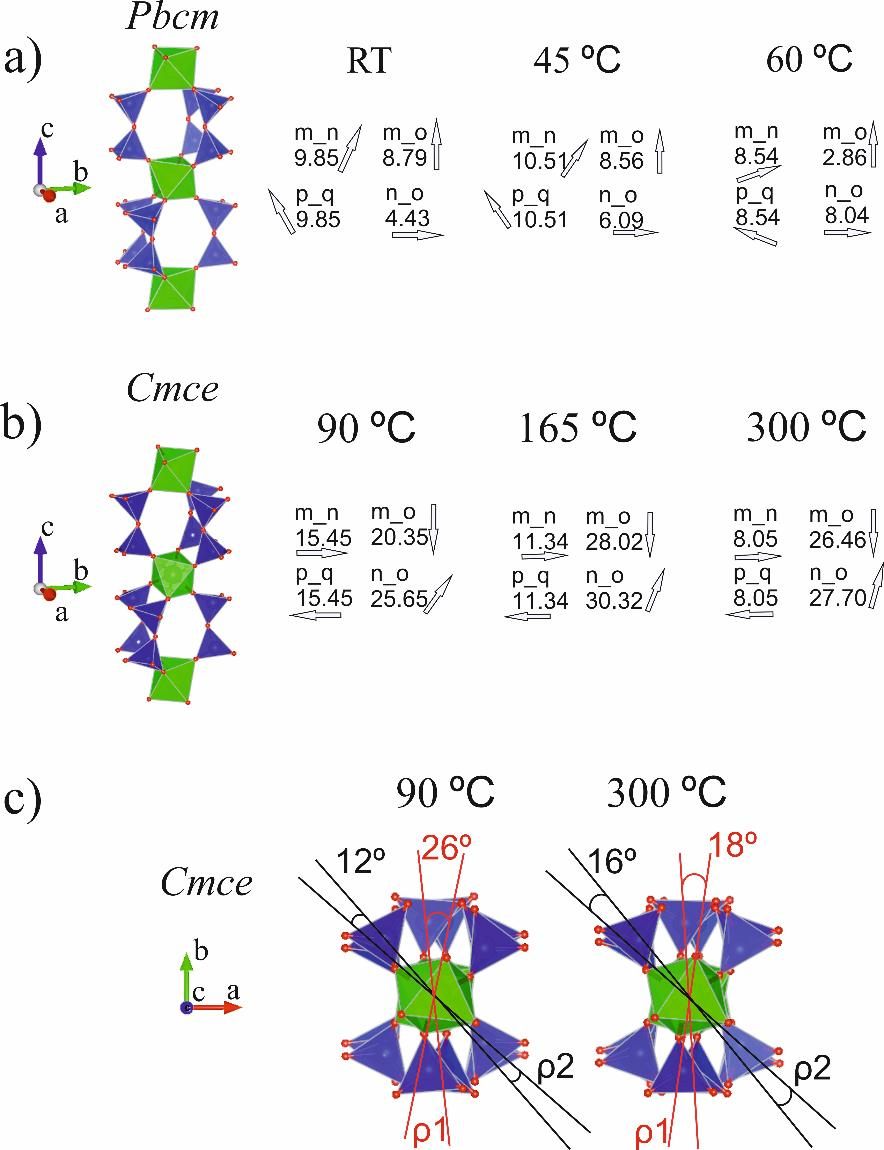
(i) Up to 45 °C, there were no indications of phase transition and the singly present Pbcm-phase structure responded weakly to the increase in temperature. Within the temperature range 60–90 °C, strongly distorted values of the measured interatomic distances and angles were registered for the structural models included in the Rietveld procedures. The phases that were quantitatively less represented were much more affected by this distortion, which makes the results unreliable from a crystal chemical point of view (see Results section). It is assumed here that the features of the space groups involved in the refinement (Pbmc and Cmce) were insufficient to fully, adequately and comprehensively reflect the structural changes occurring in this temperature range. Only at temperatures above 90 °C did the Rietveld refinement provide reliable results for the newly converted phase. Although a large portion of the crystal chemical data obtained for the temperature range 60–90 °C were rejected as unreliable, the severe deviations from the ideal values registered can be accepted as signs of the phase transition(s) occurring therein. This occurs as a result of the gradual loss of a portion of the water entering the crystal structure of the studied mineral without disturbing its framework topology. The data obtained for elpidite studied in bulk for the phase transition temperature interval are in good agreement with the results from the in situ single crystal studies of Cametti et al. [9]. The authors reported that the elpidite structure was solved in the Pbcm space group at temperatures up to 75 °C, and their partially dehydrated Cmce-sample was measured at 100 °C. The lack of a clearly expressed amorphous halo in the PXRD plots presented in Figure 3 and Figure 4 can be considered to be an additional indication of the topotactic non-reconstructive phase transition accompanying the structural evolution of the mineral studied in this stage. The most tangible result of this conversion is the mutual rotation of the isolated ZrO6 polyhedra that are adjacent along the Zr-Si-O column length. Some of the twist-angles measured in this work exceed 25°. The values of the tilt-angles fluctuate mostly in response to the motion of water molecules (Table 5, Figure 5c).
(ii) The unit cell volumes of the Cmce-elpidite left over in the heated sample from the previous stage gradually decrease between 90 and 165 °C (Table 5, column 13). This shrinkage is considered to be due to the weakened impact of the thermal motions of water, as a result of its partial release in this temperature range and the previous one. Between 165 and 300 °C, the unit cell volumes increase their values, which means that the thermal expansion dominates over the water loss process in this stage. The water release from elpidite materials subjected to thermal treatment has been investigated and discussed previously ([5,9,21]). Cametti et al. [9] reported that upon Pbcm–Cmce phase transition, the structure loses one H2O molecule (~33%). Their Cmce-sample, when measured at 100 °C, appeared to be partially dehydrated, containing 1.8 vs. ideally 2.0 H2O pfu (Table 5, row 4). In the present study, the chemical formula obtained using the Rietveld refinement for the sample studied at 165 °C (Table 3, Sof data for water molecules; Table 5, row 10) indicated a water release of about 24% with respect to the ideal amount for the Cmce-phase. Thus, the total amount of water loss from the initial Pbcm-sample up to the specified temperature reaches approximately 50%. In their work investigating the dehydration kinetics of the microporous zirconosilicate elpidite [21] Nedel’ko et al. noted that in the temperature range 110–180 °C, the studied sample “rapidly loses 50–60% of its water, which is followed by a deviation from the first order rate law to a slower rate”. The authors clearly distinguish two steps in elpidite dehydration, which differ kinetically. The temperature range in which the separation occurs falls between 170 and 180 °C, and is marked by an inflection in the thermogravimetric curve presented in their work. With a certain amount of caution, we note a degree of correlation between the variation tendencies of the unit cell volumes reported here for the Cmce-material between 90 and 300 °C and the kinetic data for elpidite published by Nedel’ko et al. The results obtained from the Rietveld refinement of the sample treated at 300 °C indicate that this material had lost half of its initial water amount (Table 5, row 11). In their single crystal X-ray diffraction study [9], Cametti et al. noted that their sample was already completely anhydrous at 250 °C. This difference is most probably a result of the fact that this study presents a PXRD investigation of elpidite in bulk. The twist-angles obtained for heated Cmce-elpidite tend to have closer values, in correspondence with the decrease of the m_n tilt-angle values, and illustrating the overall less distorted construction of the Zr2Si6 CBUs. This inevitably affects the effective diameters of the 8MR aperture, as has already been demonstrated in single crystal studies on a sample of dehydrated elpidite from Mont Saint-Hilaire [10].
No experiments were performed above a temperature of 300 °C. Most probably, the thermal expansion will continue at higher temperatures, contributing to the attainment of a more regular framework in terms of twist- and tilt-angle values; however, a phase transition accompanied by symmetry changes is not expected. In support of this the statement by Cametti et al. [9] that their sample structure was retained at temperatures of up to 950 °C, but after heating at 1200 °C it had melted.
5. Conclusions
The present in situ powder diffraction studies confirm and complement the available data on the thermal behavior of the mineral elpidite. The choice of the Rietveld refinement procedures used in this work was strongly influenced by previously reported results from single crystal investigations of heated and ion-exchanged samples of this material, which provided evidence for the rigidity of its framework units (ZrO6 octahedra and SiO4 tetrahedra). By applying a high Restraint Weighting factor and a low tolerance range on the introduced soft constraints, consisting of both Zr–O and Si–O bond distances, the structure refinement was directed mainly towards the response of the framework topology to the thermal treatment in terms of the twisting and tilting of its Zr2Si6 “composite building units”. A set of geometric parameters was introduced characterizing the spatial orientation of symmetrically related zirconium octahedra in the structure. Some of the twist-angles measured in this study exceeded 25°, thus revealing the amazing flexibility of the elpidite framework. The powder diffraction investigations of the elpidite studied in bulk presented here complement previously reported data on the dehydration and thermal stability of this material obtained by in situ single crystal diffraction as follows: (i) the topotactic non-reconstructive Pbcm-Cmce phase transition occurring upon partial dehydration starts at approximately 60 °C and ends at about 100 °C with complete conversion; (ii) above 160 °C, the thermal expansion dominates over the water loss process, and this in general contributes to the decrease in construction distortions of the Zr2Si6 CBUs. This trend is expected to continue after the complete dehydration of the studied material.
Future investigations on this topic may shed light on the possible elasticity of the completely dehydrated material, and the results may be of practical importance and interest for materials science specialists.
Supplementary Materials
The following are available online at https://0-www-mdpi-com.brum.beds.ac.uk/2075-163X/10/7/639/s1, Structural data, bond distances and angles, and bond-valence analysis of the elpidite structures obtained under ambient conditions and next at 45, 65, 90, 165, and 300 °C as well as details for the applied Rietveld procedures and CIF files have been submitted as supplementary material.
Author Contributions
V.V.K.-K. and T.N.K. wrote the paper and prepared the graphical presentations together. V.V.K.-K. performed the Rietveld refinement procedures and the geometric parameter measurements. All authors have read and agreed to the published version of the manuscript.
Funding
This work was supported by the National Science Fund of Bulgaria under the contract No. DNTS/Russia 02/8 from 15.06.2018 (powder X-ray diffraction data and determination of the crystal structures).
Conflicts of Interest
The authors declare no conflict of interest.
References
- Chukanov, N.V.; Pekov, I.V.; Rastsvetaeva, R.K. Crystal chemistry, properties and synthesis of microporous silicates containing transition elements. Russ. Chem. Rev. 2004, 73, 227–246. [Google Scholar] [CrossRef]
- Neronova, N.N.; Belov, N.V. Crystal structure of elpidite Na2ZrSi6O15.(H2O)3. Dimorphism of the dimetasilicate radical Si6O15. Dokl. Akad. Nauk SSSR 1963, 150, 642–645. [Google Scholar]
- Neronova, N.N.; Belov, N.V. Crystal structure of elpidite, Na2ZrSi6O15.(H2O)3. Sov. Phys. Crystallogr. 1964, 9, 700–705. [Google Scholar]
- Zubkova, N.V.; Nikolova, R.P.; Chukanov, N.V.; Kostov-Kytin, V.V.; Pekov, I.V.; Varlamov, D.A.; Larikova, T.S.; Kazheva, O.N.; Chervonnaya, N.A.; Shilov, G.V.; et al. Crystal Chemistry and Properties of Elpidite and Its Ag-Exchanged Forms. Minerals 2019, 9, 420. [Google Scholar] [CrossRef] [Green Version]
- Zubkova, N.V.; Ksenofontov, D.A.; Kabalov, Y.K.; Chukanov, N.V.; Nedel’ko, V.V. Dehydration-induced structural transformations of the microporous zirconosilicate elpidite. Inorg. Mater. 2011, 47, 506–512. [Google Scholar] [CrossRef]
- Sapozhnikov, A.N.; Kashaev, A.A. Features of the crystal structure of calcium-containing elpidite. Sov. Phys. Crystallogr. 1978, 23, 24–27. [Google Scholar]
- Grigor’eva, A.A.; Zubkova, N.V.; Pekov, I.V.; Kolitsch, U.; Pushcharovsky, D.Y.; Vigasina, M.F.; Giester, G.; Ðorðevic, T.; Tillmanns, E.; Chukanov, N.V. Crystal chemistry of elpidite from Khan Bogdo (Mongolia) and its K- and Rb-exchanged forms. Crystallogr. Rep. 2011, 56, 832–841. [Google Scholar] [CrossRef]
- Cannillo, E.; Rossi, G.; Ungaretti, L. The crystal structure of elpidite. Am. Mineral. J. Earth Planet. Mater. 1973, 58, 106–109. [Google Scholar]
- Cametti, G.; Armbruster, T.; Nagashima, M. Dehydration and thermal stability of elpidite: An in-situ single crystal X-ray diffraction study. Microporous Mesoporous Mater. 2016, 227, 81–87. [Google Scholar] [CrossRef]
- Nikolova, R.P.; Zubkova, N.Z.; Kostov-Kytin, V.V.; Chukanov, N.V.; Pekov, I.V. Elpidite framework flexibility exhibited upon ion-exchange and dehydration. In Proceedings of the Xth International Symposium “Mineral Diversity—Research and Preservation”, Earth and Man National Museum, Sofia, Bulgaria, 14–16 October 2019; pp. 175–183. [Google Scholar]
- Pyatenko, Y.A.; Voronkov, A.A. Comparative characteristics of the crystal-chemical functions of titanium and zirconium in mineral structures. Izv. Akad. Nauk SSSR Ser. Geol. 1977, 9, 77–88. [Google Scholar]
- Nikolova, R.; Fujiwara, K.; Nakayama, N.; Kostov-Kytin, V. Crystal structure of a new small–pore zirconosilicate Na2ZrSi2O7·H2O and its relation to stoichiometrically and topologically similar compounds. Solid State Sci. 2009, 11, 382–388. [Google Scholar] [CrossRef]
- Larson, A.C.; Von Dreele, R.B. General Structure Analysis System (GSAS). Report LAUR 86-748; Los Alamos National Laboratory. Available online: https://11bm.xray.aps.anl.gov/documents/GSASManual.pdf (accessed on 10 May 2020).
- Toby, B.H. Expgui, a graphical user interface for GSAS. J. Appl. Crystallogr. 2001, 34, 210–213. [Google Scholar] [CrossRef] [Green Version]
- Petrova, R.; Nakayama, N.; Bakardjieva, S.; Bezdicka, P.; Kostov-Kytin, V. Temperature-induced phase transformations of the small-pore zirconosilicate Na2ZrSi2O7.H2O. Solid State Sci. 2011, 13, 1187–1190. [Google Scholar] [CrossRef]
- Kostov-Kytin, V.V.; Nikolova, R.P.; Lihareva, N.L. Two-stage protonation of a small-pore microporous zirconosilicate na Na2ZrSi2O7.H20. Bulg. Chem. Commun. 2012, 44, 83–90. [Google Scholar]
- EXPGUI—XRAY Subversion Server. Available online: https://subversion.xray.aps.anl.gov/EXPGUI/trunk/doc/expgui6R.html (accessed on 10 May 2020).
- Roisnel, T.; Rodriguez-Carvajal, J. Materials Science Forum. In Proceedings of the Seventh European Powder Diffraction Conference, Barcelona, Spain, 20–23 May 2000; Delhez, R., Mittenmeijer, E.J., Eds.; Scitec Publications, Ltd.: Baech, Switzerland, 2000; p. 118. [Google Scholar]
- Momma, K.; Izumi, F. VESTA 3 for three-dimensional visualization of crystal, volumetric and morphology data. J. Appl. Crystallogr. 2011, 44, 1272–1276. [Google Scholar] [CrossRef]
- Macrae, C.F.; Edgington, P.R.; McCabe, P.; Pidcock, E.; Shields, G.P.; Taylor, R.; Towler, M.; Streek, J.V.D. Mercury: Visualization and analysis of crystal structures. J. Appl. Crystallogr. 2006, 39, 453–457. [Google Scholar] [CrossRef] [Green Version]
- Nedel’ko, V.V.; Chukanov, N.V.; Pekov, I.V. Dehydration kinetics of the microporous zirconosilicate elpidite. Inorg. Mater. 2011, 47, 502–505. [Google Scholar] [CrossRef]
Figure 1.
Geometric parameters, characterizing the spatial orientation of adjacent zirconium octahedra in the structure of elpidite materials. (a) triads of atoms defining planes allowing the measurement of the twist angles; (b) designation of faces of adjacent zirconium octahedral; (c) planes defined by these faces and named with the same letters; (d) arrows marking the direction of the dip angles between the correspondingly designated planes measured as azimuth with respect to north (black triangle).

Figure 2.
Spatial orientation of ZrO6 octahedra in the structures of Pma2-, Pbcm-, and Cmce-elpidites. (a) idealized scheme of elpidite framework topology; (b) crystal structure of unprocessed elpidite (L) [4]—Pma2; (c) crystal structure of unprocessed elpidite (KB) [7]—Pbcm; (d) crystal structure of dehydrated at 250 °C elpidite (MSH) [9]—Cmce.

Figure 3.
PXRD patterns of thermally treated elpidite samples.

Figure 4.
Selected Rietveld refinement plots for thermally treated elpidites. The crosses and continuous line correspond to the experimental and calculated XRD patterns. The Bragg positions of each refined phase are shown above the difference plot. (a) graphical image of an attempt to apply a simultaneous two-phase structural refinement including the Pbcm- and the Pma2-phases; (b,c) two-phase coexistence within the temperature range 60–90 °C; (d) elpidite Cmce at 165 °C. The inset of d) indicates occurrence of the characteristic for this phase low-intensity reflection (111) at 10.67 2Θ°.

Figure 5.
Elpidite framework topology evolution upon thermal treatment (selected data) in terms of the twist- tilt- and azimuth-angles of Pbcm phases at RT - 60°C (a) and Cmce phases at 90–300 °C in two different directions: along a-axis (b) and along c-axis (c) (see also data in Table 5).
Figure 5.
Elpidite framework topology evolution upon thermal treatment (selected data) in terms of the twist- tilt- and azimuth-angles of Pbcm phases at RT - 60°C (a) and Cmce phases at 90–300 °C in two different directions: along a-axis (b) and along c-axis (c) (see also data in Table 5).


Table 1.
Lattice parameters and refinement details for elpidite samples heated within the temperature range 25–300 °C.
Table 1.
Lattice parameters and refinement details for elpidite samples heated within the temperature range 25–300 °C.
| Material | In Situ Time-Resolved Powder X-ray Diffraction Studies (Selected Samples) | |||||
|---|---|---|---|---|---|---|
| Rietveld Statistics | Elpidite at 25 °C Single Phase Study | Elpidite at 45 °C Single Phase Study | Elpidite at 60 °C Two Phase Study | Elpidite at 90 °C Two Phase Study | Elpidite at 165 °C Single Phase Study | Elpidite at 300 °C Single Phase Study |
| Space Group, Z | Pbcm, 4 | Pbcm, 4 | Pbcm, 4 | Cmce, 8 | Cmce, 8 | Cmce, 8 |
| a (Å) | 7.0956(5) | 7.0961(5) | 7.092(1) | 14.089(1) | 14.083(1) | 14.126(1) |
| b (Å) | 14.6536(6) | 14.6525(6) | 14.6536(6) | 14.5385(9) | 14.4794(7) | 14.4907(8) |
| c (Å) | 14.5696(7) | 14.5711(7) | 14.5686(7) | 14.3241(9) | 14.3186(8) | 14.3309(8) |
| V (Å)3 | 1514.9(2) | 1515.00(2) | 1514.00(2) | 2934.0(4) | 2919.7(4) | 2933.4(4) |
| Rwp (%) | 12.46 | 12.81 | 10.10 | 9.33 | 11.68 | 11.88 |
| Rp (%) | 9.12 | 9.46 | 7.58 | 6.94 | 8.87 | 8.99 |
| Red-χ2 | 4.763 | 4.921 | 2.983 | 2.597 | 4.059 | 4.078 |
| Nobs | 1319 | 1322 | 2751 | 2641 | 1289 | 1294 |
| RF2 (%) | 10.12 | 10.44 | 7.38 | 6.00 | 7.58 | 7.73 |
| Nvar | 74 | 73 | 34 | 93 | 79 | 79 |
| No restraints | 18 | 18 | 36 | 36 | 18 | 18 |
| Total restraint χ2 contribution | 13.57 each | 6.44 each | 1.61 each | 5.15 each | 7.08 each | 2.04 each |
Rp = ∑[Yio-Yic]/∑Yio; Rwp = [∑wi(Yio − Yic)2/∑wiYio2]0.5; RF2 = ∑|Fo2 − Fc2|/∑|Fo2|; Red-χ2 = ∑wi(Yio − Yic)2/(Nobs − Nvar). Estimated standard deviations in parentheses refer to the last digit.
Table 2.
Positional and thermal parameters of the atoms in the structure of elpidite (Pbcm) at 25 °C (first line of each row) and heated to 60 °C (second line) as obtained from the in situ time-resolved PXRD studies.
Table 2.
Positional and thermal parameters of the atoms in the structure of elpidite (Pbcm) at 25 °C (first line of each row) and heated to 60 °C (second line) as obtained from the in situ time-resolved PXRD studies.
| Atom | x | y | z | Sof | Uiso, Å2 * |
|---|---|---|---|---|---|
| 0.4859(15) | 0.25 | 0.5 | 1 | 0.022(1) | |
| Zr | 0.496(4) | 0.25 | 0.5 | 1 | 0.02404 |
| 0.7766(28) | 0.3885(8) | 0.6474(9) | 1 | 0.021(1) | |
| Si1 | 0.783(5) | 0.388(1) | 0.647(1) | 1 | 0.02148 |
| 0.5046(30) | 0.0493(5) | 0.6466(7) | 1 | 0.021(1) | |
| Si2 | 0.509(5) | 0.0489(5) | 0.6492(8) | 1 | 0.02125 |
| 0.2147(29) | 0.3926(8) | 0.6472(9) | 1 | 0.021(1) | |
| Si3 | 0.222(5) | 0.391(1) | 0.645(2) | 1 | 0.02136 |
| 0.430(5) | 0.229(1) | 0.5000(0) | 1 | 0.044(3) | |
| Na1 | 0.418(8) | 0.2266(9) | 0.75 | 1 | 0.04135 |
| 0.012(3) | 0.5000(0) | 0.5000(0) | 1 | 0.012(3) | |
| Na2 | 0.014(10) | 0.25 | 0.5 | 1 | 0.00875 |
| 0.9961(31) | 0.4015(10) | 0.6361(13) | 1 | 0.036(2) | |
| O1 | 1.004(5) | 0.398(1) | 0.651(2) | 1 | 0.03043 |
| 0.727(8) | 0.3510(18) | 0.75 | 1 | 0.037(2) | |
| O2 | 0.720(11) | 0.354(3) | 0.75 | 1 | 0.03083 |
| 0.6738(32) | 0.3112(15) | 0.5894(15) | 1 | 0.036(2) | |
| O3 | 0.701(6) | 0.309(3) | 0.581(3) | 1 | 0.03033 |
| 0.659(4) | 0.4809(12) | 0.6195(19) | 1 | 0.038(2) | |
| O4 | 0.652(6) | 0.481(2) | 0.622(3) | 1 | 0.03203 |
| 0.448(7) | 0.0644(13) | 0.75 | 1 | 0.038(2) | |
| O5 | 0.447(9) | 0.070(1) | 0.75 | 1 | 0.03173 |
| 0.508(7) | 0.1390(8) | 0.5905(9) | 1 | 0.036(2) | |
| O6 | 0.528(9) | 0.1382(9) | 0.591(1) | 1 | 0.03023 |
| 0.310(4) | 0.4929(13) | 0.6274(20) | 1 | 0.035(2) | |
| O7 | 0.318(6) | 0.491(2) | 0.620(3) | 1 | 0.02923 |
| 0.290(7) | 0.3703(18) | 0.75 | 1 | 0.036(2) | |
| O8 | 0.298(10) | 0.367(3) | 0.75 | 1 | 0.03023 |
| 0.2711(32) | 0.3158(15) | 0.5745(16 | 1 | 0.036(2) | |
| O9 | 0.277(6) | 0.310(3) | 0.575(3) | 1 | 0.02993 |
| 0.023(8) | 0.113(1) | 0.581(1) | 1 | 0.055(6) | |
| O10 * | 0.054(8) | 0.1167(9) | 0.584(1) | 1 | 0.02058 |
| 0.157(8) | 0.200(2) | 0.75 | 1 | 0.085(6) | |
| O11 * | 0.120(10) | 0.196(2) | 0.75 | 1 | 0.05344 |
* O10, O11—water molecules.
Table 3.
Positional and thermal parameters of the atoms in the structure of elpidite (Cmce) heated at 90 °C (first line of each row) and at 165 °C (second line), as obtained from the in situ time-resolved PXRD studies.
Table 3.
Positional and thermal parameters of the atoms in the structure of elpidite (Cmce) heated at 90 °C (first line of each row) and at 165 °C (second line), as obtained from the in situ time-resolved PXRD studies.
| Atom | x | y | z | Sof | Uiso, Å2 |
|---|---|---|---|---|---|
| 0.25 | 0.25 | 0.5 | 1 | 0.0115(7) | |
| Zr | 0.25 | 0.25 | 0.5 | 1 | 0.0187(9) |
| 0.2301(10) | 0.0505(5) | 0.6458(6) | 1 | 0.015(1) | |
| Si1 | 0.2318(10) | 0.0483(5) | 0.6444(6) | 1 | 0.016(1) |
| 0.3861(7) | 0.3789(5) | 0.6615(7) | 1 | 0.015(1) | |
| Si2 | 0.3951(9) | 0.3789(5) | 0.6633(5) | 1 | 0.016 (1) |
| 0.3875(6) | 0.0949(5) | 0.3727(7) | 1 | 0.015(1) | |
| Si3 | 0.3897(9) | 0.0959(5) | 0.3738(6) | 1 | 0.016(1) |
| 0.5 | 0.2435(19) | 0.516(1) | 1 | 0.057(3) | |
| Na1 | 0.5 | 0.2422(14) | 0.5174(13) | 1 | 0.069(4) |
| 0.25 | 0.2350(9) | 0.75 | 1 | 0.047(3) | |
| Na2 | 0.25 | 0.2405(10) | 0.75 | 1 | 0.058(4) |
| 0.5 | 0.0863(20) | 0.3813(22) | 1 | 0.022(2) | |
| O1 | 0.5 | 0.0633(18) | 0.3908(20) | 1 | 0.031(2) |
| 0.3608(17) | 0.3632(10) | 0.7723(7) | 1 | 0.020(2) | |
| O2 | 0.3603(18) | 0.3632(9) | 0.7727(8) | 1 | 0.033(2) |
| 0.1550(14) | 0.2003(11) | 0.4025(12) | 1 | 0.025(2) | |
| O3 | 0.1596(14) | 0.1953(11) | 0.3987(12) | 1 | 0.030(2) |
| 0.3256(13) | −0.0015(11) | 0.6130(15) | 1 | 0.024(2) | |
| O4 | 0.3250(13) | −0.0069(10) | 0.6159(14) | 1 | 0.033(2) |
| 0.25 | 0.0811(14) | 0.75 | 1 | 0.025(2) | |
| O5 | 0.25 | 0.0758(14) | 0.75 | 1 | 0.035(2) |
| 0.2188(18) | 0.1468(8) | 0.5964(10) | 1 | 0.021(2) | |
| O6 | 0.2186(19) | 0.1409(8) | 0.5882(10) | 1 | 0.031(2) |
| 0.1398(14) | 0.0164(8) | 0.3700(13) | 1 | 0.025(2) | |
| O7 | 0.1349(14) | 0.0138(8) | 0.3661(12) | 1 | 0.034(2) |
| 0 | 0.1205(16) | 0.3447(21) | 1 | 0.024(2) | |
| O8 | 0 | 0.1102(18) | 0.3778(17) | 1 | 0.033(2) |
| 0.3624(10) | 0.1764(9) | 0.4428(12) | 1 | 0.020(2) | |
| O9 | 0.3645(11) | 0.1755(10) | 0.4513(10) | 1 | 0.029(2) |
| 0.5 | 0.350(2) | 0.411(2) | 1 | 0.079(11) | |
| Ow1 * | 0.5 | 0.341(2) | 0.404(2) | 0.79(3) | 0.063 |
| 0.5 | 0.135(2) | 0.691(2) | 1 | 0.129(15) | |
| Ow11 * | 0.5 | 0.165(3) | 0.368(4) | 0.73(2) | 0.129 |
* Ow1, Ow11—water molecules; starting structure model together with atom designations taken from Cametti et al. [9].
Table 4.
Selected bond distances (Å) for heated elpidite samples obtained within the temperature range 25–165 °C.
Table 4.
Selected bond distances (Å) for heated elpidite samples obtained within the temperature range 25–165 °C.
| In Situ Time-Resolved Powder X-ray Diffraction Studies (Selected Samples, RWf = 20,000) | |||||
|---|---|---|---|---|---|
| Atomic Pair | (Pbcm) | (Pbcm) | Atomic Pair | (Cmce) | (Cmce) |
| at 25 °C | at 60 °C | at 90 °C | at 165 °C | ||
| Zr-O3[x2] | 2.071(10) | 2.0502(2) | Zr-O3[x2] | 2.064(7) | 2.086(9) |
| Zr-O6[x2] | 2.099(8) | 2.11419(7) | Zr-O6[x2] | 2.086(7) | 2.071(8) |
| Zr-O9[x2] | 2.103(10) | 2.0988(2) | Zr-O9[x2] | 2.079(7) | 2.061(9) |
| Si1-O1 | 1.578(13) | 1.5712(2) | Si1-O7 | 1.617(10) | 1.641(13) |
| Si1-O2 | 1.632(12) | 1.64881(7) | Si1-O5 | 1.583(8) | 1.585(8) |
| Si1-O3 | 1.590(11) | 1.62584(5) | Si1-O6 | 1.577(9) | 1.574(10) |
| Si1-O4 | 1.640(13) | 1.68435(9) | Si1-O4 | 1.614(10) | 1.589(12) |
| Si2-O4 | 1.585(13) | 1.5660(1) | Si2-O3 | 1.581(9) | 1.592(10) |
| Si2-O5 | 1.575(12) | 1.56296(7) | Si2-O7 | 1.630(9) | 1.664(11) |
| Si2-O6 | 1.549(9) | 1.57068(5) | Si2-O8 | 1.607(9) | 1.597(10) |
| Si2-O7 | 1.579(14) | 1.5477(1) | Si2-O2 | 1.643(10) | 1.657(11) |
| Si3-O1 | 1.565(13) | 1.5535(2) | Si3-O4 | 1.627(9) | 1.585(11) |
| Si3-O7 | 1.643(12) | 1.65868(7) | Si3-O2 | 1.606(10) | 1.619(12) |
| Si3-O8 | 1.623(13) | 1.66139(7) | Si3-O9 | 1.594(9) | 1.639(10) |
| Si3-O9 | 1.596(12) | 1.61252(5) | Si3-O1 | 1.594(9) | 1.642(10) |
Note: Estimated standard deviations in parentheses refer to the last digit. For E.S.D. meaning obtained for the restrained bond distances (Zr-O and Si-O) see the 2.4. Structure Refinement Procedures section.
Table 5.
Selected angles and distances measured for elpidite single crystals and thermally treated (RT-300 °C) elpidite single crystal and powdered samples.
Table 5.
Selected angles and distances measured for elpidite single crystals and thermally treated (RT-300 °C) elpidite single crystal and powdered samples.
| N | Twist Angle ρ1 (°) | Twist Angle ρ2 (°) | Tilt Angle m_n/Azimuth (°) | Tilt Angle m_o/Azimuth (°) | Tilt Angle n_o/Azimuth (°) | Tilt Angle p_q/Azimuth (°) | PV, ZrO6, (Å)3 | DI Zr-O, (Å) | BAV, ZrO6, (°) | Averaged PV, SiO4, (Å)3 | Averaged DI Si-O, (Å) | Averaged BAV, SiO4 (°)2 | Compound, Locality, Exper. Conditions [ref] Results of Quant. Analysis Space Group Unit Cell Parameters: a, b, c, (Å), V (Å)3 |
|---|---|---|---|---|---|---|---|---|---|---|---|---|---|
| 1 | 2 | 3 | 4 | 5 | 6 | 7 | 8 | 9 | 10 | 11 | 12 | 13 | 14 |
| Single crystal studies | |||||||||||||
| 1 | 0 | 0 | 5.77/95 | 0 | 5.77/265 | 5.77/265 | 11.85 | 0.004 | 1.9011 | 2.1374 | 0.01767 | 8.5015 | Elpidite init., Lovozero (L), RT, Na2ZrSi6O15·3H2O (CCDC with CSD deposition number 1,937,293 [4]); Pma2 14.6127(7); 7.3383(4), 7.1148(3); 762.94(6) |
| 2 | 0 | 0 | 6.07/65 | 2.65/0 | 5.46/90 | 6.07/295 | 12.00 | 0.006 | 3.079 | 2.1541 | 0.01106 | 5.70237 | Elpidite init., Khan Bogdo (KB), RT, [7]; Pbcm 7.131(12, 14.685(1), 14.6349(15); 1532.6(3) |
| 3 | 0 | 0 | 6.53/60 | 3.19/0 | 5.69/90 | 6.53/300 | 11.87 | 0.005 | 3.404 | 2.1490 | 0.0107 | 6.590 | Elpidite init., Mont Saint-Hilaire (MSH), RT, Na2ZrSi6O15·3H2O [9]; Pbcm 7.1134(1), 14.6796(2), 14.6030(2); 1524.87(4) |
| 4 | 17.62 | 9.17 | 8.17/90 | 31.40/180 | 32.50/15 | 8.17/270 | 11.93 | 0.004 | 1.362 | 2.1453 | 0.0086 | 7.619 | (MSH) elpidite, in situ heated at 100 °C and partially dehydrated, Na2ZrSi6O15·1.8H2O [9]; Cmce (64) 14.1260(5), 14.5734(5), 14.3627(5); 2956.8(2) |
| 5 | 18.62 | 9.19 | 6.41/90 | 30.04/180 | 30.74/15 | 6.41/270 | 11.87 | 0.009 | 2.839 | 2.1333 | 0.00863 | 7.4124 | (MSH) elpidite, in situ heated at 250 °C anhydrous, Na2ZrSi6O15 [9]; Cmce 14.1271(4), 14.5110(4), 14.3533(4); 2942.4(1) |
| PXRD studies, this work | |||||||||||||
| 6 | 0 | 0 | 9.85/25 | 8.79/0 | 4.43/90 | 9.85/330 | 12.07 | 0.006 | 24.25 | 2.0502 | 0.01371 | 49.11307 | Na2ZrSi6O15·3H2O, (L), RT, single phase study; Pbcm 7.0956(5), 14.6536(6); 14.5696(7); 1514.9(2) |
| 7 | 0 | 0 | 10.51/35 | 8.56/0 | 6.09/90 | 10.51/325 | 12.00 | 0.011 | 25.66 | 2.0650 | 0.01758 | 53.58603 | Na2ZrSi6O15·3H2O, (L), 45 °C, single phase study; Pbcm 7.0961(5), 14.6525(6), 14.5711(7); 1515.04(16) |
| 8 | 0 | 0 | 8.54/70 | 2.86/0 | 8.04/90 | 8.54/290 | 12.03 | 0.012 | 20.33 | 2.0787 | 0.01637 | 59.06697 | Na2ZrSi6O15·3H2O, (L), 60 °C, two phase study; quant. analysis Pbcm:Cmce = 70:30; Pbcm 7.0920(10), 14.6536(6), 14.5686(7); 1514.0(2) |
| 9 | 25.68 | 12.14 | 15.45/90 | 20.35/180 | 25.65/35 | 15.45/270 | 11.89 | 0.004 | 9.998 | 2.10093 | 0.01037 | 29.88363 | Na2ZrSi6O15·2H2O, (L), 90 °C, two phase study; quant. analysis Pbcm:Cmce = 30:70; Cmce 14.0886(13), 14.5385(9), 14.3241(9); 2934.0(4) |
| 10 | 23.15 | 14.86 | 11.34/90 | 28.02/180 | 30.32/20 | 11.34/270 | 11.86 | 0.004 | 3.078 | 2.11247 | 0.01522 | 60.31813 | Na2ZrSi6O15·1.5H2O, (L), 165 °C, single phase study; Cmce 14.0829(12), 14.4794(7), 14.3186(8); 2919.7(4) |
| 11 | 17.70 | 15.46 | 8.05/90 | 26.46/180 | 27.70/17 | 8.05/270 | 11.58 | 0.007 | 2.729 | 2.103 | 0.02232 | 47.4003 | Na2ZrSi6O15·H2O, (L), 300 °C, single phase study; Cmce 14.1255(13), 14.4907(8), 14.3309(8); 2933.4(4) |
© 2020 by the authors. Licensee MDPI, Basel, Switzerland. This article is an open access article distributed under the terms and conditions of the Creative Commons Attribution (CC BY) license (http://creativecommons.org/licenses/by/4.0/).
Share and Cite
MDPI and ACS Style
Kostov-Kytin, V.V.; Kerestedjian, T.N. Rietveld Analysis of Elpidite Framework Flexibility Using in Situ Powder XRD Data of Thermally Treated Samples. Minerals 2020, 10, 639. https://0-doi-org.brum.beds.ac.uk/10.3390/min10070639
AMA Style
Kostov-Kytin VV, Kerestedjian TN. Rietveld Analysis of Elpidite Framework Flexibility Using in Situ Powder XRD Data of Thermally Treated Samples. Minerals. 2020; 10(7):639. https://0-doi-org.brum.beds.ac.uk/10.3390/min10070639
Chicago/Turabian StyleKostov-Kytin, Vladislav V., and Thomas N. Kerestedjian. 2020. "Rietveld Analysis of Elpidite Framework Flexibility Using in Situ Powder XRD Data of Thermally Treated Samples" Minerals 10, no. 7: 639. https://0-doi-org.brum.beds.ac.uk/10.3390/min10070639
Note that from the first issue of 2016, this journal uses article numbers instead of page numbers. See further details here.