Article

Unconformity-Type Uranium Systems: A Comparative Review and Predictive Modelling of Critical Genetic Factors

1
92 Energy Pty Ltd., 945 Wellington Street, West Perth, WA 6005, Australia
2
MDB Geo Consulting, P.O. Box 464, Blackwood, SA 5051, Australia
3
Corporate Geoscience Group (CGSG), P.O. Box 5128, Rockingham Beach, WA 6969, Australia
4
Economic Geology Research Centre (EGRU), College of Science & Engineering, James Cook University, Townsville, QLD 4811, Australia
5
Fathom Geophysics Australia Pty Ltd., P.O. Box 1253, Dunsborough, WA 6281, Australia
6
Centre for Exploration Targeting (CET), The University of Western Australia, 35 Stirling Highway, Crawley, WA 6009, Australia
*
Author to whom correspondence should be addressed.
Submission received: 8 July 2020 / Revised: 13 August 2020 / Accepted: 19 August 2020 / Published: 21 August 2020
(This article belongs to the Special Issue Geology of Uranium Deposits)

Abstract

:
A review of descriptive and genetic models is presented for unconformity-type uranium deposits with particular attention given to spatial representations of key process components of the mineralising system and their mappable expressions. This information formed the basis for the construction of mineral potential models for the world’s premier unconformity-style uranium provinces, the Athabasca Basin in Saskatchewan, Canada (>650,000 t U3O8), and the NW McArthur Basin in the Northern Territory, Australia (>450,000 t U3O8). A novel set of ‘edge’ detection routines was used to identify high-contrast zones in gridded geophysical data in support of the mineral potential modelling. This approach to geophysical data processing and interpretation offers a virtually unbiased means of detecting potential basement structures under cover and at a range of scales. Fuzzy logic mineral potential mapping was demonstrated to be a useful tool for delineating areas that have high potential for hosting economic uranium concentrations, utilising all knowledge and incorporating all relevant spatial data available for the project area. The resulting models not only effectively ‘rediscover’ the known uranium mineralisation but also highlight several other areas containing all of the mappable components deemed critical for the accumulation of economic uranium deposits. The intelligence amplification approach to mineral potential modelling presented herein is an example of augmenting expert-driven conceptual targeting with the powerful logic and rationality of modern computing. The result is a targeting tool that captures the current status quo of geospatial and exploration information and conceptual knowledge pertaining to unconformity-type uranium systems. Importantly, the tool can be readily updated once new information or knowledge comes to hand. As with every targeting tool, these models should not be utilised in isolation, but as one of several inputs informing exploration decision-making. Nor should they be regarded as ‘treasure maps’, but rather as pointers towards areas of high potential that are worthy of further investigation.

Graphical Abstract

1. Introduction

Unconformity-type (also called unconformity-related and unconformity-associated) uranium deposits (Figure 1a) are structurally controlled and typically located at, or within a few hundred metres above or below, a prominent regional unconformity, separating locally reduced Archaean and Paleoproterozoic crystalline (metamorphic/magmatic) basement from relatively undeformed, oxidised Paleo- to Mesoproterozoic clastic cover rocks of intracratonic basin affinity [1,2].
The group of unconformity-type uranium deposits is economically significant, having accounted for >15–25% of the world’s uranium production in the period from 2016 to 2018 [2]. Most of the significant unconformity-type uranium deposits are found in and below the Athabasca Basin (Figure 1b) of Saskatchewan, Canada, with a total endowment of >650,000 t U3O8, and the NW McArthur Basin (Figure 1e) of the Northern Territory, Australia, with cumulative resources of >450,000 t U3O8. A defining feature of the group in relation to other types of uranium deposit is their high grade nature, typically in the range from 0.3% to 2.0% U3O8, although much higher-grade examples are known from the Athabasca Basin region (e.g., McArthur River: 17% U3O8, Cigar Lake: 15% U3O8) [2,3] (Table 1). Other important or emerging regions for unconformity-type uranium include the Thelon Basin (Figure 1b), the Cuddapah Basin (Figure 1c), India, the Otish Basin (Figure 1d), Quebec, Canada and Russia’s Pasha-Ladoga Basin (Figure 1a) [4,5,6].
In this paper we review descriptive and genetic models for unconformity-type uranium deposits with particular emphasis on their common spatial footprints enabling the prediction of undiscovered resources at the basin-scale. A mineral systems approach [7,8,9,10,11] was used to frame this discussion and develop our targeting model. As summarised in Kreuzer et al. [12], the mineral systems concept considers ore deposit formation in the framework of much larger lithospheric-scale processes. In this context, an ore deposit can be thought of as the product of five critical genetic processes: (i) source: all geological processes required for extracting the necessary ore components (melts or fluids, metals and ligands) from their crustal and/or mantle sources; (ii) transport: all geological processes required for driving the melt- or fluid-assisted transfer of the ore components from source to trap; (iii) trap: all geological processes required for focusing melt or fluid flow into physically and/or chemically responsive sites that can accommodate significant volumes of ore and gangue; (iv) deposition: all geological processes required for efficient extraction of metals from melts or fluids passing through the traps and (v) preservation: all geological processes required to preserve the accumulated metals through time. Where one or more of these processes is missing, ore formation is precluded.
Mineral potential models (e.g., [12,13]) are presented for the two most prolific and prospective basins and surrounding crystalline basement rocks, namely the Athabasca Basin and the NW McArthur Basin, which hosts the Alligator Rivers (ARUF), South Alligator Valley (SAVUF) and Rum Jungle (RJUF) uranium fields. The uranium mineral potential maps were created as part of a wider study to identify exploration targets with high potential for as yet undiscovered unconformity-related uranium and gold deposits in these two areas and in the exposed Canadian Shield in Northern Saskatchewan.
Fuzzy logic mineral potential modelling (MPM) is a useful tool for identifying and targeting areas that have high potential for hosting economic concentrations of valuable minerals, utilising all knowledge and relevant spatial data available (e.g., [14,15,16]). The procedure described herein aims to reduce concepts of uranium ore genesis to their most fundamental mappable components. Complex relationships between critical genetic factors can then be expressed in the form of a logical model, which is carefully guided at every step by an ‘expert’ team of geoscientists. Holistic mineral-systems targeting models such as these, intimately reflect the way in which the geoscientist thinks but may incorporate a wide variety of simultaneous input criteria and can be uniformly and subjectively applied over entire districts or regions to which a particular conceptual targeting model applies. The final result is a numerical grid of values, representing spatial variations in mineral potential. Reclassification of the grid allows it to be displayed as a simple colour-coded, multi-class favourability map.
It is undisputed that unconformity-type uranium deposits are hosted by ductile-brittle to brittle structures, and in most cases it is obvious that the often long-lived and multiply reactivated host structures transect basement and basin successions and, therefore, reactivation of these structures post-date the unconformity. Few published studies have addressed the distribution of favourable structures at the regional scale and how structures might be used predictively in exploration targeting. We attempt to do this below.

2. Unconformity-Type Uranium Deposits—Descriptive Model

Most unconformity-type uranium deposits (Figure 1) either straddle the unconformity or are wholly hosted by basement rocks below a regional unconformity, in some cases up to hundreds of metres to over a kilometre below. There are also examples of perched mineralisation above the U/C; for example at Cigar Lake. The type and best endowed locations for this group of uranium deposits are the NW McArthur (Figure 2) and Athabasca (Figure 3) basins (Table 1).
The genetic relationship to the unconformity in some cases is unclear. This is particularly true for the Alligator Rivers Uranium Field (Figure 2) where most of the known unconformity-type uranium deposits are hosted in the basement rocks below the regional unconformity and where this unconformity surface and younger siliciclastic cover rocks have been partially or completely eroded and subjected to extensive and intense lateralisation. In these cases, proximity (within hundreds of metres) to the unconformity can be inferred from adjacent outcrops and/or by extrapolation [29]. Some deposits of similar age and with similar characteristics also occur hundreds of meters above the unconformity, wholly within the clastic cover sequences and spatially associated with mafic dykes and sills (e.g., Westmoreland, Queensland, Australia; Figure 2; [30] and Matoush, Quebec, Canada; Figure 1d; [31]) but these are uncommon.
Host structures within the Athabasca Basin (Figure 3) are generally near vertical, although reactivated thrust-related deposits such as McArthur River and Shea Creek are associated with moderately dipping faults. Gyorfi et al. [32] showed that the main structure associated with the McArthur River U deposit is listric at depth. Host structures for the giant Ranger and Jabiluka deposits beneath the NW McArthur Basin (Figure 2) tend to be gently dipping and also have a listric architecture [33,34].
Much of the primary hydrothermal uranium is in the form of uraninite veins. Relatively few studies have specifically addressed vein geometry and how this geometry relates to regional paleo-stress fields [35]. Johnstone [33] noted that a prime control on the formation and distribution of uraninite veins in the Alligator Rivers deposits was the pervasive schistosity of the host rocks, with veinlets typically oriented parallel to the plane of schistosity. The crystalline (metamorphic/igneous) host-rocks of the Athabasca deposits tend to be more massive and gneissic, and, hence, vein arrays in the latter region are less likely to be controlled by schistosity. This fundamental mechanical difference between the basement rocks of the two regions may have been an important genetic factor and explain the higher ore grades of some of the Athabasca deposits compared to those of the NW McArthur Basin. Detailed descriptions of uranium mineralisation in the Athabasca Basin have been provided by Hoeve and Sibbald [36]; Hoeve and Quirt [37,38]; Wallis et al. [39]; Kotzer and Kyser [40]; Quirt [41]; Alexandre et al. [42] and Jefferson et al. [1,3]. Comprehensive accounts of uranium mineralisation in the NW McArthur Basin have been provided by Taylor [43]; Binns et al. [44]; Ferguson et al. [45]; Needham [46]; Valenta [47]; Wilde [48]; Polito et al. [49,50]; Ahmad et al. [51,52]; Wall [53] and Skirrow et al. [54,55].
Hydrothermal alteration associated with unconformity-type deposits is typically extremely intense, mineralogy-destructive and variably texture-destructive. In many deposits even quartz was dissolved, a process considered important in terms of creating secondary porosity and enhancing permeability. Ore proximal alteration minerals include magnesian chlorite, hematite, sudoite, illite and tourmaline. Overall, the alteration assemblages are indicative of low temperature (probably <250 °C), low pH (probably <5) and high oxidation state at the site of uranium deposition [3,29,56,57,58,59].
The results of a geochronological study of unconformity-related uranium deposits in the Athabasca Basin by Alexandre et al. [60] suggest that uranium mineralisation occurred at approximately 1590 Ma. Younger mineralisation ages proposed by previous workers were rejected on the basis of these age dates most likely reflecting Pb loss due to renewed fluid circulation, partial uranium remobilisation and uraninite recrystallisation initiated by far-field tectonic events. A compilation of all available U-Pb and Ar-Ar ages for the Athabasca Basin deposits by Chi et al. [59], suggests that most of the unconformity-type uranium systems formed at approximately 1540 Ma. The broad time span of the compiled U-Pb and Ar-Ar ages, from approximately 1650 Ma to <100 Ma was interpreted by the authors as due to (partial) isotopic resetting, possibly reflecting uraninite recrystallisation, loss of radiogenic lead and partial uranium remobilisation during later fluid infiltration and/or thermal events [60]. Fayek et al. [61] report 207Pb/206Pb ages of 1770–1650 Ma for disseminated uraninite at the Millennium uranium deposit, although they also report ages of 1400–1200 Ma for massive, vein-type and fine-aggregate mineralisation. The 1770–1650 Ma ages are older than the currently accepted depositional age for the Athabasca Basin fill (1710 Ma) and similar to ages obtained for the Beaverlodge vein-type uranium deposits, leading the authors to suggest disseminated uranium in the basement, in addition to uranium from basin-fill sediments as a possible source of economic accumulations of metal in some of the Athabasca Basin uranium deposits.
Isotopic data for the Alligator Rivers deposits also yielded a broad spectrum of ages and, therefore, considerable uncertainty exists as to the precise age of primary uranium deposition in this region. Indeed, it is unresolved as to whether the deposits of this region formed at the same time or whether the region recorded different metallogenic episodes. A recent study of uraninite from the Ranger deposit using ion microprobe yielded a discordia array of upper intercept ages of 1688 ± 46 Ma, with possible resetting at approximately 1420 and 1040 Ma [55]. This could indicate that deposits of the ARUF are generally older than those of the Athabasca Basin.

3. The Unconformity-Type Uranium Mineral System

3.1. Geodynamic Setting

3.1.1. Exhumation and Weathering of Crystalline Basement Rocks

Crystalline (metamorphic/magmatic) basement rocks underlying the Athabasca and NW McArthur basins were likely exhumed prior to the onset of intracratonic basin development and sedimentation and, therefore, had cooled to ambient temperatures. The age of exhumation remains poorly defined (e.g., [60,62]). A clay-rich layer immediately below the basal sediments of the Athabasca Basin has been interpreted as a paleoregolith [63]. Clay alteration immediately beneath the Kombolgie Subgroup (Northern McArthur Basin), however, clearly replaces the basal sandstone [64]. Skirrow et al. [55] proposed that this “paleoregolith” alteration reflects regionally extensive basinal fluid flow that leached uranium from metamorphic rocks immediately below the unconformity. A similar paleoregolith alteration model was previously also proposed for the Athabasca Basin by Hecht and Cuney [65,66].

3.1.2. The Clastic Basins

Unconformity-type uranium systems, in particular the globally significant examples (e.g., Athabasca and NW McArthur River uranium systems), are typically spatially and genetically associated with terrigenous intracratonic basins of Proterozoic age whilst epicontinental and foreland basins are comparatively poorly endowed. Other basin types and basins of Phanerozoic age appear to be non-permissive for this style of uranium mineralisation [2,67].
Different tectonic processes produce different types of sedimentary basins with intracratonic basins amongst the longest-lived [68] and deepest (e.g., 20 km in the case of the Barents Sea intracratonic basin: [69]) types of basins. Whilst their formation mechanisms are still poorly understood, intracratonic basins are known to form large saucer-shaped bodies, contain a relatively symmetric fill and occur in clusters that form during supercontinent breakup and reactivate during supercontinent assembly [70,71]. Diagenesis of the thick sedimentary pile above a regional unconformity, which separates the oxidised, generally highly permeable basin fill from the underlying basement, is considered a key driver of brine development with subsequent intrabasinal fluid migration likely driven by far-field tectonic forces and elevated geothermal gradients and controlled by sediment and fault permeability [68].
The siliciclastic and mafic volcanic rocks unconformably overlying the crystalline basement rocks in the Alligator Rivers uranium field are assigned to the Kombolgie Subgroup of the Katherine River Group (Figure 4a), the oldest component of the NW McArthur Basin. The total preserved thickness of the Kombolgie Subgroup is less than one kilometre [52]. The sequence is dominated by coarse, sometimes pebbly sandstones, and contains two interbedded volcanic units, the stratigraphically lower Nungbalgarri Formation and higher Gilruth Volcanic Member. The up to 60 m-thick Nungbalgarri Formation is composed of highly altered subaerial basalt. Pillow textures suggest some subaqueous extrusion occurred locally. The narrow (5 m-thick) Gilruth Volcanic Member comprises of subaerial basalt pyroclastic and epiclastic sedimentary rocks and jasper beds. The dominant environment of deposition of the Kombolgie Subgroup was a braided river system with aeolian and tidal influences [52]. The depositional age of the lowest unit, the Mamadawerre Sandstone, is bracketed between 1820 and 1730 Ma [72]. Overlying the Kombolgie Subgroup is the 340 m-thick McKay Sandstone. This unit may have played an important role in the uranium mineralisation process as it recorded evidence of evaporitic conditions and buried evaporite salts are known contributors to basinal brine formation. However, it is unknown whether this unit had already been deposited at the time of, or prior to, uranium mineralisation [73].
Diagenesis of the Kombolgie Subgroup resulted in the formation of quartz overgrowths on clastic quartz grains and development of interstitial dickite and illite [78,79]. Dickite replaced earlier kaolinite, whereas illite pseudomorphed earlier dickite [79].
The preserved maximum thickness of the Athabasca Group (Figure 4b) is 2.3 km [59,77] although the estimated aggregate thickness of the basin succession is 3.8 km [77]. Sedimentary environments of the older portion of the basin range from fluvial to marginal marine to marine. Depositional units are dominated by quartz-rich sandstone and conglomerate and also contain minor red silty mudstone. The detrital quartz grains typically have coatings of hematite, often overgrown by secondary quartz as in the Kombolgie Subgroup. The depositional age of the lowest unit (Read Formation) is approximately 1750 Ma [60], although more recent LA-ICP_MS monazite and zircon geochronology by Jeanneret et al. [80] suggests a maximum age of 1710 Ma for the onset of sedimentation in the Athabasca Basin. The youngest units are the Douglas Formation sandstones and organic pelites dated at 1540 Ma [81]. The overlying Carswell Formation is the youngest unit in the Athabasca Basin, and as with the McKay Sandstone of the Alligator Rivers area, contains pseudomorphs after evaporite minerals (in this case gypsum) and solution collapse breccias in stromatolitic dolomite [82]. In contrast to the Kombolgie Subgroup of the ARUF, the Athabasca Basin contains no significant volcanic members.
The diagenetic clay mineral history as recorded by the Athabasca Basin fill is similar to that of the NW McArthur Basin. Diagenesis of the Athabasca sandstones involved formation of interstitial phyllosilicates such as dickite, illite and chlorite, and minor dravite, goyazite and other aluminophosphates. Kaolinite, in most cases, may be regarded as a late overprinting phase given that the paragenetically early kaolinite was largely transformed to dickite and illite after kaolinite and/or dickite [1] (Figure 6), [37,83,84].

3.1.3. Pressure, Temperature and Time History at the Unconformity

Reconstructing the pressure, temperature and time trajectory of the basinal rocks and subjacent basement is crucial to understanding ore-forming processes. There is no compelling stratigraphic evidence that the McArthur Basin cover above the crystalline basement-hosted Alligator Rivers uranium field was ever significantly greater than 1 km, the maximum preserved thickness of the Kombolgie Subgroup. However, indirect evidence summarised below suggest a likely thickness of the stratigraphic column in the range from 4 to 6 km.
Durak et al. [78] obtained a range of fluid inclusion homogenisation temperatures in quartz overgrowths on clastic quartz from the Kombolgie Subgroup ranging from 65 to 210 °C and documented evidence of increasing fluid salinity from core to rim of the overgrowths. This could imply burial depths ranging from 2 to 6 km assuming a standard geothermal gradient of 35 °C/km. The possibility of partial or complete leakage, refilling and/or volume changes of the inclusions was not assessed or discussed. Fluid inclusion studies by Ypma and Fuzikawa [85], Wilde et al. [86] and Derome et al. [57] suggest that at the time of ore formation the clastic cover had reached at least 4 km. However, many of the studied inclusions were in drusy quartz veins of uncertain timing with respect to basin development and uranium mineralisation, and the possible impact of leakage or volume change on the fluid inclusions was not considered.
Patrier et al. [79] considered that illite morphology and the well-ordered nature of diagenetic dickite meant that burial of the Kombolgie sandstones probably exceeded 4 km. It should be noted, however, that this conclusion is based on samples from a single drill hole, and by analogy with the Phanerozoic Rotliegendes Sandstone of the Netherlands [87]. Such burial depths imply that nearly 3 km of sediment has been eroded. Peak diagenetic phases in the Athabasca Basin are also illite and dickite but with minor goyazite, clinochlore, hematite and dravite. Early silicification in the form of overgrowths on detrital quartz grains is also a feature of the Athabasca Basin [40,88]. A study by Pagel [89] of fluid inclusions in quartz overgrowths in sandstones from the Athabasca Basin revealed paleo-fluid pressures and -temperatures at the base of the basin of 1500 bars and 220 °C, equivalent to a burial depth of approximately 5.7 km at a standard geothermal gradient of 35 °C/km. Later fluid inclusion and clay mineral geothermometric studies by Hoeve and Quirt [37], Kotzer and Kyser [40], Derome et al. [90], Cloutier et al. [91] and Richard et al. [58] obtained broadly similar results with temperatures in the range from 180 to 250 °C, which were taken as further evidence that the unconformity-type uranium deposits in the Athabasca Basin formed under deep burial conditions. In contrast to the conventional genetic model above, the shallow burial mineralisation model of Chi et al. [59], which takes into account more recent regional geochronostratigraphic and ore geochronological data, assumes burial depths of the basal Athabasca Basin unconformity surface at the authors’ preferred time of uranium mineralisation (ca. 1540 Ma) of approximately 3.0 km, or less. In this model, (i) the elevated fluid pressures that support the deep-burial model are regarded as overestimates linked to misinterpretation of certain solid phases, whilst (ii) the elevated fluid temperatures that support the deep-burial model are considered as local or basin-wide elevations of the geothermal gradient at the time of mineralisation, followed by continued burial and/or temporarily increased thermal gradients after mineralisation.
For both the Athabasca and Kombolgie (McArthur) basins there is a substantial discrepancy between maximum burial temperatures likely beneath 1.5–3.0 km of clastic sediments and those inferred from fluid inclusion homogenisation temperatures, clay mineral and stable isotopic data. Chi et al. [59] recently questioned the evidence for deep burial beneath the Athabasca based on fluid inclusion data, noting that “burial depths were likely ≤3 km”. The authors concluded that elevated fluid pressures used to support the deep burial model were probably “overestimated due to misinterpretation of accidentally entrapped halite crystals as daughter minerals”. While the fluid inclusion homogenisation temperature data are probably adversely impacted by misinterpretation and by varying degrees of unrecognised leakage and/or volume change, it nevertheless seems plausible that maximum temperatures at the unconformity were in excess of that expected by burial of between 1 and 3 km and a normal geothermal gradient. The assumption of a normal geothermal gradient, however, is probably invalid in the intracratonic environment of basin formation where thinned crust would have led to high heat flow.

3.2. Regional Fault Architecture

The structural architecture including major lithostructural corridors like the WMTZ that hosts most of the deposits in the Eastern Athabasca Basin [92], compositional makeup and deformation history of the basement rocks that host the intracratonic basins may be regarded as first-order controls on uranium fertility and mineralisation (e.g., [3,54,93]).
The structural architecture preserved by the crystalline basement rocks probably not only influenced intracratonic basin formation but also intrabasinal fault development and propagation, basin fill architecture and thickness, and fault-controlled fluid flow. As illustrated by Martz et al. [94] and Eldursi et al. [95], long-lived basement-hosted fault systems in the Athabasca Basin region, in particular those that were (repeatedly) reactivated during retrograde metamorphism and exhumation at approximately 1800–1720 Ma [92], constituted major fluid pathways, providing the possibility for oxidised basinal brines to flow down into brittle basement-hosted damage zones and reduced basement fluids (and/or gases) to rise up along faults that extend from the basement into the sandstone. In other words, faults that penetrate from the basement into the basin would have greatly enhanced permeability and, thus, constituted critical fluid pathways and important loci for fluid–rock interaction and fluid mixing, critical processes in the formation of unconformity-type uranium deposits (e.g., [95,96,97]).
Recent studies by Benedicto et al. [98], Hillacre et al. [99] and Abdelrazek et al. [100] of the Arrow (Figure 3) and Spitfire uranium deposits (Patterson Lake corridor, Southern Athabasca Basin), build upon work by previous authors [36,39,92,101,102,103] to further demonstrate the importance of reactivated basement structures, in particular graphitic shear zones, and the spatial coincidence of such structures with zones of strong rheological and chemical contrasts. Brittle, reactivation of a network of anastomosing graphitic shear zones within the Patterson Lake corridor triggered dilatational micro-brecciation followed by strong dissolution, thereby creating a new permeability network and structural geochemical traps. The Spitfire uranium deposit [98,100] is an excellent example of the structural complexity and prolonged deformation history recorded by the crystalline basement rocks hosting some of the unconformity-type uranium systems. At Spitfire, brittle deformation was most intense at a pre-existing structural bend along a >50 m-wide mylonite zone where the change in strike is interpreted to have induced local transtensional conditions that resulted in the creation of dilational-jog structures through reverse-sinistral reactivation and brittle overprinting of prior ductile structures. Mineralisation occurs along zones of strong rheological contrast between the shear zone and silicified, locally pyritic gneiss. Four major tectonic events have been interpreted: (i) D1: Gneissification and mylonitic shear zone development under high temperature (>600–800 °C), upper amphibolite to granulite facies metamorphic conditions; (ii) D2: Local rotation of D1 structures from NE-SW to NNE-SSW; (iii) D3: NNE-SSW-directed shortening and opening of the reoriented D1 shear zones, facilitating fluid flow through and pitchblende precipitation within these shear zones and (iv) D4: NNE-SSW-directed shortening, formation of NNE-SSW-striking fracture corridors and the second mineralising event [98,100].
Further excellent examples include the (i) large, recently discovered, basement-hosted Arrow uranium deposit [99], which is interpreted as a strike-slip dominated system of Riedel faults that formed along multiply reactivated, subvertical, NE-SW-striking chloritic-graphitic shear zones that developed along the limb of a regional F3 fold in the multideformed basement below the Athabasca Basin; (ii) basement-hosted Sue C uranium deposit [35,104], which is interpreted as a brittle fault-fracture ± breccia system that developed along and overprinted ductile structures, including subvertical graphitic shear zones, that formed prior to the Athabasca Basin and in an area of strong rheological contrast between competent quartzite, weaker paragneiss and very soft graphitic paragneiss and (iii) the giant Cigar Lake uranium deposit [94,105], which is also controlled by early-formed, basement-hosted, ductile shear zones that recorded later brittle reactivation under far-field tectonic stress that, in combination with contemporaneous fluid infiltration and graphite precipitation, produced major changes in the petrophysical, mineralogical and chemical characteristics of the reactivated basement structures and their surrounding damage zones, in particular a significant increase in fracture porosity and rock weakness toward the central parts of these ductile-brittle structures.
While several detailed structural studies exist for unconformity-type uranium deposits in the Athabasca Basin (e.g., [35,98,99,100,104,106,107,108]), little such work has been published for the uranium deposits of the NW McArthur Basin. A structural study by Hein [34] of the Ranger deposit, where the uranium host rocks are interpreted to have been subjected to regional metamorphism (D1) and the development of a pervasive, bedding-parallel schistosity (S1), two, or more, phases of brittle-ductile deformation (D2-D3; correlated with the Top End Orogeny at 1870–1780 Ma) that resulted in the development of NNE-SSW- to NNW-SSE- (F2) and WNW-ESE- to NW-SE- (F3) trending folds, a weakly defined axial planar cleavage (S3) and a network of thrusts and dextral reverse shears, and one phase of brittle deformation (D4) that resulted in the development of normal faults and fault breccias correlated with regional E-W-directed extension during deposition of the Paleo- to Mesoproterozoic clastic sequences. Hein’s [34] sequence of tectonic events suggests that the uranium mineralisation at Ranger formed during extension in D4 and after emplacement of the Oenpelli Dolerite at 1690 Ma, a timing that is broadly similar to age dates established for the Jabiluka and Nabarlek deposits. Clearly, additional structural studies, both at the deposit and regional scales, are required for a better understanding of the structural controls on uranium deposition in the NW McArthur Basin.

3.3. Archean Complexes

During regional tectonism, strain is commonly partitioned preferentially along zones of strong rheological contrast [109]. Such zones are typically marked by fault or shear zone systems, or provide the focal points for fault generation in previously undeformed rock volumes. In the Alligator Rivers Uranium Field, the rheological contrast between the adjacent highly competent Archean gneisses and the less competent to ductile Paleoproterozoic metasedimentary basement lithologies facilitated the development and reactivation of deep-seated high strain zones. Crustal-scale structures would have existed already, having facilitated the emplacement of the Archean melts, but reactivation and propagation of these structures through the Proterozoic sequences, and preferentially along the edges of the Archean complexes likely controlled basin development and basin-fill geometry in the Pine Creek Orogen.
This is interpreted to have been a key factor in the genesis of all the major ARUF uranium deposits [110]. A similar association between uranium mineralisation and, in this case concealed, Archean gneiss domes is observed for several major deposits in the Eastern Athabasca Basin (e.g., Eagle Point, Collins Bay: [3]). Pilkington [111] demonstrated that airborne magnetic surveys and magnetic susceptibility measurements from basement-penetrating drill holes could be used to extend mapped basement geology from surficial outcrops on the margins, to areas below the Athabasca Basin. Card [86] and Thomas and McHardy [87] used this technology to identify first-order exploration targets in areas of high magnetic gradient at the boundaries between Archean gneiss domes and the Wollaston Supergroup. The close spatial relationship with uranium mineralisation makes the margins of these domal features an obvious focus for exploration. The Archean Nanambu Complex in the ARUF is clearly visible in magnetic data as a roughly 25 km × 50 km lobate zone of subdued response to the west and adjacent to the Ranger 1 and Jabiluka uranium deposits (Figure 5). Another elongated (roughly 120 km-long) north-oriented domain of relatively low and uniform magnetic response, further to the west and adjacent to a prominent marker horizon in the Cahill Formation [112,113], has been interpreted [114] to represent an undercover extension of the Archean Nanambu Complex. However, the identification of possible Archean complexes from magnetic data is hampered throughout much of the northern McArthur basin due to the ‘masking effect’ by lithologies with a high remanent magnetisation: extensive dolerite sills (up to 250 m-thick) and volcanic units within the basin-fill Kombolgie Sandstone act to supress the magnetic signature of the crystalline basement over extensive areas.
The presence of Archean basement rocks had been reported in the Nabarlek and Caramal areas in the early 1960s [115], but subsequent workers interpreted the oldest rocks in that area to be Paleoproterozoic in age [116]. However, the presence of exposed Neoarchean basement close to the Nabarlek and Caramal deposits has subsequently been confirmed by mapping and geochronological analyses [117,118,119,120], significantly increasing the prospectivity in that area (Figure 5).

3.4. Fluid Reservoirs

At least three possible fluid reservoirs can be postulated. The first of these is an aquifer (or series of aquifers) within the clastic basins. The second is porous and permeable fault zones within the crystalline basement rocks and clastic basins. The third is suggested by several recent studies indicating an evaporitic origin for the brines involved in ore formation, that is, salt lakes at the surface of the basins [121,122]. The latter would negate the need for any evaporitic sequences with the intracratonic basin fill.
Presumably, the coarse clastic sediments of the Athabasca and McArthur Basins would have been relatively porous and permeable during at least the early stages of compaction and diagenesis. The effectiveness of the quartz-rich sediments as reservoirs for oxidised brines would have been enhanced by the overall absence of any phases that could have buffered their oxidation state (e.g., ferrous minerals such as chlorite or plant matter). The presence of Fe2+-rich mafic volcanic rocks (e.g., Nungbalgarri Volcanics) may, however, have provided a localised redox buffer within the basin. Furthermore, dickite, kaolinite and illite would have buffered the pH of any interstitial brines at an acidic pH, conducive to metal transport as chloride complexes [56,123,124].
Hydrothermal alteration in many cases involves extreme dissolution of the quartz contained in crystalline (metamorphic/igneous) host-rocks and even in some cases in clastic rocks [29,36,37,94]. The most likely scenario for such intense desilicification at a pH below neutral and temperature of <250 °C is that the brine increased in temperature as it flowed into the deposits. In other words, desilicification indicates fluids derived from above the level of the unconformity.
The second possible reservoir type is porous and permeable fault zones in crystalline basement rocks. It is unlikely that the basement rocks could have given rise to ore-forming volumes of fluid by metamorphic dewatering, given that the rocks would have been dehydrated during regional metamorphism prior to basin formation. Since the crystalline basement rocks are typically reducing (i.e., rich in ferrous iron, graphite and/or sulphides) it is likely that the capacity of the basement-equilibrated fluids for transporting uranium was several orders of magnitude less than that of the oxidised brines circulating above the unconformity [56,86,123]. Basement-equilibrated fluids would also have been quartz-saturated and, thus, prone to deposit quartz after moving upwards into the deposits and cooling. Upwards movement of such basement-derived fluid (e.g., along faults) is thus the probable origin of silicification in some unconformity-type uranium deposits. Reduced basement-derived fluids may have been instrumental in forming some unconformity-type uranium deposits, not just because they had the potential to carry elevated uranium, but because they mixed with and reduced oxidised basin-derived brine [36,37,39,96].
Wilde [64] proposed that the inferred high salinity and high oxidation state of mineralising brines in the Alligator Rivers uranium field were derived through dissolution of Middle Proterozoic evaporites. More recently, Mercadier et al. [122] provided boron isotope evidence from syn-uranium tourmaline suggesting a similar origin for boron (and magnesium) in the Athabasca basin tourmalines. A reservoir of oxidised brine in a salt lake is a corollary of both studies.

3.5. Metal Sources

A wide range of possible sources of uranium and other metals has been proposed and discussed, summarised for the Athabasca Basin in Jefferson et al. [3]. Potential uranium sources can be grouped into three main categories.
In the first category are various metamorphic and igneous rocks of the basement, including possible syn-sedimentary preconcentrations in carbonaceous metasedimentary rocks (e.g., [125,126]) and magmatic enrichments in S-type granitoids [65,127,128]. Metal would have been leached directly from these rocks by the hydrothermal fluids involved in ore formation. Direct involvement of uranium-enriched magmatic fluids is implausible due to the absence of intrusions contemporaneous with uranium deposition [44]. Syn-sedimentary preconcentration in carbonaceous metasediments was discounted by Binns et al. [44] for the Jabiluka deposit owing to the absence of any evidence of uranium depletion in these rocks. More recently, Richard et al. [58] noted high metal contents in fluid inclusions from five Athabasca uranium deposits comparable with “those found in basin-hosted Pb-Zn deposits for which a basement metal source has frequently been invoked”. Nevertheless, the conclusion of this work was that the exact origin of the metals remains uncertain”. Pascal et al. [66] used mass balance calculations to document uranium depletion in the variably graphic pelitic schists within the crystalline basement complex below the Dufferin Lake Zone.
In the second category are various detrital and diagenetic phases occurring within the basal sediments of the Athabasca and McArthur Basins [129].
The third source category is surface and near-surface evaporitic environments in which high uranium concentrations in hypersaline brines are achieved largely through evaporation. Isotopic evidence has been advanced in support of an evaporitic origin for the ore-forming brines [121] and evaporitic sediments of suitable age occur in both the Athabasca and McArthur basins.

3.6. Fluid Pathways and Flow Drivers

3.6.1. Fluid Pathways

Fluid pathways were present at a range of scales and crustal depth levels and can be subdivided into structural and stratigraphic conduits.
Brittly reactivated crustal-scale ± graphitic shear/fault zones in the basement are considered 1st order structural controls on fluid flow, in particular ‘extended basement faults’ that transgress the basement and overlying basin fill (i.e., they breach the unconformity). Numerical modelling studies have provided insights into the critical role of such structures in controlling fluid flow patterns and the locations of uranium mineralisation [95].
Faults in basement rocks hosting uranium mineralisation are often marked by brecciation and cataclasis, typically with abundant graphite (including semi-graphite and other carbonaceous matter), and marginal hydrothermal alteration. Alteration intensity drops off within a few metres of the principal carrier faults (e.g., Nabarlek: [29]). Adjacent to mineralised structures alteration is typically texture destructive, whereas metamorphic rock textures are preserved a few metres distant from the faults. This suggests strongly that the rocks around the faults were highly permeable, with permeability perhaps enhanced by quartz dissolution.
Other pathways probably included extensive and generally subhorizontal aquifers developed in oxidised red-bed sandstone and conglomerate within the overlying basins [130,131] and the altered zone immediately beneath the respective unconformities (so-called paleo-weathering profile: [55,64,65,66]).
Patrier et al. [79] observed that quartz overgrowths within sandstones of the Kombolgie subgroup sometimes developed to the extent where porosity was completely occluded and sandstones became orthoquartzites. The presence of continuous but relatively thin (<10 m) concordant silicified layers has been noted at Jabiluka and Koongarra [64] and elsewhere in the region [79]. Silicification probably resulted in the formation of aquicludes and may have restricted fluid flow to more restricted portions of the sandstone sequences.

3.6.2. Drivers of Fluid Flow

It is unlikely that provision of magmatic heat was significant in driving fluid flow, owing to the absence of significant intrusive activity at the time of uranium mineralisation in either the McArthur or Athabasca Basins. Intrusion of the voluminous Oenpelli Dolerite dykes, sills, laccoliths and lopoliths occurred throughout the ARUF at circa 1723 Ma, approximately coincident with deposition of the Kombolgie Subgroup [132]. Although the relative age of the Oenpelli Dolerite with respect to the Kombolgie Formation remains uncertain, there is scant evidence that the Dolerite intrudes the Kombolgie Subgroup and therefore probably predates it.
Given basin deposition in an intracratonic setting, elevated heat flow due to crustal thinning is possible, indeed elevated heat flow alone may have driven hydrothermal cells within the basinal rocks. Thermally-driven free convection has been modelled for the Athabasca and basal McArthur basins by Raffensberger and Garven [130,131] and Cui et al. [96] and for the Mount Isa area (as an example of extension-related basinal deposits in general) by Oliver et al. [133]. These studies assumed a modest geothermal gradient of between 25 and 35 °C/km under conditions of tectonic quiescence.
The models suggest that thermal convection may develop in a thick sandstone sequence given Oliver et al. [133] recognised that convective cells were unlikely to penetrate into the relatively impermeable basement rocks, until compaction and diagenesis had substantially reduced the permeability of the basin rocks. None of the authors considered the possible effect of aquitard units, which must surely have led to compartmentalisation of the basinal rocks and thereby exerted a control on the size of convective cells and their ability to sweep large thicknesses of sandstone. Seismic studies carried out in the eastern Athabasca Basin do not support the assertion that crustal thinning was the main driver of fluid flow [32,102,103].
Radiogenic heating as a means of initiating fluid flow was proposed by Binns et al. [44] for the Jabiluka deposit (ARUF). These authors proposed that elevated levels of radiogenic elements in post-tectonic granitoid intrusions (1800 Ma) of the region generated “broad circulatory fluid systems” citing modelling carried out by Fehn et al. [134]. A similar assertion was made by Schaubs et al. [135] for the Eastern Athabasca Basin, with radiogenic heating of the crystalline basement rocks taking place beneath an overlying thermal blanket of sedimentary basin-fill. This model would also provide a source of uranium, but fails to explain the oxidised and hypersaline nature of the hydrothermal fluids and massive desilicification associated with ore. The latter feature is strongly indicative of quartz-undersaturated fluids that are most unlikely to have developed in association with granitoid rocks and the metasedimentary rocks that they intrude.
Since faults are clearly an important and ubiquitous aspect of unconformity-type deposits, deformation-induced fluid flow was modelled by Cui et al. [96] assuming a 7 km-thick sedimentary basin, plus a hydrostatic pressure regime, a temperature gradient of 30 °C/km and permeable and porous fault zones transgressing the unconformity. During extension it was found that basinal fluids were able to move downwards into the basement rocks along faults, due to the development of underpressure in fault zones below the unconformity. Similar conclusions were drawn by Oliver et al. [133]. Conversely, the models predicted that during compression basement-equilibrated fluids moved upwards, an observation supported by Schaubs et al. [136] with numerical modelling in the Eastern Athabasca Basin. Modelling also demonstrated that convection is disrupted or even suppressed completely during deformation. Two-dimensional and 3D numerical modelling by Eldursi et al. [95] of fluid flow patterns associated with multiple basement faults in a lithologically diverse setting (representing the Cigar Lake uranium deposit: Figure 3) indicated that basement faults can facilitate both ingress and egress flow and at the same time, a scenario that permits basinal fluids to flow down into the basement and basement fluids to rise up into the sandstone. In such a model, it would be possible for basement- and the sandstone-hosted uranium mineralisation to form in the same area. This assertion is supported by U-Pb isotopic studies at the sandstone-hosted (U/C) Phoenix and nearby basement-hosted Gryphon uranium deposits [136].
The possible role of topography in driving fluid flow is difficult to assess given a dearth of evidence on the nature of the topography during ore formation. Change in topography is a necessary function of compression or extension and is inherent in modelling by Cui et al. [96]. These authors do not regard change in topography in their models to be a significant contributor to the predicted fluid flow regimes.
Thus, we conclude that the most likely driver of fluid flow that led to the formation of unconformity-type uranium deposits is the initiation of permeable faults during intracratonic basin evolution.

3.7. Metal and Ligand Transport and Deposition

Evidence, principally from various fluid inclusion studies points towards oxidised Na- and Ca-rich brines as the ore-forming fluids [57,78,85,86,137,138]. Under modest temperature and pressure and acidic pH, oxidised brines are capable of transporting large quantities of uranium as chloride complexes [86,123,124]. Such brines could also carry substantial volumes of copper, gold and PGE leached from the voluminous intracratonic basin fill. While traces of copper are not uncommon in unconformity-type uranium deposits, gold is sometimes present in economic amounts as at the Jabiluka and Cluff Lake deposits (Table 1). Anomalous levels of PGE are not uncommon [56] with ore grade levels reported from the Coronation Hill deposit [26]. Polymetallic deposit end-members characterised by anomalous concentrations of sulphide and arsenide minerals (Ni, Co, Cu, Pb, Zn, Mo ± Au, Ag, Se and PGE) have also been reported from the Athabasca Basin where such deposits are typically hosted by sandstone and conglomerate and within 25–50 m of the basement unconformity (e.g., Cigar Lake) [1].
The majority of unconformity-type uranium deposits are hosted either directly within graphitic rocks or are proximal to graphitic/carbonaceous rocks. Indeed, detection of the graphitic units (which are anomalously conductive) has been a central plank of exploration strategy for many companies. The association of uranium with graphitic rocks led to the proposition that direct reduction of oxidised brines resulted in uranium deposition (e.g., [56,123,124]). Ferrous iron-rich units such as amphibolite may also have acted as a direct reductant, as for example at Nabarlek [29,124]. Indeed, several relatively recent discoveries have been made in rocks lacking appreciable graphite (e.g., Eagle Point where Yeo and Potter [139] interpreted Fe2+ to have been the likely reductant).
It has also been suggested that reduction was affected by a mobile CH4-rich gas phase derived from fluid interaction with graphite [29,37,38,39,56]. Such a model could explain why uranium was precipitated within the sandstones of the basin sequences, which generally lack phases capable of buffering oxidation state. Dargent et al. [140] proposed that the reductant could have been hydrogen gas rather than methane. Pascal et al. [66] demonstrated that the destruction of graphite and sulphides could generate enough methane (and H2S) to cause significant uranium deposition.

4. Prospectivity Mapping

4.1. Background

Methods of mineral potential modelling can be broadly divided into two types. Data-driven (empirical) approaches rely on the existence of training data to quantify spatial associations between known mineral occurrences and different geological features [12,13,141,142,143,144]. Conversely, knowledge-driven (conceptual) approaches use an expert opinion to subjectively assign values based on the perceived importance of a particular geological feature in the mineral system [145,146]. Knowledge-driven approaches for uranium exploration (e.g., fuzzy logic MPA) are based entirely on conceptual uranium targeting models and can be performed without the need for a training set of known mineral deposits/occurrences.
The general approach used in MPM is that weights are assigned either on the basis of statistical measures or cognitively to features represented in a set of predictor maps. A variety of integrating functions can then be used to combine the rasterised evidential layers in order to arrive at a measure of prospectivity for each unit area (i.e., as represented by a pixel). A key consideration is that all rasterised predictor maps are constructed in such a way that their pixels are the same size and aligned so that mathematical operations can be performed between predictors on a pixel-by-pixel basis (Figure 6).
The resulting favourability maps can be used as a measure of the relative prospectivity of various land packages in an area of interest. Previous work and successful application of the technique over a wide range of scales and targeting a variety of mineral systems (e.g., [15,147]), has shown that prospectivity modelling provides a sound basis for ground acquisition, and financial and tenement management decision-making. Hybrid approaches [148,149] incorporate aspects of both methods.
A statistically guided, knowledge-driven approach was used in this study. Fuzzy weights (see Section 4.6 below) assigned to predictor maps and their features were influenced by both statistical evidence (i.e., weights of evidence—Section 4.5.1) and the opinions of a group of ‘expert’ geologists familiar with the mineralising model. The approach involves the following steps:
  • Build an inventory of all relevant GIS data in order to assess their suitability for MPM.
  • Construct suitable predictor maps (inputs) applicable to the mineralisation models under consideration.
  • Test spatial relationship of features to known deposits using weights of evidence.
  • Apply appropriate fuzzy weights to predictor maps and their features, based on lessons learnt from statistical assessments, and their perceived importance in the ore genesis model.
  • Rasterise predictor maps using the fuzzy weights as the pixel values.
  • Combine weighted predictor maps with the fuzzy logic inference network.

4.2. Compilation and Assessment of Available Spatial Data

A thorough audit of all publically available spatial data for the NW McArthur Basin and Northern Saskatchewan was undertaken in order to compile a suite of data, which could be turned into proxies for components of the mineralisation genetic models. The Canadian project area was confined to Saskatchewan due to the availability of high quality, uniform data sets from which suitable predictor maps could be generated. Both studies benefited from an abundance of precompetitive multidisciplinary datasets, freely available from the various national and state/province geoscientific authorities (i.e., Geoscience Australia, Geological Survey of Canada, Northern Territory Geological Survey and Saskatchewan Geological Survey).
Datasets used in the NW McArthur Basin study included solid geology (1:500,000 scale), surface geology (1:1 million scale), faults (1:500,000 scale) and gravity/magnetics geophysical data. For the Athabasca Basin, useable datasets included solid interpreted geology (1:250,000 scale), faults (1:250,000 scale), air and ground electromagnetic (EM) conductors, magnetic interpretations of Precambrian domains, structural interpretation from the Extech IV Geoscience Database [150] and gravity/magnetics geophysical data. Source data are listed for the NW McArthur Basin and Athabasca Basin studies in Table 2 and Table 3 respectively. Additional datasets showing the location of uranium deposits and occurrences were not used as inputs for predictive modelling but were used to assess the validity of the output.
Wherever possible, the aim was to include only data that provide uniform and complete coverage of each study area. The geophysical datasets (gravity and magnetics) prepared by Geoscience Australia and the Geological Survey of Canada are levelled compilations of numerous geophysical surveys conducted over several decades. As such, the wide range of equipment used during acquisition of the original data and variations in survey parameters such as flight line spacing, result in significant spatial variations in the quality of the nation-wide compilations. The compilations represent the best available data at the scale of these studies but their inherently inhomogeneous character needs to be kept in mind when interpreting results. Geophysical grids were treated with a suite of proprietary ‘linear detection’ routines developed by Fathom Geophysics Australia. The rationale and methodology are described below.

4.3. Geophysical Linears from Potential Field Data

Since the early days of geophysical data collection, geoscientists have looked for patterns in the data and attempted to highlight important boundaries and trends, reducing the data from a representation of a continuous field into a series of polygons and lines. These so called ‘geophysical linear’ may approximate the location of a fault, if the linear is tracing a strong gradient (i.e., an edge), or the central axis of a unit, if the linear is tracing a ridge or valley line in the data. The mapping of such linear can be useful in exploration because mineral deposits are often located along geophysical linear or at the intersections of such features; for reasons which can be explained both geophysically and geologically.
Interpreters have found different ways to extract linear from geophysical data through the decades. A common approach prior to advances in computing capabilities and data processing power was to filter the data first to highlight the features of interest and then manually draw lines along strong gradients (edges) and trace patterns of elevated or depressed responses (form-lines). A drawback of this manual approach was the inherent subjectivity in the process. Automated approaches became available in the 1990s but the outputs from these routines (sometimes a busy dot map) were commonly ambiguous and difficult to incorporate into the exploration workflow.
Fathom Geophysics developed a series of routines to convert geophysical data into products that could be readily integrated into the exploration process. The goal in developing this technology was to move towards automated interpretation of magnetic and gravity data mimicking a human approach to image interpretation whilst honouring the physics of the field without any of the subjectivity introduced by human bias. Being able to map pertinent boundaries in data under cover was particularly important. The focus of the tools is objective, reproducible data analysis that generates products that are readily used, interrogated and integrated into the exploration workflow. A discussion of the methodologies can be found in Debeglia et al. [162].
Most mineral deposits exhibit some degree of structural control. Hence, accurate mapping of structural architecture is a critical aspect of any interpretation or targeting exercise. The Fathom structure detection filter is a phase congruency algorithm based on oriented exponential filters [163]. The results obtained are a measure of asymmetry regardless of amplitude, which means that structures in areas of low contrast are highlighted just as well as those in areas of high contrast, as long as the frequency range of the structures being extracted is present (where frequency correlates with scale, and to a large degree with depth). This is important for areas where structures separate lithological units exhibiting similar magnetic properties and where the magnetic responses are very subtle.
Structures occur at various scales across all terranes (essentially, they are fractal in nature [164,165]). Honouring this condition, the structure detection method used herein is ‘multi-scale’ by design. Only structures that give a response at more than one scale (wavelength) are captured in this method with ‘mono-scale’ features discarded. This scale requirement is important in that it eliminates noise caused by minor edges that are present over a narrow frequency range only. Additionally, linear can be classified and extracted on the basis of scale. This is useful for distinguishing between features that may represent fundamental, first-order crustal-scale faults (potential pathways for mineralised fluids but not necessarily mineralised themselves), and those representing second or third order faults, which are more likely to be mineralised in the presence of a fertile mineral system (e.g., [166,167]). These outputs are invaluable in geological interpretation, mineral potential modelling and exploration targeting.
The linear detection algorithms can also be used to extract structures of any specific orientation or orientation range. This is useful where structures of a particular orientation are considered important in the targeting model under consideration. This objective assessment of geophysical data may also be used to determine the dominant structural orientation for a particular belt. For example, a map of belt-parallel structures not only provides powerful insights into the architecture of a geological terrane but also highlights subtle changes in orientation of such structures, commonly marking fold hinges, kink zones, fault bends or other significant structural features. Cross belt structures can also be extracted, thereby adding additional detail to these geophysically derived ‘structure maps’.
The linear ‘edges’ derived from gravity data represent the location of significant lateral changes in density. These commonly represent either the trace of a fault with vertical displacement or the boundary between two units with different rock densities [162]. For this study, the gravity filter was run at two different frequencies. The first uses a relatively short minimum wavelength of 1600 m to detect ‘shallow’ subsurface features. The second uses a minimum wavelength of 6400 m to detect low frequency features, which commonly represent deep, crustal-scale structural development zones (Figure 7). Gravity edges with specific orientations according to the mineralising model were extracted and utilised for each of the project areas. Magnetic data for both areas were treated with an edge detection filter with a minimum wavelength of 1600 m to detect relatively shallow features.
Geophysical edges resulting from significant lateral variations in the physical properties of the subsurface may occur in different geological situations, commonly due to the presence of a fault or a lithological contact. However, mapped geological boundaries between adjacent lithological units that are differentiated on the basis of visual properties alone do not necessarily exhibit a coincident change in density or magnetic susceptibility. Shallow-dipping contacts or faults within homogeneous rock packages are also less likely to be detected by the routines.
Importantly, results from the structure detection routine can only be as good as the input data. The presence of merging ‘busts’ or artefacts in the input geophysical data may result in false anomalies, which must be manually flagged as spurious. Running the linear detection routines on a well levelled and merged magnetic or gravity dataset produces a set of responses, which can confidently be attributed to genuine subsurface features.

4.4. Creating Proxies for Mappable Criteria

A mineral systems approach [7,8,9,10,11] was used to construct the mineral potential models for unconformity-related uranium in the NW McArthur and Athabasca Basins. Consideration was given to ‘Source’, ‘Transport’ and ‘Trap’ components of the system. However, since the ubiquitous basin-fill sediments of the Athabasca and NW McArthur Basins are themselves considered the most likely metal source (see discussion above), a potential supply of uranium metal was available at every point in both study areas at the time of uranium deposition (i.e., the prospectivity in terms of ‘Source’ can everywhere be assigned a value of ‘1’).
The models are consequently simplified to include only components of the ‘Transport’ and ‘Trap’ paradigms. ‘Transport’ components are represented by proxies for deeply rooted, basement-penetrating shear zones with potential to act as conduits for circulating basement brines. ‘Trap’ components include upper-crustal structures, reductants, zones of elevated structural complexity and strong chemical contrast in the basement and at the unconformity.
The spatial datasets identified in the preceding sections were used to generate a series of predictor maps that could be fed into the models. The approach used herein is to construct each predictor in such a way that it acts as a proxy for a single component of the genetic mineralising model. Multi-class datasets (e.g., geology) were simplified and subdivided where necessary. Linear features (e.g., faults and geophysical edges were subdivided into orientation classes. Multi-ring buffers were constructed around features (e.g., faults, Archean complexes, etc.) where the effect of proximity was considered important. The size of the buffers used in each case reflect the opinions of the team of ‘experts’ and vary according to the particular feature’s inferred zone of influence in the conceptual ore deposit model.

4.4.1. NW McArthur Basin

The solid geology interpretation of Lally and Doyle [114] was modified to include updated geochronological information from the Surface Geology of Australia [151]. The 165 classes (i.e., named lithological units) of the original interpretation were reduced to 13 generalised classes for the ‘Simplified lithology’ and three for the ‘Simplified stratigraphy’ predictor maps. Multi-ring buffers were constructed around identified Archean complexes to create the ‘Archean buffered’ predictor. Each concentric buffer can be treated (weighted) independently in the model, allowing arguments about the importance of proximity to Archean complexes to be included. Mapped faults [114] were separated into six orientation classes before multi-ring buffers were constructed around these features. This allows the model to favour one set of structural orientations over another where a genetic link to uranium mineralisation is inferred. The current trace of the exposed unconformity was buffered only on the eroded side (i.e., where the basin-filling Redbank Package has been eroded) to create the ‘Unconformity buffered’ layer. The assumption used here is that, within the area of outcropping basement, the closer a point is on a two dimensional map to the current unconformity trace, the higher the confidence that the point was proximal to the unconformity in the third dimension prior to erosion. Areas where the unconformity is concealed beneath basin-fill sediments (labelled ‘above unconformity’ and coloured dark red in Figure 8o) are treated separately in the predictor map. The metamorphic and igneous interpretation [152] was used to define the nine classes of the ‘Metamorphic regions’ predictor.
Gravity data [153] were treated with the edge-detection routines described above. As with the faults data, vectorised gravity edges with a 1600 m filter were separated into six orientation classes and buffered. A 6400 m filter was used on the same gravity data to isolate longer wavelength features. These were buffered and combined into a single predictor, which was used as a proxy for deep crustal structures, which may have acted as conduits for deeply circulating mineral-bearing brines.
The edge-detection routines with a 1600 m filter were used on magnetic data [154] to detect relatively shallow features. A line density function with a 10 km search radius was then used to create the ‘Magnetics 1600 edge density’ predictor. This layer is intended to delineate areas of elevated basement structural/lithological complexity (i.e., ‘busy’ zones where many linear converge).
Predictors constructed for the NW McArthur Basin study are listed along with their source data in Table 2, and displayed in Figure 8. The outline of the NW McArthur Basin study area is shown in Figure 2.

4.4.2. Athabasca Basin

The 1:250,000-scale solid geology [155] was clipped to the Athabasca Basin boundary and simplified to include nine generalised classes for the solid geology predictor. Buffers of 50 m were constructed around air and ground EM conductors [156,157] to create the ‘Conductors (air)’ and ‘Conductors (ground)’ predictors. As with the McArthur basin study, faults from the solid geology dataset [158] were separated into six orientation classes before multi-ring buffers were constructed around these features. The magnetic domains dataset [159] classifies and extends (where possible) the aeromagnetic response from older rocks that flank the basin to the areas beneath the Athabasca group. Other regions of like magnetic intensity and/or structural texture are similarly classified, completing the coverage, providing vital information about the nature of the basement below the Athabasca Basin. This dataset was clipped to the study area boundary to create the ‘Magnetic domains’ predictor, which is used as a proxy for basement geology. Basement faults from the Extech IV database [150] were used to represent large-scale, through-going structural development zones. The wide (10 × 2000 m buffers) constructed around these features to create the ‘Extech IV faults’ predictor reflect their large area of influence and potential to act as primary conduits for deeply-circulating mineral-bearing basement brines.
Gravity [160] and magnetics [161] data were treated in a similar way to that described above for the NW McArthur Basin study. Vectorised outputs from edge-detection routines with 1600 m and 6400 m filters were separated into six orientation classes before multi-ring buffers were constructed around each feature. These were used in the model as proxies for concealed shallow and deeper-penetrating potential fluid conduits respectively. The 100 m Athabasca Basin magnetic intensity data were treated with edge-detection routines and a 1600 m filter. As before, areas of high lithological/structural complexity were delineated using a line density function with a 10 km search radius on the vectorised result to create the ‘Magnetics 1600 edge density’ predictor.
Predictor maps constructed for the Athabasca Basin study are listed along with their source data in Table 3, and displayed in Figure 9. The outline of the Athabasca Basin MPM study area is shown in Figure 3.

4.5. Establishing Spatial Relationships between Uranium Mineralisation and Proxies

4.5.1. Weights of Evidence

The principal behind the weights of evidence (WofE) approach [141,142,168] to mineral potential mapping is that the odds of finding a deposit within a particular area of interest are modified by the presence or absence of various geological features within that area, and that the level of influence of each geological feature can be quantified. The methodology involves several steps. First, the study area is divided into unit cells and the probability of finding a deposit in any one of those cells in the absence of any further geologic information is calculated. ‘Prior Probability’ is expressed via the following equation:
P { D } = N { D } / N { T }
The prior probability (P{D}) is simply the number of cells that contain deposits (N{D}) divided by the total number of cells (N{T}).
The next step is to calculate how the odds of finding a deposit are modified due to the combined effects of geological features in each cell. Bayes’ Theorem is used in in a log-linear form to quantify spatial associations between geological features (i.e., evidence) and known mineral deposits/occurrences. The degree of spatial association for each feature is calculated and expressed in terms of positive and negative weights of evidence for that feature.
P o s i t i v e   w e i g h t   o f   e v i d e n c e :   W A + = ln P { A | D } P { A | D ¯ }
where P { A | D }   is the probability of a cell containing feature A, given the presence of a deposit and P { A | D ¯ } is the probability that a cell contains feature A, given the absence of a deposit.
N e g a t i v e   w e i g h t   o f   e v i d e n c e :   W A = ln P { A ¯ | D } P { A ¯ | D ¯ }
where P { A ¯ | D } is the probability of a cell not containing feature A, given the presence of a deposit and P { A ¯ | D ¯ } is the probability that a cell does not contain feature A, given the absence of a deposit.
Positive weights of evidence reflect an increase in the odds of finding a deposit in the presence of a particular geological feature; negative values indicate that the presence of the feature decreases the odds of finding a deposit. The difference between these values (the ‘contrast’) signifies a net positive or net negative spatial association.
C o n t r a s t   =   ( W A + )   ( W A )
The ‘posterior probability’ is the prior probability modified by the cumulative influence of all geological features at a particular geographical location:
P { D | A 1 , , A k } =   P { D } . P { A 1 , , A k   | D }   P { A 1 , , A k } = P { D } . P { A 1 , , A k   | D } P { D } . P { A 1 , , A k   | D } + P { D ¯ } . P { A 1 , , A k   | D ¯ }  
The posterior probability for each cell is the probability of that cell containing a deposit, given the presence of a set of geological features and provides an estimate of the prospectivity at that site.
Weighted binary evidential layers are created for any features demonstrating a statistically valid spatial association with the distribution of known mineral deposits/occurrences. These are rasterised and combined in the final stage of the WofE analysis to create a grid of ‘posterior probability’ values. The resulting posterior probability map is interpreted to reflect the statistical likelihood of a mineral deposit occurring within any unit cell (or pixel). Comprehensive summaries of the theory and details of the weights of evidence methodology and its application to mineral exploration can be found in Bonham-Carter et al. [141], Agterberg et al. [168], Bonham-Carter [142] and Porwal et al. [169].
A prerequisite for a meaningful weights of evidence analysis is that (1) the training population (i.e., the number of known deposits) in an area under investigation is comparatively large relative to the number of undiscovered deposits, or at least the assumption must be made that the known deposits are genetically typical and therefore representative of all deposits in the area under investigation, (2) the area is characterised by a high data density and (3) the targeted mineralisation style is analogous to that of the training population. A final important prerequisite is that the evidential layers are not conditionally dependent [170]. Conditional dependence exists in cases where (1) the features in the predictor represent the same recognition criterion (e.g., the same structures may be represented in both the mapped fault data and in the outputs from the geophysical edge-detection routines), (2) there is a genetic link between the recognition criteria (e.g., breccia zones are linked to the presence of major structures) or (3) the predictors may be derived from the same raw data (e.g., outputs from edge-detection routines run with different wavelength filters), all conditional on the locations of deposits.
In reality, the assumption of conditional independence is commonly violated to some degree when producing a mineral potential map. The mineral deposits and geologic features of a particular area were commonly formed and modified by the same processes over geologic time so there is nearly always some level of conditional dependency between geological features with respect to the location of mineral deposits. The aim is generally to minimise the degree of violation through careful choice and design of predictors, and by limiting the number of evidential layers used in the analysis.
The cumulative effect of combining multiple conditionally dependent predictors can lead to over-representation of those features in the output from WofE as the individually calculated level of influence of each feature is added to the prior probability in the final stage of the analysis. The accumulated weights of multiple representations of the same features can therefore result in a biased analysis, which is skewed towards those features.
Weights of evidence analysis was considered generally inappropriate and unsuitable for both the NW McArthur Basin and Athabasca Basin studies due to the relatively low number of deposits compared to the size of each area and high levels of conditional dependence between many of the evidential layers (e.g., multiple predictors derived from the same geophysical data; predictors representing conductors derived from both air and ground surveys; multiple representations of faults, geophysical edges, etc.). However, the first stage of the WofE analysis proved useful for testing the degree of spatial association between known uranium deposits and individual features, and particularly for providing a first-pass, regional-scale statistical analysis of the relative importance of various structural orientation classes. The statistically-derived levels of influence provided important clues regarding the features’ spatial (and possible genetic) association with uranium mineralisation and was used to inform the experts’ decisions when it came to manually assigning weights to features and maps for the fuzzy logic analysis (see later). The WofE analysis was carried out using the Spatial Data Modeller tools in ArcGIS 10.2.1. (ArcSDM; [171]). The ArcSDM add-on for ArcGIS is now maintained by the Geological Survey of Finland (GTK) as part of their Mineral Prospectivity Modeller project.
Summaries of significant calculated weights are presented in Table 4 for the NW McArthur Basin, and Table 5 for the Athabasca Basin.
Positive contrast values are indicative of geological features that have a net positive effect on the distribution of uranium mineralisation. Higher contrasts (highlighted by warmer (orange to red) shading in the weights tables) suggest a greater effect. Significant negative contrast values (i.e., <−0.75) are interpreted as being indicative of those geological characteristics that have a negative effect on the distribution of mineral deposits (i.e., features that should be avoided in exploration targeting). All at the confidence level indicated by the student value.
For multi-class features (e.g., geology, magnetic domains, metamorphic regions, etc.), only features that returned significant contrasts are shown. These features are listed in the ‘Criterion’ field. Multi-ring buffers are treated in a ‘cumulative ascending’ manner. The statistical calculation of weights is done in such a way that larger buffer zones include the smaller ones. This makes it possible to determine at which distance from the object the spatial association with known occurrences stops increasing at starts to decrease. This critical distance is listed as the ‘Criterion’ in the weights tables.

4.5.2. NW McArthur Basin

The high prospectivity of both carbonaceous sediments and haematitic breccia is reflected in the exceptionally high contrast values calculated for these lithological units (3.38 and 4.54 respectively). However, the limited spatial extent of these units, which are commonly mapped around areas of known mineralisation (most notably for haematitic breccia) possibly overemphasises their significance, and given that it is likely that such units are present in other areas where the geology is poorly known. Notable positive values were also calculated for Archean stratigraphy (0.95) and Gneiss (0.98; due to the presence of numerous minor uranium occurrences located within Archean gneiss complexes), Proterozoic units (0.38) and Schist (0.98; the Cahill Schist is the most important host lithology in the Alligator Rivers Uranium Field) and Felsic volcanics (0.75), which are host to numerous minor occurrences in the South Alligator Rivers Uranium Field. Significant negative values are returned for sandstone (−0.79) and unmetamorphosed cover (−1.96), reflecting the lack of uranium discoveries to date below the Neoproterozoic basin-fill sandstones. The relatively high contrast calculated for granulite metamorphic facies (1.57) is again likely the result of statistical anomalism, with just two relatively minor uranium occurrences in this spatially confined unit. By contrast, 79 uranium occurrences lie within the area of mapped amphibolite grade metamorphism but its greater area results in a slightly lower calculated contrast (1.34). Positive contrast values were also calculated for proximity to mapped Archean complexes (1.89), with 5 km being the critical buffer distance.
The combined Gravity 6400 buffered geophysical edges received the second highest calculated contrast (4.02) but the low student value reflects a very low degree of statistical confidence in the result. Relatively high contrast values were calculated for all mapped fault orientation classes, with the WNW (1.79), NW (1.64), NNW (1.49) and NE (1.46) feature classes being favoured. Gravity 1600 NE (0.42) and NNE (0.51) returned modest contrasts as did the Magnetics 1600 edge density predictor, particularly the moderate (0.24–0.3 km/km2) density class (0.60). Proximity to the unconformity (unconformity buffered) is also identified as an important predictor with 45 km being the critical buffer distance (1.83).

4.5.3. Athabasca Basin

The high contrast value obtained for the Carswell gneiss (3.90) and strongly negative value calculated for the Athabasca quartzarenite (−1.64) are not statistically valid, as indicated by the extremely low Student values. They are also somewhat counterintuitive given the established pedigree of the basin-fill sedimentary units and their obvious prospectivity for unconformity-related uranium. Unexpectedly, the results suggest that the best place to look for unconformity-type uranium in the Athabasca Basin is in the Carswell gneiss and that the area covered by Athabasca quartzarenite should be avoided. These unrealistic and statistically invalid results are again attributed to a problem of scale and a small training data set relative to the size of the study area. The Carswell gneiss (134 km2 total area) contains just 21 known occurrences whereas the Athabasca quartzarenite (72,600 km2) contains 271. However, the difference in area results in the Athabasca quartzarenite being rejected as an exploration target in this purely statistical analysis. No other lithological units displayed a valid spatial association with uranium mineralisation. The Carswell structure returned the highest contrast (3.28) of the magnetic domains, the relatively high value being at least partially due to the scale issue outlined above. Of the remaining magnetic domains, only the Mudjatik Domain (0.97), Tantato Domain—low mag (0.79), Wollaston Domain—high mag (1.75), Wollaston Domain—low mag (1.74) and shear zones (0.34) display valid spatial associations with uranium mineralisation. Both air conductors (3.01) and ground conductors (3.90) display high contrast values.
Determining which orientations of linear features showed strong spatial associations with uranium mineralisation was of primary interest in this analysis. All mapped (1:250k scale) faults returned significant contrast values with NW (1.91), NNW (1.81), NNE (1.96) and NE (1.60) orientation classes being favoured. Modest contrast values were returned for Gravity 6400 edge orientation classes WNW (0.73), NNE (0.44) and ENE (0.54). The higher frequency Gravity 1600 edge classes also returned relatively modest contrast values for the WNW (0.54), NW (0.25), NE (0.20) and ENE (0.23) orientation classes. The Magnetics 1600 edge density feature class displays a relatively high contrast value, with the high density (0.33–0.52 km/km2) class (1.72) being favoured.
Weights obtained from the WofE analysis highlight a number of inherent problems with using data-driven MPM methodologies in under-explored areas. Limitations arise due to the comparatively small number of known deposits relative to the size of the search area. For example, the Athabasca Basin covers approximately 460 by 220 km; given the size of the target area, the total number of known uranium deposits (<50) is extremely low. This necessitated the use of uranium occurrences to create a training set of sufficient size to arrive at statistically valid contrast values. It should be noted that while the occurrence training set provides a more statistically sound result, the data density is still quite low and data points are commonly clustered around areas of historical discoveries. A further shortcoming of this approach is that the occurrences data include everything from small radiometric and geochemical anomalies, minor drill-hole intercepts, radioactive boulders to minor and major deposits. In this context, the results should be interpreted as reflecting occurrence, rather than deposit potential, which is not necessarily what we are interested in as explorers. Additional commentary on potential shortcomings of data-driven approaches to MPM is presented in the Discussion Section below. Despite these limitations, and with due consideration given to the short-comings of the technique, the WofE analyses yielded informative results for both study areas.

4.6. Assigning Fuzzy Weights

Unlike Boolean set theory, which defines membership of a set as either 1 or 0 (i.e., true or false), fuzzy-set theory [172] allows for a continuum of grades of membership between 0 and 1. The application of fuzzy-set theory in fuzzy logic MPM allows the geologist to construct models that are capable of representing vague, subjective measures of prospectivity. ‘Fuzzy Membership’ values can be assigned to predictor maps according to a variety of membership function curves or manually, according to geological knowledge.
This study used a relatively simple approach to assign numerical weights (i.e., ‘Fuzzy Membership’ values). Each predictor map was assigned a ‘map weight’ of between 1 and 10, with higher values reflecting greater importance of the recognition criteria in the mineralisation model and/or greater confidence in the data from which the layer was derived. Note that map weights apply equally to all classes within the same predictor map. Individual features were assigned a ‘class weight’ (also with values between 1 and 10) reflecting relative prospectivity within the predictor map. The values assigned at this stage of the analysis are of vital importance so a group of expert collaborators familiar with the subject matter and with an understanding of the quality and fidelity of the source data was relied upon to perform the assessment for this study. The collaborators were guided by a comprehensive review of published works, statistical evidence from weights of evidence (WofE) and other approaches not described here in detail (e.g., Fry analysis: [173,174]), and their own experience/opinions.
Class and map weight scores were simply multiplied together and divided by 100 to arrive at a ‘Fuzzy Membership’ value (i.e., between 0 and 1; Appendix A and Appendix B) for every feature in the ‘stack’ of predictor maps. In order to avoid any undesirable and unrealistic effects when performing fuzzy logic operations [146], calculated fuzzy membership values of zero were replaced by a very low value (i.e., 0.001) where they occurred. The fuzzy membership value can be considered a measure of the perceived importance for each feature in the mineralisation model. Each weighted predictor is constructed and weighted in such a way that it can be thought of as a single-component map of prospectivity.
Where proximity to a particular feature is considered desirable in the model, multiple-ring buffers are used, with the highest class weight commonly being assigned to the smallest buffer. Decreasing values for subsequent and hence larger buffers reflect decreasing prospectivity with increasing distance from the feature. This methodology was used for the unconformity buffered predictor in the NW McArthur Basin study, but in this case, the area labelled ‘above unconformity’ (coloured dark red in Figure 8o) was assigned the highest class weight (in addition to the smallest buffer) as the unconformity itself is the primary exploration target. By contrast, the features that were buffered to produce the Archean buffered predictor were assigned a low class weight as the most prospective areas are considered to be in the Proterozoic metasediments adjacent to the Archean domes, rather than the Archean domes themselves.
Features within multi-class predictor maps (e.g., lithology, stratigraphy, etc.) are assigned class values between 0 and 10 according to their perceived importance in the mineralising model. A summary of map weights applied to the predictors is shown in Table 6 (NW McArthur Basin) and Table 7 (Athabasca Basin). Full details of map/class weights and fuzzy membership values for every feature can be found in Appendix A and Appendix B. When interpreting the class weights assigned to various features, it should be kept in mind that the predictors are two dimensional representations of the three dimensional Earth, and in that context it is sometimes necessary to apply a weight to a feature that is higher than would be expected if the feature were considered in isolation. For example, the Phanerozoic aged rocks in the McArthur Basin are considered unprospective in terms of their potential to host unconformity-style uranium mineralisation. However, the prospectivity of a cell located over these units is influenced by the fact that highly prospective Proterozoic rocks are very likely to be located at relatively shallow depth beneath the typically thin Phanerozoic cover. For this reason the Phanerozoic stratigraphic class receives a relatively high class weight of 7 in this model despite itself being a poor exploration target.
Vector predictor maps were converted to numerical raster grids, using the fuzzy membership value. Raster cell (i.e., pixel) sizes of 50 m and 100 m were used for the NW McArthur Basin and Athabasca Basin MPMs respectively. Mathematical fuzzy logic operations were then used to combine the layers.

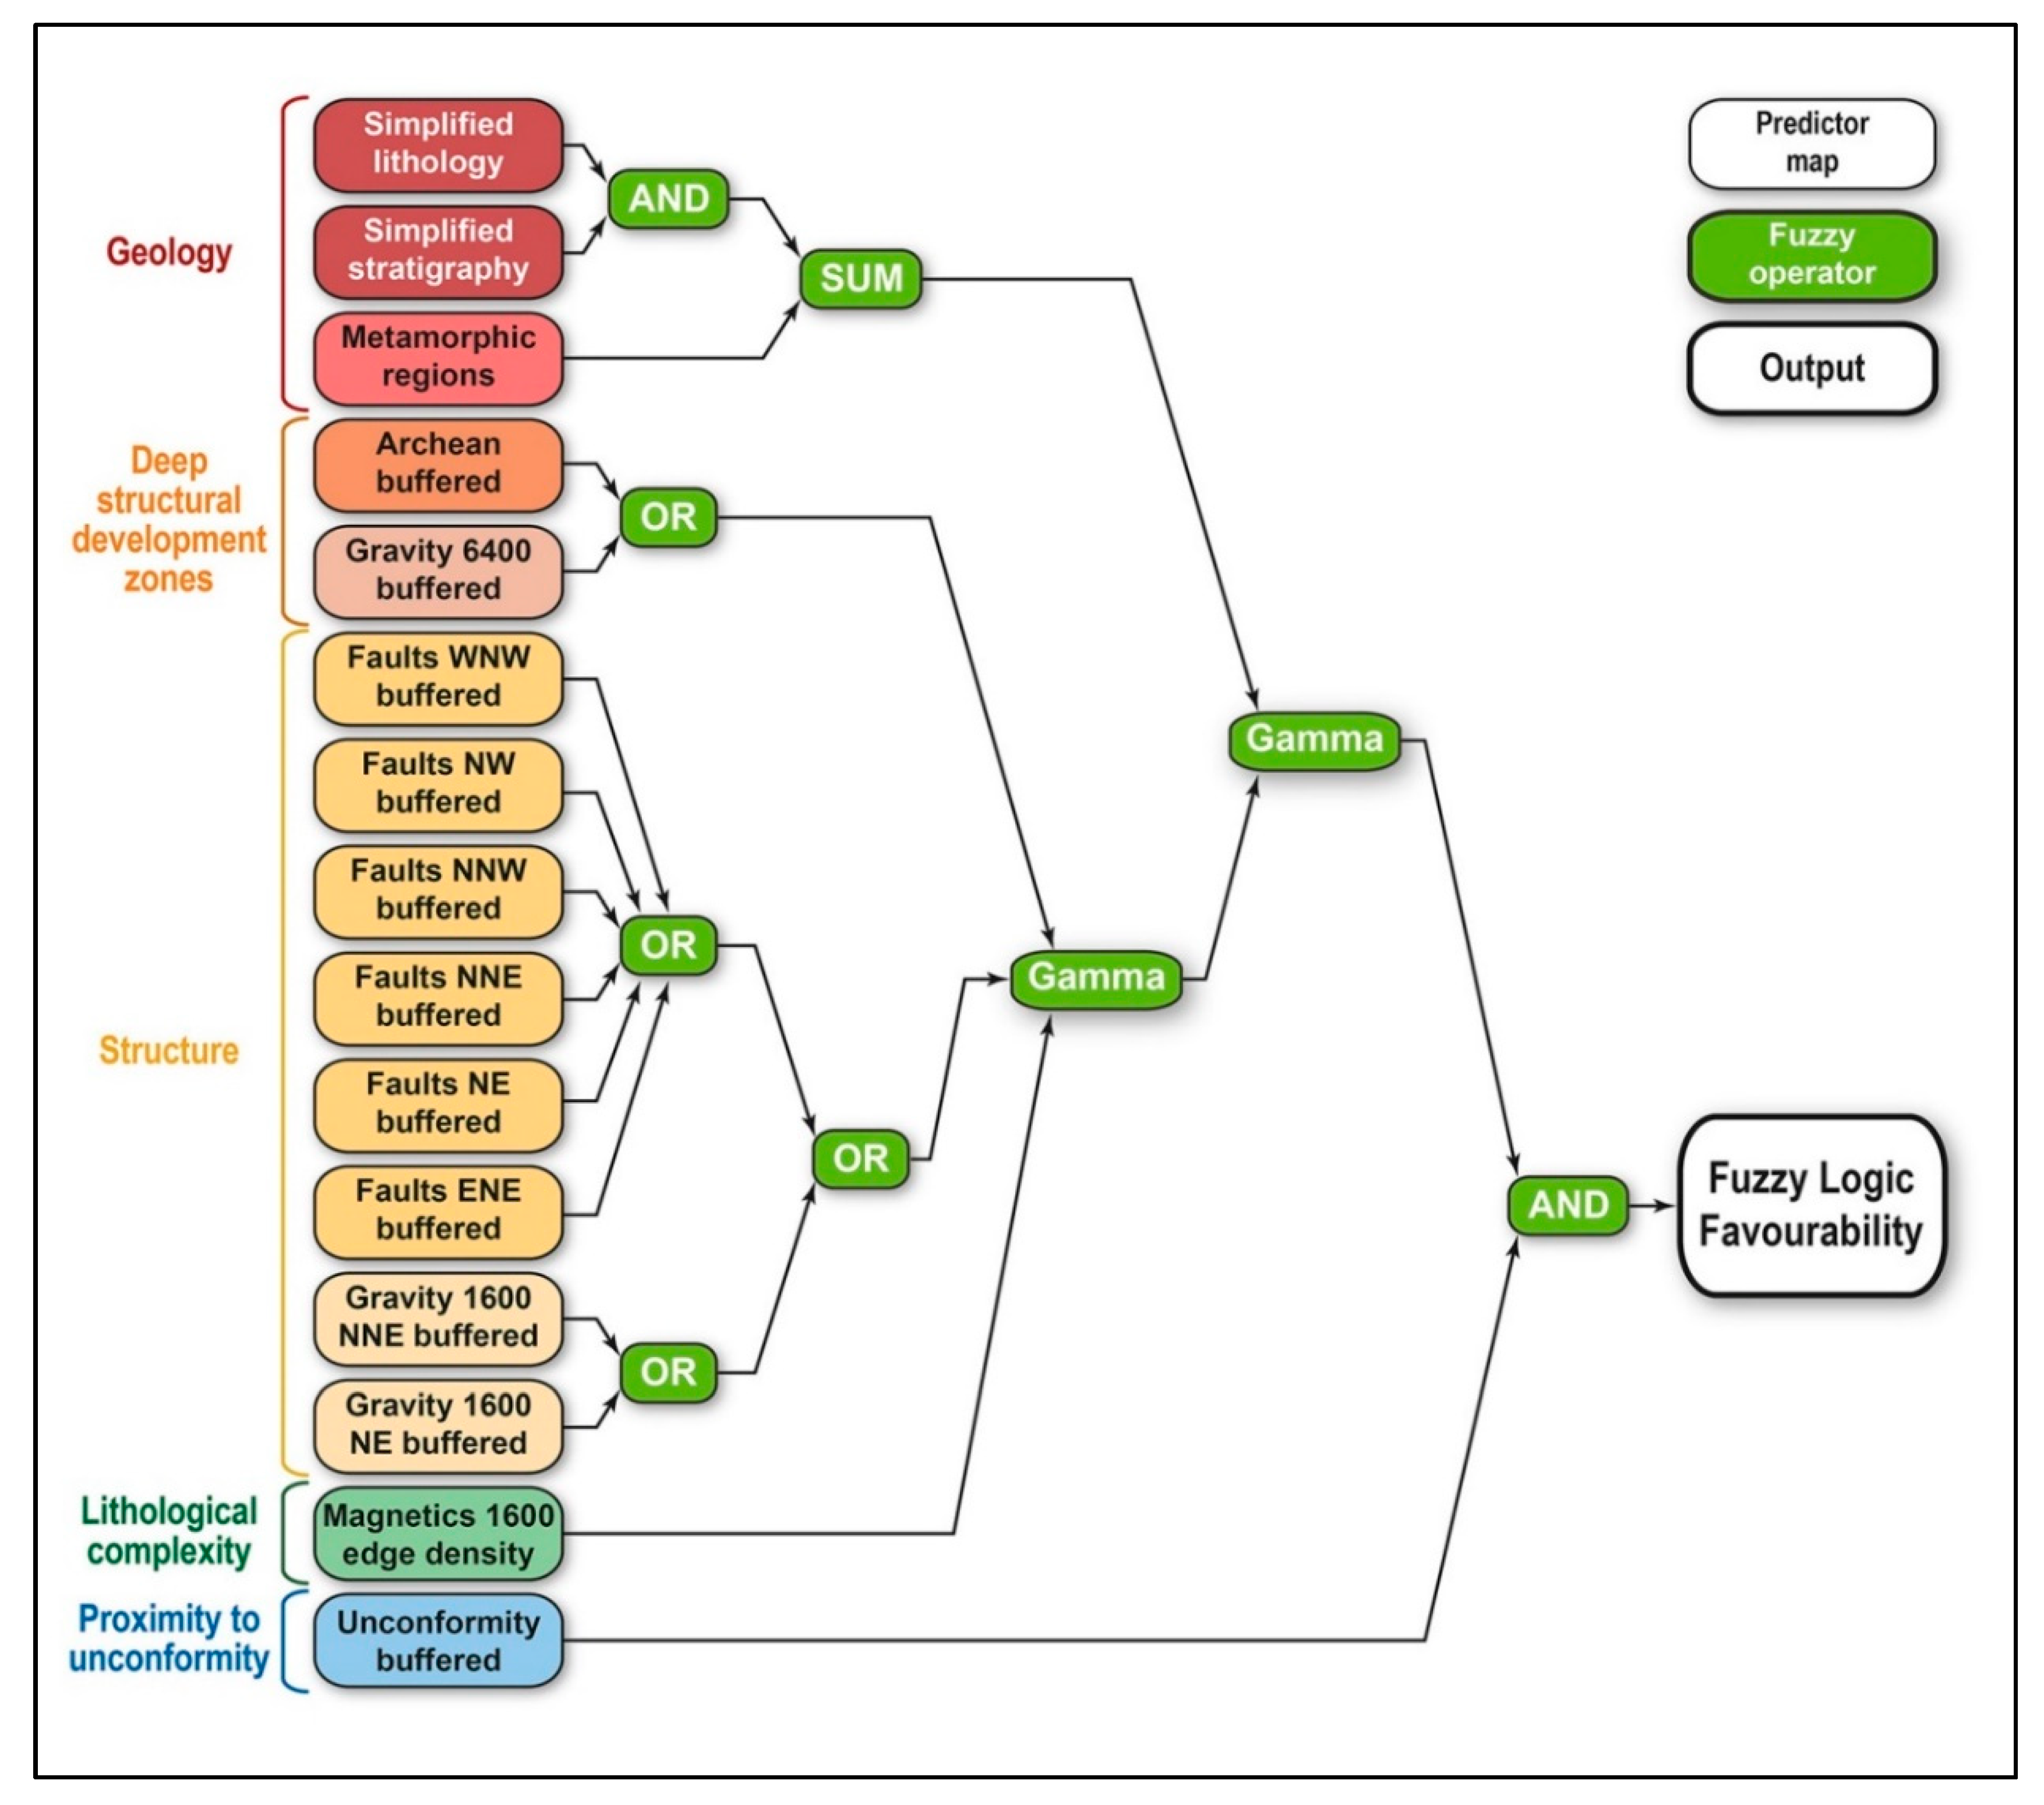
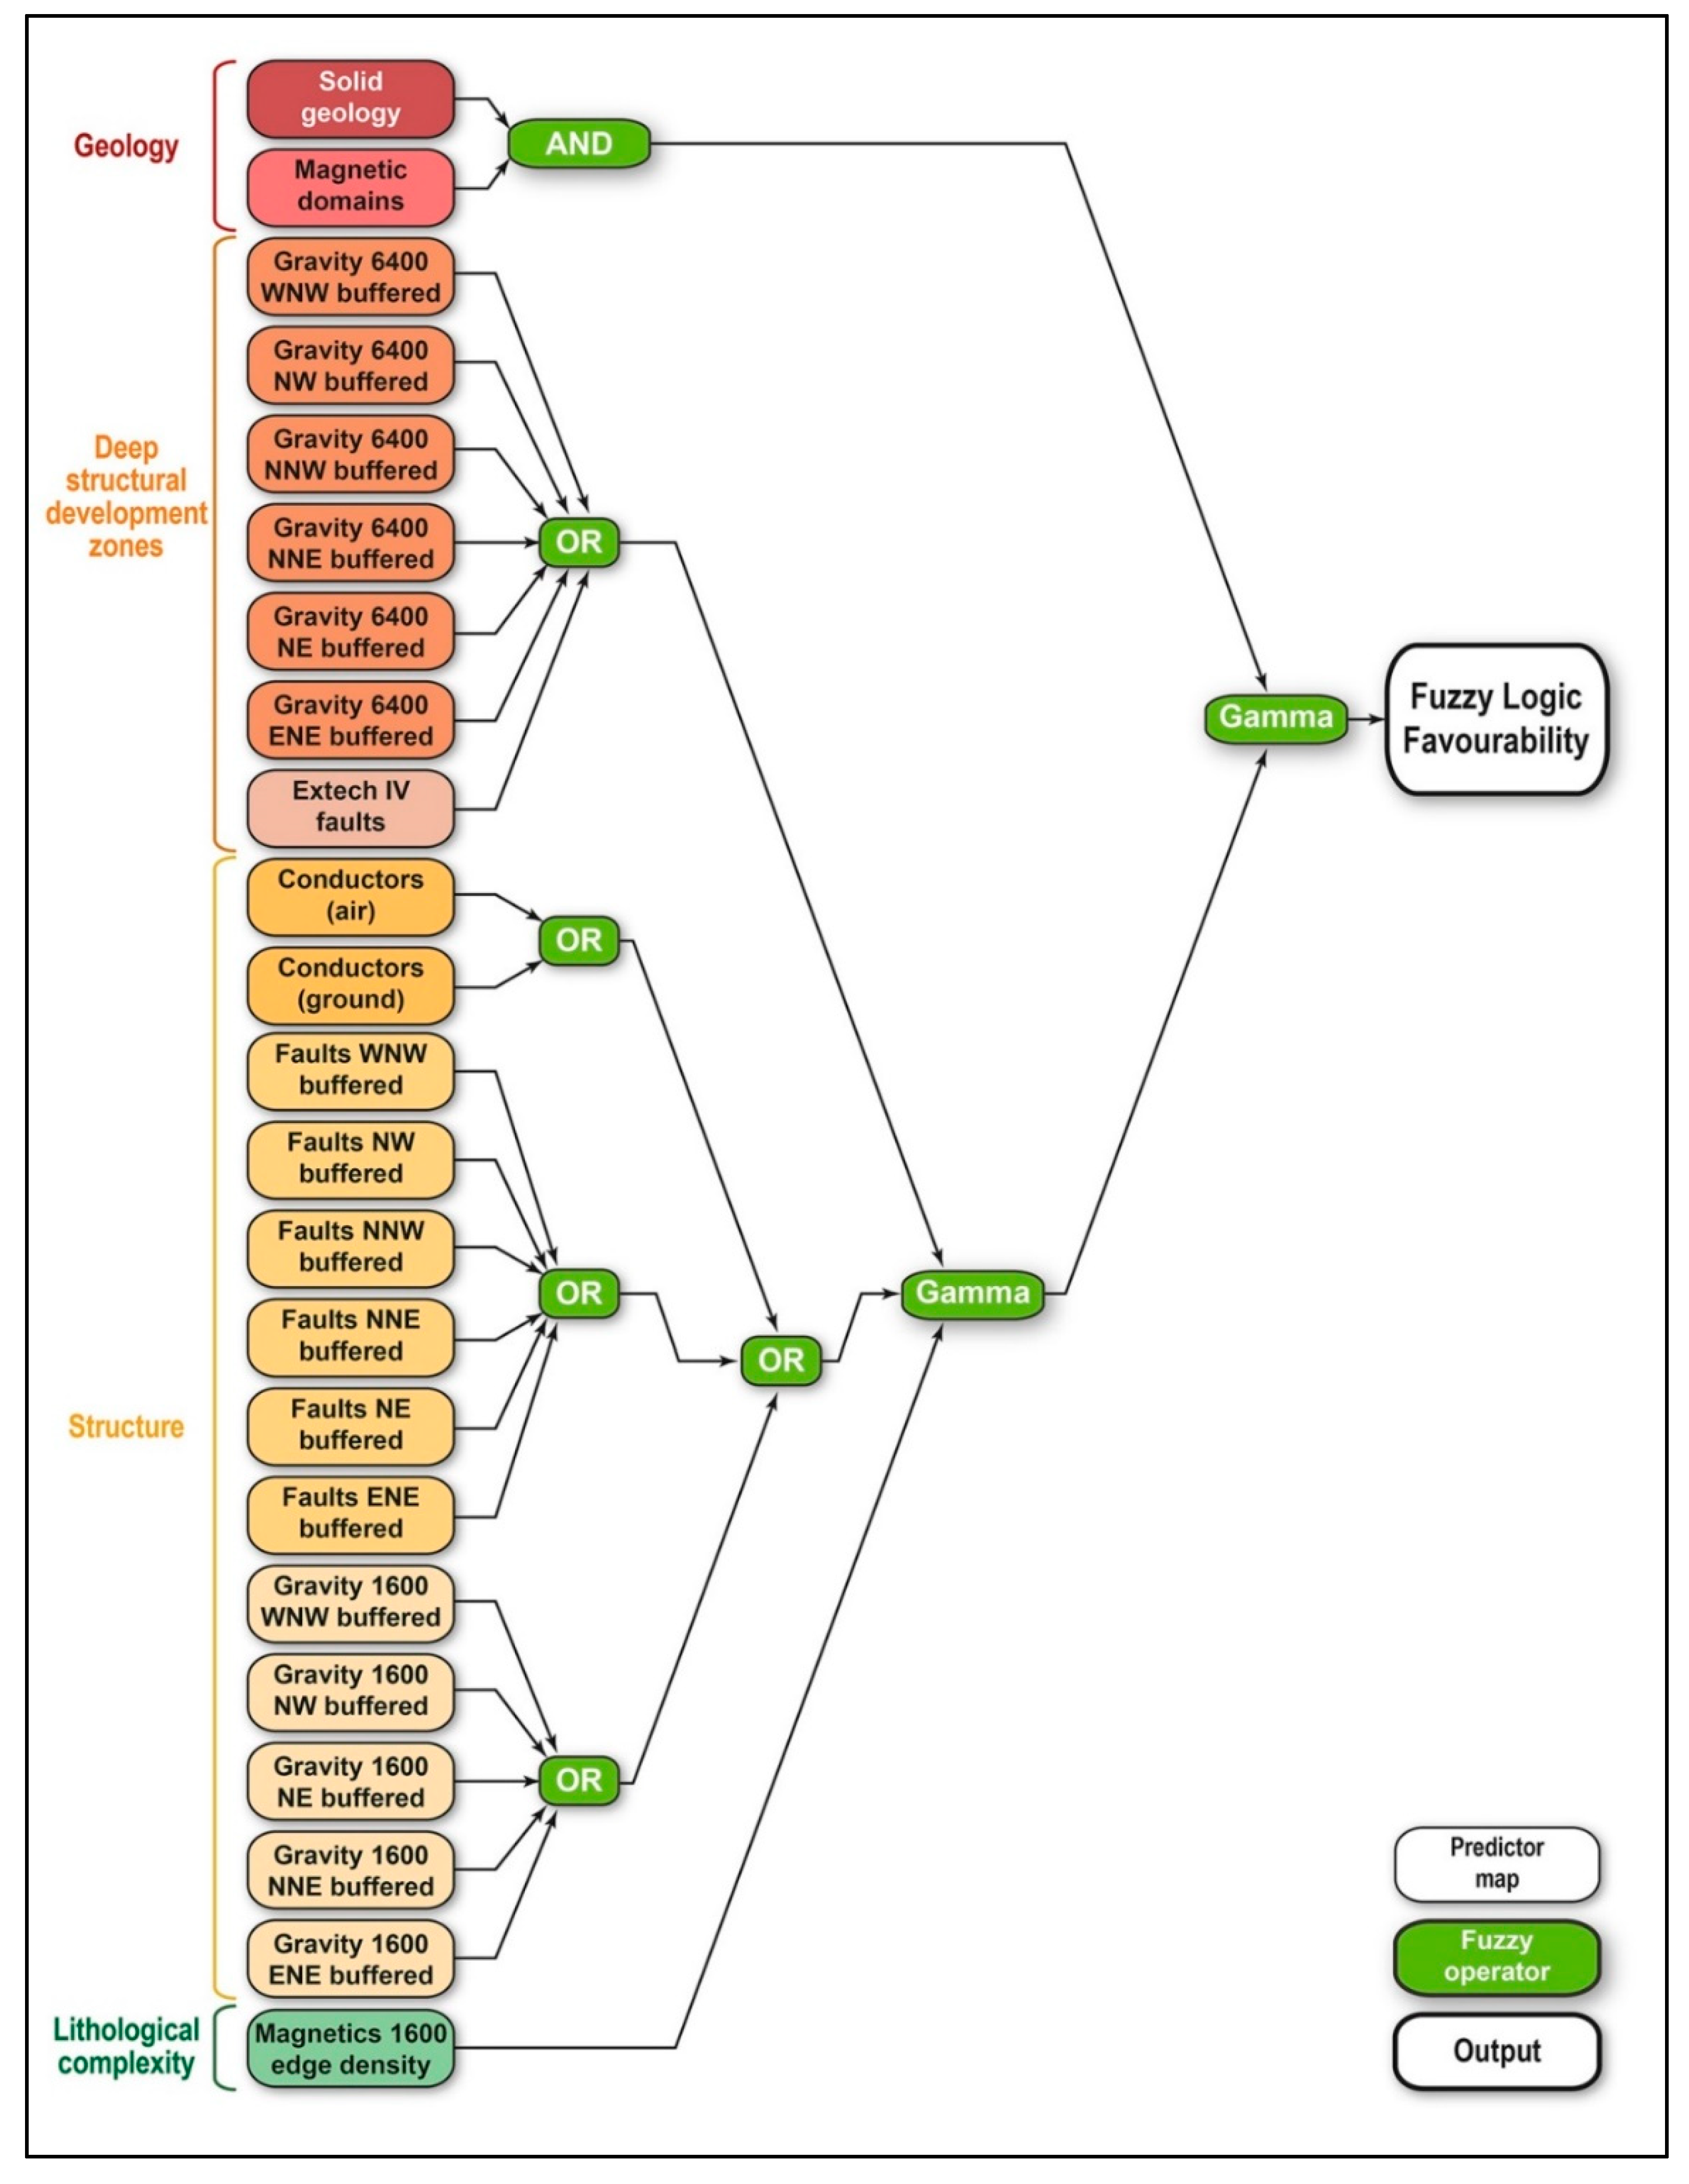
4.7. Combining Predictors
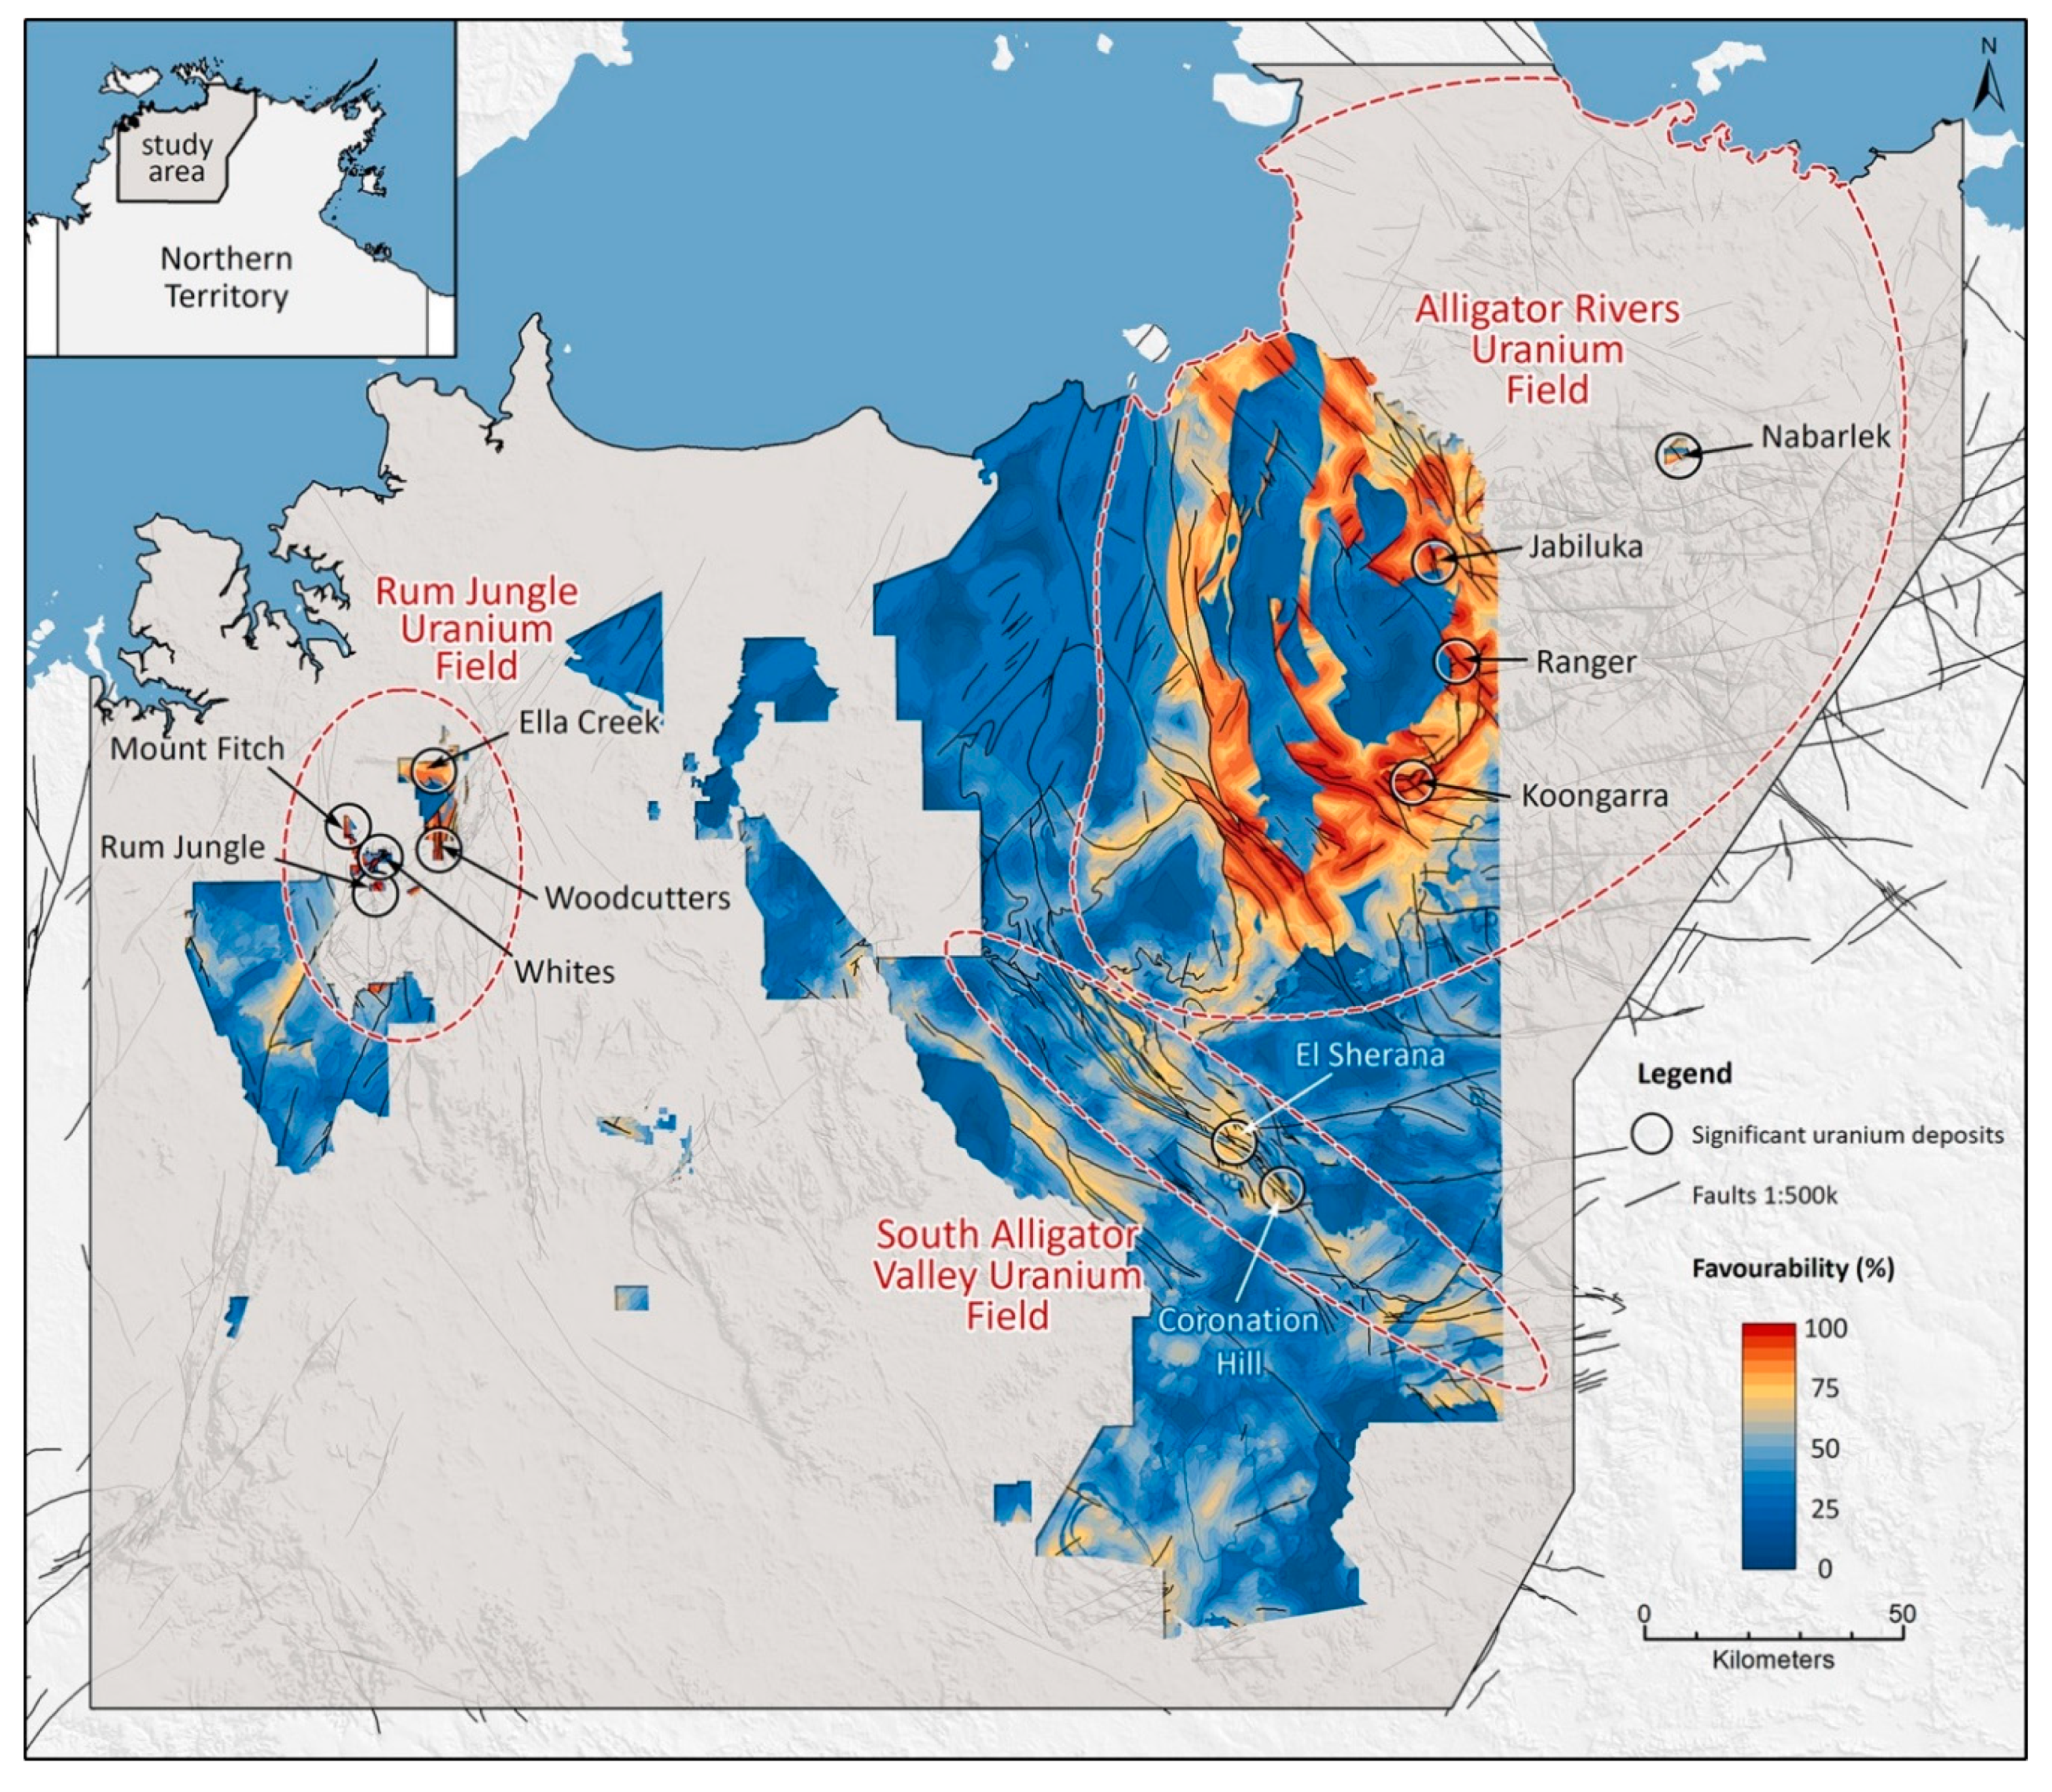
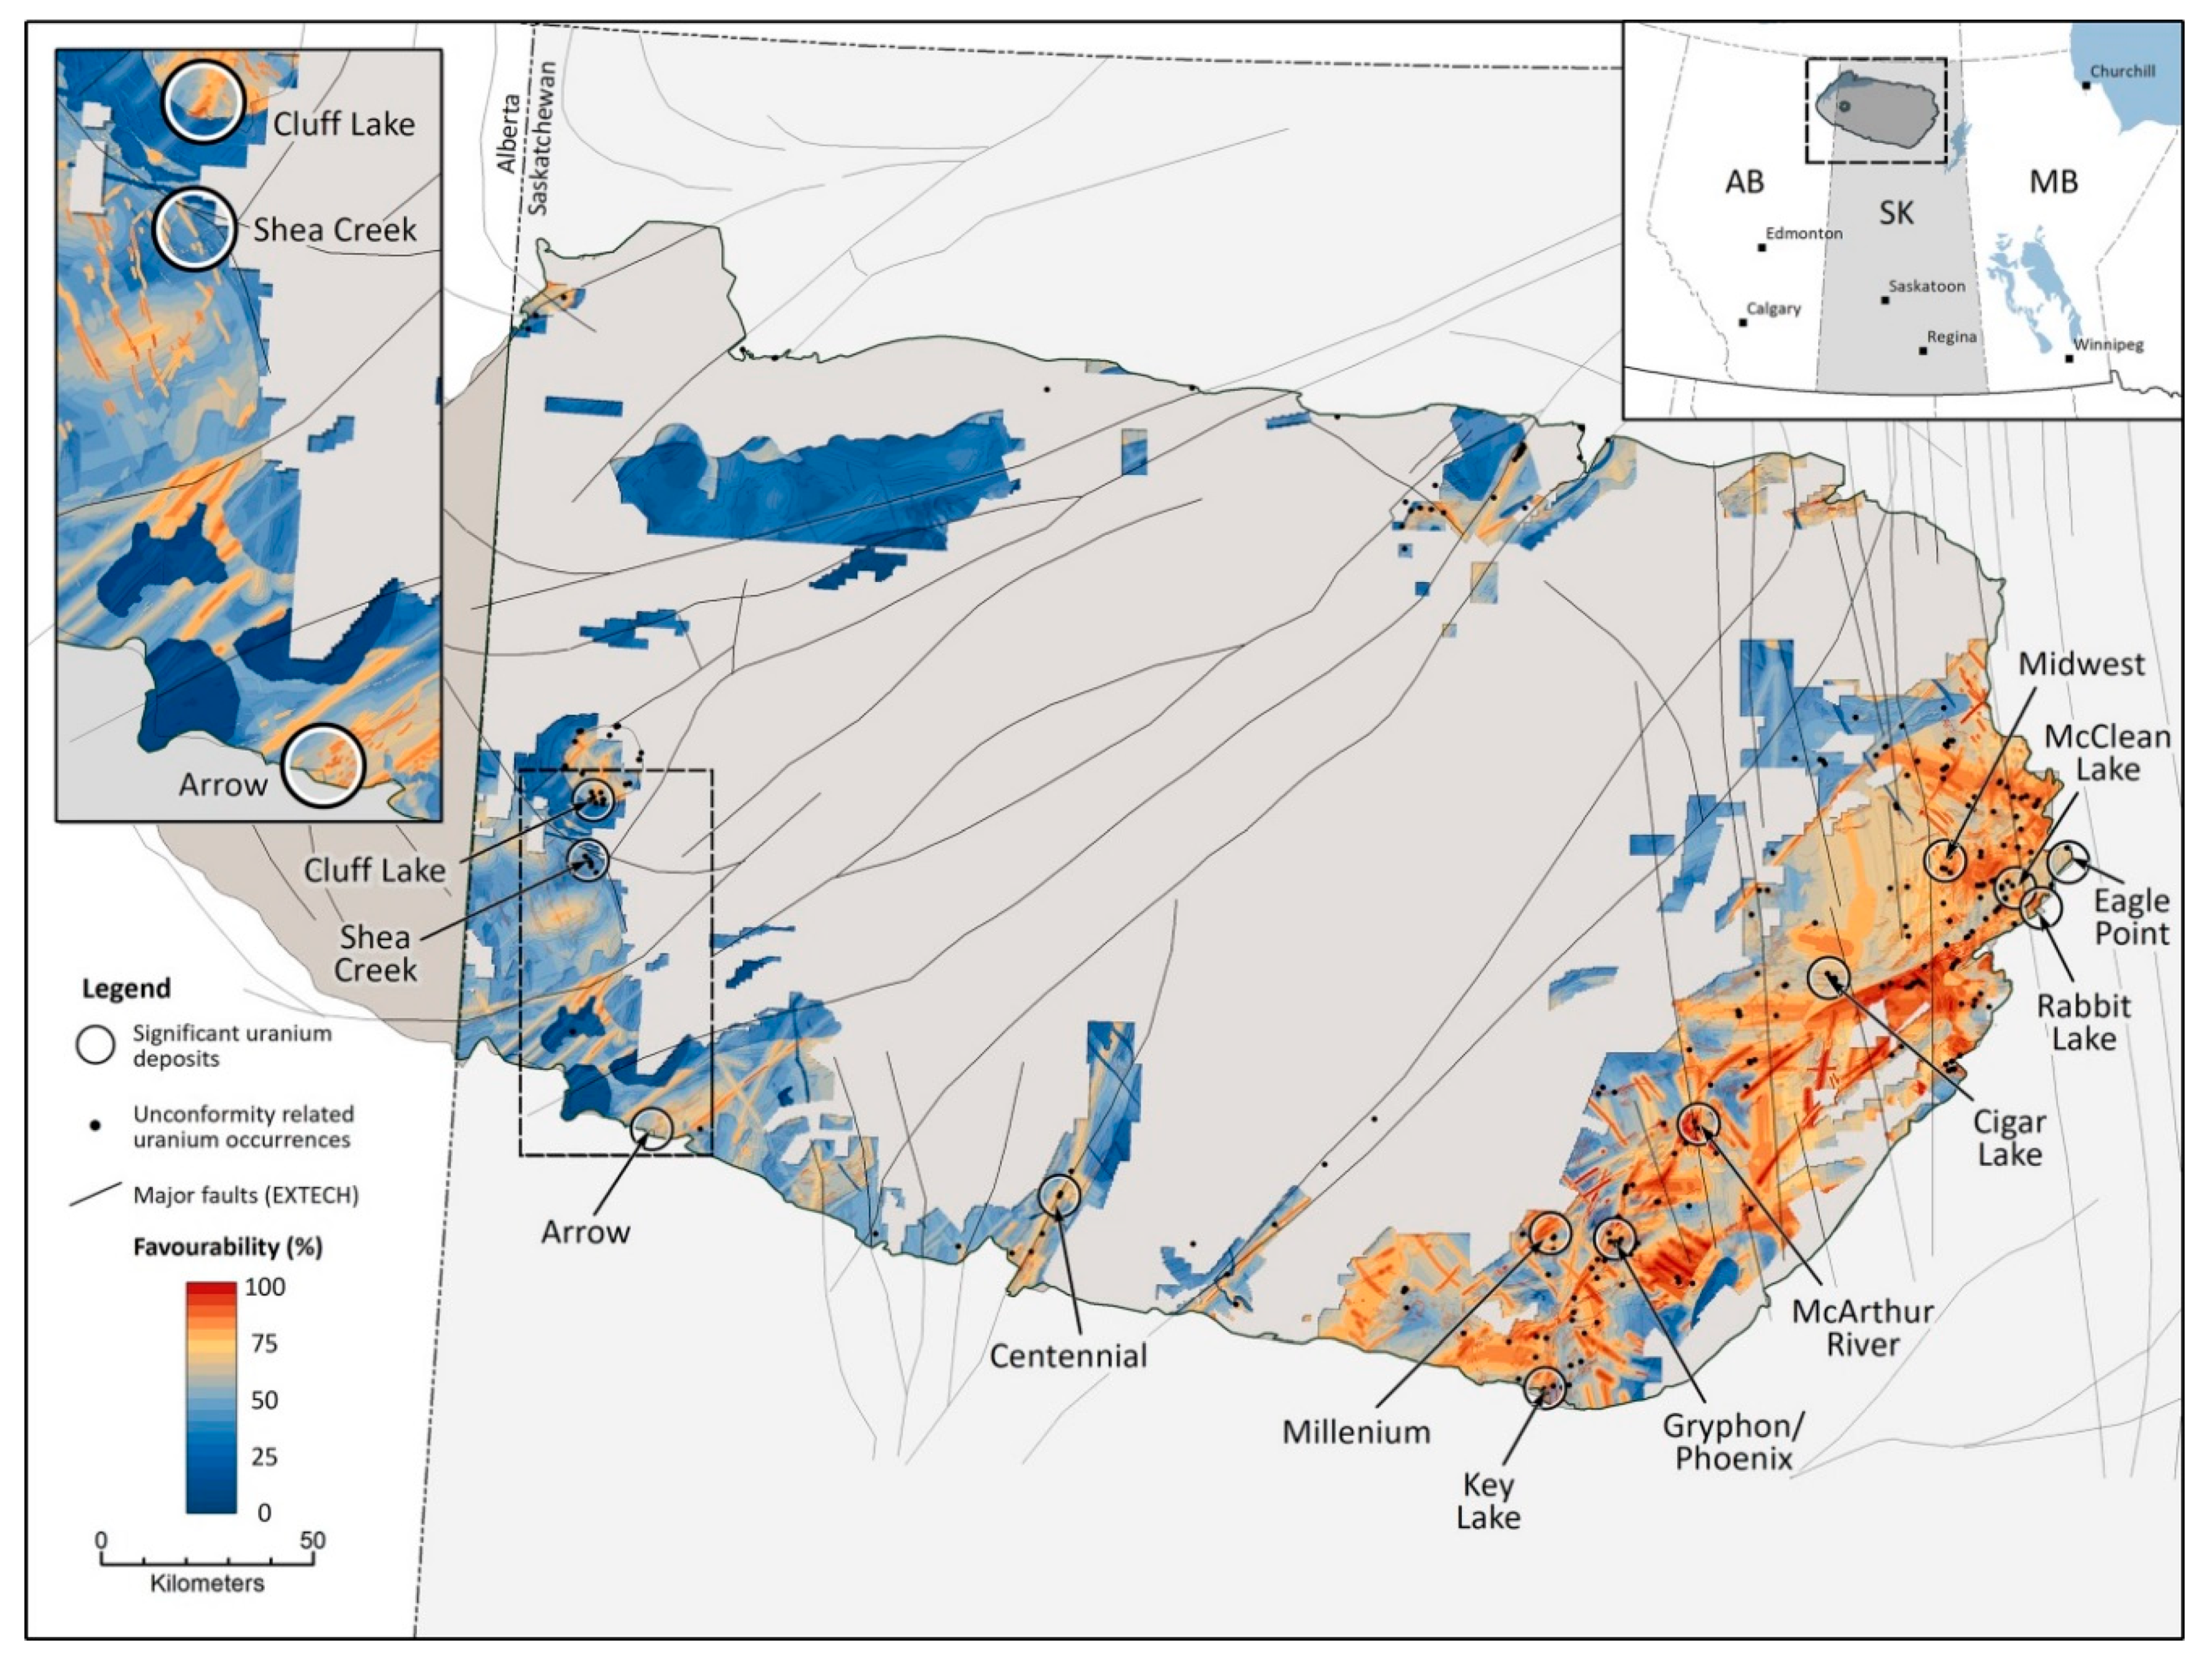
The inference network, consisting of the weighted predictors and the mathematical operators that join them is effectively a representation of the geologists’ thought processes and should be designed such that it follows sound geological reasoning. A variety of fuzzy logic operators [148,172] can be used to combine predictors.
F u z z y   A N D :   μ A N D = M i n   ( μ 1 ,   μ 2 ,   μ 3 ,   μ n )
where μAND is the output fuzzy score and μx represents the fuzzy membership values for aligned raster cells at a location in Predictors 1, 2, 3, etc. The resulting fuzzy score is the minimum value of all inputs for each aligned raster cell.
F u z z y   O R :   μ O R =   M a x   ( μ 1 ,   μ 2 ,   μ 3 ,   μ n )
where μOR is the output fuzzy score and μx represents the fuzzy membership values for aligned raster cells at a location in Predictors 1, 2, 3, etc. The resulting fuzzy score is the maximum value of all inputs for each aligned raster cell.
F u z z y   A L G E B R A I C   P R O D U C T :   μ A P = i 1 n μ i
where μAP is the output fuzzy score and μi represents the fuzzy membership values for aligned raster cells at a location in Predictors (i = 1, 2, …, n). Membership values from each input are multiplied. The result is always smaller than, or equal to, the smallest contributing membership value as input values are between zero and one.
F u z z y   A L G E B R A I C   S U M :   μ A S = 1 i 1 n ( 1 μ i )
where μAS is the output fuzzy score and μi represents the fuzzy membership values for aligned raster cells at a location in Predictors (i = 1, 2, …, n). Note that despite the name given to the operator this is not actually an algebraic sum. The result is always larger (or equal to) the largest contributing membership value but never greater than one.
F u z z y   G A M M A :   μ G A M M A = [ μ A S ] γ × [ μ A P ] ( 1 γ ) = [ i 1 n μ i ] γ × [ 1 i 1 n ( 1 μ i ) ] ( 1 γ )
where μGAMMA is the output fuzzy score and μi represents the fuzzy membership values for aligned raster cells at a location in Predictors (i = 1, 2, …, n). Fuzzy GAMMA is a combination of a fuzzy algebraic sum and a fuzzy algebraic product. The gamma value can be varied (i.e., between 0 and 1) to regulate the generally ‘increased’ effect of the former and the ‘decreased’ effect of the latter so that the output can be ‘tuned’ to suit a particular conceptual model.
Importantly, when using Fuzzy AND or Fuzzy OR operators, the fuzzy membership of a single piece of evidence controls the output value (i.e., the output is either the lowest or highest value of all inputs). Conversely, the fuzzy membership values of all inputs influence the output from the Fuzzy PRODUCT, Fuzzy SUM and Fuzzy GAMMA operators.
The inference networks constructed for the NW McArthur Basin and Athabasca Basin Fuzzy Logic MPMs are shown in Figure 10 and Figure 11 respectively.
A similar design philosophy was employed for both models. Predictors representing different aspects of the same recognition criteria class are first combined with Fuzzy AND or Fuzzy OR operators. The use of these operators in the early stages of the inference network effectively reduces potential conditional dependency issues as the output for any particular cell is only influenced by one of the inputs (i.e., the lowest or highest value respectively). The choice of Fuzzy AND or Fuzzy OR operator depends upon whether the presence of features with a high fuzzy membership value must be represented at a particular location on all, or any one of the predictors being combined. In the NW McArthur Basin study (Figure 10) the simplified lithology and simplified stratigraphy predictors are combined using a Fuzzy AND operator, reflecting the need for potential host rocks to be both the right type and age for a particular location to be considered prospective. Conversely, weighted fault predictors are combined in the first stage of both models with a Fuzzy OR operator. The fuzzy score obtained for a particular cell in this case is the highest fuzzy membership value of any of the inputs at that location. The logic is that when considering only the faults as potential influences on prospectivity, proximity to any fault is good but the prospectivity at any point is only as good as the level of influence that comes from the most favourable predictor. The output value at any point depends on the various map weights applied to different structural orientation classes and proximity to the closest structure.
Fuzzy Gamma operators are used in the later stages of the inference network to combine intermediate rasters representing the different recognition criteria classes. The net effect of the Fuzzy Gamma operator is that high values in all inputs result in high values in the output. It is used in these models to infer that for a cell to be considered prospective, some combination of representatives from each recognition criteria class is required. The NW McArthur Basin model includes an addition and final requirement that the cell must be located within a suitable distance from the outcropping unconformity or in an area where the unconformity is concealed by basin-fill/cover sequences. This additional control is not necessary for the Athabasca Basin model as the MPM area is confined by the sedimentary basin margins.

5. Results

The favourability maps resulting from the combination of all weighted and processed inputs and as defined by the inference networks discussed in the preceding section are shown for the NW McArthur Basin in Figure 12 and the Athabasca Basin in Figure 13.
As mentioned in the Introduction, the analyses presented herein form part of a wider study to identify exploration targets with high potential for as yet undiscovered unconformity-related uranium and basement-hosted gold deposits in these two areas and also in the exposed Canadian Shield in Northern Saskatchewan. This work was undertaken on behalf of the privately owned exploration company 92 Energy Limited. Due to the proprietary and commercially sensitive nature of the study, the Board of 92 Energy Pty Ltd. has authorised the publication of results only for areas within the National Parks and existing mining leases in the NW McArthur Basin area, and areas covered by exploration tenement/dispositions in the Athabasca Basin. These zones are generally representative of the wider studies and include the majority of the highly favourable areas for both areas.

6. Discussion

6.1. Sources of Statistical Anomalism in Data-Driven MPM

As demonstrated with the weights of evidence analysis above, statistical anomalies can arise in cases where even a few known deposits/occurrences are located within a relatively small feature. The higher density of populated cells within that feature dramatically enhances the statistical likelihood of finding a deposit there according to the WofE analysis. This may genuinely reflect the feature’s enhanced prospectivity or may be, to some extent, the result of increased historical exploration in that area. Bias towards historical exploration and discovery areas is an inevitable consequence of the generally enhanced levels of investigative work that is undertaken in those zones. For example, in the NW McArthur Basin haematitic breccia is mapped in great detail around several known deposits and mineral fields due to its obvious interest as an indicator of hydrothermal activity and possible mineralisation. However, it is difficult to detect and unlikely to be recorded in areas that have never been drill-tested, where it occurs below shallow cover or in those areas that have historically received only cursory attention from explorers. Similarly, folds and faults are commonly mapped and traced in great detail around areas of known mineralisation but may go unrecognised and unrecorded elsewhere. In the Athabasca Basin, EM surveys (particularly ground surveys) have historically been concentrated around brown-field areas. As a result, EM conductors (notably the highly prospective ground conductors) are largely confined to areas of known mineralisation where such surveys have been undertaken. This sort of ‘historical attention bias’ (i.e., the preferential collection of data around areas of known mineralisation) undoubtedly results in certain features being over-emphasised in purely statistical analyses, especially those undertaken at the regional (or larger) scale. The exploration attention dichotomy is further exaggerated between areas of exposed basement and those under significant cover, as is evidenced by the complete lack of recorded uranium occurrences within the part of the NW McArthur Basin study area covered by Proterozoic sandstone. Concentrations of uranium must surely exist in the underlying basement rocks but because these concealed occurrences are very difficult to detect, the training set is currently restricted to areas of exposed basement or very shallow cover.
Another important factor to consider in underexplored areas is that results of the WofE analysis commonly ‘confirm’ (or conform to) historical exploration models. Historical mineralisation models drive exploration, leading to more discoveries of those that fit that particular model. In underexplored terrains this potentially enforces an incomplete or erroneous model. A key question is: Are known deposits truly representative of all deposits, including those yet to be discovered? Recent discoveries just outside the current Athabasca Basin boundary and which do not strictly conform to historical exploration models (Arrow, Triple R—Patterson Lake South) and the ensuing ‘rush’ by explorers to find analogues [175] illustrate the point that new discoveries can lead to a modification of the prevailing targeting model and appreciation of a new search space [176]. This leads to further discoveries, which in-turn, reinforce the new exploration paradigm.

6.2. Unbiased Structure Definition

Geophysical edges generally display a weak statistical spatial association with known uranium mineralisation for both the NW MacArthur and Athabasca basin study areas. This can be interpreted in several ways. It may be that uranium mineralisation in both areas is commonly related to structures that do not necessarily display strong geophysical gradients, or it may be that the edge detection routines used here are too sensitive to gradients, which may or may not represent significant structures. Alternatively, it may be reasonable to assume that the number of discovered deposits in each area is relatively small compared to the number of undiscovered deposits, and that the known deposits are preferentially clustered in areas, which have historically been relatively easy to explore (e.g., areas of exposed basement, areas under relatively shallow cover and areas not subject to stringent access constraints). On-ground geological investigations of all kinds are more commonly carried out in these areas and as has already been suggested tend to be particularly concentrated around areas of known mineralisation. It should be expected then that known deposits will commonly display a higher level of spatial association with features that have been preferentially mapped in those same areas.
The benefit of the geophysical edge detection routines is that they represent a completely unbiased approach to structure definition. They work equally well in difficult to explore areas and areas under cover as they do in areas of exposed basement. It follows then that if the number of undiscovered deposits associated with concealed structures represented by the geophysical edges is large compared to the number of known deposits, the statistical significance of those few known deposits is very much reduced. If that is the case, the purely statistical WofE analysis is only telling a part of the story. This is particularly likely in the NW McArthur Basin where many prospective areas experienced only cursory uranium exploration before access was severely restricted with the establishment of the Kakadu National Park in the late 1970s. The ability of the edge detection routines to detect features where exploration has traditionally been very difficult inevitably means that they show a statistically weaker spatial association with known mineralisation, especially where large parts of the investigation area are under cover. However, outside of the National Park these previously unrecognised features may represent important and largely untouched exploration targets.

6.3. Interpreting Fuzzy Logic MPM Results

The geological validity of the fuzzy logic mineral potential models for unconformity-style uranium deposits in the NW McArthur Basin and Athabasca Basin is demonstrated by the fact that the majority of known uranium deposits, camps and districts (also addressed as fields or provinces) occur within areas of elevated to very high favourability in the resulting favourability maps (NW McArthur Basin: 62.9% of uranium occurrences and 80.0% of uranium deposits occur above the 75th percentile; Athabasca Basin: 82.0% of unconformity-related uranium occurrences and 85.2% of mines and prospects occur above the 75th percentile of favourability values). In addition, the models identified several areas that contain all ingredients for unconformity-style uranium mineralisation that are mappable at the scale of our investigation but which may have been overlooked by previous explorers.
The models presented herein follow a conservative approach and have been constructed in such a way that they account for the known distribution of uranium mineralisation without seeking to exploit new methodologies beyond what is supported by statistical analyses. A significant advantage of this type of modelling is that as new knowledge comes to light, the analyses can be modified accordingly to take into account innovative concepts and new findings. Newly acquired or improved versions of spatial data, particularly those that offer even coverage across the entire area of interest can also be readily incorporated into the model.
Limitations to what can be achieved through MPM can arise due to the inability of currently available data to adequately describe key components of the mineralising system. Geological features represented in spatial data may also be inconsistently characterised or even provide a misleading picture of their association with mineralisation for a wide variety of reasons including but not limited to incomplete mapping, partial erosion or partial cover of critical features by younger sedimentary units (i.e., important features that are present in the third dimension may not be represented in 2D spatial data).
Uranium mineralisation in both the NW McArthur and Athabasca basins is intimately linked to structure and this has been used as a key control in both models. Structures undergoing reactivation during later tectonic events create zones of dilation and brecciation. These ‘structurally prepared host zones’ have been recognised as critical controls on uranium mineralisation in the Alligator Rivers Uranium Field [110]. However, the lack of exploration in the NW McArthur Basin, with large areas covered by national parks or with limited access since the 1970s likely results in an incomplete understanding of the basement fault architecture in the area. Furthermore, the middle Proterozoic basin-fill and younger rocks are relatively undeformed compared to the underlying Paleoproterozoic sequences, which have experienced multiple phases of intense deformation. Although a few major structures visibly extend from areas of exposed Paleoproterozoic basement and into the cover sequences (e.g., Ranger Fault and Bulman Fault Zone), there is some doubt as to whether the pattern of deeply eroded canyons dissecting the Kombolgie Sandstone adequately represents the underlying basement structural geometry. While some authors consider the surficial features a reliable representation of reactivated basement structures (e.g., [177]), the joint pattern may be more closely related to a late phase of regional flexing and therefore largely unrelated to large-scale basement structures, which could potentially host uranium mineralisation [110]. The largest known ARUF uranium deposits are closely associated with listric faults in the basement. Similar structures may not necessarily have any expression in or through the overlying upper Proterozoic sedimentary sequences of the Kombolgie Subgroup as exemplified by the world-class Jabiluka deposits, which were discovered below a thin cover of transported sand that masked their radiometric response [26]. New exploration discoveries (e.g., a major concealed basement structure beneath the Kombolgie Sandstone) would significantly affect future iterations of the model.
Due to the high level of importance attributed to proximity to Archean complexes and the presence of favourable host lithologies, the Rum Jungle and Alligator Rivers uranium fields display the most favourable zones in the MPM. These fields host the largest uranium deposits in the area. By contrast, the South Alligator Valley Uranium Field shows only moderately elevated prospectivity (Figure 14) and is host to several small occurrences and only two minor deposits that are polymetallic in nature (U, Au ± PGE, Ni, Co: [26]). The area contains no identified Archean-age rocks and generally less favourable lithologies, with the exception of a small area of haematitic breccia around the El Sherana deposit. In contrast to the major ARUF uranium deposits, these deposits are controlled by subvertical structures [26]. The regional model effectively highlights both the El Sherana and Coronation Hill deposits, but a more detailed MPM specifically constructed to reflect the genetic model for mineralisation in the South Alligator River Uranium Field could be constructed to effectively target analogues of the main mineralised zones.
The Athabasca Basin MPM effectively ‘rediscovers’ the main areas of known mineralisation. Graphitic shear zones make attractive unconformity-style uranium targets in the Athabasca Basin where they show up as conductors on EM surveys and these are weighted accordingly in the MPM presented herein. The success of historical exploration programs targeting EM conductors supports the idea of a genetic link between carbon species reductants and uranium mineralisation [3,178]. However, this success may also lead to some degree of ‘exploration bias’ with the genetic importance of conductors being overemphasised due to the lack of alternative targeting methodologies. Fe-rich silicates and sulphides have been proposed as efficient reducing agents [124], with or without the presence of carbon species (i.e., conductors). However, such deposits, which have no spatial relationship to EM conductors and no other characteristic geophysical signature would be significantly harder to detect under cover and hence to incorporate into alternative models.
Recent discoveries outside the perimeter of the sedimentary basin (Arrow, Triple R—Patterson Lake South) as well as historical occurrences and the Cluff Lake deposits demonstrate the existence of ‘unconventional’ basement-hosted uranium deposits, below the Athabasca Basin unconformity. Conceptual targeting for such systems and the development of appropriate mineral potential models is easily accommodated through variations to the model as long as appropriate proxies can be found for critical components of the mineralising system. Alternative models that place greater emphasis on the geophysical linear (for example) or that consider less conventional notions of uranium deposit genesis can be quickly tested with this methodology and used to arrive at more novel and speculative exploration targets.
Regional-scale models such as those described for these two Proterozoic basins must inevitably be somewhat generalised due to the need to accommodate a wide range of geological environments and local controls on mineralisation. The models presented herein are constructed in such a way that they balance the need to be as discerning as possible, without disregarding large areas of prospective ground. Like any exploration technique that relies upon spatial data as an input, significant limitations are placed on the methodology by the availability and quality of those data sets. Errors, omissions or inaccuracies in the input data are inevitably propagated through to the output from the analyses (i.e., the ‘garbage in = garbage out’ concept). For this reason, data must be stringently vetted prior to inclusion in the model to avoid ‘contaminating’ the analysis with substandard or incomplete data (cf. Hronsky and Kreuzer, [179]).
The models are further limited by their inability to incorporate controls on mineralisation that have no geographically consistent representation in the available spatial data and at the scale of investigation (e.g., the presence of reducing agents that are not associated with EM conductors and without other geophysically discernible properties). Criteria representing the distinctive host-rock alteration features that typically surround unconformity-type uranium deposits are not included in the MPM due to their relatively small size compared to the scale of the basin-wide studies. Hydrothermal alteration effects give rise to most of the geophysical, geochemical and mineralogical signatures of the mineralisation, so subsequent, prospect-scale investigations should be designed such that they focus on the highly-prospective areas identified in the regional MPM but with emphasis on local controls on mineralisation such as hydrothermal alteration effects.
The authors acknowledge that models presented for each area represent just one of an infinite number of possible solutions. Every step from predictor map construction, assigning weights and design of the inference network was driven by a small group of ‘experts’. While the authors consider the models to be a suitable representation of the current state of knowledge regarding uranium mineralisation in the two Proterozoic basins, the opinions of other experts might differ from those that form the basis of these studies. An important feature of this type of analysis is that it allows for rapid iterative modification. New, or recompiled legacy data, revised weights or modified logic network designs that target specific deposit types, or that consider alternate genetic models can be readily accommodated and tested.
Despite the limitations outlined above, the MPM methodology represents an efficient tool for reducing the search space and can be applied at a wide range of scales provided suitable spatial data are available. At the regional scale, the methodology’s strength lies in its ability to highlight broad zones of elevated mineral potential, rather than discrete exploration targets. Favourable zones highlighted by the MPM should be ranked and prioritised by the exploration geoscientist for follow up with prospect-scale studies (e.g., the CMIC Footprints study at the McArthur River and Millennium uranium deposits [180] or more focussed, prospect-scale MPM), using higher resolution data and incorporating local controls on mineralisation.
In summary, we believe that such a hybrid approach (cf. [179]), focused on intelligence amplification (IA) rather than artificial intelligence (AI), is the most effective way to use MPM in that it harnesses “the best-ever left brain for logic and rationality” as represented by the computing environment and “the best-ever right brain for creativity, judgment and wisdom” as represented by the human mind. In the words of Brooks [181], “intelligence amplifying systems can, at any given level of available systems technology, beat AI systems. That is, a machine and a mind can beat a mind-imitating machine working by itself.”

7. Conclusions

Descriptive and genetic models for unconformity-style uranium mineralisation, with particular emphasis on spatial footprints enabling prediction of undiscovered resources, have been presented herein. Predictive fuzzy logic mineral potential modelling (MPM) is presented for the two most prospective basins, the Athabasca and NW McArthur basins.
Several as yet untested conceptual target zones were highlighted within each of the study areas as a result of the analyses. Importantly, the overwhelming majority of known uranium occurrences were correctly ‘rediscovered’ in the process, thus demonstrating the effectiveness and applicability of the process to mineral exploration targeting. Follow-up, prospect-scale studies should focus on areas identified as highly favourable in these analyses. These should be designed such that they consider specific, local controls on mineralisation and incorporate geochemical and geophysical representations of hydrothermal alteration assemblages.
The nature of regional-scale exploration targeting for unconformity-style uranium in Proterozoic basins (i.e., detecting blind deposits under significant cover, relying almost entirely on geophysical targeting methods), combined with a generally low data density, imposes some limitations on the use of MPM methodologies. As with any approach to exploration targeting, inconsistencies in data quality and acquisition density at the regional scale invariably lead to some degree of bias towards more data-rich, brown-fields areas and increasing levels of uncertainty in underexplored domains. It should be noted that extensive geochemical datasets [182] and seismic survey data [103] exist for parts of the Athabasca Basin and while they would provide useful source material for a more localised MPM, their use was considered inappropriate for the basin-wide study presented herein given that these data only cover part of the basin.
Many of the inputs used in this study are 1st- and 2nd-order interpretations of geophysical data sets, which are themselves compilations of individual surveys, which vary greatly in resolution and quality. However, the geophysical data cover the entire study areas relatively evenly and the geophysical edge detection routines described herein attempt to present a completely unbiased interpretation and, as such, offer a valid tool for the generation of unconventional targets in areas under cover.
Alternative targeting concepts and data can be rapidly incorporated and assessed in fuzzy logic mineral potential modelling. When used appropriately and in conjunction with other targeting techniques MPM can be a powerful tool in the decision-making process to efficiently reduce the search space while simultaneously increasing the probability of discovery at reduced risk and costs.

Author Contributions

Conceptualisation, M.B., O.K. and A.W.; methodology, M.B., O.K., A.W., A.B., K.B. and F.B.; software, M.B., A.B.; validation, M.B., O.K. and A.W.; formal analysis, M.B., A.B. and K.B.; investigation, M.B., A.W. and O.K.; resources, M.B., O.K., A.W., A.B. and K.B.; data curation, M.B. and A.B.; writing—original draft preparation, M.B., A.W., O.K. and A.B.; writing—review and editing, M.B., O.K. and A.W.; visualisation, M.B.; project administration, M.B., O.K. and A.W. All authors have read and agreed to the published version of the manuscript.

Funding

This research received no external funding.

Acknowledgments

The authors thank the Board of 92 Energy Pty Ltd. for allowing this work to be published. We also acknowledge three anonymous reviewers whose helpful and insightful comments improved this manuscript greatly.

Conflicts of Interest

The authors declare no conflict of interest.

Appendix A

NW McArthur Basin Fuzzy Weights: Fuzzy membership values for predictor maps used in the construction of the North McArthur Basin Fuzzy Logic mineral prospectivity model for unconformity-type uranium deposits.

Appendix B

Athabasca Basin Fuzzy Weights: Fuzzy membership values for predictor maps used in the construction of the Athabasca Basin Fuzzy Logic mineral prospectivity model for unconformity-type uranium deposits.

References

  1. Jefferson, C.; Thomas, D.J.; Gandhi, S.; Ramaekers, P.; Delauney, G.; Brisbin, D.; Cutts, C.; Portella, P.; Olson, R. Unconformity-associated uranium deposits of the Athabasca Basin, Saskatchewan and Alberta. Bull. Geol. Surv. Can. 2007, 588, 23–67. [Google Scholar]
  2. International Atomic Energy Agency. Unconformity-Related Uranium Deposits; TECDOC 1857; International Atomic Energy Agency: Vienna, Austria, 2018; ISBN 978-92-0-108518-4. [Google Scholar]
  3. Jefferson, C.W.; Thomas, D.; Quirt, D.; Mwenifumbo, C.J.; Brisbin, D. Empirical models for Canadian unconformity-associated uranium deposits. In Proceedings of the Exploration 07-Fifth Decennial International Conference on Mineral Exploration, Toronto, ON, Canada, 9–12 September 2007; pp. 741–769. [Google Scholar]
  4. Dahlkamp, F.J. Uranium Deposits of the World: Asia; Springer: Berlin/Heidelberg, Germany, 2009; ISBN 978-3-540-78557-6. [Google Scholar]
  5. Dahlkamp, F.J. Uranium Deposits of the World: USA and Latin America; Springer: Berlin/Heidelberg, Germany, 2010; ISBN 978-3-540-78555-2. [Google Scholar]
  6. Dahlkamp, F.J. Uranium Deposits of the World: Europe; Springer: Berlin/Heidelberg, Germany, 2016; ISBN 978-3-540-78553-8. [Google Scholar]
  7. Wyborn, L.A.I.; Heinrich, C.A.; Jaques, A.L. Australian Proterozoic Mineral Systems: Essential Ingredients and Mappable Criteria. In Proceedings of the AusIMM Annual Conference, Darwin, Australia, 5 August 1994; pp. 109–115. [Google Scholar]
  8. Knox-Robinson, C.M.; Wyborn, L.A.I. Towards a holistic exploration strategy: Using Geographic Information Systems as a tool to enhance exploration. Aust. J. Earth Sci. 1997, 44, 453–463. [Google Scholar] [CrossRef]
  9. McCuaig, T.C.; Beresford, S.; Hronsky, J. Translating the mineral systems approach into an effective exploration targeting system. Ore Geol. Rev. 2010, 38, 128–138. [Google Scholar] [CrossRef]
  10. McCuaig, T.; Hronsky, J. The mineral system concept: The key to exploration targeting. Soc. Econ. Geol. Spec. Publ. 2014, 18, 153–175. [Google Scholar] [CrossRef]
  11. Hagemann, S.G.; Lisitsin, V.A.; Huston, D.L. Mineral system analysis: Quo vadis. Ore Geol. Rev. 2016, 76, 504–522. [Google Scholar] [CrossRef]
  12. Kreuzer, O.; Yousefi, M.; Nykänen, V. Introduction to the special issue on spatial modelling and analysis of ore-forming processes in mineral exploration targeting. Ore Geol. Rev. 2020, 103391. [Google Scholar] [CrossRef]
  13. Porwal, A.K.; Kreuzer, O.P. Introduction to the Special Issue: Mineral prospectivity analysis and quantitative resource estimation. Ore Geol. Rev. 2010, 38, 121–127. [Google Scholar] [CrossRef]
  14. Knox-Robinson, C.M. Vectorial fuzzy logic: A novel technique for enhanced mineral prospectivity mapping, with reference to the orogenic gold mineralisation potential of the Kalgoorlie Terrane, Western Australia. Aust. J. Earth Sci. 2000, 47, 929–941. [Google Scholar] [CrossRef]
  15. Bierlein, F.P.; Bruce, M.D. A Continent-scale GIS-based Assessment of the Distribution and Potential for Sandstone-hosted Uranium Deposits. In Quantitative and Spatial Evaluations of Undiscovered Uranium Resources; IAEA TECDOC 1861; IAEA: Vienna, Austria, 2018; pp. 133–171. ISBN 978-92-0-109518-3. [Google Scholar]
  16. Bruce, M.D.; Bierlein, F.P.; Fairclough, M. Using Continent-Scale Spatial Targeting to Delineate Permissive Areas for Sandstone-Hosted Uranium. International Symposium on Uranium Raw Material for the Nuclear Fuel Cycle: Exploration, Mining, Production, Supply and Demand, Economics and Environmental Issues (URAM-2018); International Atomic Energy Agency: Vienna, Austria, 2018. [Google Scholar]
  17. Chorlton, L.B. Generalized geology of the world: Bedrock domains and major faults in GIS format: A small-scale world geology map with an extended geological attribute database. Geol. Surv. Can. 2007, 5529, 1. [Google Scholar] [CrossRef]
  18. Wheeler, J.O.; Hoffman, P.F.; Card, K.D.; Davidson, A.; Sanford, B.V.; Okulitch, A.V.; Roest, W.R. Geological map of Canad: Map D1860A; Geological Survey of Canada: Ottawa, ON, Canada, 2015.
  19. Schobbenhaus, C.; Bellizzia, A. Geological Map of South America 1:5 000 000; CPRM-DNPM: Belo Horizonte, Brasil, 2001.
  20. Garrity, C.P.; Soller, D.R. Database of the Geologic Map of North America-Adapted from the Map by J.C. Reed, Jr. and Others (2005); Data Series DS-424; U.S. Geological Survey: Reston, VA, USA, 2009.
  21. OneGeology-Europe EGDI 1M-Scale Surface Geology. Available online: http://www.eurogeosurveys.org/projects/onegeology-europe/2019 (accessed on 11 April 2018).
  22. Geological Survey of India. Geology of India 1:2M Scale 2019. Available online: http://bhukosh.gsi.gov.in/Bhukosh/MapViewer.aspx (accessed on 20 June 2020).
  23. Blake, D.H.; Kilgour, B. Geological Regions of Australia, 1:5 000 000 Scale; Geoscience Australia: Canberra, Australia, 2009.
  24. Geological Survey of South Australia. South Australian Solid Geology: Middle Mesoproterozoic Polygons. Available online: https://map.sarig.sa.gov.au/ (accessed on 12 January 2017).
  25. Singer, D.A.; Jaireth, S.; Roach, I. A three-part quantitative assessment of undiscovered unconformity-related uranium deposits in the Pine Creek region of Australia. In Quantitative and Spatial Evaluations of Undiscovered Uranium Resources; IAEA TECDOC 1861; IAEA: Vienna, Austria, 2018; pp. 264–348. ISBN 978-92-0-109518-3. [Google Scholar]
  26. Lally, J.H.; Bajwah, Z.U. Uranium Deposits of the Northern Territory; Northern Territory Geological Survey: Darwin, Australia, 2006; ISBN 978-0-7245-7107-9.
  27. Government of Saskatchewan-Central Services Mineral Deposit Index. Available online: http://applications.saskatchewan.ca/mineral-deposit-index (accessed on 4 August 2020).
  28. DevEx Resources West Arnhem Nabarlek Project | DevEX Resources. Available online: https://www.devexresources.com.au/west-arnhem-nabarlek-project (accessed on 11 August 2020).
  29. Wilde, A.R.; Wall, V.J. Geology of the Nabarlek uranium deposit, Northern Territory, Australia. Econ. Geol. 1987, 82, 1152–1168. [Google Scholar] [CrossRef]
  30. Rheinberger, G.; Hallenstein, C.; Stegman, C.L. Westmoreland Uranium Deposits. In Geology of Australian and Papua New Guinean Mineral Deposits; Monograph Series No. 22; Australasian Institute of Mining and Metallurgy: Carlton, Victoria, Australia, 1998; pp. 807–814. ISBN 1-875776-53-2. [Google Scholar]
  31. Alexandre, P.; Layton-Matthews, D.; Beyer, S.; Hiatt, E.; Lafontaine, J. Formation of the enigmatic Matoush uranium deposit in the Paleoprotozoic Otish Basin, Quebec, Canada. Miner. Depos. 2015, 50. [Google Scholar] [CrossRef]
  32. Gyorfi, I.; Hajnal, Z.; White, D.J.; Takács, E.; Reilkoff, B.; Annesley, I.; Powell, B. High-resolution seismic survey from the McArthur River region: Contributions to mapping of the complex P2 uranium ore zone, Athabasca Basin, Saskatchewan. Bull. Geol. Surv. Can. 2007, 588, 397–412. [Google Scholar]
  33. Johnston, D.J. Structural Geology of the Pine Creek Inlier and Mineralization Therein. Ph.D. Thesis, Monash University, Melbourne, Australia, 1984; p. 1984. [Google Scholar]
  34. Hein, K.A.A. Geology of the Ranger Uranium Mine, Northern Territory, Australia: Structural constraints on the timing of uranium emplacement. Ore Geol. Rev. 2002, 20, 83–108. [Google Scholar] [CrossRef]
  35. Tourigny, G.; Quirt, D.H.; Wilson, N.S.F.; Wilson, S.; Breton, G.; Portella, P. Geological and structural features of the Sue C uranium deposit, McClean Lake area, Saskatchewan. Bull. Geol. Surv. Can. 2007, 588, 229. [Google Scholar] [CrossRef]
  36. Hoeve, J.; Sibbald, T.I. On the genesis of Rabbit Lake and other unconformity-type uranium deposits in northern Saskatchewan, Canada. Econ. Geol. 1978, 73, 1450–1473. [Google Scholar] [CrossRef]
  37. Hoeve, J.; Quirt, D. Mineralization and Host Rock Alteration in Relation to Clay Mineral Diagenesis and Evolution of the Middle-Proterozoic, Athabasca Basin, Northern Saskatchewan, Canada; Saskatchewan Research Council: Saskatoon, SK, Canada, 1984; p. 187. [Google Scholar]
  38. Hoeve, J.; Quirt, D. A stationary redox front as a critical factor in the formation of high-grade, unconformity-type uranium ores in the Athabasca Basin, Saskatchewan, Canada. Bull. De Minéralogie 1987, 110, 151–171. [Google Scholar] [CrossRef]
  39. Wallis, R.; Saracoglu, N.; Golightly, J.; Brummer, J. Geology of the McClean uranium deposits, northern Saskatchewan. CIM Bull. 1984, 77, 69–96. [Google Scholar]
  40. Kotzer, T.G.; Kyser, T.K. Petrogenesis of the Proterozoic Athabasca Basin, northern Saskatchewan, Canada, and its relation to diagenesis, hydrothermal uranium mineralization and paleohydrogeology. Chem. Geol. 1995, 120, 45–89. [Google Scholar] [CrossRef]
  41. Quirt, D.Q. Athabasca unconformity-type uranium deposits: One deposit type with many variations. In Proceedings of the Uranium Geochemistry, Nancy, France, 13–16 April 2003; pp. 309–312. [Google Scholar]
  42. Alexandre, P.; Kyser, K.; Polito, P.; Thomas, D. Alteration mineralogy and stable isotope geochemistry of Paleoproterozoic basement-hosted unconformity-type uranium deposits in the Athabasca Basin, Canada. Econ. Geol. 2005, 100, 1547–1563. [Google Scholar] [CrossRef]
  43. Taylor, J. Origin and Controls of Uranium Mineralisation in South Alligator Valley; Lucas Heights, N.S.W., Ed.; Australian Atomic Energy Commission: Sydney, Australia, 1969.
  44. Binns, R.A.; McAndrew, J.; Sun, S.S. Origin of uranium mineralization at Jabiluka. In Uranium in the Pine Creek Geosyncline, Proc. International Symposium on Pine Creek Geosyncline; Ferguson, J., Goleby, A., Eds.; IAEA: Vienna, Austria, 1980; pp. 543–562. [Google Scholar]
  45. Ferguson, J.; Ewers, G.R.; Donnelly, T.H. Model for the Development of Economic Uranium Mineralization in the Alligator Rivers Uranium Field; IAEA: Vienna, Austria, 1980; ISBN 92-0-140080-2. [Google Scholar]
  46. Needham, R.S. A Review of Mineralisation in the South Alligator Conservation Zone; Bureau of Mineral Resources: Canberra, Australia, 1987; p. 24.
  47. Valenta, R.K. Structure and Mineralization in the South Alligator Valley Part 1. In Structural Controls on Mineralisation of the Coronation Hill Deposits and Surrounding Area; Mineral Provinces, Bureau of Mineral Resources, Geology and Geophysics: Canberra, Australia, 1991; Volume 7, p. 231. ISBN 0-642-16997-7. [Google Scholar]
  48. Wilde, A.R. Unconformity-related uranium-gold deposits of Northern Australia; resources, genesis and exploration. In IAEA Tecdoc 650, Proceedings of New Developments in Uranium Exploration, Resources, Production and Demand, Vienna, Austria, 26–29 August 1991; IAEA: Vienna, Austria, 1992; pp. 49–58. [Google Scholar]
  49. Polito, P.A.; Kyser, T.K.; Marlatt, J.; Alexandre, P.; Bajwah, Z.; Drever, G. Significance of alteration assemblages for the origin and evolution of the Proterozoic Nabarlek unconformity-related uranium deposit, Northern Territory, Australia. Econ. Geol. 2004, 99, 113–139. [Google Scholar]
  50. Polito, P.; Kyser, T.; Alexandre, P.; Hiatt, E.; Stanley, C. Advances in understanding the Kombolgie Subgroup and unconformity-related uranium deposits in the Alligator Rivers Uranium Field and how to explore for them using lithogeochemical principles. Aust. J. Earth Sci. 2011, 58, 453–474. [Google Scholar] [CrossRef]
  51. Ahmad, M.; Lally, J.H.; McCready, A.J.; Survey, N.T.G.; Territory, N. Economic Geology of the Rum Jungle Mineral Field; Northern Territory Geological Survey: Darwin, Australia, 2006.
  52. Ahmad, M.; Dunster, J.; Munson, T. Chapter 15: McArthur Basin. In Ahmad M and Munson TJ (Compilers). ‘Geology and Mineral Resources of the Northern Territory’; Northern Territory Geological Survey: Darwin, Australia, 2013; p. 15. ISBN 978-0-7245-7257-1. [Google Scholar]
  53. Wall, V. Unconformity-related uranium systems: Downunder and over the top. Aseg Ext. Abstr. 2006. [Google Scholar] [CrossRef]
  54. Skirrow, R.G.; Jaireth, S.; Huston, D.L.; Bastrakov, E.N.; Schofield, A.; van der Wielen, S.E.; Barnicoat, A.C. Uranium mineral systems: Processes, exploration criteria and a new deposit framework. Geosci. Aust. 2009, 20, 44. [Google Scholar]
  55. Skirrow, R.G.; Mercadier, J.; Armstrong, R.; Kuske, T.; Deloule, E. The Ranger uranium deposit, northern Australia: Timing constraints, regional and ore-related alteration, and genetic implications for unconformity-related mineralisation. Ore Geol. Rev. 2016, 76, 463–503. [Google Scholar] [CrossRef]
  56. Wilde, A.R.; Bloom, M.S.; Wall, V.J. Transport and Deposition of Gold, Uranium, and Platinum-Group Elements in Unconformity-Related Uranium Deposits. In Economic Geology Monograph #6: The Geology of Gold Deposits: The Perspective in 1988; Keays, R.R., Ramsay, W.R.H., Groves, D.I., Eds.; Society of Economic Geologists: Littleton, CO, USA, 1989; ISBN 978-1-62949-001-4. [Google Scholar]
  57. Derome, D.; Cathelineau, M.; Lhomme, T.; Cuney, M. Fluid inclusion evidence of the differential migration of H2 and O2 in the McArthur River unconformity-type uranium deposit (Saskatchewan, Canada). Possible role on post-ore modifications of the host rocks. J. Geochem. Explor. 2003, 78–79, 525–530. [Google Scholar] [CrossRef]
  58. Richard, A.; Cathelineau, M.; Boiron, M.-C.; Mercadier, J.; Banks, D.A.; Cuney, M. Metal-rich fluid inclusions provide new insights into unconformity-related U deposits (Athabasca Basin and Basement, Canada). Miner. Depos. 2016, 51, 249–270. [Google Scholar] [CrossRef] [Green Version]
  59. Chi, G.; Li, Z.; Chu, H.; Bethune, K.; Quirt, D.; Ledru, P.; Normand, C.; Card, C.; Bosman, S.; Davis, W.; et al. A shallow-burial mineralization model for the unconformity-related uranium deposits in the Athabasca Basin. Econ. Geol. 2018, 113, 1209–1217. [Google Scholar] [CrossRef]
  60. Alexandre, P.; Kyser, K.; Thomas, D.; Polito, P.; Marlat, J. Geochronology of unconformity-related uranium deposits in the Athabasca Basin, Saskatchewan, Canada and their integration in the evolution of the basin. Miner. Depos. 2007, 44, 41. [Google Scholar] [CrossRef]
  61. Fayek, M.; Camacho, A.; Beshears, C.; Jiricka, D.; Halaburda, J. Two sources of uranium at the Millennium uranium deposit, Athabasca Basin, Saskatchewan, Canada. In Annual Conference Abstracts Volume, Geological Association of Canada; Mineralogical Association of Canada: Calgary, AB, Canada, 2010; pp. 1–4. [Google Scholar]
  62. Worden, K.; Carson, C.; Scrimgeour, I.; Lally, J.; Doyle, N. A revised Palaeoproterozoic chronostratigraphy for the Pine Creek Orogen, northern Australia: Evidence from SHRIMP U–Pb zircon geochronology. Precambr. Res. 2008, 166, 122–144. [Google Scholar] [CrossRef]
  63. Macdonald, C.C. Mineralogy and Geochemistry of a Precambrian Regolith in the Athabasca Basin. Master’s Thesis, University of Saskatchewan, Saskatoon, SK, Canada, 1980; p. 151. [Google Scholar]
  64. Wilde, A.R. On the Origin of Unconformity Uranium Deposits. Ph.D. Thesis, Monash University, Melbourne, Australia, 1988. [Google Scholar]
  65. Hecht, L.; Cuney, M. Hydrothermal alteration of monazite in the Precambrian crystalline basement of the Athabasca Basin (Saskatchewan, Canada): Implications for the formation of unconformity-related uranium deposits. Miner. Depos. 2000, 35, 791–795. [Google Scholar] [CrossRef]
  66. Pascal, M.; Ansdell, K.; Annesley, I.R.; Kotzer, T.; Jiricka, D. Graphite-bearing Pelitic Schists and their Altered Equivalents in the Dufferin Lake Zone, South-central Athabasca Basin, Saskatchewan: Constraints On Graphite Formation and Destruction, and Implications For Uranium Mineralization. Can. Mineral. 2016, 54, 1459–1491. [Google Scholar] [CrossRef]
  67. International Atomic Energy Agency. Descriptive Uranium Deposit and Mineral System Models; Non-Serial Publications: Vienna, Austria, 2020; ISBN 978-92-0-109220-5. [Google Scholar]
  68. Kyser, T.K. Fluids, basin analysis, and mineral deposits. Geofluids 2007, 7, 238–257. [Google Scholar] [CrossRef]
  69. Gac, S.; Huismans, R.S.; Simon, N.S.C.; Podladchikov, Y.Y.; Faleide, J.I. Formation of intracratonic basins by lithospheric shortening and phase changes: A case study from the ultra-deep East Barents Sea basin. Terra Nova 2013, 25, 459–464. [Google Scholar] [CrossRef]
  70. Aspler, L.; Wisotzek, I.; Chiarenzelli, J.; Losonczy, M.; Cousens, B.; Mcnicoll, V.; Davis, W. Paleoproterozoic intracratonic basin processes, from breakup of Kenorland to assembly of Laurentia: Hurwitz Basin, Nunavut, Canada. Sediment. Geol. 2001, 141, 287–318. [Google Scholar] [CrossRef]
  71. Rainbird, R.; Stern, R.; Rayner, N.; Jefferson, C. Age, provenance, and regional correlation of the Athabasca Group, Saskatchewan and Alberta, constrained by igneous and detrital zircon geochronology. In Jefferson, C.W., and Delaney, G., Eds., EXTECH IV: Geology and Uranium EXploration TECHnology of the Proterozoic Athabasca Basin, Saskatchewan and Alberta. Bull. Geol. Surv. Can. 2007, 588, 193. [Google Scholar]
  72. Sweet, I.P.; Brakel, A.T.; Carson, L. The Kombolgie Subgroup—A New Look at an Old Formation. AGSO Res. Newsl. 1999, 30, 26–28. [Google Scholar]
  73. Rawlings, D. Stratigraphic resolution of a multiphase intracratonic basin system: The McArthur Basin, northern Australia. Aust. J. Earth Sci. 2001, 46, 703–723. [Google Scholar] [CrossRef]
  74. Jaireth, S.; Roach, I.C.; Bastrakov, E.; Liu, S. Basin-related uranium mineral systems in Australia: A review of critical features. Ore Geol. Rev. 2016, 76, 360–394. [Google Scholar] [CrossRef]
  75. McKay, A.D.; Miezitis, Y. Australia’s Uranium Resources, Geology and Development of Deposits; AGSO-Geoscience Australia: Canberra, Australia, 2001; p. 195.
  76. Ramaekers, P. Geology of the Athabasca Group (Helikian) in Northern Saskatchewan; Saskatchewan Energy and Mines, Saskatchewan Geology Survey: Saskatoon, SK, Canada, 1990. [Google Scholar]
  77. Ramaekers, P.; Jefferson, C.W.; Yeo, G.M.; Collier, B.; Long, D.; Drever, G.; McHardy, S.; Jiricka, D.; Cutts, C.; Wheatley, K.; et al. Revised geological map and stratigraphy of the Athabasca group, Saskatchewan and Alberta. Bull. Geol. Surv. Can. 2007, 588, 155–191. [Google Scholar]
  78. Durak, B.; Pagel, M.; Poty, B. Temperatures et salinites des fluides au cours des silicifications diagenetiques d’une formation greseuse surmontant un gisement d’uranium du socle: L’exemple des gres Kombolgie (Australie). Comptes Rendus Des Seances De L’academie Des. Sci. Ser. 1983, 296, 571–574. [Google Scholar]
  79. Patrier, P.; Beaufort, D.; Laverret, E.; Bruneton, P. High-grade diagenetic dickite and 2M1 illite from the middle proterozoic kombolgie formation (Northern Territory, Australia). Clays Clay Min. 2003, 51, 102–116. [Google Scholar] [CrossRef]
  80. Jeanneret, P.; Goncalves, P.; Durand, C.; Poujol, M.; Trap, P.; Marquer, D.; Quirt, D.; Ledru, P. Geochronological constraints on the trans-Hudsonian tectono-metamorphic evolution of the pre-Athabasca basement within the Wollaston-Mudjatik Transition Zone, Saskatchewan. Precambr. Res. 2017, 301, 152–178. [Google Scholar] [CrossRef] [Green Version]
  81. Creaser, R.; Stasiuk, L.D. Depositional age of the Douglas Formation, Northern Saskatchewan, determined by RE-Os geochronology. Bull. Geol. Surv. Can. 2007, 588, 341–346. [Google Scholar]
  82. Hendry, H.E.; Wealthy, K.L. The Carswell Formation, Northern Saskatchewan: Stratigraphy, Sedimentology and Structure. Geol. Ass. Can. Spec. Pap. 1985, 29, 87–103. [Google Scholar]
  83. Quirt, D.H. Kaolinite and Dickite in the Athabasca Sandstone, Northern Saskatchewan, Canada. Sask. Res. Counc. Publ. 2001, 10400, 1–27. [Google Scholar]
  84. Ramaekers, P. Development, Stratigraphy and Summary Diagenetic History of the Athabasca Basin, Early Proterozoic of Alberta and Its Relation to Uranium Potential. Alta. Geol. Surv. Alta. Energy Util. BoardSpec. Rep. 2004, 62, 94. [Google Scholar]
  85. Ypma, P.J.M.; Fuzikawa, K. Fluid inclusion and oxygen isotope studies of the Nabarlek and Jabiluka uranium deposits, Northern Territory, Australia. In Uranium in the Pine Creek Geosyncline; Ferguson, J., Goleby, A.B., Eds.; IAEA: Vienna, Austria, 1980; pp. 375–395. ISBN 92-0-140080-2. [Google Scholar]
  86. Wilde, A.R.; Mernagh, T.P.; Bloom, M.S.; Hoffmann, C.F. Fluid inclusion evidence on the origin of some Australian unconformity-related uranium deposits. Econ. Geol. 1989, 84, 1627–1642. [Google Scholar] [CrossRef]
  87. Lanson, B.; Beaufort, D.; Berger, G.; Baradat, J.; Lacharpagne, J. Illitization of diagenetic kaolinite-to-dickite conversion series: Late-stage diagenesis of the Lower Permian Rotliegene sandstone reservoir, offshore of the Netherlands. J. Sediment. Res. 1996, 66, 501–518. [Google Scholar] [CrossRef]
  88. Renac, C.; Kyser, T.K.; Durocher, K.; Dreaver, G.; O’Connor, T. Comparison of diagenetic fluids in the Proterozoic Thelon and Athabasca Basins, Canada: Implications for protracted fluid histories in stable intracratonic basins. Can. J. Earth Sci. 2002, 39, 113–132. [Google Scholar] [CrossRef]
  89. Pagel, M. Détermination des conditions physico-chimiques de la silicification diagénétique des grès Athabasca (Canada) au moyen des inclusions fluides. Comptes Rendus Académie Sci. Paris 1975, 280, 2301–2304. [Google Scholar]
  90. Derome, D.; Cathelineau, M.; Cuney, M.; Fabre, C.; Lhomme, T.; Banks, D.A. Mixing of Sodic and Calcic Brines and Uranium Deposition at McArthur River, Saskatchewan, Canada: A Raman and Laser-Induced Breakdown Spectroscopic Study of Fluid Inclusions. Econ. Geol. 2005, 100, 1529–1545. [Google Scholar] [CrossRef]
  91. Cloutier, J.; Olivo, G.; Alexandre, P.; Halaburda, J. The Millennium Uranium Deposit, Athabasca Basin, Saskatchewan, Canada: An Atypical Basement-Hosted Unconformity-Related Uranium Deposit. Econ. Geol. 2009, 104, 815–840. [Google Scholar] [CrossRef]
  92. Annesley, I.R.; Madore, C.; Portella, P. Geology and thermotectonic evolution of the western margin of the Trans-Hudson Orogen: Evidence from the eastern sub-Athabasca basement, Saskatchewan. Can. J. Earth Sci. 2005, 42, 573–597. [Google Scholar] [CrossRef]
  93. Ledru, P. The mineral system concept applied to unconformity related uranium deposits of the Athabasca Basin (Canada). In Proceedings of the 15th SGA Biennial Meeting, Glasgow, Scotland, 27–30 August 2019; pp. 1179–1182. [Google Scholar]
  94. Martz, P.; Mercadier, J.; Cathelineau, M.; Boiron, M.-C.; Quirt, D.; Doney, A.; Gerbeaud, O.; De Wally, E.; Ledru, P. Formation of U-rich mineralizing fluids through basinal brine migration within basement-hosted shear zones: A large-scale study of the fluid chemistry around the unconformity-related Cigar Lake U deposit (Saskatchewan, Canada). Chem. Geol. 2019, 508, 116–143. [Google Scholar] [CrossRef]
  95. Eldursi, K.; Chi, G.; Bethune, K.; Li, Z.; Ledru, P.; Quirt, D. New insights from 2- and 3-D numerical modelling on fluid flow mechanisms and geological factors responsible for the formation of the world-class Cigar Lake uranium deposit, eastern Athabasca Basin, Canada. Miner. Depos. 2020. [Google Scholar] [CrossRef]
  96. Cui, T.; Yang, J.; Samson, I.M. Tectonic Deformation and Fluid Flow: Implications for the Formation of Unconformity-Related Uranium Deposits. Econ. Geol. 2012, 107, 147–163. [Google Scholar] [CrossRef]
  97. Li, Z.; Chi, G.; Bethune, K.; Thomas, D.; Zaluski, G. Structural Controls on Fluid Flow During Compressional Reactivation of Basement Faults: Insights from Numerical Modeling for the Formation of Unconformity-Related Uranium Deposits in the Athabasca Basin, Canada. Econ. Geol. 2017, 112, 451–466. [Google Scholar] [CrossRef]
  98. Benedicto, A.; MacKay, C.; Slugoski, D.; Frostad, S.; Ledru, P. Uranium mineralization and structural controls in the Spitfire prospect, Hook Lake Project, Patterson Lake Trend, Canada. In Proceedings of the 14th SGA Biennial Meeting, Québec City, QC, Canada, 20–23 August 2017; pp. 715–718. [Google Scholar]
  99. Hillacre, S.; Ansdell, K.; Mcewan, B.; Mcnamara, G. Structural analysis, paragenesis, and preliminary geochronology of the Arrow uranium deposit, Athabasca Basin, northern Saskatchewan, Canada: Implications for controls on mineralization. In Proceedings of the 14th SGA Biennial Meeting, Québec City, QC, Canada, 20–23 August 2017; pp. 743–746. [Google Scholar]
  100. Abdelrazek, M.; Benedicto, A.; Fayek, M.; Mackay, C.; Slugoski, D.; Gerbeaud, O.; Ledru, P. Permeability network, alteration and mineralization of the Spitfire basement- hosted uranium prospect, Western Athabasca, Canada. In Proceedings of the 15th SGA Biennial Meeting, Glasgow, Scotland, UK, 27–30 August 2019; pp. 1175–1178. [Google Scholar]
  101. Bray, C.J.; Spooner, E.T. Unconformity-related uranium mineralization, McClean deposits, North Saskatchewan, Canada. Can. Mineral. 1988, 26, 249–268. [Google Scholar]
  102. Gyorfi, I. Seismic Constraints on the Geological Evolution of the McArthur River Region in View of the Tectonics of the Eastern Athabasca Basin, Northern Saskatchewan. Ph.D. Thesis, University of Saskatchewan, Saskatoon, SK, Canada, 2006. [Google Scholar]
  103. Hajnal, Z.; White, D.J.; Takacs, E.; Gyorfi, I.; Annesley, I.R.; Wood, G.; O’Dowd, C.; Nimeck, G. Application of modern 2-D and 3-D seismic-reflection techniques for uranium exploration in the Athabasca Basin. Can. J. Earth Sci. 2010, 47, 761–782. [Google Scholar] [CrossRef]
  104. Tourigny, G.; Wilson, S.; Breton, G.; Portella, P. Structural controls and emplacement of uranium mineralization at the Sue C deposit, McClean Lake operation, northern Saskatchewan. Sask. Energy Mines Misc. Rep. 2001, 4, 334–352. [Google Scholar]
  105. Martz, P.; Cathelineau, M.; Mercadier, J.; Boiron, M.-C.; Jaguin, J.; Tarantola, A.; Demacon, M.; Gerbeaud, O.; Quirt, D.; Doney, A.; et al. C-O-H-N fluids circulations and graphite precipitation in reactivated Hudsonian shear zones during basement uplift of the Wollaston-Mudjatik Transition Zone: Example of the Cigar Lake U deposit. Lithos 2017, 294–295, 222–245. [Google Scholar] [CrossRef]
  106. Harvey, S.E. Structural geology of the Deilmann orebody, Key Lake, Saskatchewan. Sask. Geol. Surv. Summ. Investig. 1999, 2, 99-42. [Google Scholar]
  107. Baudemont, D.; Fedorowich, J. Structural control of uranium mineralization at the Dominique-Peter Deposit, Saskatchewan, Canada. Econ. Geol. 1996, 91, 855–874. [Google Scholar] [CrossRef]
  108. Lorilleux, G.; Jébrak, M.; Cuney, M.; Baudemont, D. Polyphase hydrothermal breccias associated with unconformity-related uranium mineralization (Canada): From fractal analysis to structural significance. J. Struct. Geol. 2002, 24, 323–338. [Google Scholar] [CrossRef]
  109. Goodwin, L.B.; Tikoff, B. Competency contrast, kinematics, and the development of foliations and lineations in the crust. J. Struct. Geol. 2002, 24, 1065–1085. [Google Scholar] [CrossRef]
  110. Browne, A. Alligator Rivers uranium: Facts and fiction. In Proceedings of the NTGS Annual Geoscience Exploration Seminar, Alice Springs, Darwin, Australia, 20 March 2013. [Google Scholar]
  111. Pilkington, M. Variable-depth magnetization mapping: Application to the Athabasca basin, northern Alberta and Saskatchewan, Canada. Geophysics 1989, 54. [Google Scholar] [CrossRef]
  112. Lane, R.; Beckitt, G.; Duffett, M. 3D geological mapping and potential field modelling of West Arnhem Land, Northern Territory. Aseg. Ext. Abstr. 2007, 1–9. [Google Scholar] [CrossRef] [Green Version]
  113. Carson, L.J.; Haines, P.W.; Brakel, A.T.; Pietsch, B.A.; Ferenczi, P.A. Milingimbi, Northern Territory: Explanatory Notes; Northern Territory Geological Survey: Darwin, Australia, 1999; ISBN 978-0-7245-7155-0.
  114. Lally, J.H.; Doyle, N. Pine Creek Orogen 1:500 000 Solid Geology Interpretation, Regional Dataset; Northern Territory Geological Survey: Darwin, Australia, 2005.
  115. Dunn, P.R. Alligator Rivers, Northern Territory Explanatory Notes; 1:250 000 Geological Map Series; Bureau of Mineral Resources: Canberra, Australia, 1962.
  116. Needham, R.S. Nabarlek Region, Northern Territory, Explanatory Notes; 1:100 000 Geological Map Series; Bureau of Mineral Resources: Canberra, Australia, 1982; ISBN 978-0-644-01905-7.
  117. Hollis, J.A.; Carson, C.J.; Glass, L.M. The discovery of an Archaean Inlier in Arnhem Land. In Annual Geoscience Exploration Seminar (AGES); Record of Abstracts; Northern Territory Geological Survey: Northern Territory, Australia, 2008; Volume 2008-002. [Google Scholar]
  118. Hollis, J.A.; Carson, C.J.; Glass, L.M. Regionally extensive Neoarchaean basement in Arnhem Land. In Annual Geoscience Exploration Seminar (AGES); Record of Abstracts; Northern Territory Geological Survey: Northern Territory, Australia, 2009; Volume 2009-002. [Google Scholar]
  119. Hollis, J.A.; Carson, C.J.; Glass, L.M. SHRIMP U–Pb zircon geochronological evidence for Neoarchean basement in western Arnhem Land, northern Australia. Precambr. Res. 2009, 174, 364–380. [Google Scholar] [CrossRef]
  120. Carson, C.; Hollis, J.; Glass, L.; Close, D.; Whelan, J.; Wygralak, A. Summary of Results. Joint NTGS-GA Geochronology Project: East Arunta, Pine Creek Orogen and Murphy Inlier Regions, July 2007–June 2009; NTGS Record 2010-004; Northern Territory Geological Survey: Darwin, Australia, 2011.
  121. Richard, A.; Banks, D.A.; Mercadier, J.; Boiron, M.-C.; Cuney, M.; Cathelineau, M. An evaporated seawater origin for the ore-forming brines in unconformity-related uranium deposits (Athabasca Basin, Canada): Cl/Br and δ37Cl analysis of fluid inclusions. Geochim. Cosmochim. Acta 2011, 75, 2792–2810. [Google Scholar] [CrossRef]
  122. Mercadier, J.; Richard, A.; Cathelineau, M. Boron- and magnesium-rich marine brines at the origin of giant unconformity-related uranium deposits: δ11B evidence from Mg-tourmalines. Geology 2012, 40, 231–234. [Google Scholar] [CrossRef]
  123. Jaireth, S. The calculated solubility of platinum and gold in oxygen-saturated fluids and the genesis of platinum-palladium and gold mineralization in the unconformity-related uranium deposits. Miner. Depos. 1992, 27, 42–54. [Google Scholar] [CrossRef]
  124. Komninou, A.; Sverjensky, D.A. Geochemical modeling of the formation of an unconformity-type uranium deposit. Econ. Geol. 1996, 91, 590–606. [Google Scholar] [CrossRef]
  125. Rowntree, J.C.; Mosher, D.V. Jabiluka Uranium Deposits. In Economic Geology of Australia and Papua New Guinea. 1. Metals; Knight, C.L., Ed.; Monograph Series No. 5; Australasian Institute of Mining and Metallurgy: Carlton, Australia, 1975; pp. 321–326. [Google Scholar]
  126. Annesley, I.; Mercadier, J.; McKechnie, C.; Millar, R.; Cuney, M. Carbon-sulfur-metal-rich graphitic pelitic gneisses from the Fraser Lakes Zone B deposit area, Saskatchewan, Canada: Implications for metal source(s). In Proceedings of the 13th Biennial SGA Meeting, Nancy, France, 24–27 August 2015; Volume 5, pp. 1769–1772. [Google Scholar]
  127. Annesley, I.; Madore, C.; Stanley, C. Leucogranites and pegmatites of the sub-Athabasca basement, Saskatchewan: U protore. In Mineral Deposits: Processes to Processing; Stanley, C.J., Ed.; Balkema: Rotterdam, The Netherlands, 1999; pp. 297–300. [Google Scholar]
  128. Madore, C.; Annesley, I.; Wheatley, K. Petrogenesis, age, and uranium fertility of peraluminous leucogranites and pegmatites of the McClean Lake/Sue and Key Lake/P-Patch deposit areas. In Proceedings of the Geo Canada 2000, The Millennium Geoscience Summit, Saskatchewan, SK, Canada, 29 May 2000; Volume 25. [Google Scholar]
  129. Kyser, K.; Hiatt, E.; Renac, C.; Durocher, K.; Holk, G.; Deckart, K. Diagenetic fluids in Paleo-and Meso-Proterozoic sedimentary basins and their implications for long protracted fluid histories. Mineral. Assoc. Can. Short Course 2000, 28, 225–262. [Google Scholar]
  130. Raffensperger, J.; Garven, G. The formation of unconformity-type uranium ore deposits 1. Coupled groundwater flow and heat transport modeling. Am. J. Sci. 1995, 295, 581–636. [Google Scholar] [CrossRef]
  131. Raffensperger, J.; Garven, G. The formation of unconformity-type uranium ore deposits 2. Coupled hydrochemical modeling. Am. J. Sci. 1995, 295, 639–696. [Google Scholar] [CrossRef]
  132. Ferenczi, P.A.; Sweet, I.P. Mount Evelyn, Northern Territory: Explanatory Notes, 2nd ed.; 1:250 000 Geological Map Series; Northern Territory Geological Survey: Darwin, Australia, 2005; ISBN 978-0-7245-7095-9.
  133. Oliver, N.; McLellan, J.; Hobbs, B.; Cleverley, J.; Ord, A. 100th Anniversary Special Paper: Numerical Models of Extensional Deformation, Heat Transfer, and Fluid Flow across Basement-Cover Interfaces during Basin-Related Mineralization. Econ. Geol. 2006, 101, 1–31. [Google Scholar] [CrossRef]
  134. Fehn, U.; Cathles, L.M.; Holland, H.D. Hydrothermal convection and uranium deposits in abnormally radioactive pluton. Econ. Geol. 1978, 73, 1556–1566. [Google Scholar] [CrossRef]
  135. Schaubs, P.M.; Ord, A.; Hobbs, B.E.; Annesley, I.R.; Madore, C.; Quirt, D.; Fox, N.P.G.; Thomas, D.; Portella, P. Some thermal considerations for the formation of unconformity related uranium deposits of the Athabasca basin, Canada, based on numerical models. In Proceedings of the GAC-MAC Joint Annual meeting; CSIRO Exploration and Mining, Kensington, Saskatoon, SK, Canada, 27 May 2002; p. 105. [Google Scholar]
  136. Mercadier, J.; Annesley, I.R.; Verran, D.; Pascal, M. New U–Pb Ages and Geochemistry from the Wheeler River Uranium Deposits, Athabasca Basin, Canada. In Proceedings of the International Symposium on Uranium Raw Material for the Nuclear Fuel Cycle: Book of Abstracts and Extended Abstracts Exploration, Mining, Production, Supply and Demand, Economics and Environmental Issues, Vienna, Austria, 25–29 June 2018; p. 506. [Google Scholar]
  137. Derome, D.; Cathelineau, M.; Fabre, C.; Boiron, M.-C.; Banks, D.; Lhomme, T.; Cuney, M. Paleo-fluid composition determined from individual fluid inclusions by Raman and LIBS: Application to mid-proterozoic evaporitic Na–Ca brines (Alligator Rivers Uranium Field, northern territories Australia). Chem. Geol. 2007, 237, 240–254. [Google Scholar] [CrossRef]
  138. Chi, G.; Chu, H.; Petts, D.; Potter, E.; Jackson, S.; Williams-Jones, A. Uranium-rich diagenetic fluids provide the key to unconformity-related uranium mineralization in the Athabasca Basin. Sci. Rep. 2019, 9, 5530. [Google Scholar] [CrossRef]
  139. Yeo, G.; Potter, E. Reducing mechanisms potentially involved in formation of Athabasca Basin uranium deposits: Relevance to exploration. In Proceedings of the Saskatchewan Geological Survey Open House 2010 Conference Presentation, Saskatoon, SK, Canada, 29 November 2010. [Google Scholar]
  140. Dargent, M.; Truche, L.; Dubessy, J.; Bessaque, G.; Marmier, H. Reduction kinetics of aqueous U(VI) in acidic chloride brines to uraninite by methane, hydrogen or C-graphite under hydrothermal conditions: Implications for the genesis of unconformity-related uranium ore deposits. Geochim. Cosmochim. Acta 2015, 167, 11–26. [Google Scholar] [CrossRef]
  141. Bonham-Carter, G.; Agterberg, F.P.; Wright, D.F. Weights of evidence modelling: A new approach to mapping mineral potential. In Statistical Applications in the Earth Sciences; Agterberg, F.P., Bonham-Carter, G.F., Eds.; Geological Survey of Canada: Ottawa, ON, Canada, 1990; pp. 171–183. [Google Scholar]
  142. Bonham-Carter, G. Geographic Information Systems for Geoscientists: Modelling with GIS; Elsevier: Pergamon, UK, 1994; ISBN 978-0-08-041867-4. [Google Scholar]
  143. Brown, W.M.; Gedeon, T.D.; Groves, D.I.; Barnes, R.G. Artificial neural networks: A new method for mineral prospectivity mapping. Aust. J. Earth Sci. 2000, 47, 757–770. [Google Scholar] [CrossRef]
  144. Porwal, A.; Carranza, E.J.M.; Hale, M. Artificial Neural Networks for Mineral-Potential Mapping: A Case Study from Aravalli Province, Western India. Nat. Resour. Res. 2003, 12, 155–171. [Google Scholar] [CrossRef]
  145. Moon, W.M. Integration and fusion of geological exploration data: A theoretical review of fuzzy logic approach. Geosci. J. 1998, 2, 175–183. [Google Scholar] [CrossRef]
  146. Carranza, E.J. Handbook of Exploration and Environmental Geochemistry. In Geochemical Anomaly and Mineral Prospectivity Mapping in GIS; Elsevier: Amsterdam, The Netherlands, 2008; Volume 11, ISBN 978-0-444-51325-0. [Google Scholar]
  147. Chudasama, B.; Porwal, A.; Kreuzer, O.P.; Butera, K. Geology, geodynamics and orogenic gold prospectivity modelling of the Paleoproterozoic Kumasi Basin, Ghana, West Africa. Ore Geol. Rev. 2016, 78, 692–711. [Google Scholar] [CrossRef]
  148. Cheng, Q.; Agterberg, F.P. Fuzzy Weights of Evidence Method and Its Application in Mineral Potential Mapping. Nat. Resour. Res. 1999, 8, 27–35. [Google Scholar] [CrossRef]
  149. Porwal, A.; Carranza, E.J.M.; Hale, M. A Hybrid Neuro-Fuzzy Model for Mineral Potential Mapping. Math. Geol. 2004, 36, 803–826. [Google Scholar] [CrossRef]
  150. Thomas, D. EXTECH IV: Geology and Uranium EXploration TECHnology of the Proterozoic Athabasca Basin, Saskatchewan and Alberta.: Jefferson, C.W., Delaney, G., Eds. Geological Survey of Canada Bulletin 588, Saskatchewan Geological Society Special Publication 18, and Mineral Deposits Division of the Geological Association of Canada Special Publication 4. 645 Pp. 2007. Report and CD-ROM. ISBN 978-0-660-19492-9. Econ. Geol. 2007, 102, 645. [Google Scholar] [CrossRef]
  151. Raymond, O.L.; Liu, S.; Gallagher, R.; Highet, L.M.; Zhang, W. Surface Geology of Australia, 1:1 000 000 Scale, 2012 ed.; (Digital Dataset); Geoscience Australia: Canberra, Australia, 2012.
  152. Wyborn, L.A.I.; Ratajkoski, M.; Thost, D. ON47 Pine Creek Metallogenic GIS Package 1:500 000 Scale; Geoscience Australia: Canberra, Australia, 1998.
  153. Nakamura, A. Isostatic Residual Gravity Anomaly Grid of Onshore Australia. ASEG Ext. Abstr. 2016, 2010, 1–4. [Google Scholar] [CrossRef] [Green Version]
  154. Nakamura, A.; Milligan, P.R. Total Magnetic Intensity (TMI) Grid of Australia, 6th ed.; Geoscience Australia: Canberra, Australia, 2015.
  155. Saskatchewan Geological Survey. 250K Bedrock Geology of Saskatchewan Merged from 1:250,000 Scale Bedrock Mapping Compilation Series. CSRS NAD83 Zone 13. Available online: https://gisappl.saskatchewan.ca/Html5Ext/index.html?viewer=GeoAtlas (accessed on 15 February 2017).
  156. Saskatchewan Geological Survey. Athabasca_Conductors_Air. Available online: https://gisappl.saskatchewan.ca/Html5Ext/index.html?viewer=GeoAtlas (accessed on 15 February 2017).
  157. Saskatchewan Geological Survey. Athabasca_Conductors_Ground. Available online: https://gisappl.saskatchewan.ca/Html5Ext/index.html?viewer=GeoAtlas (accessed on 15 February 2017).
  158. Saskatchewan Geological Survey. 250k_Faults Merged from 1:250,000 Scale Bedrock Mapping Compilation Series, CSRS NAD83 Zone 13. Available online: https://gisappl.saskatchewan.ca/Html5Ext/index.html?viewer=GeoAtlas (accessed on 15 February 2017).
  159. Saskatchewan Geological Survey. Magnetic Domains of Saskatchewan. CSRS NAD83 Zone 13. Available online: https://gisappl.saskatchewan.ca/Html5Ext/index.html?viewer=GeoAtlas (accessed on 15 February 2017).
  160. Geological Survey of Canada. Airborne Gravity-Isostatic Residual-Grid Spacing: 2 km. Available online: https://gisappl.saskatchewan.ca/Html5Ext/index.html?viewer=GeoAtlas (accessed on 15 February 2017).
  161. Geological Survey of Canada. Northern Saskatchewan 100 m MAG-Residual Total Field. GSC Open File 7039 SMER Open File 2011-58. Available online: https://gisappl.saskatchewan.ca/Html5Ext/index.html?viewer=GeoAtlas (accessed on 15 February 2017).
  162. Debeglia, N.; Martelet, G.; Perrin, J.; Truffert, C.; Ledru, P.; Tourlière, B. Semi-automated structural analysis of high resolution magnetic and gamma-ray spectrometry airborne surveys. J. Appl. Geophys. 2005, 58, 13–28. [Google Scholar] [CrossRef]
  163. Kovesi, P. Image Features from Phase Congruency. Videre J. Comput. Vis. Res. 1999, 1, 1–26. [Google Scholar]
  164. Garrison, J., Jr.; Pearn, W.; Von Rosenberg, D. The Fractal Nature of Geological Data Sets: Power Law Processes Everywhere! In Proceedings of the SPE Annual Technical Conference and Exhibition, Society of Petroleum Engineers. Denver, CO, USA, 6–9 October 1991. [Google Scholar]
  165. Turcotte, D.L. Fractals and Chaos in Geology and Geophysics; Cambridge University Press: Cambridge, UK, 1997. [Google Scholar]
  166. Vos, I.M.A.; Bierlein, F.P.C.; Murphy, B.; Barlow, M. The mineral potential of major fault systems: Case studies from northeastern Queensland, Australia. In Proceedings of the Predictive Mineral Discovery Cooperative Research Centre “Focus on Science” Conference, Canberra, Australia, 1–3 June 2004; Barnicoat, A.C., Korsch, R.J., Eds.; Geoscience Australia: Canberra, Australia, 2004; Volume 9, pp. 209–212. [Google Scholar]
  167. Cox, S.F. Coupling between Deformation, Fluid Pressures, and Fluid Flow in Ore-Producing Hydrothermal Systems at Depth in the Crust. In One Hundredth Anniversary Volume; Society of Economic Geologists: Littleton, CO, USA, 2005; ISBN 978-1-887483-01-8. [Google Scholar]
  168. Agterberg, F.P.; Bonham-Carter, G.F.; Cheng, Q.; Wright, D.F. Weights of evidence modeling and weighted logistic regression for mineral potential mapping. In Computers in Geology-25 Years of Progress; Oxford University Press, Inc.: New York, NY, USA, 1993; pp. 13–32. ISBN 978-0-19-508593-8. [Google Scholar]
  169. Porwal, A.; Carranza, E.J.M.; Hale, M. Extended Weights-of-Evidence Modelling for Predictive Mapping of Base Metal Deposit Potential in Aravalli Province, Western India. Explor. Min. Geol. 2001, 10, 273–287. [Google Scholar] [CrossRef]
  170. Agterberg, F.; Cheng, Q. Conditional Independence Test for Weights-of-Evidence Modeling. Nat. Resour. Res. 2002, 11, 249–255. [Google Scholar] [CrossRef]
  171. Sawatzky, D.L.; Raines, G.L.; Bonham-Carter, G.F.; Looney, C.G. Spatial Data Modeller (SDM): ArcMAP 9.3 Geoprocessing Tools for Spatial Data Modelling Using Weights of Evidence, Logistic Regression, Fuzzy Logic and Neural Networks. Available online: https://github.com/gtkfi/ArcSDM/ (accessed on 21 August 2020).
  172. Zadeh, L.A. Fuzzy sets. Inf. Control 1965, 8, 338–353. [Google Scholar] [CrossRef] [Green Version]
  173. Vearncombe, J.; Vearncombe, S. The spatial distribution of mineralization; applications of Fry analysis. Econ. Geol. 1999, 94, 475–486. [Google Scholar] [CrossRef]
  174. Kreuzer, O.P.; Blenkinsop, T.G.; Morrison, R.J.; Peters, S.G. Ore controls in the Charters Towers goldfield, NE Australia: Constraints from geological, geophysical and numerical analyses. Ore Geol. Rev. 2007, 32, 37–80. [Google Scholar] [CrossRef]
  175. Keevil, M. Patterson Lake discovery triggers junior uranium frenzy. In The Northern Miner Magazine; The Northern Miner: Toronto, ON, Canada, 2013; Volume 99. [Google Scholar]
  176. Hronsky, J.M.A.; Groves, D.I. Science of targeting: Definition, strategies, targeting and performance measurement. Aust. J. Earth Sci. 2008, 55, 3–12. [Google Scholar] [CrossRef] [Green Version]
  177. Hollis, J.A.; Glass, L.M. Howship and Oenpelli, Northern Territory. 1:100 000 Geological Map Series Explanatory Notes, 5572, 5573; Northern Territory Geological Survey: Northern Territory, Australia, 2012; p. 122. ISBN 978-0-7245-7219-9.
  178. Cuney, M.; Brouand, M.; Cathelineau, M.; Derome, D.; Freiberger, R.; Hecht, L.; Kister, P.; Lobaev, V.; Lorilleux, G.; Peiffert, C.; et al. What parameters control the high-grade-large tonnage of Proterozoic unconformity related uranium deposits? In Proceedings of the International Conference on Uranium Geochemistry, Nancy, France, 13–16 April 2003; pp. 123–126. [Google Scholar]
  179. Hronsky, J.M.A.; Kreuzer, O.P. Applying spatial prospectivity mapping to exploration targeting: Fundamental practical issues and suggested solutions for the future. Ore Geol. Rev. 2019, 107, 647–653. [Google Scholar] [CrossRef]
  180. Lesher, M.; Hannington, M.; Galley, A.; Ansdell, K.; Astic, T.; Banerjee, N.; Beauchamp, S.; Beaudoin, G.; Bertelli, M.; Bérubé, C.; et al. Integrated Multi-Parameter Exploration Footprints of the Canadian Malartic Disseminated Au, McArthur River-Millennium Unconformity U, and Highland Valley Porphyry Cu Deposits: Preliminary Results from the NSERC-CMIC Mineral Exploration Footprints Research Network. In Proceedings of Exploration 17: Sixth Decennial International Conference on Mineral Exploration; Tschirhart, V., Thomas, M.D., Eds.; DMEC: Toronto, ON, Canada, 2017; pp. 325–347. [Google Scholar]
  181. Brooks, F.P. The computer scientist as toolsmith II. Commun. Acm 1996, 39, 61–68. [Google Scholar] [CrossRef]
  182. Wright, D.; Potter, E.; Comeau, J.-S. Athabasca Basin Uranium Geochemistry Database v. 2; Natural Resources Canada: Ottawa, ON, Canada, 2015.
Figure 1. Proterozoic basins of the world. Undeformed or weakly deformed Paleo- and Mesoproterozoic intracratonic sedimentary basins are differentiated from tectonised Proterozoic metasedimentary strata in each of the insert maps. (a) Generalised global distribution of Proterozoic (meta-) sedimentary rocks. Regions hosting significant unconformity-type uranium deposits are indicated by numbered ellipses. 1: Athabasca Basin, Canada; 2: Thelon Basin, Canada, 3: Otish, Basin, Canada; 4: Pasha-Ladoga Basin, Russia, 5: Cuddapah Basin, India, 6: McArthur Basin/Pine Creek Inlier, Australia; 7: Rudall Complex, Australia. (b) Paleo- to Mesoproterozoic basins of the western Canadian Shield that contain significant unconformity-type uranium deposits, or that have the potential to host them. HB = Hornby Bay Basin, Elu = Elu Basin, Th = Thelon Basin, BL = Baxter Lake Basin, Ath = Athabasca Basin. (c) Meso- to Neoproterozoic intracratonic basins in India with potential to host unconformity-type uranium deposits. The Cuddapah Basin, straddling the border of Telangana and Andhra Pradesh states hosts several relatively small unconformity-type uranium deposits. Ma = Marwar Basin, Del = Delhi Basin, Vin = Vindhyan Basin, Sin = Singhbhum Basin, Ch = Chattisgarh Basin, Pa = Pakhal Basin, Ind = Indravati Basin, Ka = Kaladgi Basin, Bh = Bhima Basin, Cud = Cuddapah Basin. (d) The middle Paleoproterozoic Otish Basin in the Superior geological province of Quebec, Canada is host to the Camie River and Matoush uranium deposits. Sa = Sakami Basin, Ot = Otish Basin, Mi = Mistassini Basin. (e) The Paleo- to Mesoproterozoic McArthur Basin and adjacent exposed Paleoproterozoic Pine Creek Inlier in the Northern Territory, Australia is host to several large unconformity-type uranium deposits, including the Ranger mine. The interpreted Greater McArthur Basin is shown with a dashed line. PC = Pine Creek Inlier, Kim = Kimberley Basin, GMB = Greater McArthur Basin (extent indicated by dashed line), Bir = Birrindudu Basin, SN = South Nicholson Basin. Spatial data sources: Generalized Geology of the World [17]; Geological Map of Canada [18]; Geological Map of South America 1:5 million [19]; Database of the Geologic Map of North America [20]; EGDI 1 million-scale surface geology [21], India Geology 1:2 million scale [22], Geological Regions of Australia, 1:5 million scale [23], South Australian Solid Geology [24].
Minerals 10 00738 g001
Figure 2. Unconformity elevation contours—Greater McArthur Basin. Contours indicate the elevation of the unconformity below the ‘Redbank package’, which includes the Paleoproterozoic Kombolgie Subgroup near its base. Unconformity elevation data sourced from the Northern Territory Geological Survey (2015). The NW McArthur Basin mineral potential modelling (MPM) study area (black outline) includes the Alligator Rivers, South Alligator Valley and Rum Jungle uranium fields. The red dashed line (W-E) marks the approximate trace of the cross section shown in Figure 4a.
Minerals 10 00738 g002
Figure 3. Unconformity elevation contours—Athabasca Basin. Contours indicate the elevation of the unconformity at the base of the late Paleoproterozoic to Mesoproterozoic Athabasca Group. The unconformity isosurface was interpolated from historical drill-hole data. The Athabasca Basin MPM study area is indicated by the dark black outline. The red dashed line (NW-SE) marks the trace of the cross section shown in Figure 4b.
Minerals 10 00738 g003
Figure 4. (a) Schematic diagram showing the position of major uranium deposits in the Pine Creek Inlier in relation to the Proterozoic unconformity. Igneous rocks other than basement units have been omitted. Approximate line of section is shown as W-E in Figure 2. Modified from Jaireth et al. [74], after McKay and Miezitis [75]. (b) Lithostratigraphic cross-section of the Athabasca Basin. Line of section is shown as NW-SE in Figure 3. Modified from Jefferson et al. [1], after Ramaekers [76] and Ramaekers et al. [77].
Minerals 10 00738 g004
Figure 5. Geological interpretation overlaid on magnetic data—Alligator Rivers Uranium Field. An area of subdued magnetic response corresponds to the Archean Nanambu Complex, adjacent to the Ranger mine and Jabiluka uranium deposit. An elongated, N-S trending zone of similarly uniform low magnetic response further west is interpreted [114] as an undercover extension of the Nanambu Complex. Geochronological analysis has also confirmed the presence of Archean basement rocks in the vicinity of the Nabarlek and Caramal uranium deposits. Several conspicuous areas of the uniform negative magnetic response, bounded by high amplitude curvilinear anomalies in the eastern part of the image are attributed to subhorizontal sheets of Oenpelli Dolerite. The lozenge-shaped sills are surrounded by a disorderly array of high amplitude magnetic anomalies that are interpreted as partially preserved outcrops of dolerite. Numerous linear dykes with long strike-lengths are evident in the southeast and diagonally cross-cutting the image.
Minerals 10 00738 g005
Figure 6. Combining evidential layers with raster maths. Weights assigned to predictor map features are converted into pixel values during rasterisation. A variety of integrating functions can then be used to combine the rasterised evidential layers. This commonly involves performing mathematical operations between geographically aligned pixels, resulting in a numerical grid of values that represent relative prospectivity.
Minerals 10 00738 g006
Figure 7. Examples of geophysical edges derived from isostatic residual gravity data using different wavelength filters. The high frequency output from the 1600 m filter is interpreted to represent upper crustal gravity features. The broad features delineated by the 6400 m filter are interpreted as deep crustal structures and potential conduits for deeply circulating brines.
Minerals 10 00738 g007
Figure 8. NW McArthur Basin predictors viewed looking north: (a) Simplified lithology, (b) simplified stratigraphy, (c) metamorphic regions, (d) Archean buffered, (e) gravity edges 6400 buffered, (f) faults WNW buffered, (g) faults NW buffered, (h) faults NNW buffered, (i) faults NNE buffered, (j) faults NE buffered, (k) faults ENE buffered, (l) gravity edges 1600 NNE buffered, (m) gravity edges 1600 NE buffered, (n) magnetic 1600 edge density and (o) unconformity buffered.
Minerals 10 00738 g008
Figure 9. Athabasca Basin predictors: (a) solid geology, (b) magnetic domains, (c) gravity edges 6400 WNW buffered, (d) gravity edges 6400 NW buffered, (e) gravity edges 6400 NNW buffered, (f) gravity edges 6400 NNE buffered, (g) gravity edges 6400 NE buffered, (h) gravity edges 6400 ENE buffered, (i) magnetics 1600 edge density, (j) conductors—air, (k) conductors—ground, (l) Extech IV faults, (m) faults WNW buffered, (n) faults NW buffered, (o) faults NNW buffered, (p) faults NNE buffered, (q) faults NE buffered, (r) faults ENE buffered, (s) gravity edges 1600 WNW buffered, (t) gravity edges 1600 NW buffered, (u) gravity edges 1600 NE buffered, (v) gravity edges 1600 NNE buffered and (w) gravity edges 1600 ENE buffered.
Minerals 10 00738 g009aMinerals 10 00738 g009b
Figure 10. NW McArthur Basin inference network. Predictor maps are grouped and shaded according to their recognition criteria class. Fuzzy logic operators are used to combine weighted and rasterised predictors via a series of intermediate steps to produce the final fuzzy logic favourability map.
Minerals 10 00738 g010
Figure 11. Athabasca Basin inference network. Predictor maps are grouped and shaded on the basis of recognition criteria class. Fuzzy logic operators are used to combine weighted and rasterised predictors via a series of intermediate steps to produce the final fuzzy logic favourability map.
Minerals 10 00738 g011
Figure 12. Final output from the NW McArthur Basin fuzzy logic mineral potential modelling for unconformity-type uranium. Warmer colours (orange to red) represent elevated prospectivity. The locations of significant unconformity-related uranium deposits are shown by black circles and the generalised extent of the Rum Jungle, Alligator Rivers and South Alligator Rivers uranium fields are outlined with red dashed lines. Due to the proprietary nature of the study, only results from areas within National Parks and mining leases are shown.
Minerals 10 00738 g012
Figure 13. Final output from the Athabasca Basin fuzzy logic mineral potential modelling for unconformity-type uranium. Warmer colours (orange to red) represent elevated prospectivity. The locations of significant unconformity-related uranium deposits are shown by black circles. Due to the proprietary nature of the study, only results from areas covered by active mineral dispositions are shown.
Minerals 10 00738 g013
Figure 14. South Alligator Rivers Uranium Field MPM result. Note that the colour scale has been recalibrated relative to the previous figures.
Minerals 10 00738 g014
Table 1. Major unconformity-type uranium deposits of the Athabasca Basin (AB), Saskatchewan, Canada and Alligator Rivers (ARUF) and South Alligator Valley (SAVUF) uranium fields, NW McArthur Basin, Northern Territory, Australia. Sources: [2] (Annex Table 2.1), [25,26,27,28].
ProvinceDeposit NameDominant SettingLatitudeLongitudeDiscovery Yeart U3O8% U3O8Associated Metals
ABCigar Lake 58.071−104.5391981158,44015.65Co, Cu, Ni, Pb, Zn
Key Lake57.202−105.666197582,7103.07As, Cu, Pb, Zn
Shea Creek58.236−109.512199443,5191.47Au, Co, Cu, Mo, Ni, Pb, Te, V, Cs
Phoenix57.51−105.381200932,16019.23Ni, Co, As, Pb, Cu, REEs, Au
Roughrider-J-Zone58.338−104.05200832,1114.75Ni, Co, As, Pb, Cu, REEs, Au
Fox Lake57.763−105.221201030,8717.98As, Co, Cu, Ni, Pb, V
Collins Bay58.284−103.628197127,9891.94As, Au, Co, Fe, Gf, Pb
Midwest58.313−104.074197822,3143.55Ag, As, Co, Cu, Ni, Pb
Centennial57.611−107.5722005No DataNo DataNi, Co, As (?)
McArthur RiverU/C, basement57.763−105.0511988306,11116.99Ni, Co, As, Au, REE
Sue58.254−103.813198820,8363.75As, Co, Cu, Pb, V
ArrowBasement57.679−109.2352014138,8454.62Co, Cu, Ni
Eagle Point58.317−103.55198096,8880.61Fe, Cu, Mo, Pb
Triple R57.64−109.362201247,8901.51Co, Cu, Ni
Millennium57.52−105.635200047,5323.76Cu, Ni, Pb
Carswell-Cluff58.369−109.529197031,7301.48Au
Gryphon57.528−105.418201419,5222.3Ni, Co, As, Pb, Cu, REEs, Au
Rabbit Lake58.183−103.717196819,4080.32As, Au, Co, Fe, Gf, Pb
Raven-Horseshoe58.155−103.766197217,1270.46As, Au, Co, Fe, Gf, Pb
Christie Lake57.844−104.874198994753.25Ni, Co, As, Au, REE
ARUFRangerBasement−12.673132.9161969242,6010.27Au
Jabiluka−12.5132.9061971144,4100.48Au
Koongarra−12.867132.842197016,5000.74Au
Nabarlek−12.308133.32197010,8581.81Cu, Au, Pd, Pt
Ranger 68−12.512132.854197653540.36Cu
Caramal−12.5133.233197129270.31Au, Pt
AngularliU/C contact−11.74133.157201188440.88
SAVUFCoronation HillBasement−13.584132.606195318480.54Au, Pd, Pt
El Sherana−13.509132.52119544140.66Au
Table 2. Source data and predictors for the NW McArthur Basin MPM. The listed data are available from the Northern Territory Geological Survey’s ‘Geoscience Exploration and Mining Information System (GEMIS)’, Geoscience Australia’s online Product Catalogue or the Geophysical Archive Data Delivery System (GADDS) on the Australian Government’s Geoscience Portal.
Source DataDerived Predictor MapsDescription
Solid Geology Interp 1:500,000 scale [114]; Surface Geology of Australia 1:1 million scale [151]Simplified lithologyModified and reduced to 13 generalised classes.
Simplified stratigraphyStratigraphic data grouped by Eon
Archean bufferedMapped Archean complexes buffered at 5000 m intervals to 50 km
Unconformity bufferedCurrent unconformity surface trace buffered at 5000 m interval to 50 km
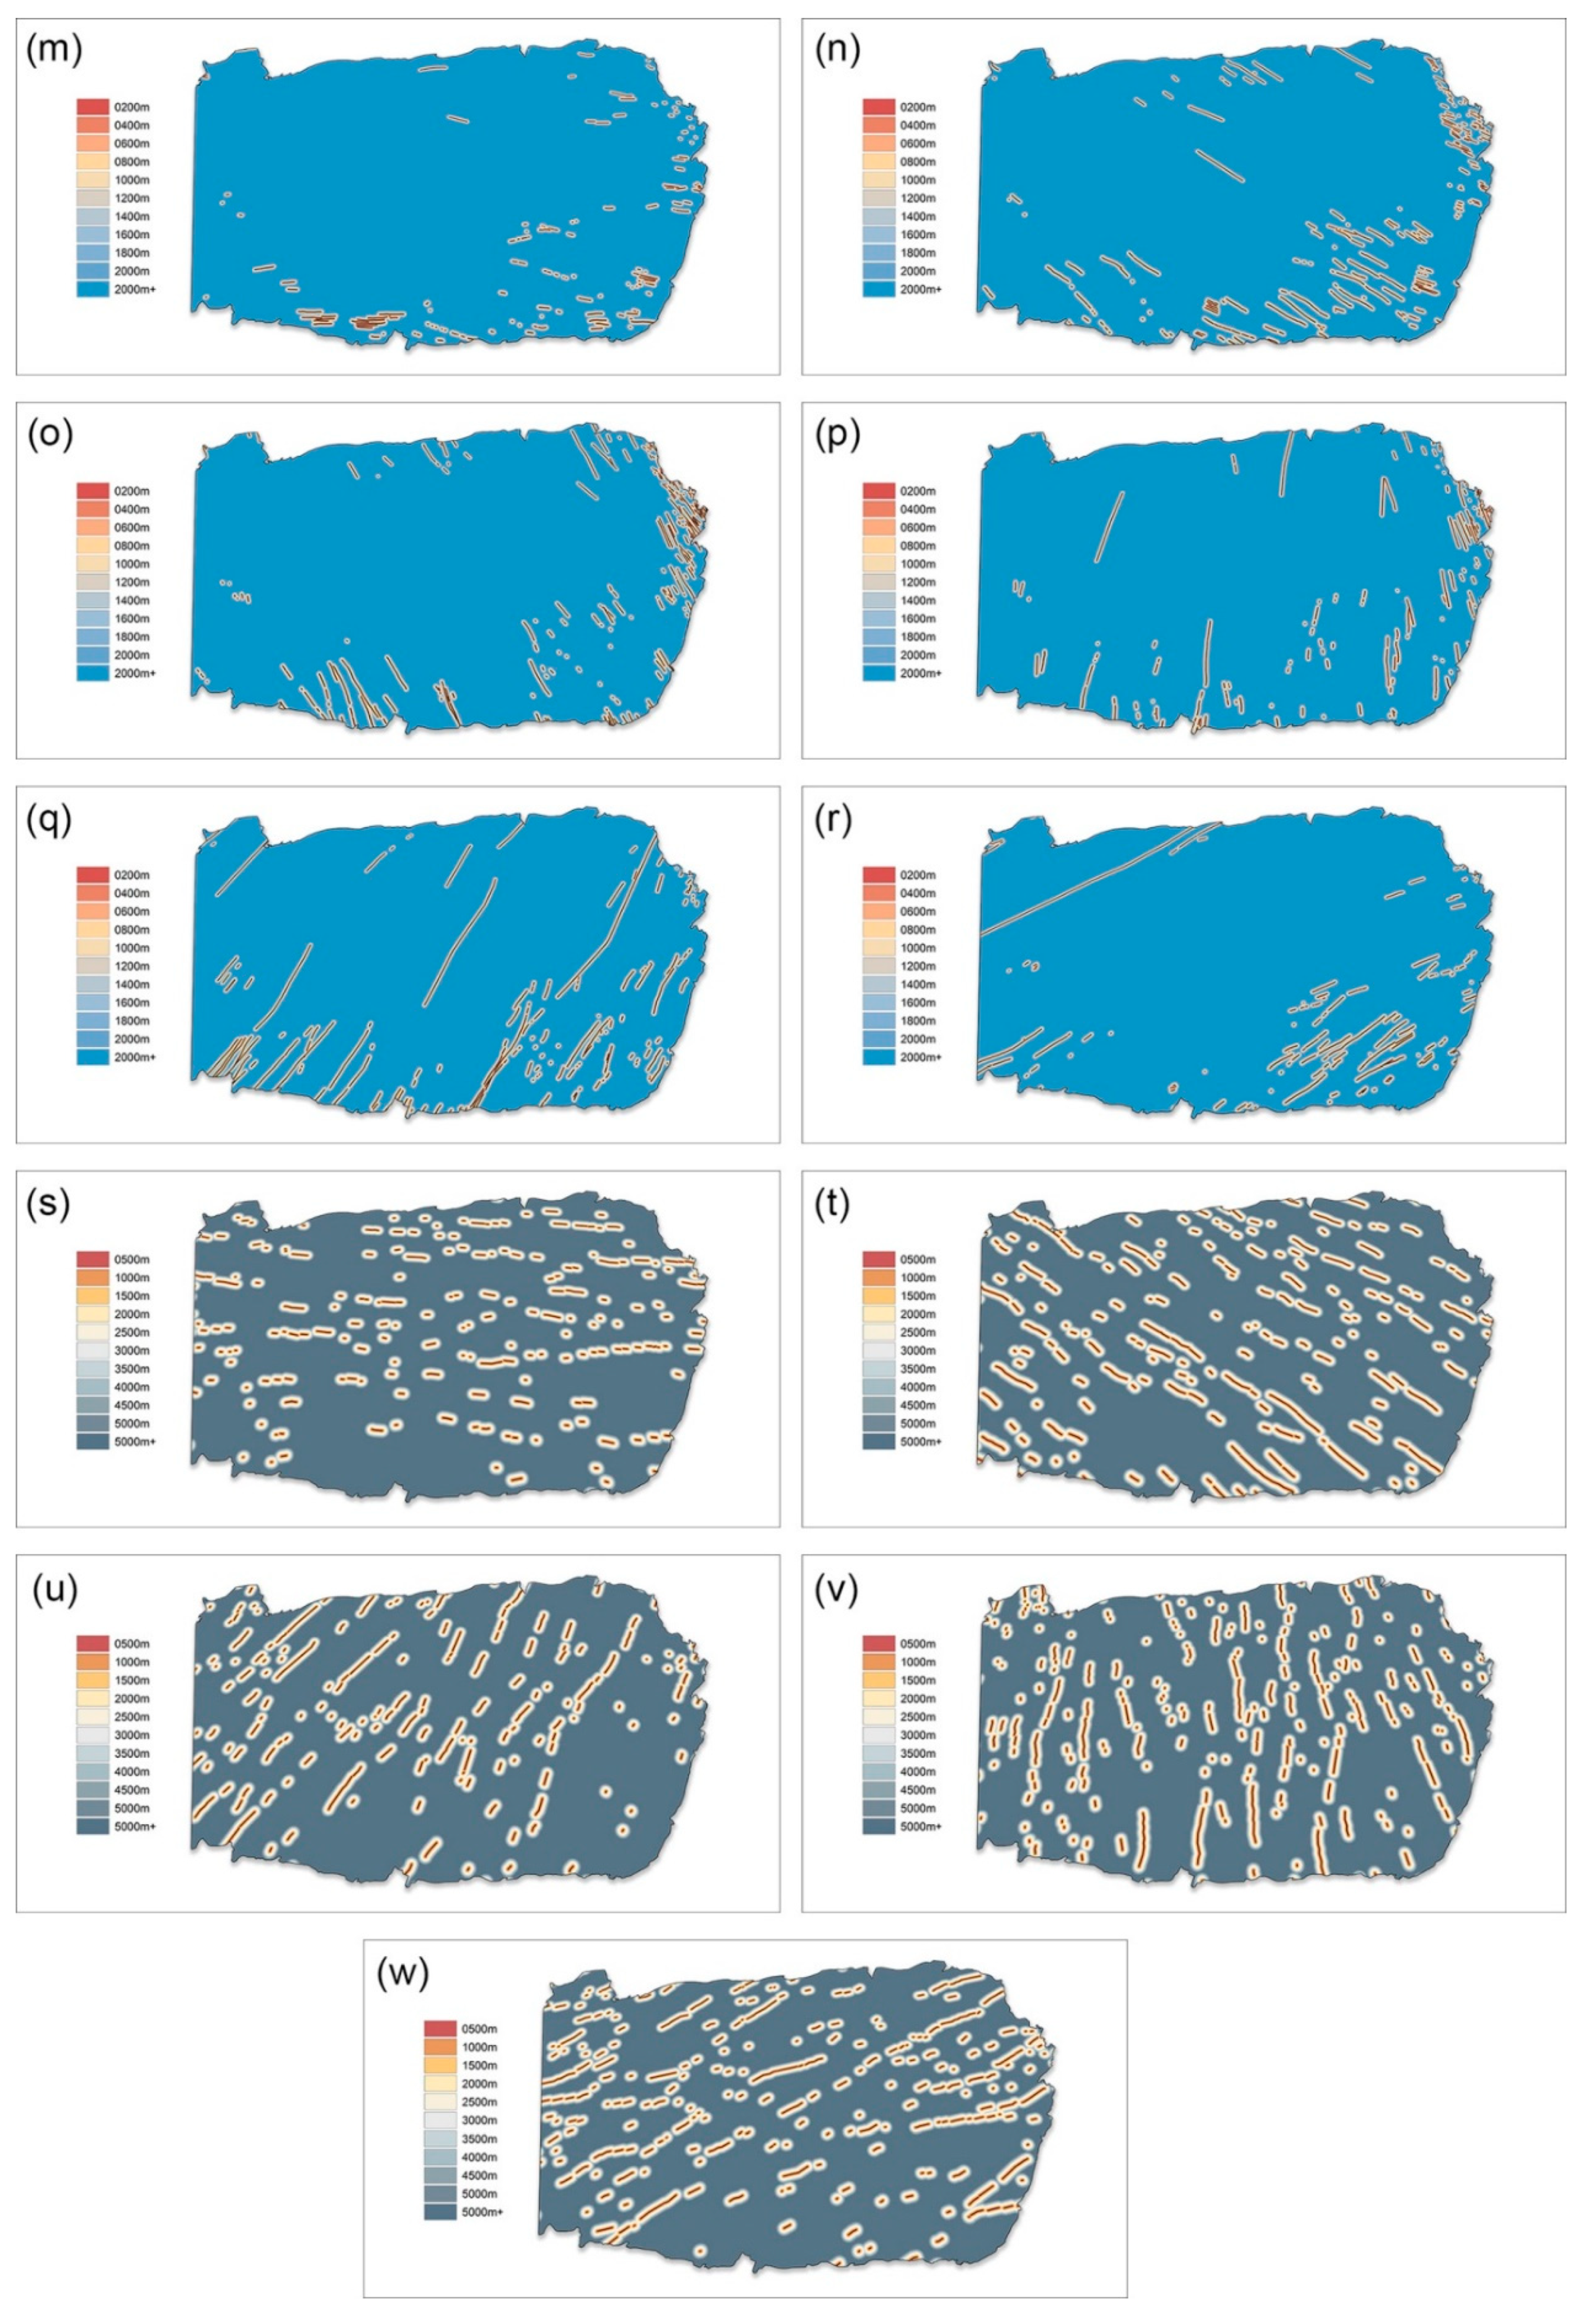
Faults 1:500,000 scale [114]Faults WNW bufferedFaults separated into six orientation classes and buffered at 500 m intervals to 5 km.
Faults NW buffered
Faults NNW buffered
Faults NNE buffered
Faults NE buffered
Faults ENE buffered
Metamorphic/Igneous regions 1:500,000 scale [152]Metamorphic regionsNine classes of metamorphic region
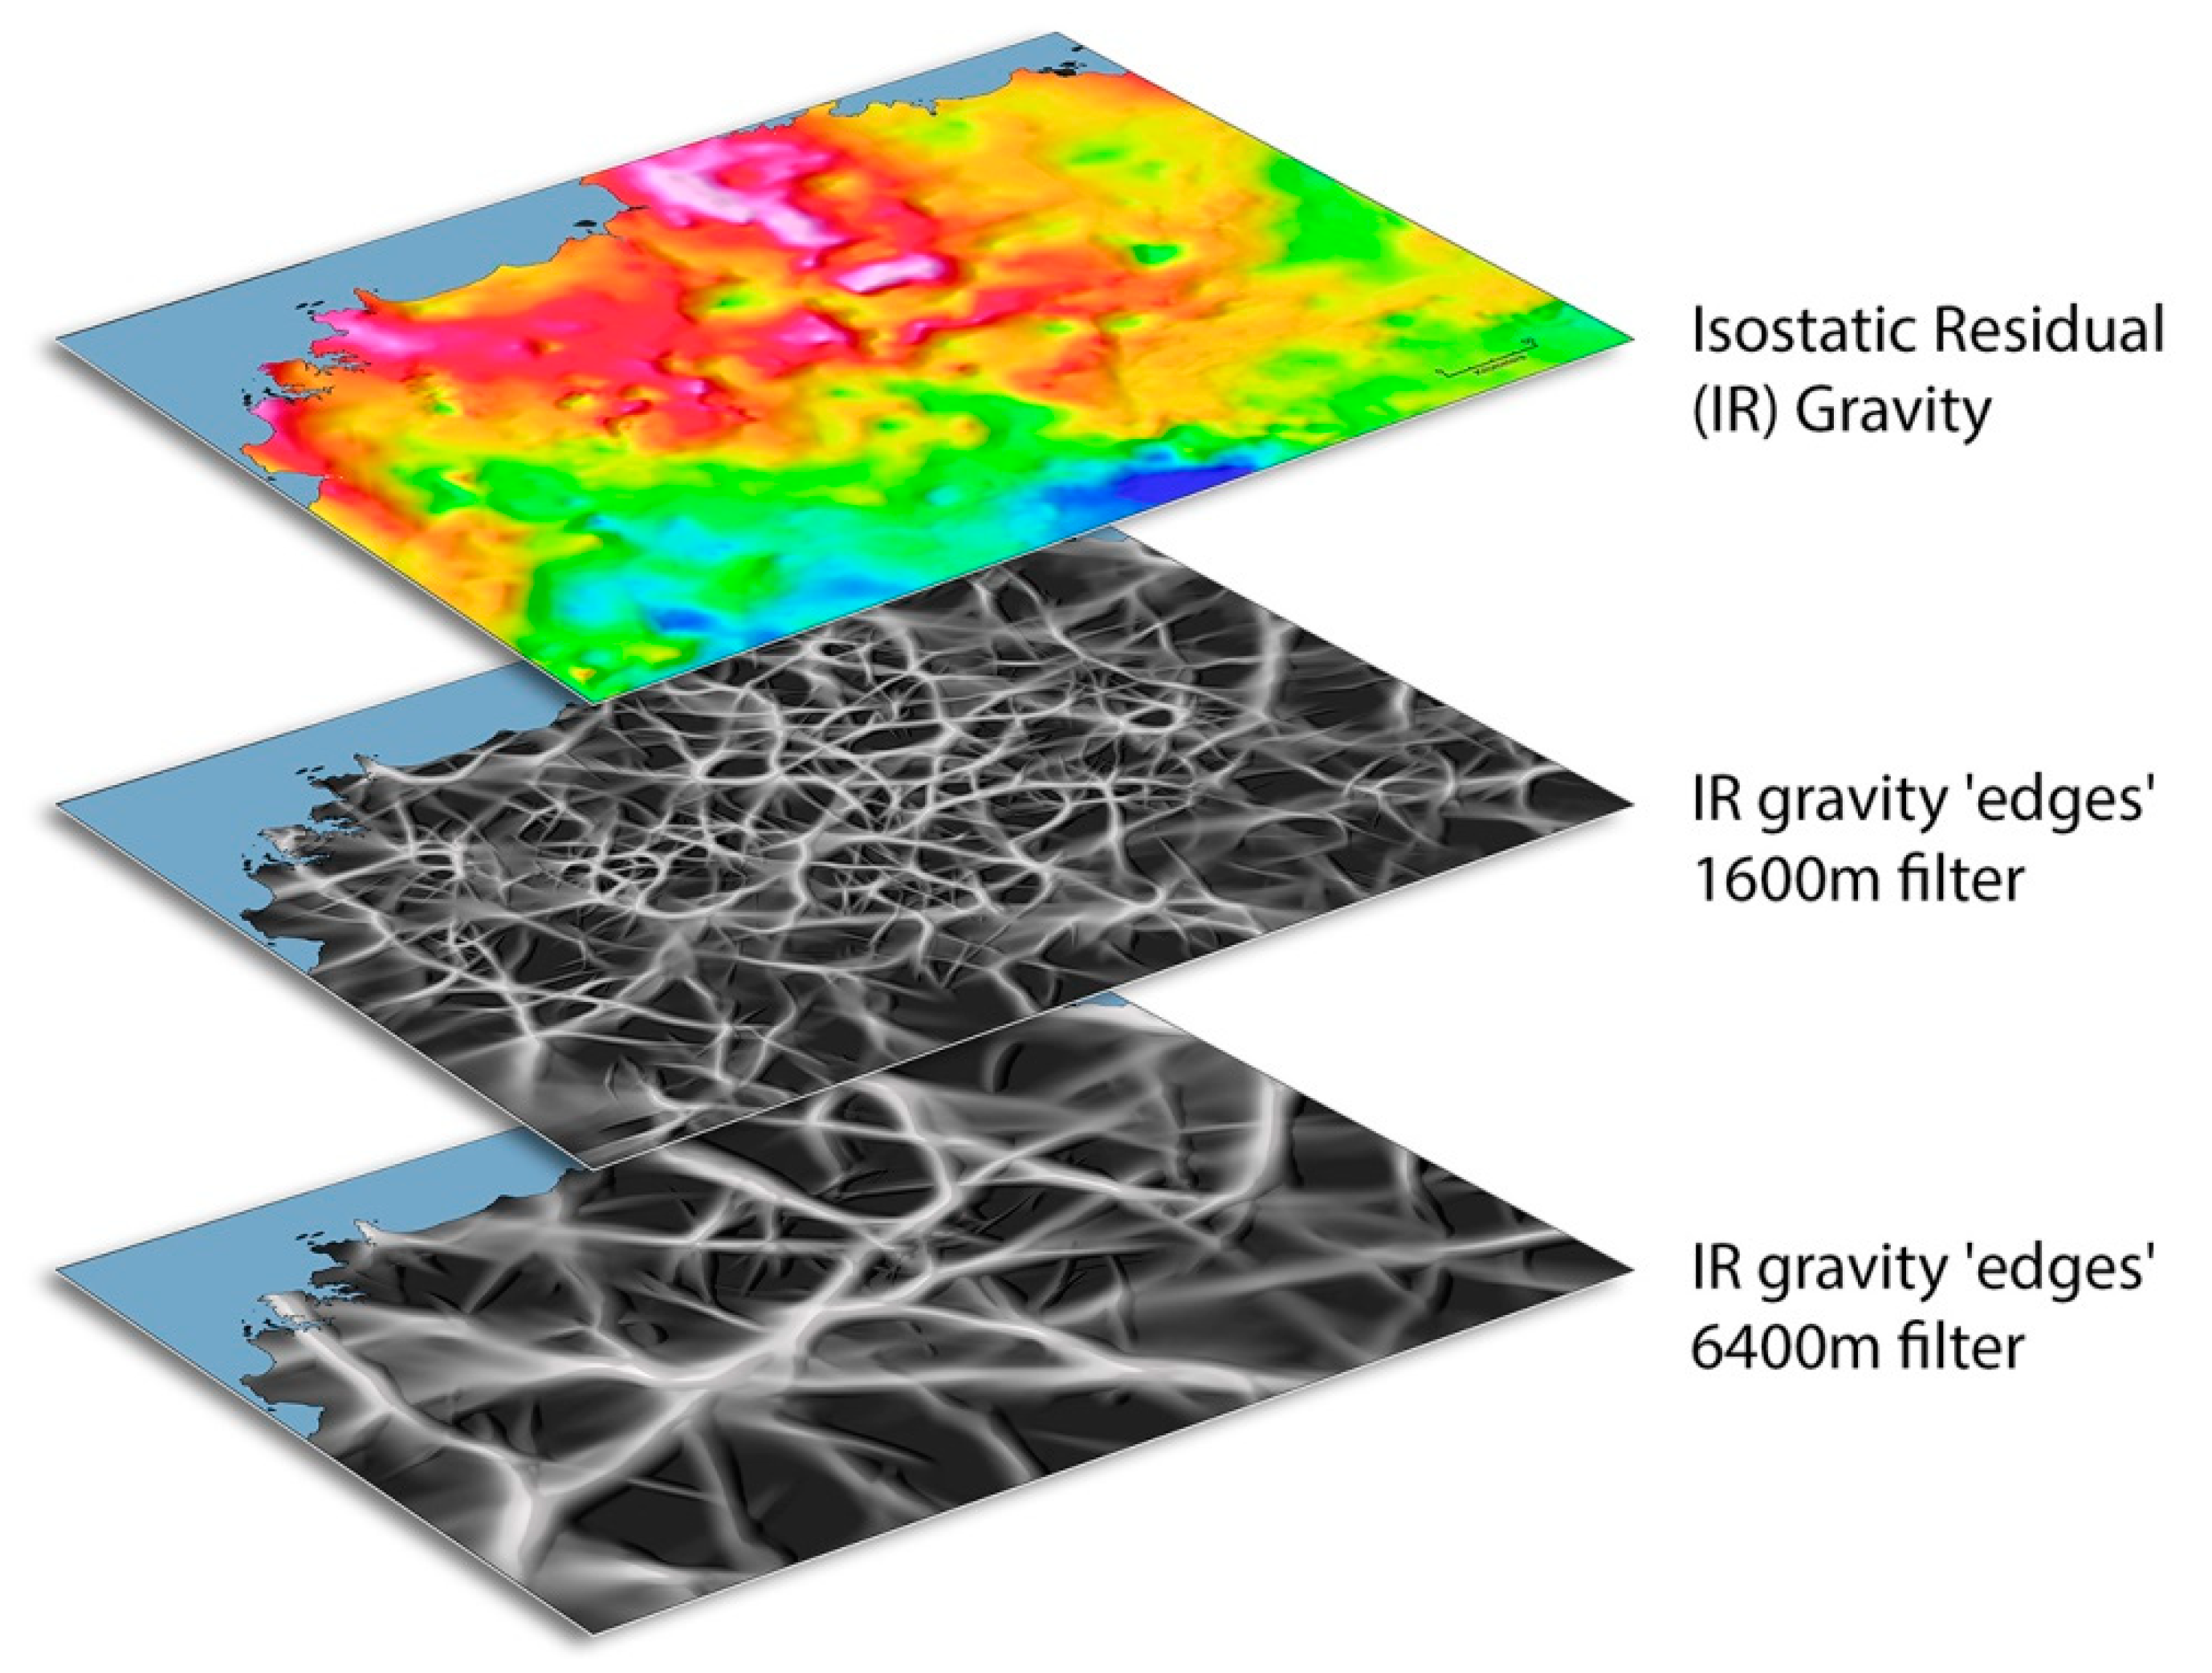
Pine Creek isostatic residual (IR) gravity edges 1600 (Fathom Geophysics Australia—Derived from: [153])Gravity 1600 WNW bufferedThe ‘1600’ filter isolates short wavelength lateral variations in gravity data which may represent structure concealed below cover—Data were split into six orientation classes and buffered at 500 m intervals to 5 km.
Gravity 1600 NW buffered
Gravity 1600 NNW buffered
Gravity 1600 NNE buffered
Gravity 1600 NE buffered
Gravity 1600 ENE buffered
Pine Creek isostatic residual (IR) gravity edges 6400 (Fathom Geophysics Australia—Derived from: [153])Gravity 6400 bufferedThe ‘6400’ filter isolates longer wavelength variations in gravity data. They are used here as proxies for ‘deep’ structural development zones—buffered at 1000 m intervals to 10 km.
Pine Creek Magnetics edges 1600 (Fathom Geophysics Australia—Derived from: [154])Magnetics 1600 edge densityLine density function with a 10 km search radius used on proprietary ‘1600’ edge detection data. Proxy for basement lithological complexity.
Table 3. Source data and predictors for the Athabasca Basin MPM. The data listed above are available from the ‘Geological Atlas of Saskatchewan’ or Natural Resources Canada’s ‘Canadian Airborne Geophysical Data Base’.
Source DataDerived Predictor MapsDescription
Solid Geology 1:250,000 scale [155]Solid geologySolid geology data reduced to 9 generalised classes.
Conductors—air [156]Conductors (air)Air electromagnetic conductors buffered to 50 m.
Conductors—ground [157]Conductors (ground)Ground electromagnetic conductors buffered to 50 m
Faults 1:250,000 scale [158]Faults WNW bufferedFaults separated into six orientation classes and buffered at 200 m intervals to 2 km.
Faults NW buffered
Faults NNW buffered
Faults NNE buffered
Faults NE buffered
Faults ENE buffered
Magnetic Domains [159]Magnetic domainsMag interpretation of 19 Precambrian domains beneath Athabasca Basin.
Extech IV Faults [150]Extech IV faultsBuffered at 2000 m intervals to 20 km. Used to represent large-scale, through-going basement structural development zones.
Canada 2 km isostatic residual (IR) gravity edges 1600 Fathom Geophysics Australia—derived from: [160]Gravity 1600 WNW bufferedThe ‘1600’ filter isolates short wavelength lateral variations in gravity data, which may represent structure concealed below cover—Data split into six orientation classes and buffered at 500 m intervals to 5 km.
Gravity 1600 NW buffered
Gravity 1600 NNW buffered
Gravity 1600 NNE buffered
Gravity 1600 NE buffered
Gravity 1600 ENE buffered
Canada 2 km isostatic residual (IR) gravity edges 6400 Fathom Geophysics Australia—Derived from: [160]Gravity 6400 WNW bufferedThe ‘6400’ filter isolates longer wavelength variations in gravity data. They are used here as proxies for ‘deep’ structural development zones—split into six orientation classes and buffered at 1000 m intervals to 10 km.
Gravity 6400 NW buffered
Gravity 6400 NNW buffered
Gravity 6400 NNE buffered
Gravity 6400 NE buffered
Gravity 6400 ENE buffered
Athabasca Basin 100 m Magnetics edges 1600 Fathom Geophysics Australia—Derived from: [161]Magnetics 1600 edge densityLine density function with a 10 km search radius used on proprietary ‘1600’ edge detection data. Proxy for basement lithological complexity.
Table 4. Calculated weights of evidence for the NW McArthur Basin study. Uranium occurrences as the training set. For multi-class predictors, only features that returned significant contrasts are shown. Where multi-ring buffers have been used around features, the buffer with the highest contrast is shown. W+ = positive weight of evidence, W− = negative weight of evidence. The contrast is the difference between the positive and negative weights. A positive or negative contrast signifies a net positive or net negative spatial association respectively. Higher contrast values are highlighted by warmer coloured (orange to red) shading and negative contrast values are highlighted by cooler colours (blues). The student value is an approximate ‘Student t test’, and provides a measure of the statistical validity of the contrast. A student value of ‘2’ equates to a 98% confidence level in the calculated contrast; a student value of ‘1’ equates to an 85% confidence level.
Predictor MapCriterionW+W−ContrastStudent Value
Simplified lithologyCarbonaceous sediments3.32−0.063.3812.22
Felsic volcanics0.73−0.020.752.42
Gneiss0.89−0.090.985.13
Haematitic breccia4.53−0.014.546.94
Sandstone−0.650.14−0.79−4.03
Schist0.83−0.150.976.29
Simplified stratigraphyArchean0.89−0.070.954.50
Proterozoic0.05−0.330.381.82
Metamorphic regionsAmphibolite facies1.06−0.271.349.67
Granulite facies1.56−0.011.572.20
Lower greenschist facies2.06−0.102.1610.10
Sub greenschist facies0.29−0.090.382.65
Unmetamorphosed cover−1.370.59−1.96−10.34
Upper greenschist facies0.46−0.020.481.81
Archean buffered05 km1.46−0.421.8914.33
Gravity 6400 buffered20 km0.00−4.014.020.40
Faults WNW buffered1 km1.60−0.201.7911.39
Faults NW buffered1 km1.34−0.291.6411.76
Faults NNW buffered2 km1.09−0.401.4911.41
Faults NNE buffered1 km1.09−0.121.216.90
Faults NE buffered1 km1.31−0.151.468.62
Faults ENE buffered1 km1.17−0.101.266.53
Gravity 1600 NNE buffered9 km0.10−0.420.512.87
Gravity 1600 NE buffered6 km0.17−0.250.423.07
Magnetics 1600 edge density0.21–0.240.31−0.070.382.41
0.24–0.30.43−0.170.604.41
0.3 +0.21−0.050.261.66
Unconformity buffered45 km0.12−1.711.834.43
Table 5. Calculated weights of evidence for the Athabasca Basin study, using uranium occurrences as the training set. For multi-class predictors, only features that returned significant contrasts are shown. Where multi-ring buffers have been used around features, the buffer with the highest contrast is shown. W+ = positive weight of evidence, W− = negative weight of evidence. The contrast is the difference between the positive and negative weights. A positive or negative contrast signifies a net positive or net negative spatial association respectively. Higher contrast values are highlighted by warmer coloured (orange to red) shading and negative contrast values are highlighted by cooler colours (blues). The student value is an approximate ‘Student t test’, and provides a measure of the statistical validity of the contrast. A student value of ‘2’ equates to a 98% confidence level in the calculated contrast; a student value of ‘1’ equates to an 85% confidence level.
Predictor MapCriterionW+W−ContrastStudent Value
Solid geologyAthabasca quartzarenite−0.071.57−1.640.22
Carswell gneiss3.83−0.073.910.26
Magnetic domainsCarswell structure3.19−0.093.2814.47
Mudjatik—undifferentiated0.73−0.240.977.40
Shear zone0.33−0.010.340.89
Tantato—low mag0.76−0.040.793.15
Wollaston—high mag1.68−0.071.757.80
Wollaston—low mag1.51−0.231.7412.09
Gravity 6400 WNW buffered02 km0.68−0.060.733.58
Gravity 6400 NNE buffered01 km0.43−0.010.441.21
Gravity 6400 EN buffered01 km0.52−0.020.541.81
Magnetics 1600 edge density0.26–0.330.33−0.090.412.88
0.33–0.521.44−0.281.7212.72
Conductors (air)Conductor2.88−0.133.0115.96
Conductors (ground)Conductor3.58−0.323.9027.07
Extech IV faults10 km0.06−0.210.271.76
Faults WNW buffered2000 m1.20−0.121.327.74
Faults NW buffered400 m1.82−0.091.919.14
Faults NNW buffered200 m1.77−0.051.816.53
Faults NNE buffered2000 m1.62−0.341.9614.95
Faults NE buffered200 m1.56−0.041.605.59
Faults ENE buffered400 m1.26−0.031.294.34
Gravity 1600 WNW buffered3500 m0.44−0.100.543.66
Gravity 1600 NW buffered4500 m0.17−0.080.251.92
Gravity 1600 NE buffered3000 m0.17−0.030.201.18
Gravity 1600 ENE buffered5000 m0.15−0.090.231.84
Table 6. NW McArthur Basin MPM map weights. Weights reflect the perceived importance of the recognition criteria in the mineralisation model and/or greater confidence in the data from which the layer was derived. Full details, including class weights are provided in Appendix A.
Derived Predictor MapsMap WeightComments
Simplified lithology8Strong conceptual control and highlighted by WofE analysis.
Simplified stratigraphy8Strong conceptual control and highlighted by WofE analysis.
Archean buffered9Very important conceptually and highlighted by WofE analysis.
Unconformity buffered9Critical control on mineralisation but with a large zone of influence, as supported by WofE.
Faults WNW buffered9Dominant trend highlighted by WofE (occurrences and deposits).
Faults NW buffered8Highlighted by WofE (occurrences) and dominant in Fry 1 km to 50 km analysis
(occurrences and deposits).
Faults NNW buffered5Highlighted by WofE (occurrences) and strong trend in Fry 1 km to 50 km analysis
(occurrences and deposits).
Faults NNE buffered5Relatively weak trend highlighted by Fry analysis, weak trend in WofE analysis.
Faults NE buffered8Strong trend in WofE analysis
(occurrences and deposits).
Faults ENE buffered7Highlighted in WofE analysis (strong in deposits only data).
Metamorphic regions4Weak predictor of U mineralisation. Little differentiation between metamorphic classes in WofE.
Gravity 1600 NNE buffered3Weak trend highlighted by WofE analysis (occurrences data).
Gravity 1600 NE buffered5Relatively weak trend in WofE analysis (deposits and occurrences).
Gravity 6400 buffered6Strong contrast returned from WofE analysis. Conceptually important.
Magnetics 1600 edge density5Modest response from WofE analysis. Conceptually important.
Table 7. Athabasca Basin MPM map weights. Weights reflect the perceived importance of the recognition criteria in the mineralisation model and/or greater confidence in the data from which the layer was derived. Full details, including class weights are provided in Appendix B.
Derived Predictor MapsMap WeightComments
Solid geology9Conceptually strong control on mineralisation.
Conductors (air)7Strong response from WofE analysis. Important in historical targeting.
Conductors (ground)8Very strong response from WofE. Important in historical targeting.
Faults WNW buffered6Clear spatial association with known deposits. Highlighted by WofE.
Faults NW buffered7Clear spatial association with known deposits. Highlighted by WofE.
Faults NNW buffered6Clear spatial association with known deposits. Highlighted by WofE.
Faults NNE buffered7Clear spatial association with known deposits. Highlighted by WofE.
Faults NE buffered8Clear spatial association with known deposits. Highlighted by WofE.
Faults ENE buffered6Weaker response from WofE. Still important conceptually.
Magnetic domains10Representation of basement domains—critical control on U mineralisation.
Extech IV faults4Broad zones of structural weakness with high levels of spatial uncertainty.
Gravity 1600 WNW buffered4Weak spatial association with known deposits in WofE analysis.
Gravity 1600 NW buffered3Very weak response from WofE.
Gravity 1600 NE buffered5Important conceptually. Weak spatial association with known deposits.
Gravity 1600 ENE buffered3Important conceptually. Weak spatial association with known deposits.
Gravity 6400 WNW buffered6Moderate response from WofE analysis. Possibly represent significant basement structures.
Gravity 6400 NW buffered3No spatial association observed in WofE analysis but conceptually important.
Gravity 6400 NNW buffered4No spatial association observed in WofE analysis but conceptually significant.
Gravity 6400 NNE buffered5Moderate response from WofE analysis. Possibly represent significant basement structures.
Gravity 6400 NE buffered2No spatial association observed in WofE analysis but conceptually significant.
Gravity 6400 ENE buffered6Moderate response from WofE analysis. Possibly represent significant basement structures.
Magnetics 1600 edge density5Modest response from WofE analysis.
Conceptually important.

