1. Introduction
The reduction of mineral deposits created the necessity for extracting more complex minerals with reduced ore grades and grindability [
1]. Consequently, there is an arising need for processing reduced particle size that can propitiate the liberation of valuable minerals for post concentration stages. In this context, additional power is required to achieve a finer grain size. Therefore, grinding and regrinding applications are increasing in importance.
At the same time, grinding is energy inefficient, and this is the main reason why it is pointed as responsible for around 34% to 44% of the energy required in a mineral processing plant [
2,
3]. The numbers are even more alarming if we consider the situation in a global context. In the 1980s, grinding was responsible for around 3% to 4% of total world electrical energy consumption [
2], and more recently, this number was indicated as close to 1.8% [
4]. In fact, Napier-Munn went beyond and argued that real energy consumption in grinding is even greater than those numbers, once consumption of liners and grinding media represents a large amount of extra energy. Regardless of which is the correct number, it is conclusive that the grinding process is responsible for a significant portion of the world’s power consumption.
Given the rising importance of the representative energy consumption of grinding equipment, it is very important to develop the process of improved energy efficiency. In relation to this issue, Shi (2009) [
5] demonstrated that the application of vertical stirred mills presents the energy saving around 30% when compared to tumbling ball mills used for coarse grinding. By applying various methodologies, other researches confirmed the obtained results and reinforced this better energy efficiency behavior for fine-grinding and ultra-fine grinding applications. This behavior is the main reason why vertical stirred mills are pointing as trend equipment for fine-grinding and ultra-fine-grinding applications.
Several approaches for vertical stirred mills modeling can be found in literature, among which stand out the mechanistic approach, Discrete Element Method (DEM), empirical models, and finally, the Population Balance Model (PBM). However, the understanding of the screw liner wear is not well developed yet.
As indicated by Esteves et al. [
6], operational costs of vertical stirred mills are divided into electrical energy (50%), balls (40%), and liners (10%). Liner wear intensifies grinding media consumption, increases mill filling, and consequently, affects electrical power consumption. Consequently, liner wear affects all operational costs components, such as maintenance practices and equipment reliability. As highlighted by Allen and Noriega [
7], the understanding of liner wear life can also provide information that allows best practices for maintenance schedules that can minimize spare parts and labor costs. Consequently, a better understanding of wear behavior, such as monitoring methods can precisely provide its measurement and/or prediction is a topic of great need in the mineral processing industry. In this paper, DEM simulations are used to predict the screw liner wear behavior of a vertical stirred mill.
Computational simulations based on DEM made many contributions to the science of comminution since its first application by Mishra and Rajamani [
8], for the simulation and modeling of tumbling ball mills. According to Weerasekara et al. [
9], since the last two decades, the DEM became an essential tool to help design, optimization, and modeling of comminution devices. More recently, there is also an increasing interest in applying the method for the prediction of liners and lifters wear, such as its effects on load behavior.
As there is no available information about how to determine and quantify wear for vertical stirred mills, the approach is based on what is presented for other grinding equipment. The understanding of liner and lifters wear, especially in tumbling mills, is not a new subject in the area, and several papers are found addressing this issue.
In the specific case of wear evaluation, Cleary [
10] proposed a method that used DEM to predict liner wear rates and distribution in a 5.0 m diameter ball mill. With a similar approach, Cleary and Owen [
11] evaluated wear in a 3D slice of a SAG mill, and finally, Cleary, Sinnott, and Morrison [
12] performed an evaluation and comparison between wear in tower and pin mills. Kalala and Moys [
13] used DEM to estimate adhesion, abrasion, and impact wear in dry ball mills with further validation with industrial wear measurement. Later, Kalala, Bwalya, and Moys [
14] validated the use of DEM for wear prediction in mill liners by comparing normal and tangential forces between experimental data and DEM simulations. More recently, Cleary and Owen [
15] simulated liner wear evolution in a Hicom Mill and was able to convert DEM abrasion measurements in a wear rate measurement that was calibrated with experimental data. Boemer and Ponthot [
16] established a generic wear prediction procedure applying DEM to a 3D ball mill and validated the results with experimental data obtained in a 5.8 m diameter industrial cement ball. Finally, Xu et al. [
17] obtained a numerical prediction of wear in SAG mills using DEM simulations that were quantitatively validated by experiment data available in other researches. In fact, the use of DEM for wear prediction in SAG mills reached such a high level that has recently been used to evaluate operational strategies to account for liner wear.
For the specific case of vertical stirred mills, DEM was first applied by Cleary, Sinnott, and Morrison [
12] to investigate the relative performance of stirred mills with two different agitator designs. The paper analysis media flow, energy absorption, flow structures, wear, mixing, and transport efficiency, and allows a good and wide understanding of the performance of vertical stirred mills. For the case of the screw agitator, it can be seen that media motion is a simultaneously lifting and circulating movement inside the equipment. The simulations indicate that the collisional energy associated with media motion is mostly dominated by shear. In relation to media-media and media-liner interactions, shear energy represents more than three times the impact energy. Based on shear energy absorptions, the author infers that the equipment wear is dominated by abrasion and is more intensive on the outer radial edge of the screw. In a slightly different approach, Morrison, Cleary, and Sinnott [
18] used DEM to compare the energy efficiency between the ball and vertical stirred mills in pilot-scale and proposed that the higher efficiency associated with the stirred mill can be explained by analyzing energy spectra associated with collisions frequencies inside the mill. Therefore, the higher energy efficiency of the vertical mill can be explained by the presence of a great number of contacts of low energy. Sinott, Cleary, and Morrison [
19] applied DEM to understand how flow and energy are affected by media shape in stirred mills, concluding that grinding performance tends to significantly deteriorate when using non-spherical media. By analyzing rates of shear power absorption, the author also proposes that the increase in non-sphericity of the media can significantly intensify the screws’ wear.
In a different approach, Sinott, Cleary, and Morrison [
20] evaluated slurry transport inside the mill using the SPH (Smoothed Particle Hydrodynamics) method and based on DEM simulations. Allen and Noriega [
7] applied DEM with SPH to understand the screw liner wear. The results demonstrate that shear power is more intensive at the screw outside edges and at the bottom of the mill. This explains why the screw wears from the outside to inside and from the bottom to the top, such as have been seen in the industry. In addition, results indicate that shear power is exponentially related to screw diameter, and consequently, worn screws tend to wear slower as they present smaller diameters. Based on this description, it is possible to note that although DEM is widely applied in the understanding and evaluation of vertical stirred mills performance, the liner wear topic is still superficially approached.
To summarize, the use of DEM to evaluate liner wear in tumbling mills came from a quantitative evaluation and evolved another level. Nowadays, DEM can predict and quantify the wear in SAG and Ball mills, being used in the optimization of materials and operational parameters. Unfortunately, for the case of the vertical stirred mills, the studies are still preliminary and qualitative. Solving this issue requires more in-depth studies and validation with experimental data.
In this paper, the simulation results were compared with industrial measurements performed in Minas Rio Project, an iron ore beneficiation plant of Anglo American, which is in Minas Gerais State, in Brazil. An empirical evaluation of wear is an important tool for validation and calibration of modeling techniques, such as performed by some researches [
13,
15,
16,
17,
21,
22] for several types of grinding equipment. However, there are few available information about how to determine and quantify wear for vertical stirred mills. Based on that, the approach is based on what is presented for other mills.
The understanding of liner and lifters wear in tumbling mills is not a new subject in the area, and several papers are found addressing this topic. In the case of tumbling mills, the wear profile is commonly estimated in two-dimensional methods, taking the assumption that wear has a uniform profile. More recently, with the advent of new technologies, it is easier to perform three-dimensional measurements, and there are also highly sophisticated devices available [
16]. Three-dimensional measurements are being widely used to calculate wear on the surface of liners in grinding equipment, and the technique was successfully used for SAG mills [
17,
23], and also for a Hicom Mill [
15].
2. Gravity Induced Stirred Mill
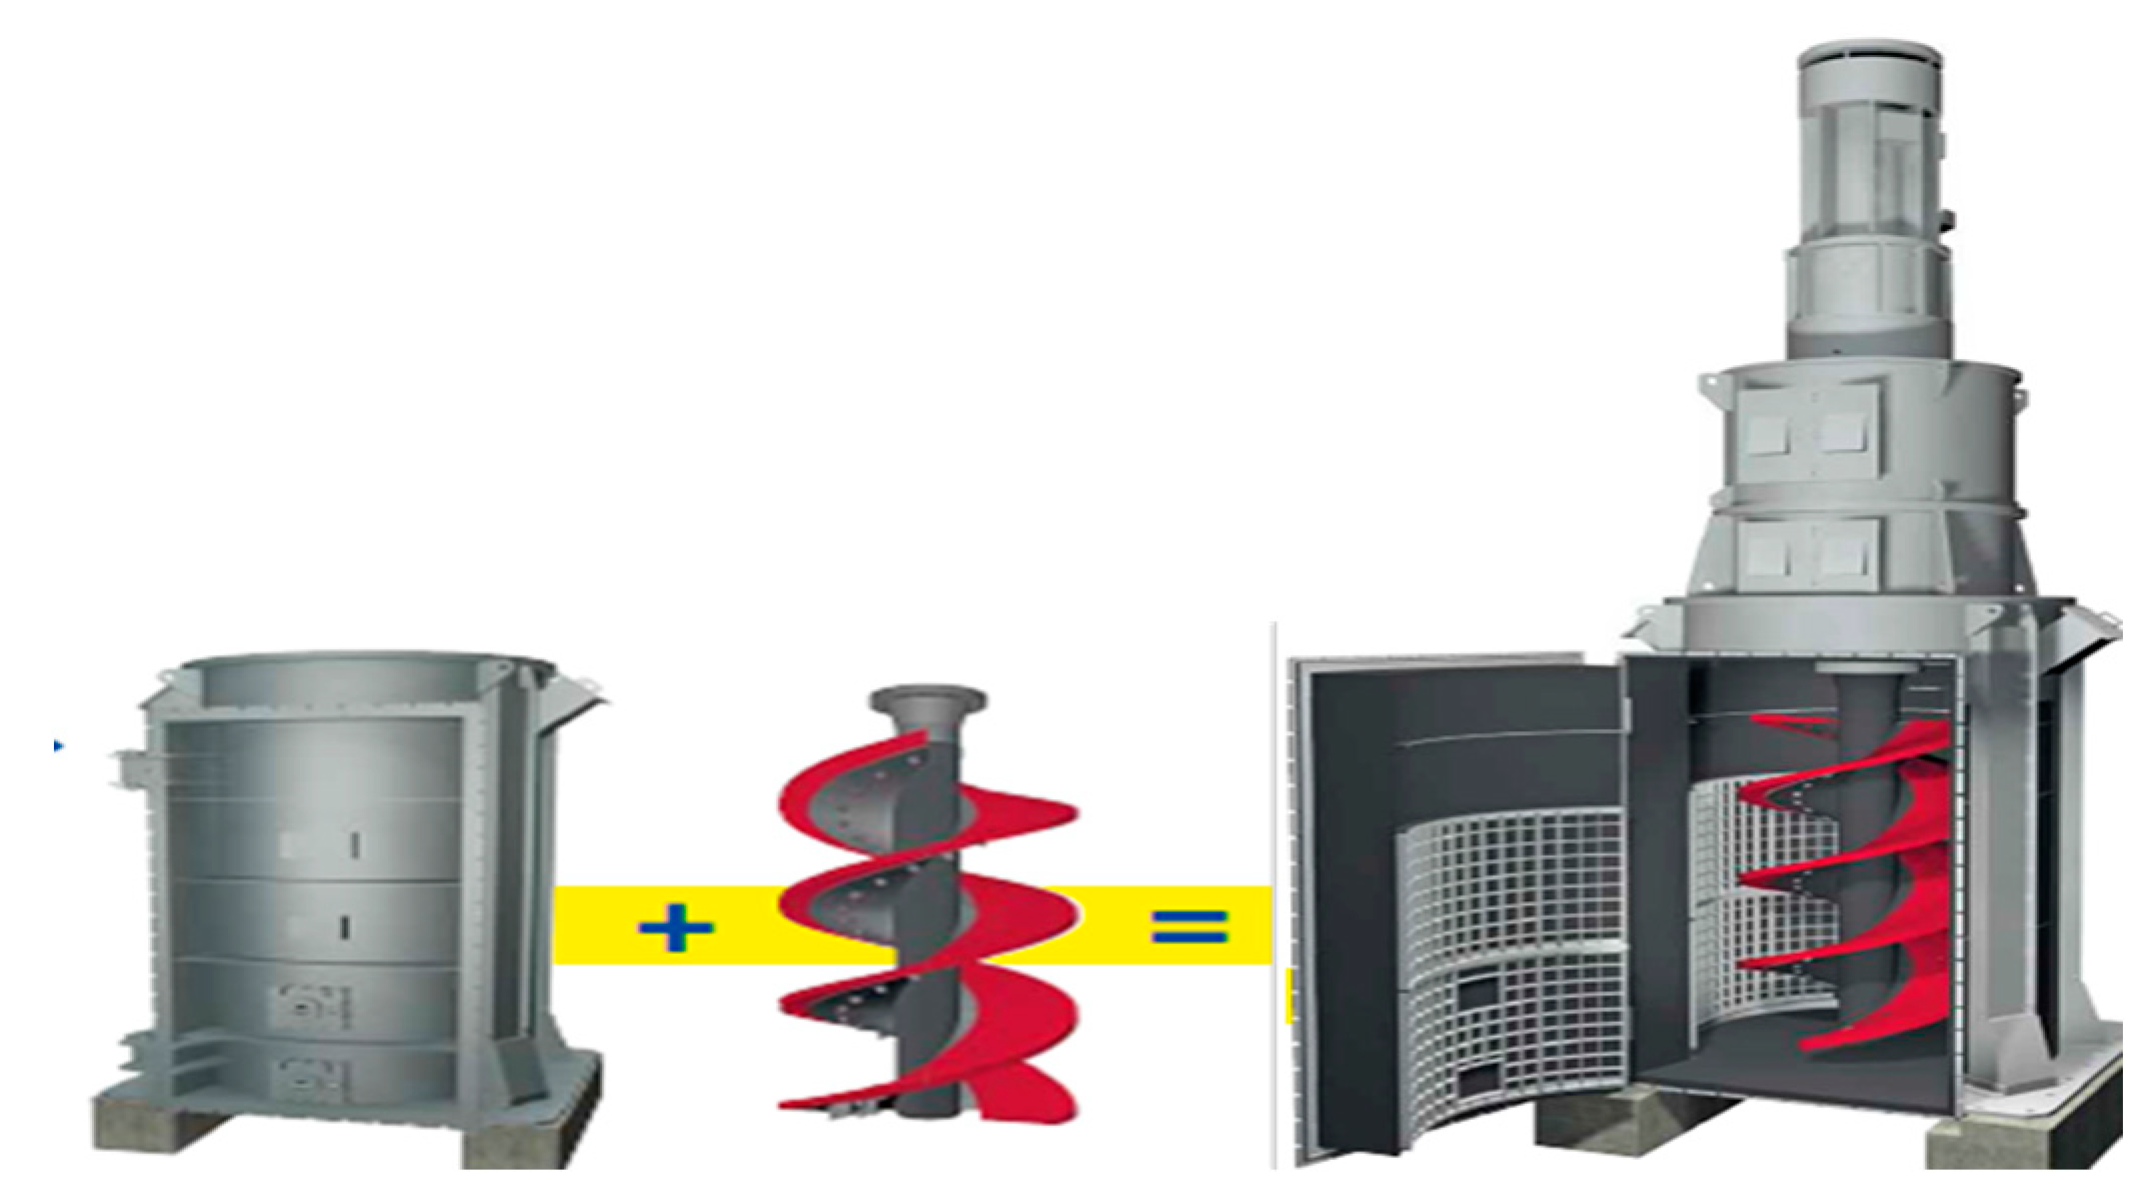
Vertical stirred mills are grinding equipment applied for comminution, especially for fine grinding in regrinding applications where feed material is under 1mm. The main parts of the equipment are the grinding chamber, internal liner, screw impeller, screw liner, motor engine, ball feeder, slurry feeder, and the discharge, as shown in
Figure 1.
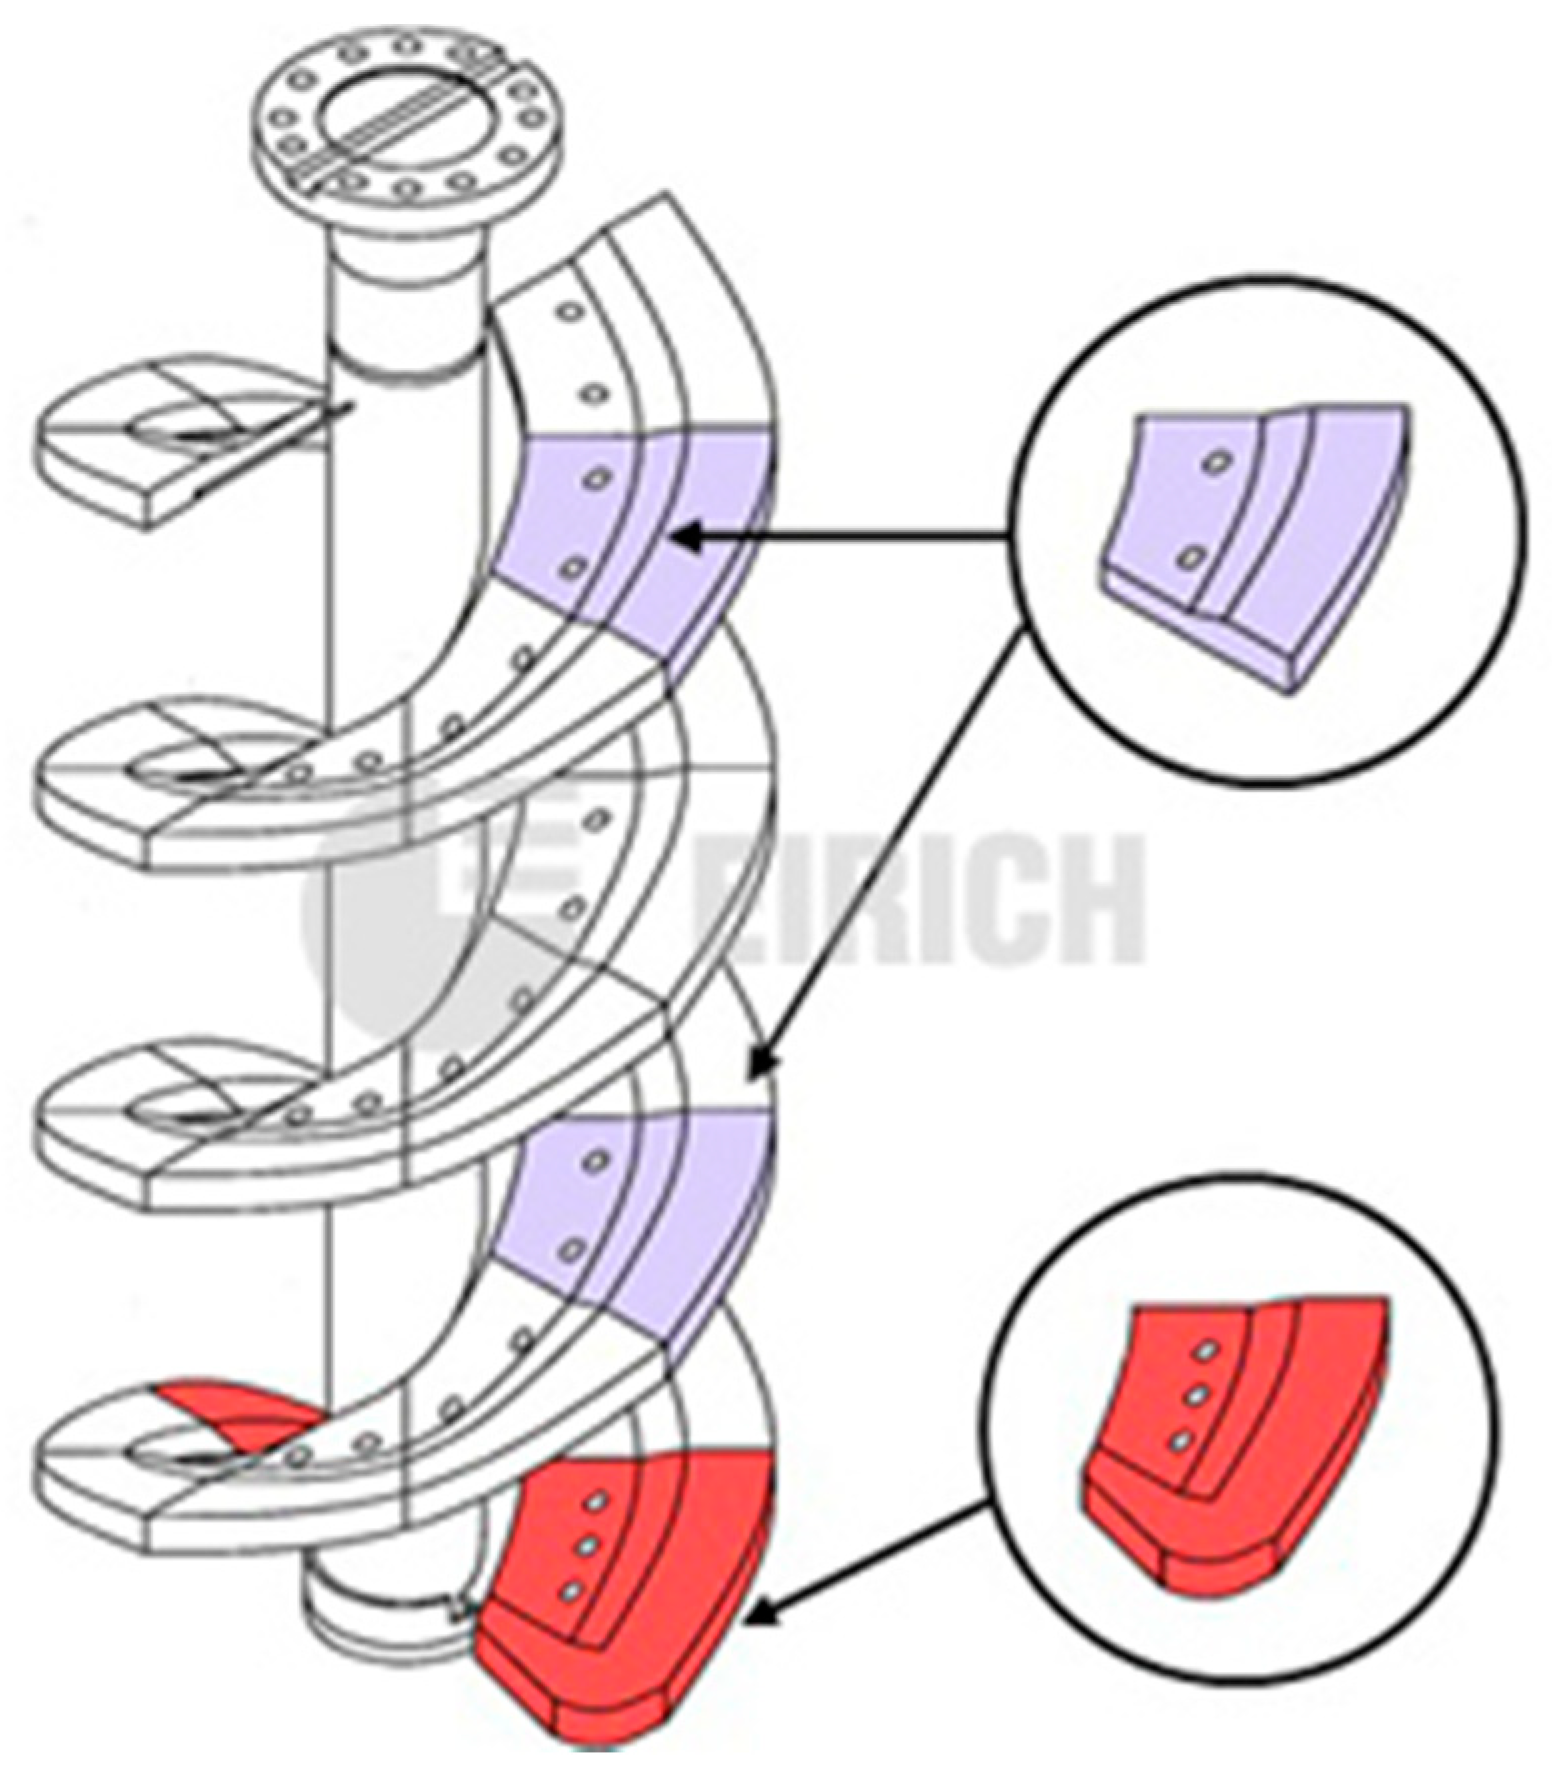
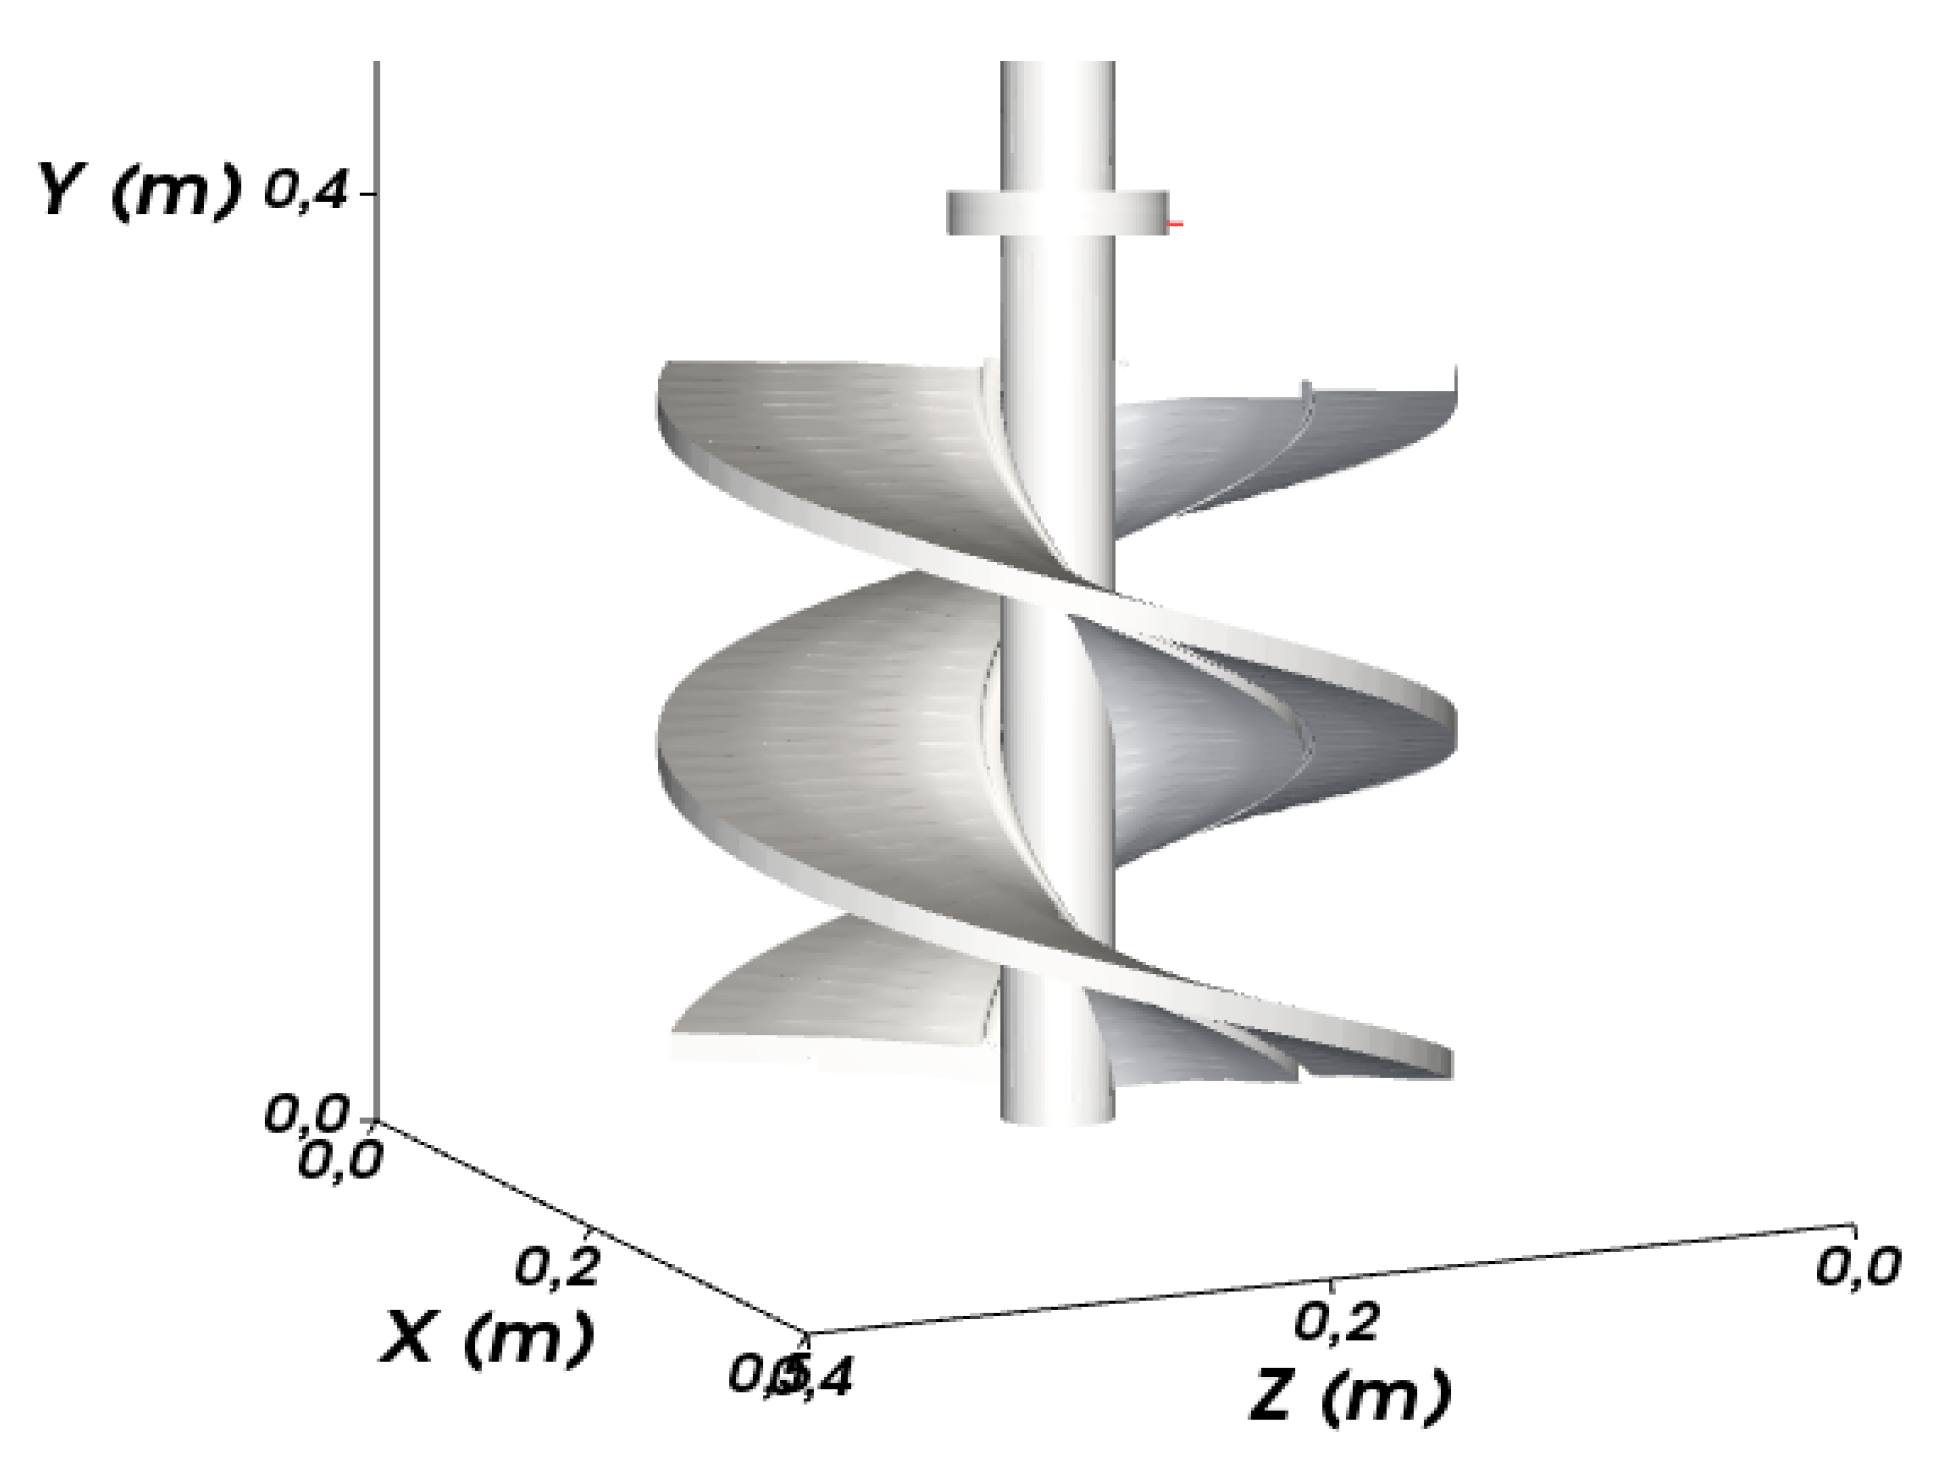
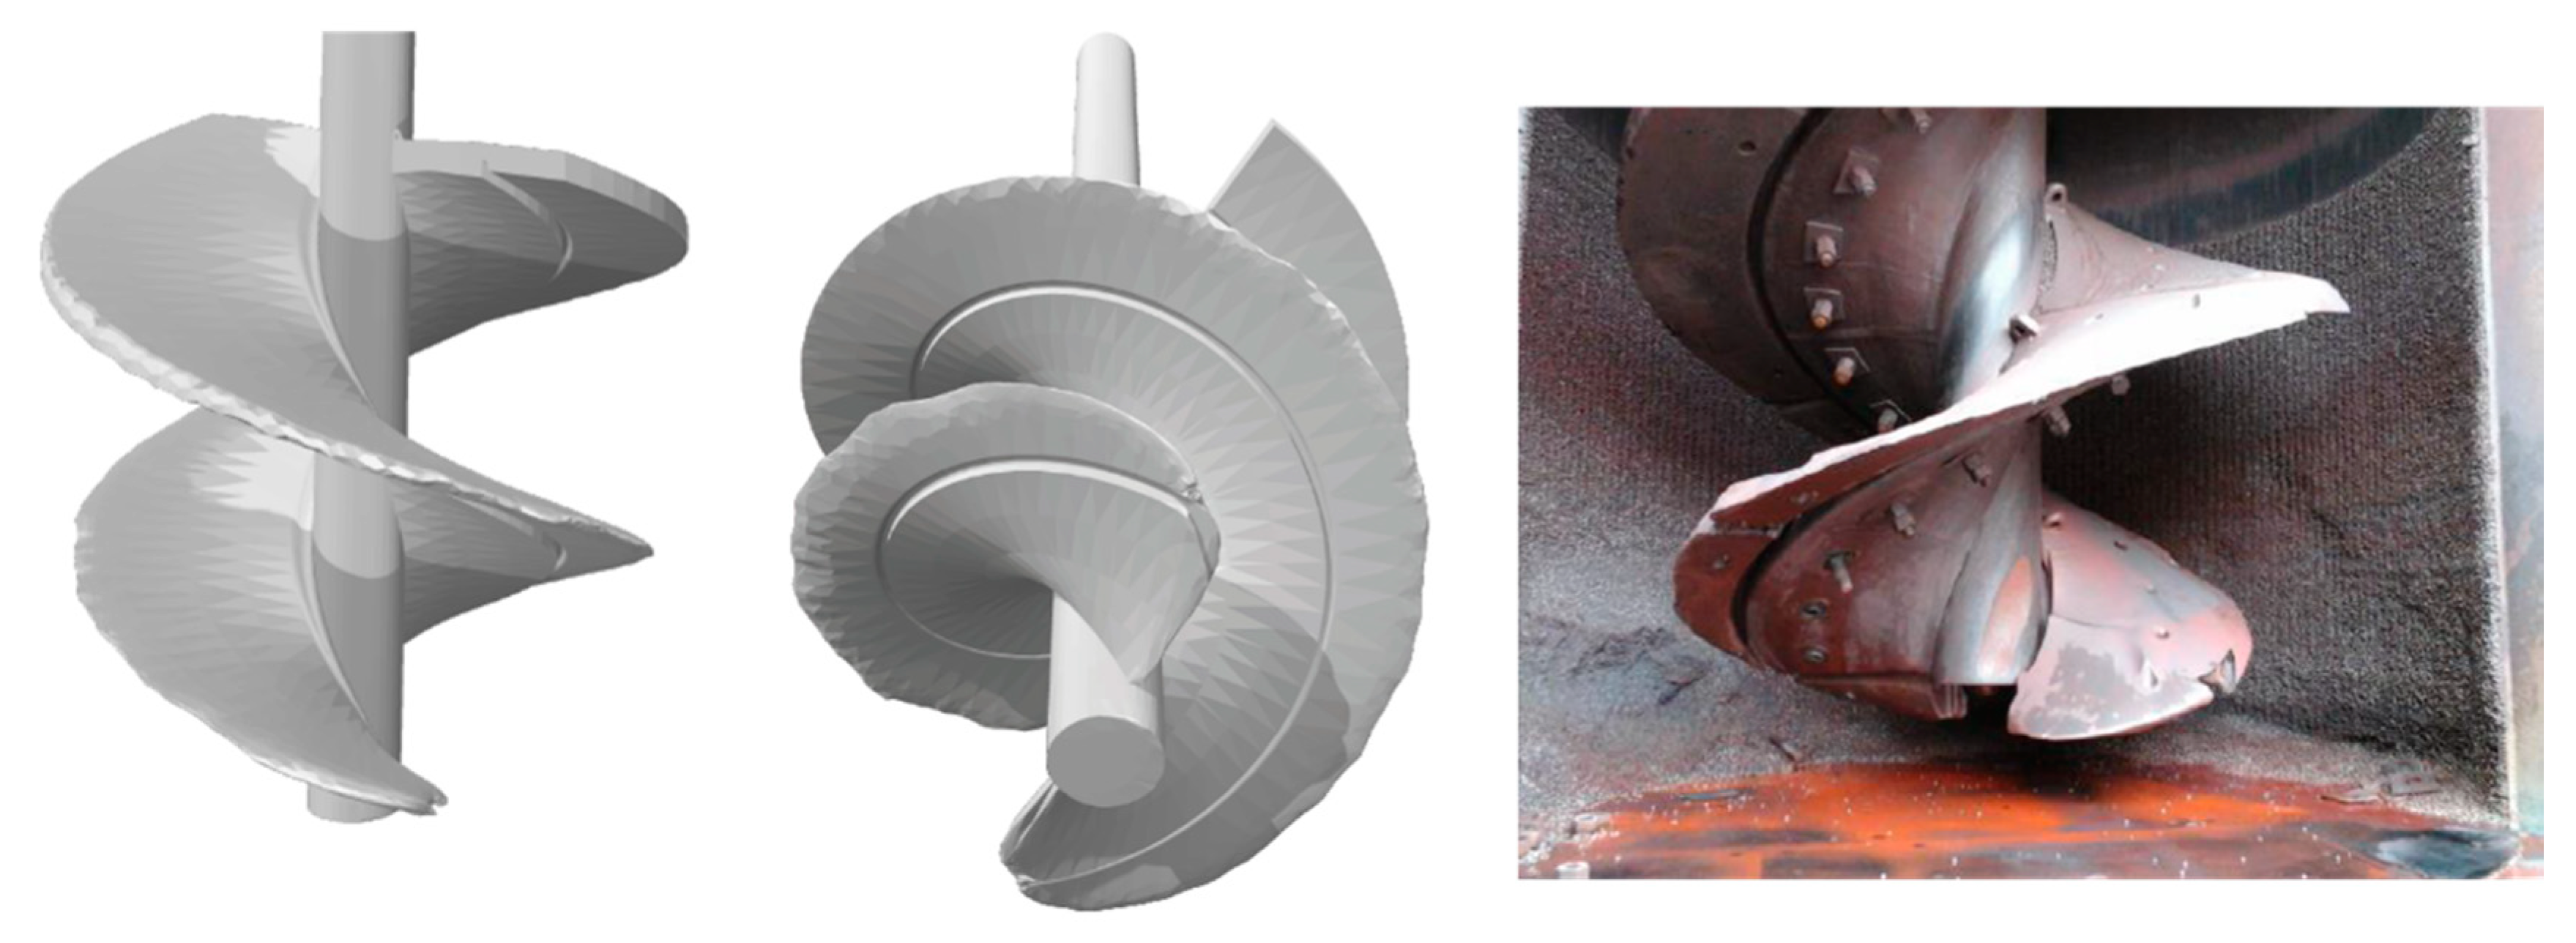
Figure 2 emphasizes the screw impeller, such as its liner parts. As the screw impeller is responsible for media motion and is currently in contact with media and slurry, it suffers intensive wear. Due to the wear, liner parts required periodic replacement. The liner is divided into several parts, allowing the substitution to be performed differently, according to the wear pattern. The number of parts depends on the equipment supplier and on the equipment size. The liner parts are attached to the screw and protect it from wear.
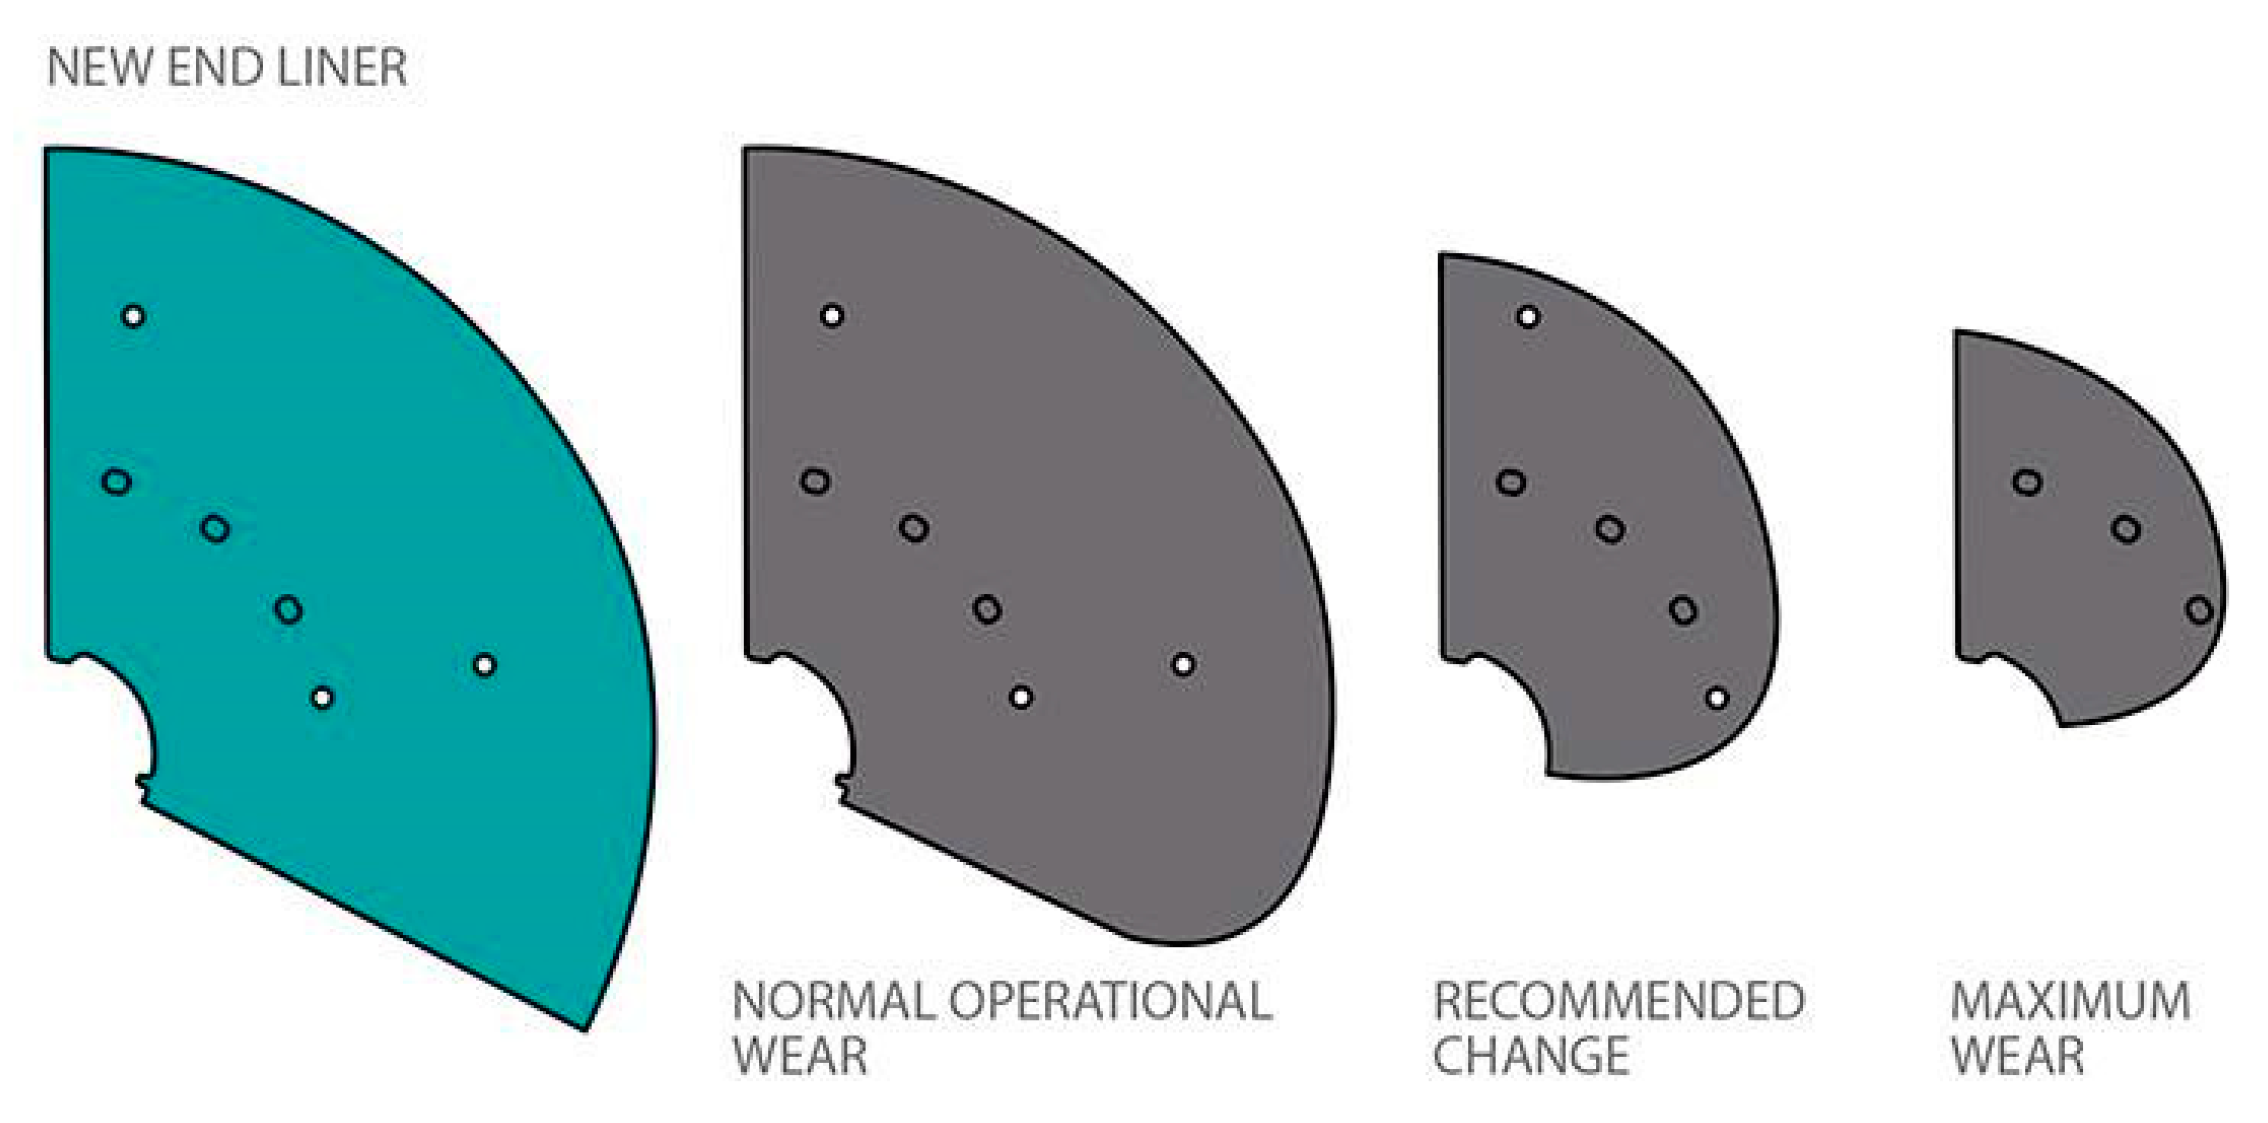
Figure 3 shows the expected wear shape of the base liner part. From that, it is possible to note that the liner does not suffer homogeneous wear. In this sense, it is expected that the bottom part of the liner suffers more intensive wear at the edges.
As the liner wears, the total surface area decreases, and consequently, both media motion and power draw decrease. In the operational context, the liner wear compensation is performed by adding additional grinding media to keep constant power draw. In this sense, the liner wear measurement can be estimated and accomplished by measuring mill filling. Although this provides an idea about wear conditions, visual inspections of the liner are necessary. For this inspection, it is necessary to completely empty the mill, in a very effort and time-consuming inspection.
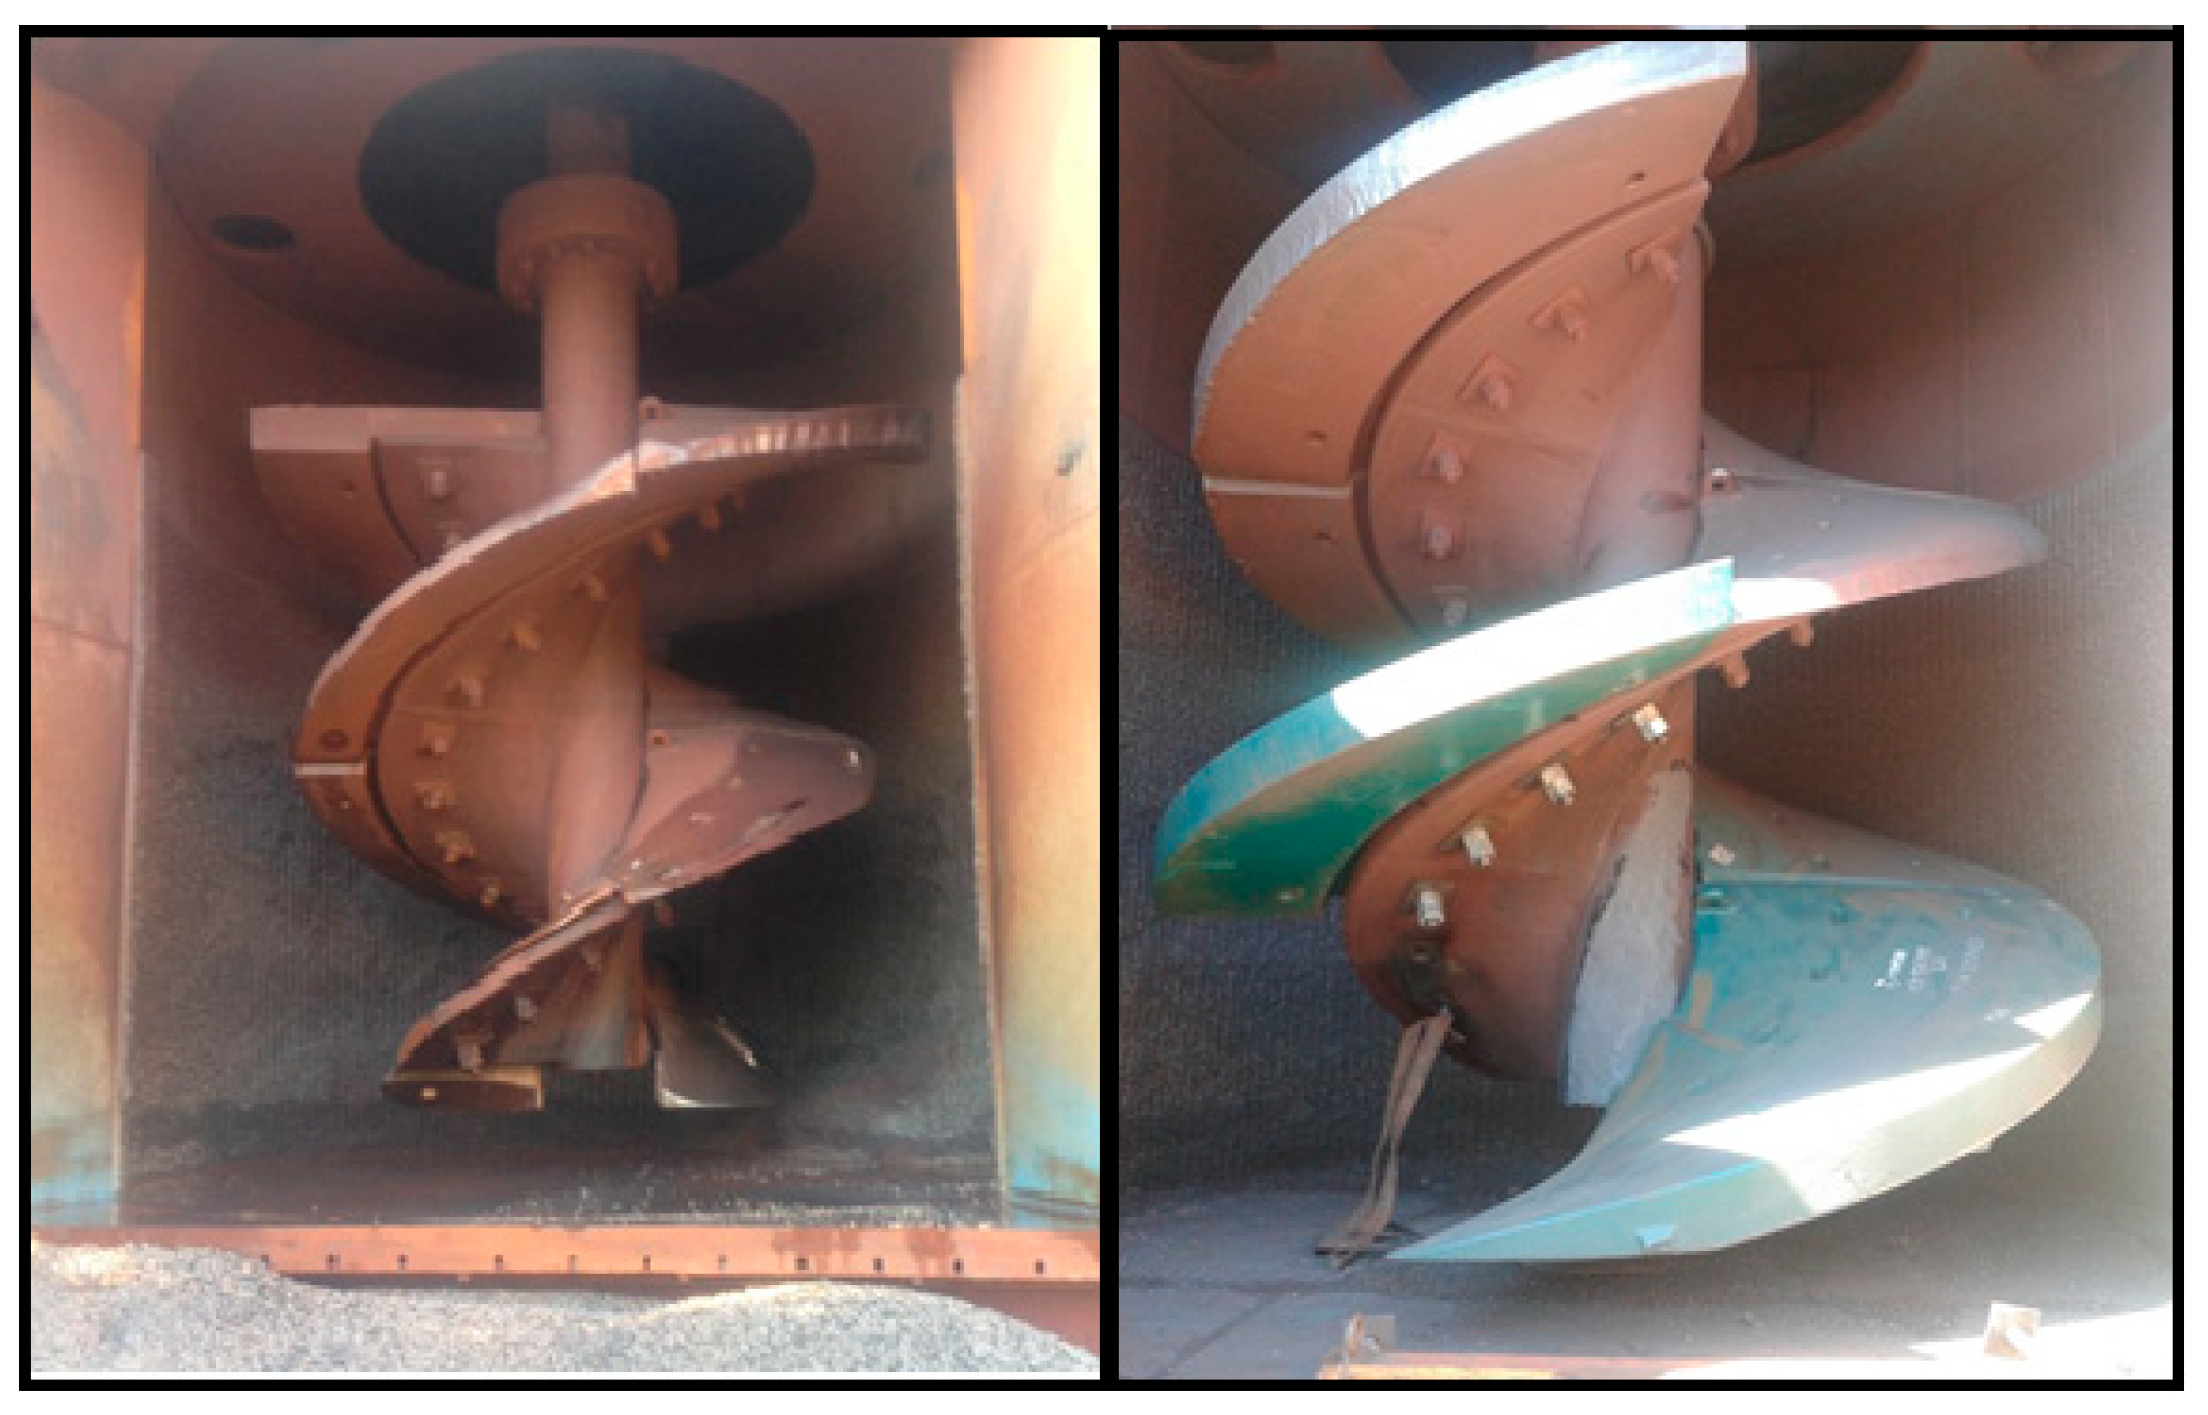
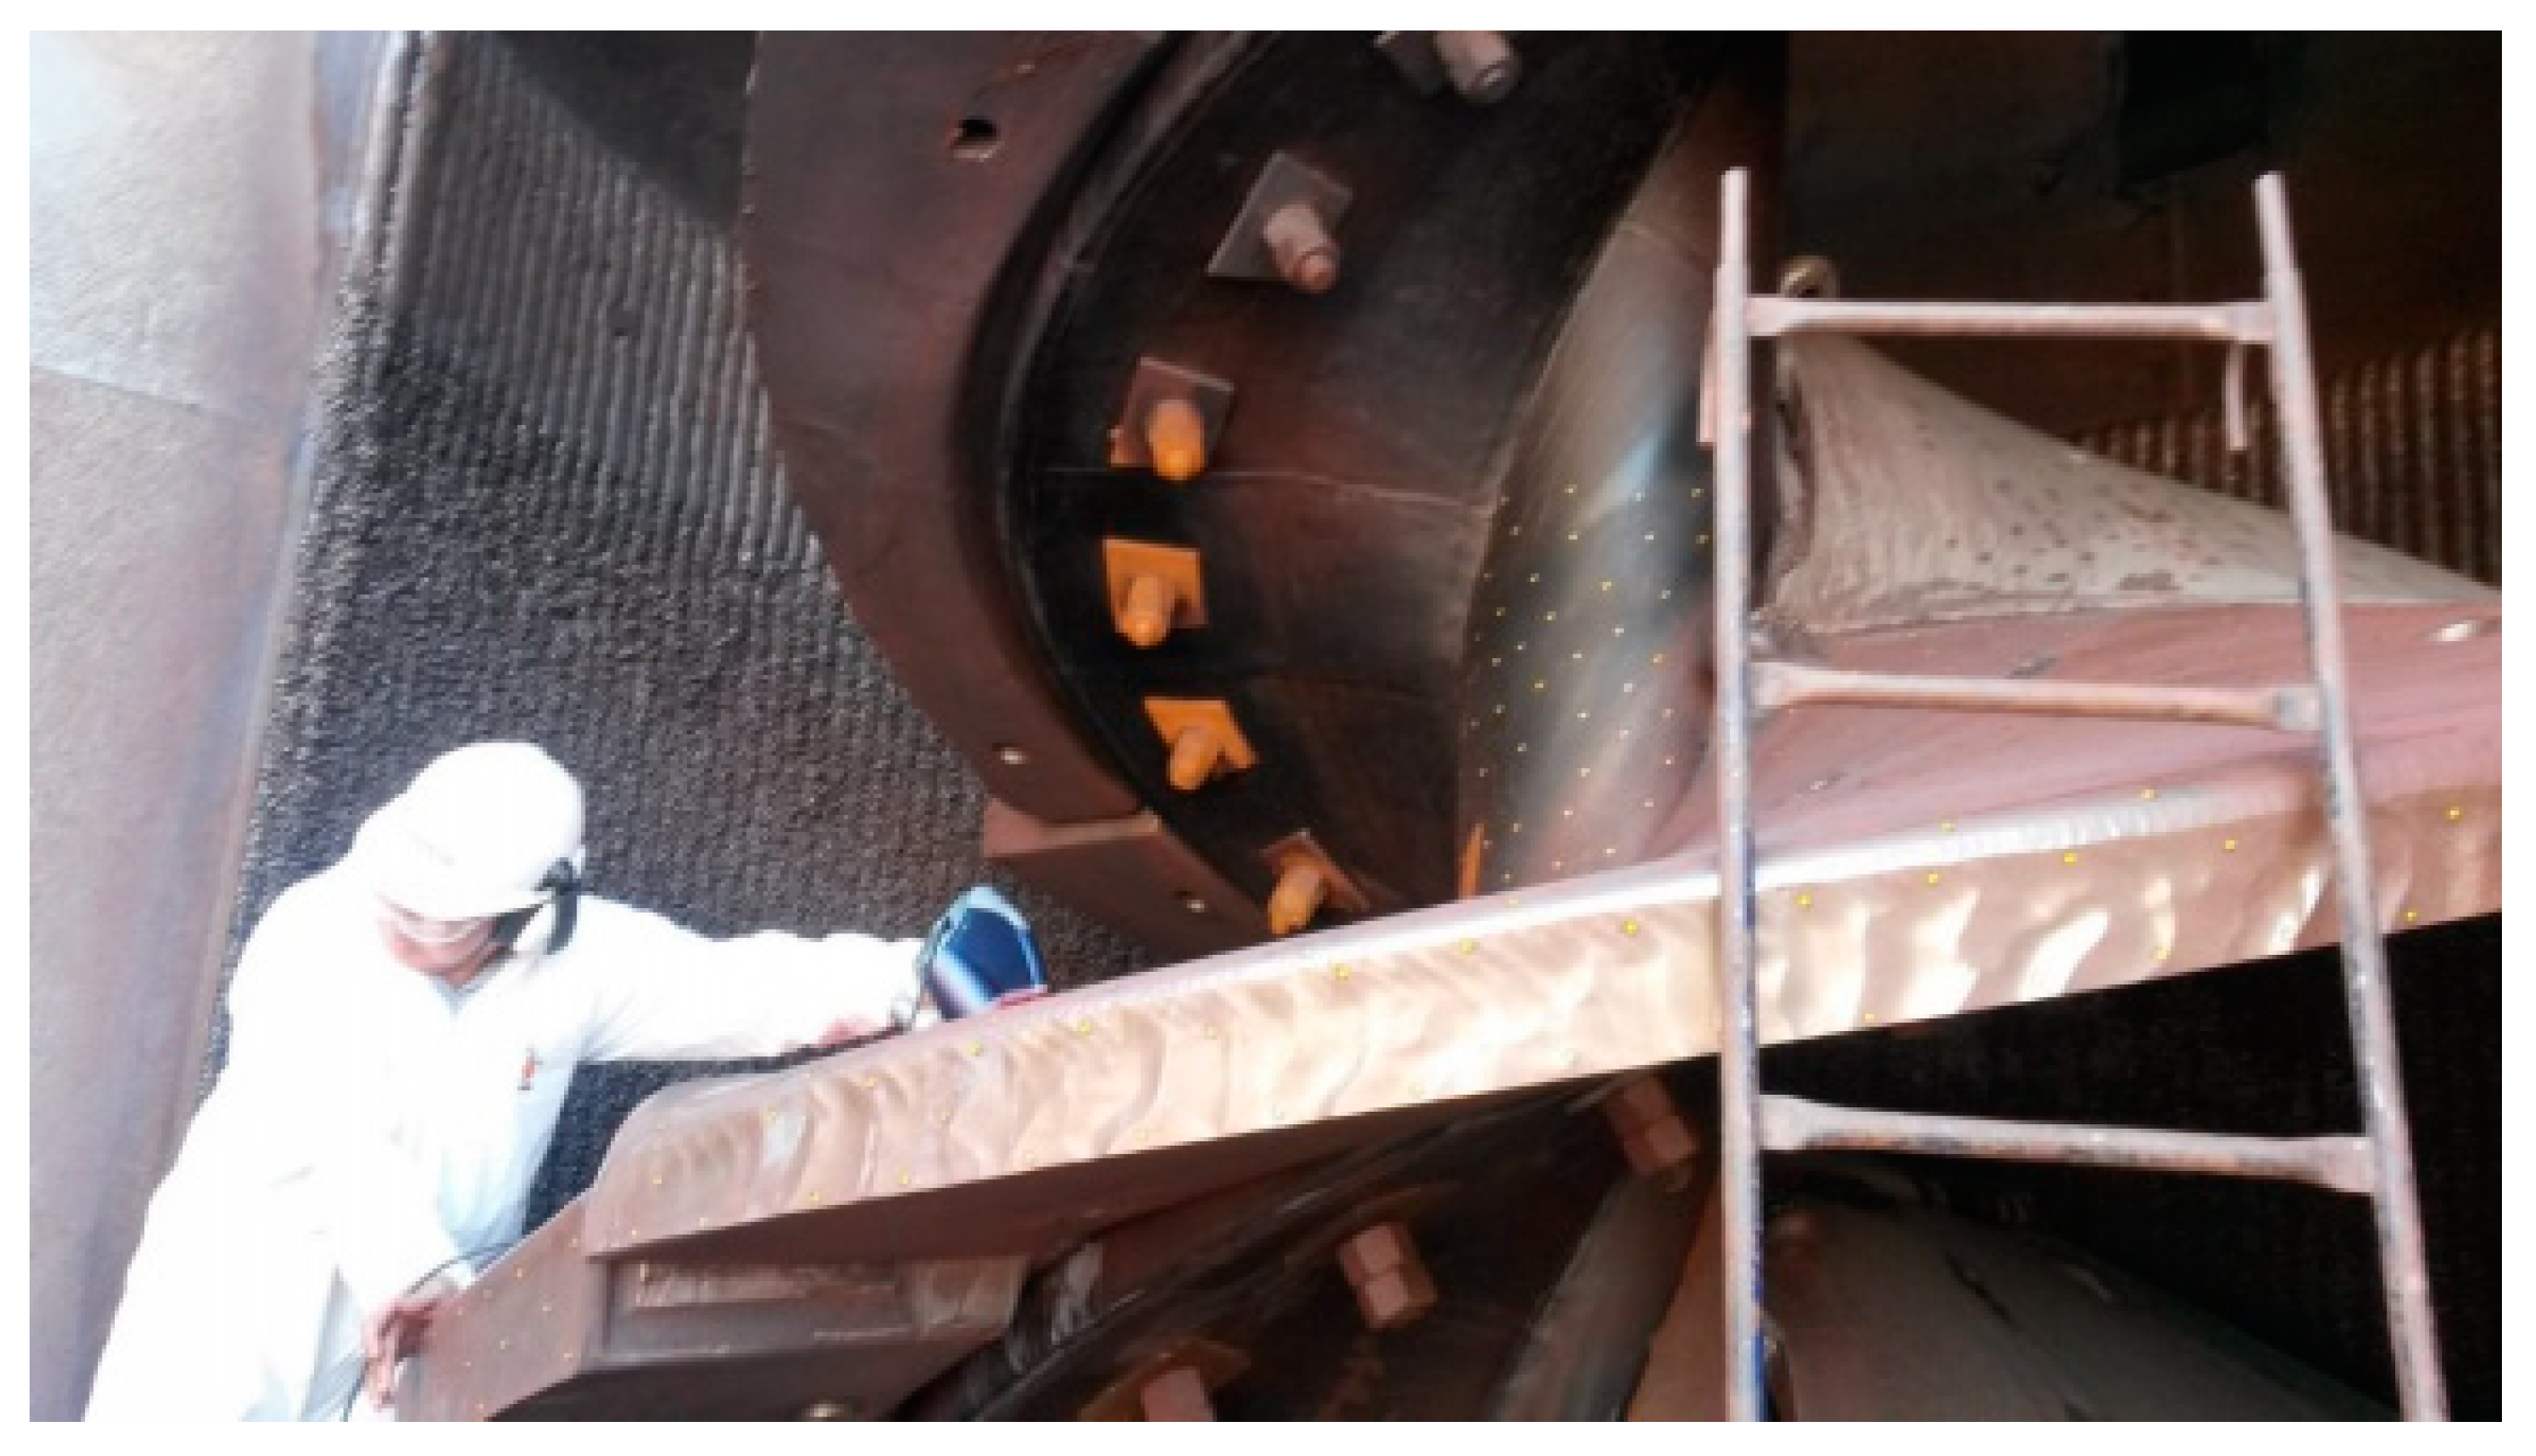
Figure 4 shows the screw liner after completely emptying the mill. It can be seen the difference between a new and an old liner of the VTM-1500. The figure on the left side shows a liner with intensive wear, and the right side shows the replaced liner. From the figure, it can be inferred that wear predominates at the bottom and edges of the screw, causing a great decrease in the screw area.
Based on what was presented, the aim of this paper is to gather what has already been discussed on the subject and also to propose the use of DEM for evaluating the liner wear during a complete liner lifecycle.
4. Results
Results are divided into four sections: Steady-state simulation results, wear simulation results, VTM-1500 wear measurements, and finally, the DEM wear model prediction. The steady-state simulation results are shown in the initial section, as well as the present results that were obtained at the beginning of the simulation, after a minimum of three mill revolutions and before the beginning of the wear simulation. This is defined as steady-state simulation and aims to understand the mill behavior before wear. The second section presents results obtained during the wear simulation, after wear parameters were settled. This comprises of evaluating the simulation outputs, such as wear quantification. The VTM-1500 wear measurement consists of the next stage and is focused on presenting and adapting industrial wear measurements presented by Silva [
30]. Finally, the last section comprises the correlation between industrial and simulated wear patterns, such as the presentation of the wear model prediction. This is performed for the three different mill agitator velocities.
4.1. Steady-State Simulation
4.1.1. Particle Trajectory
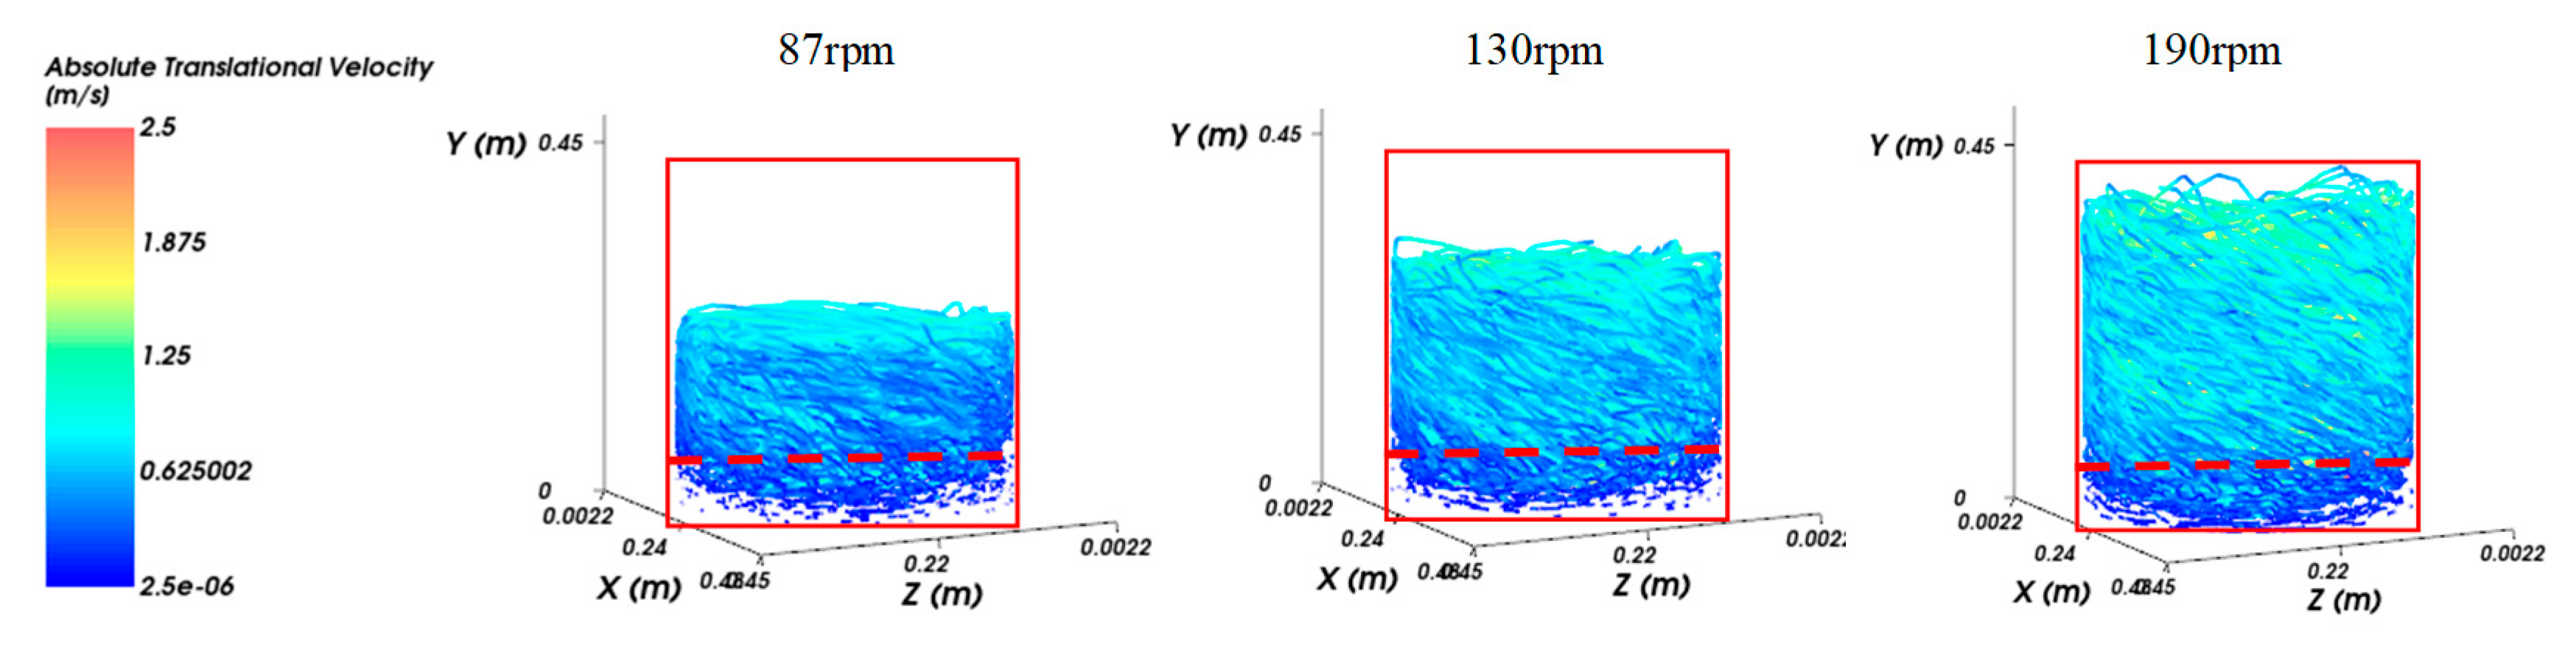
Figure 11 shows the particle trajectory colored as a function of particle absolute translational velocity, for the three agitator velocities. A red box was constructed in the surrounding area of the particle trajectory, for the 190 rpm condition. By placing the same box over the particle trajectory of the mills operating at 130 rpm and 87 rpm, it noticeable that the top part of the box is not filled with trajectory streaming lines. This means that the media motion height range is reduced when reducing mill velocity. In other words, it indicates that by increasing mill velocity, the upper parts of the mill were activated.
A dashed red line is placed at the bottom part of the mill. It is visible that streaming lines are also reduced in this bottom area. Because of the reduced motion, this area is identified as “dead zone”. The velocity reduction, and thus, the dead zone effect is intensified for reduced mill velocities. This is in accordance with the velocity behavior at the mill top zone. Based on that, it was verified that agitator rotational velocity has a direct effect on the particle trajectory distribution, over the complete height of the mill.
4.1.2. Particle Velocity and Power
Figure 12 shows the particle average translational velocity and simulation power as a function of mill rotational speed. It is conclusive that both particle velocity and power increases with mill speed. This demonstrates that the agitator rotational velocity influences the overall mill power and grinding media kinetic energy, thus having a direct relation in the energy that can be transferred into breakage mechanisms.
4.1.3. Particle Spectrum
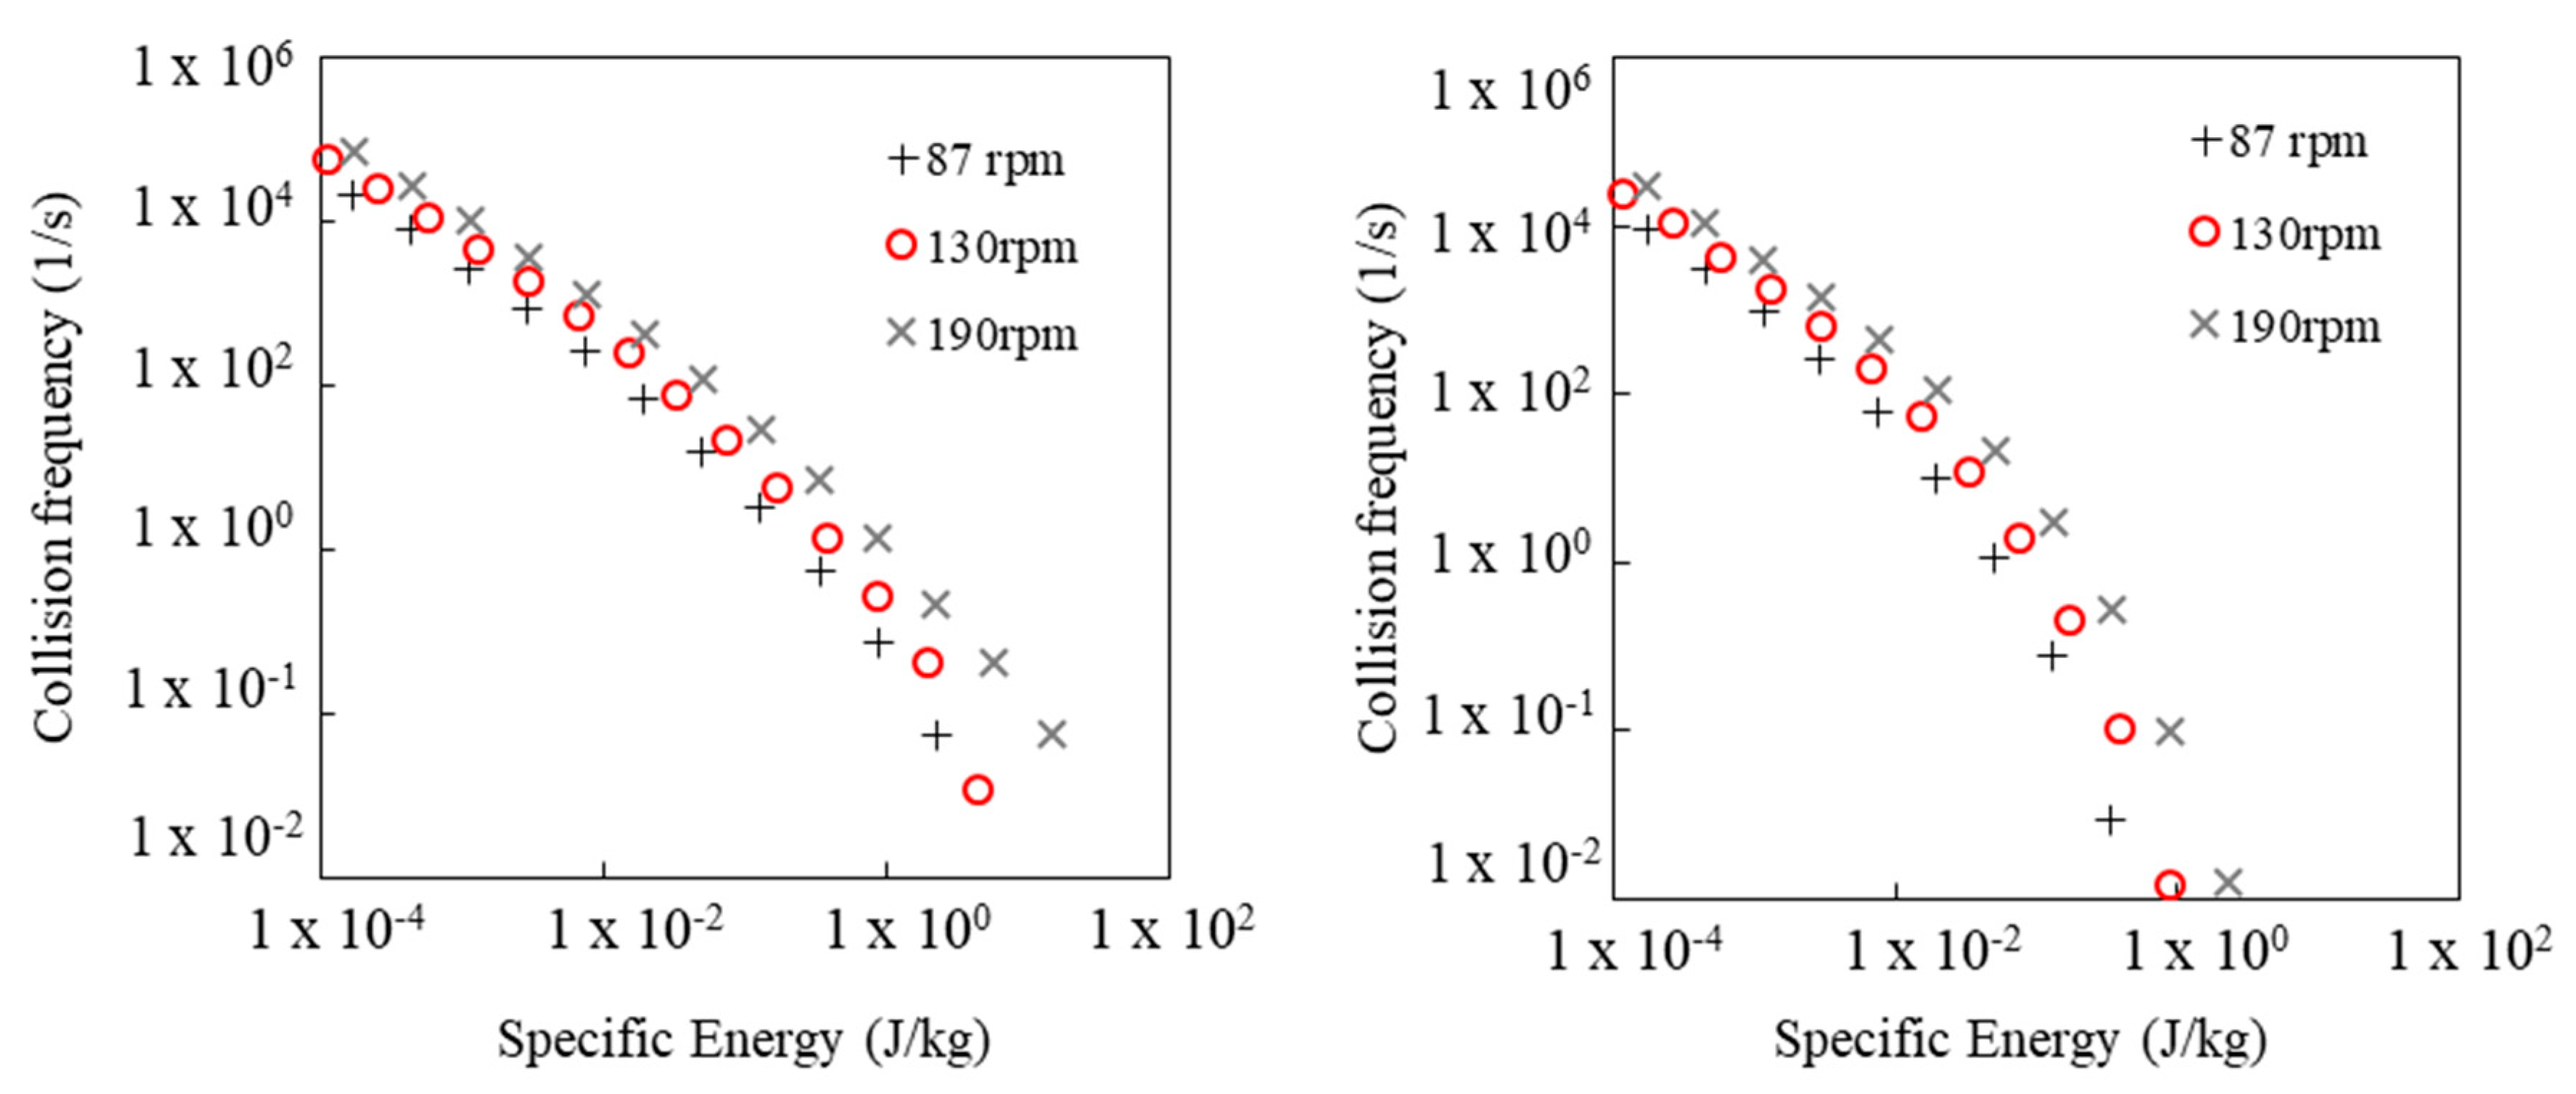
The collision frequency distribution of particle specific energy was plotted for normal and tangential particle contact in
Figure 13. This represents the collisions statistics for specific energy that are applied to particles per time unit. The x axis indicates the specific energy of contact, which means the amount of energy that is transferred per mass of grinding media. The y axis indicates the number of contacts per unit of time, at each specific energy level.
The wider specific energy distribution is observed for normal contact, in comparison to the shear contact distribution. This means that normal contacts can have a higher specific energy value than shear contacts. In relation to the agitator rotational velocity, higher velocities are associated with a small increase in both collisions’ frequency and specific energy range. This can be observed for both normal and tangential contacts.
By looking at the relationship between energy levels and collision frequency, it is also possible to correlate with breakage behavior. In this sense, contacts with greater values of specific energy have a higher tendency to overcome the minimum specific energy required for a certain particle to break. This means that contacts of higher specific energy values have a higher probability of causing breakage in a single or fewer contacts. However, this can also lead to a non-energy efficient behavior once this increases the chance to apply more energy than necessary to cause particle breakage. In contrast, smaller values of specific energy might initially lead to particle weakness, instead of direct breakage. Because of that, it can be necessary for a larger amount of low specific energy collisions cause breakage. At the same time, by applying a greater amount of small specific energy contacts increases the chance to apply the minimum amount of energy that is required for particle breakage.
4.2. Wear Simulation
The wear simulation started after at least three revolutions at steady-state conditions, thus, allowing the wear simulation to be performed under stable conditions.
4.2.1. Particle Trajectory and Velocity
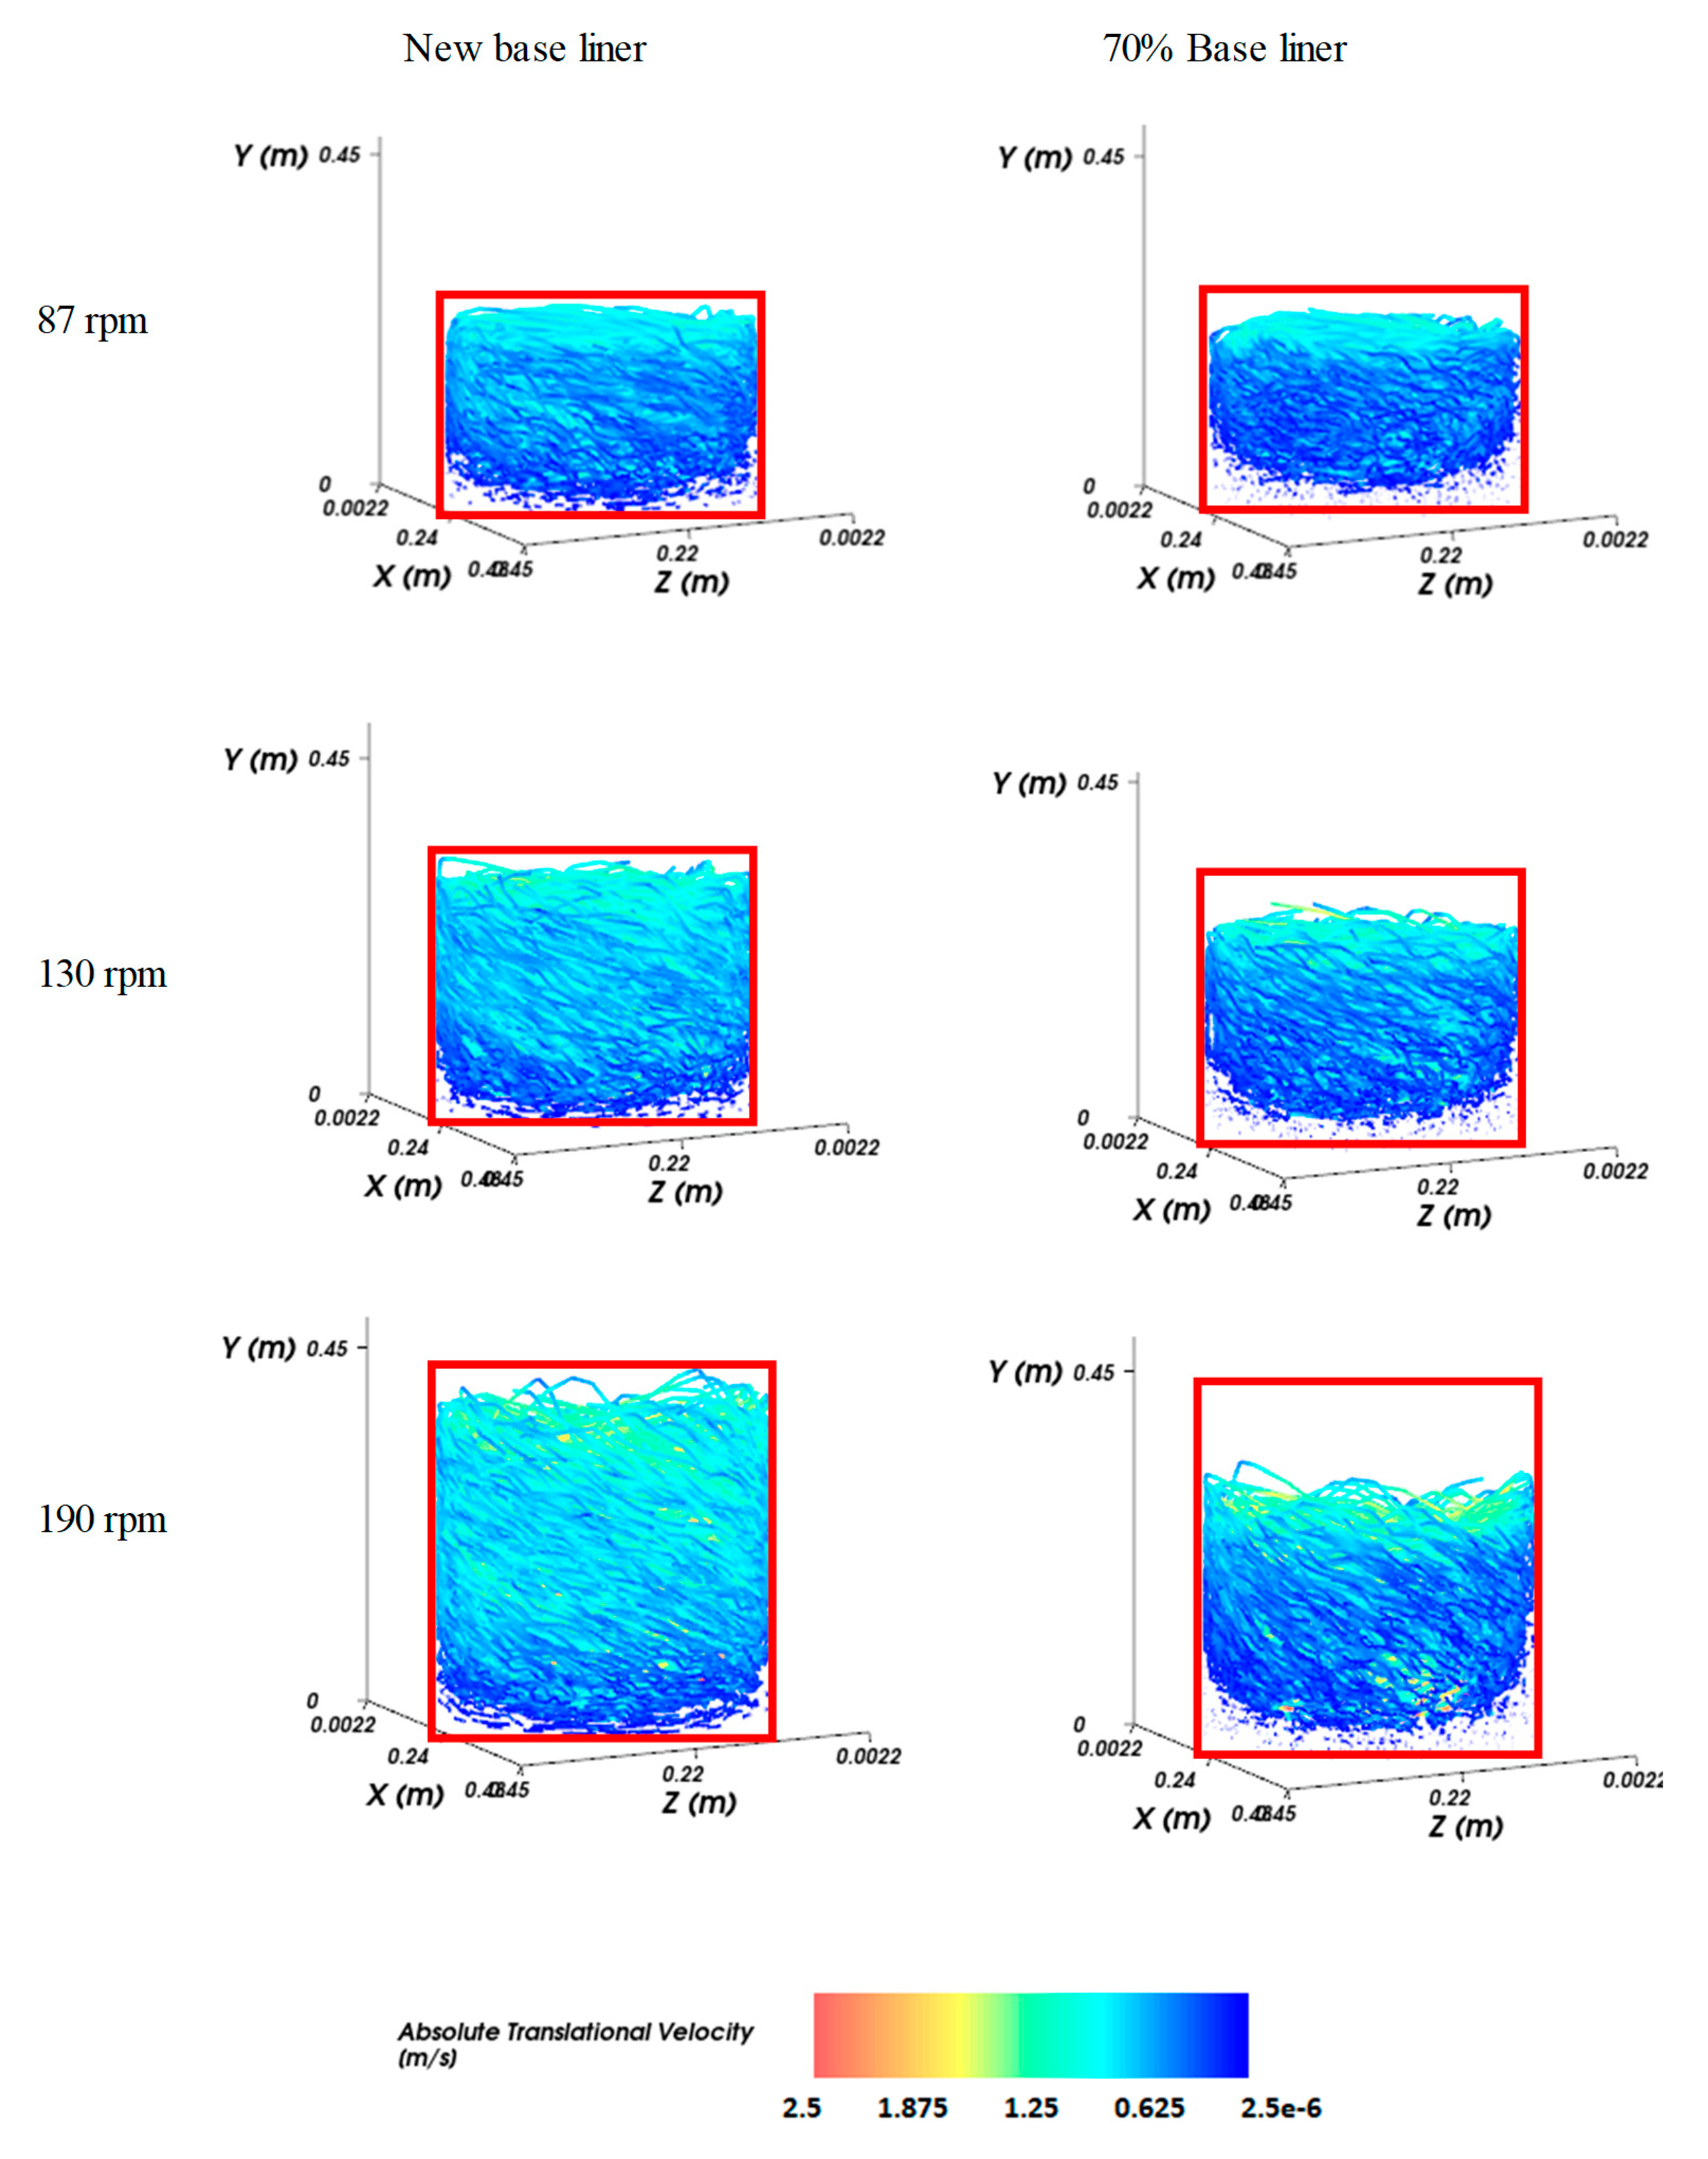
Figure 14 shows the streaming lines associated with particle absolute translational velocity.
A red box surrounds the grinding media trajectory for the new liner condition, shown in the left side of the image. Comparing the left and right side of the picture, it can be noted that red boxes on the right side miss the streaming lines both at the top and bottom parts of the mill. This indicates that media motion is negligible in those regions. In the bottom part of the mill, it is noted that the dead zone effect is emphasized by liner wear.
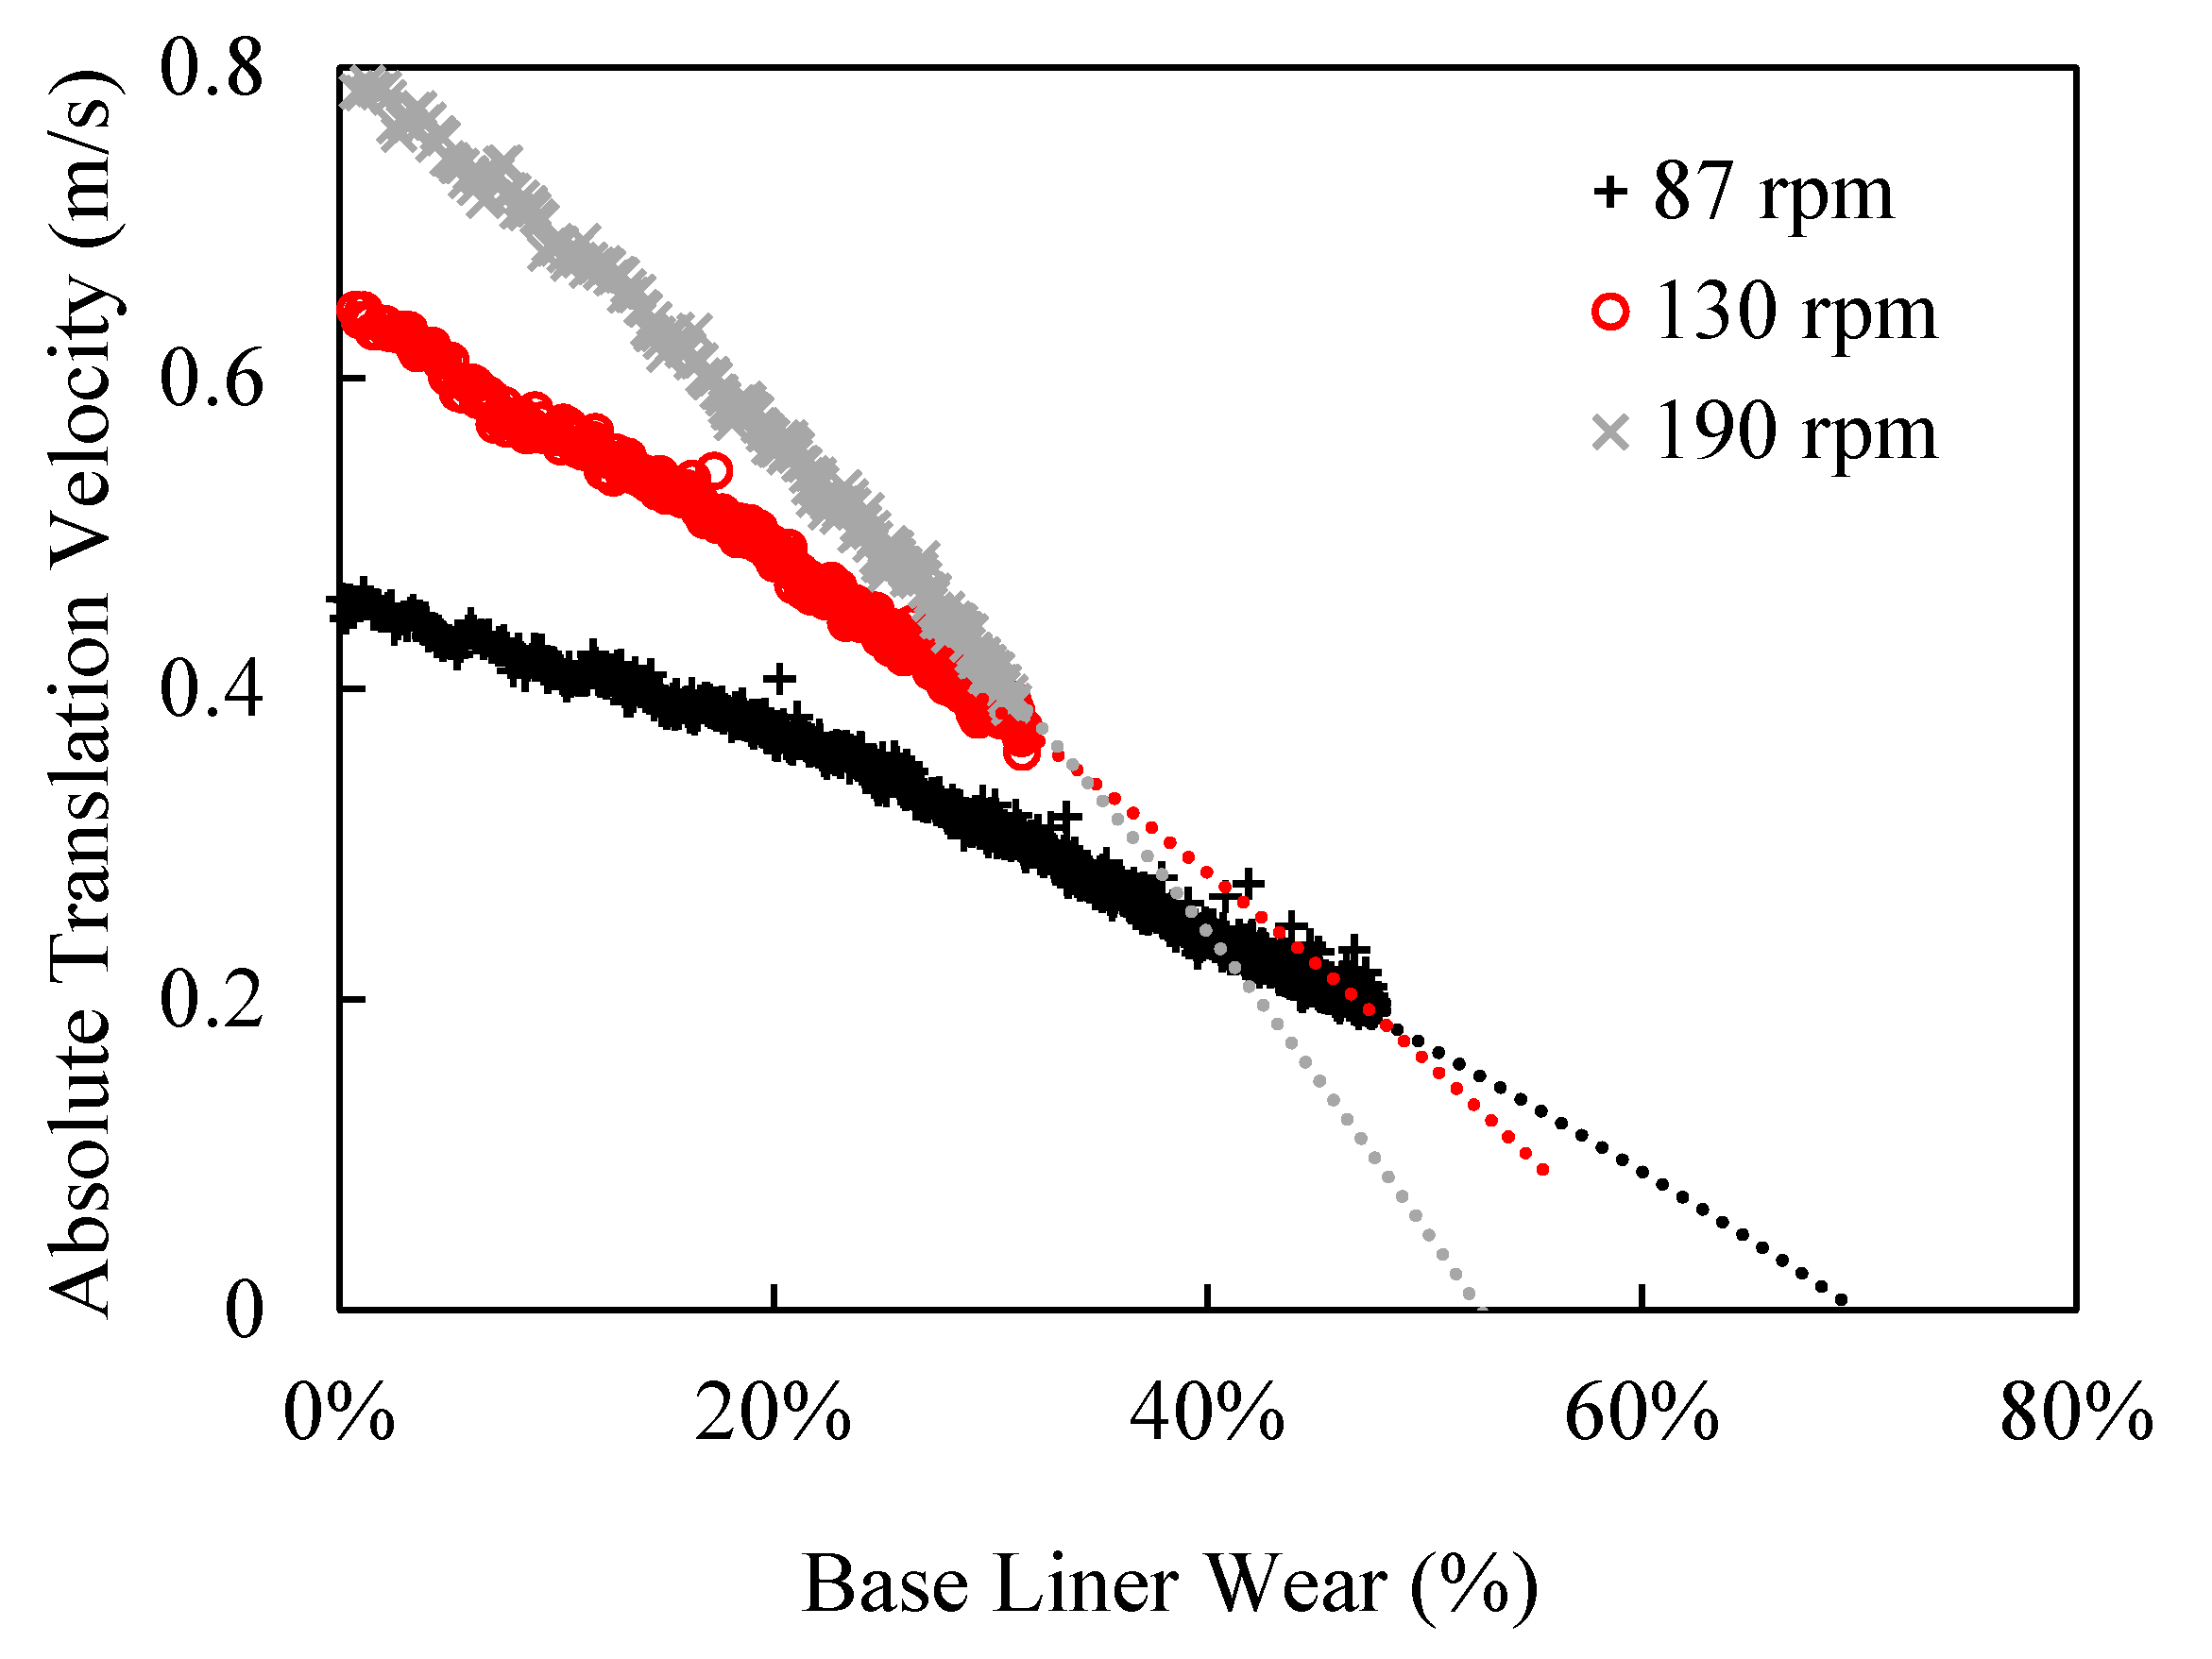
Figure 15 shows the relationship between particle absolute translational velocity and the base liner wear. It is possible to note that particle velocity reduces with wear, due to the reduction in the liner surface area. This reduction is more aggressive for higher agitator velocities. This means that a more representative decrease in particle velocity is obtained when operating at higher agitator velocity. Based on the extrapolated data, it can be expected that particle velocity will be independent on agitator velocity when the base liner is approximately 40% to 50% worn.
4.2.2. Power
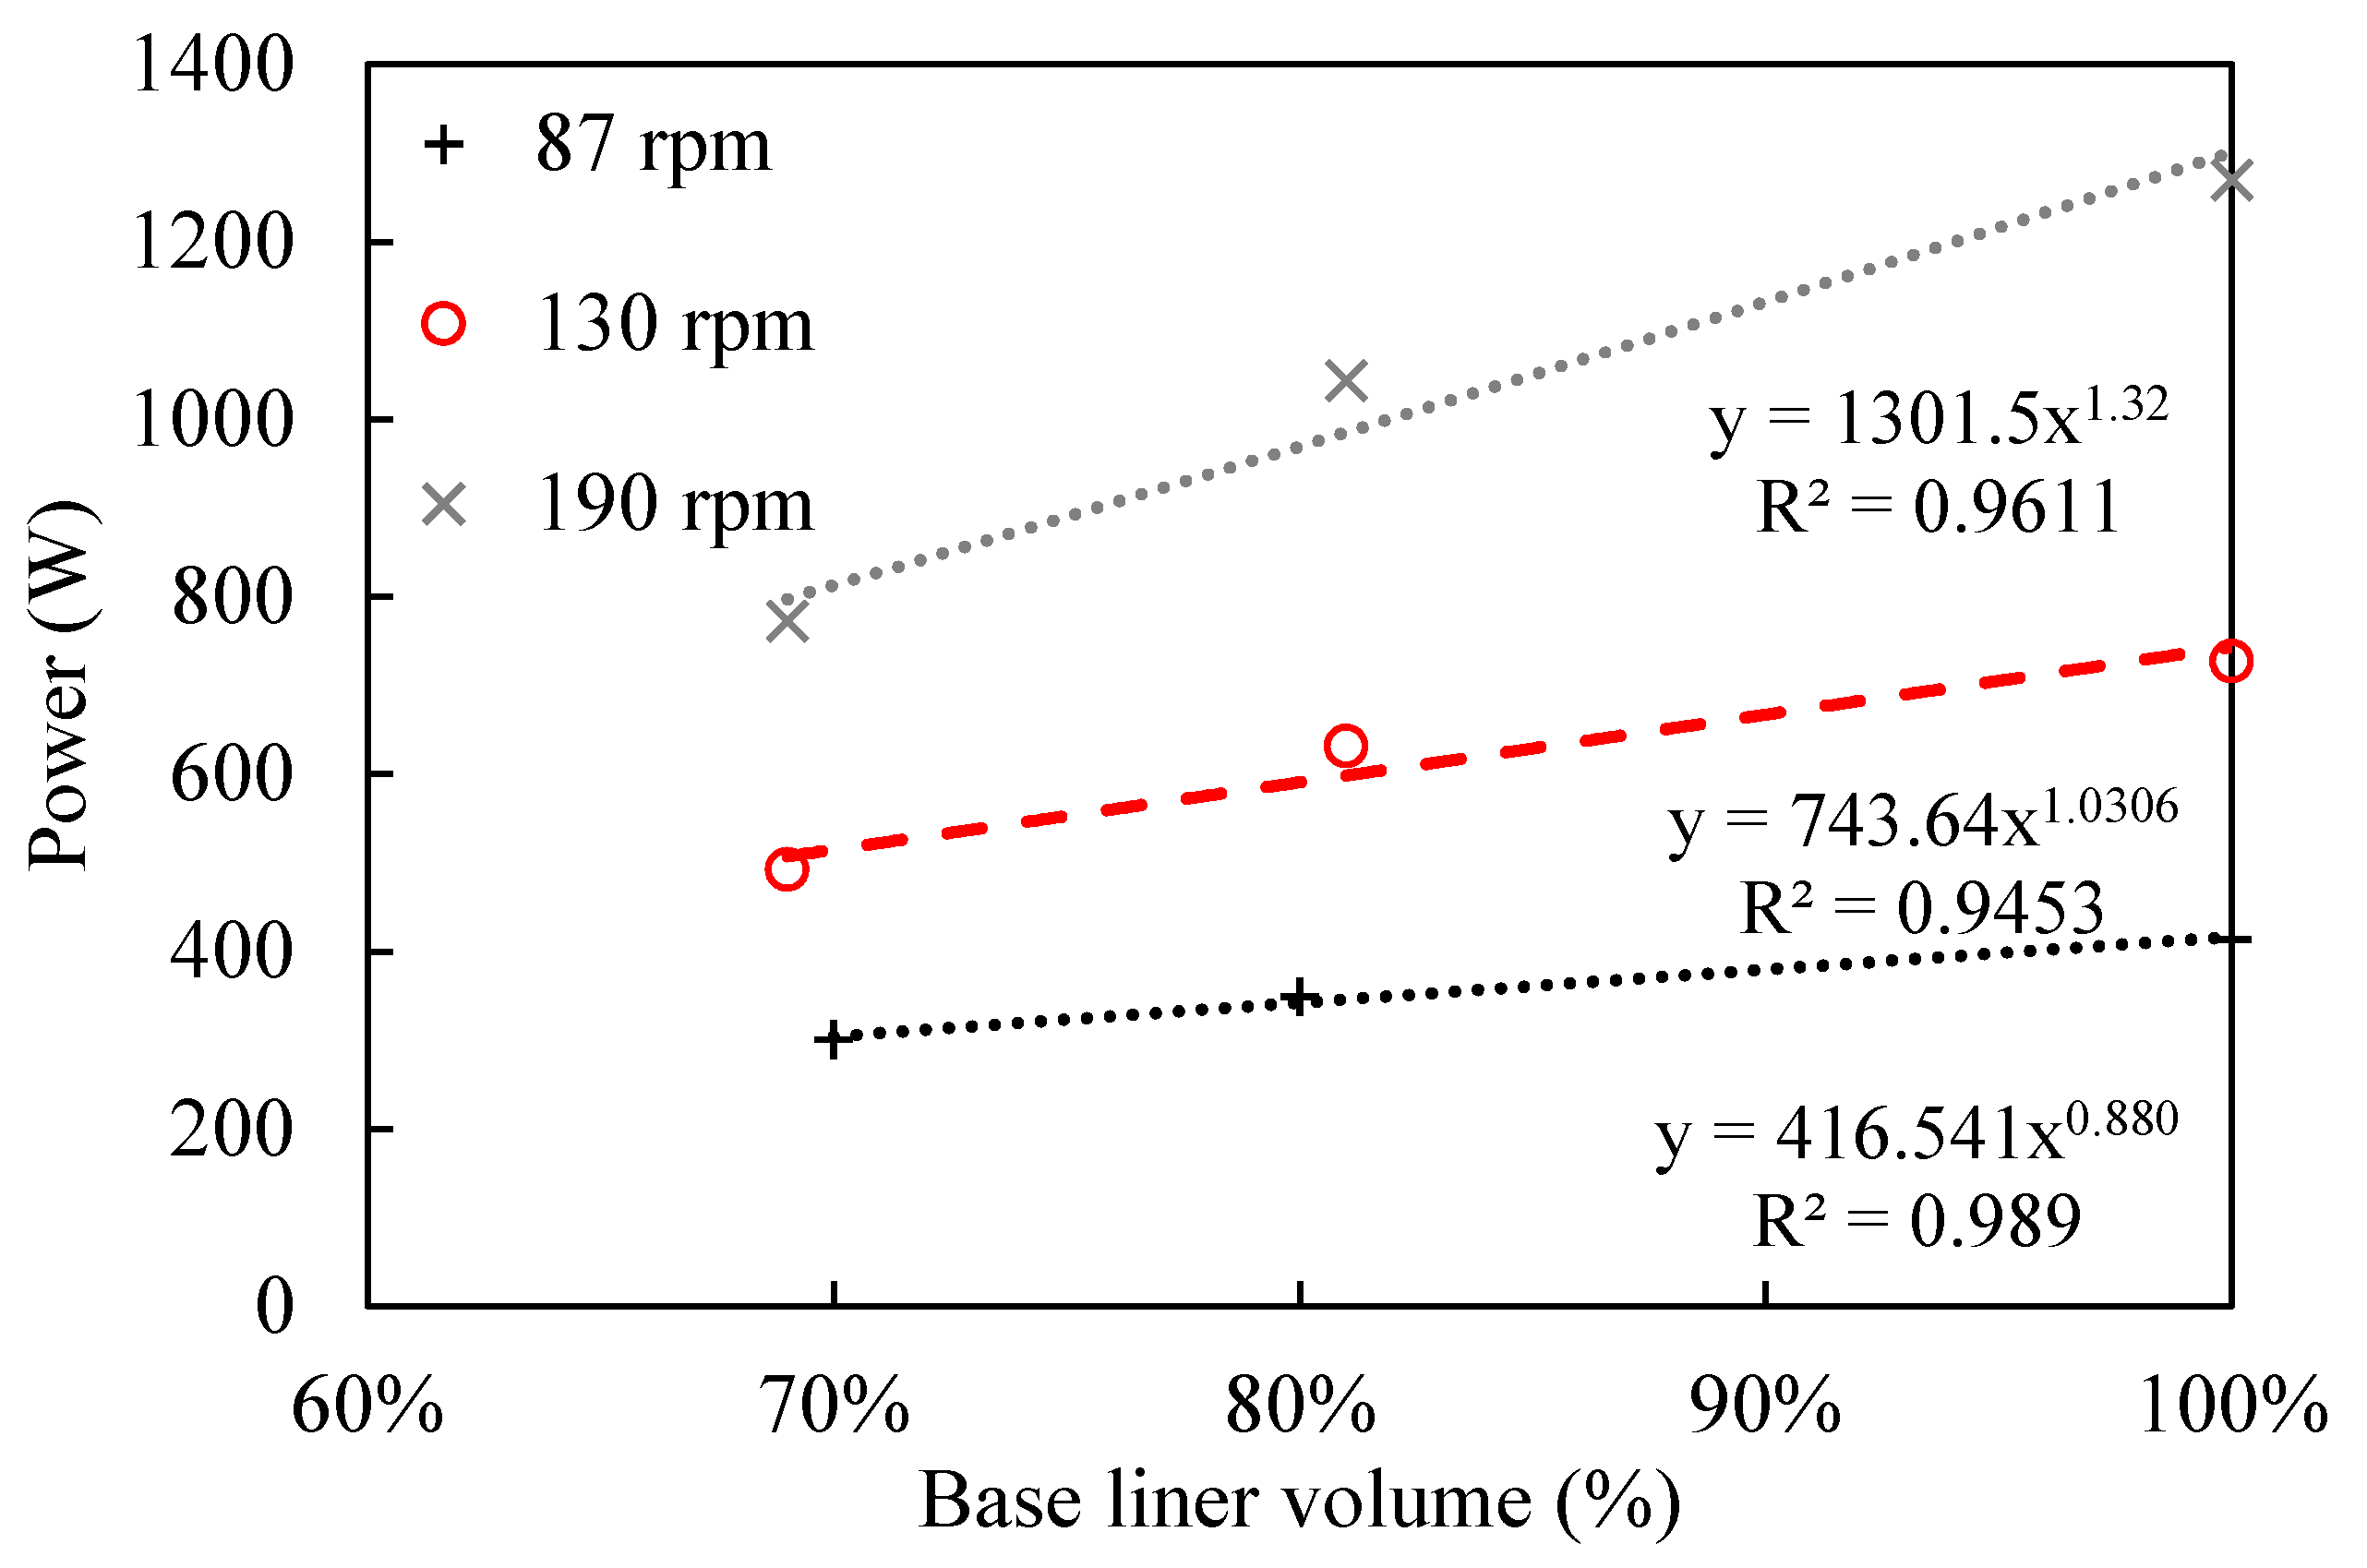
Figure 16 shows the relationship between base liner volume and simulation power. It is possible to note that power reduction is intensified at higher rotational velocities. In the operational context, the power is kept constant during the liner lifecycle by increasing mill filling.
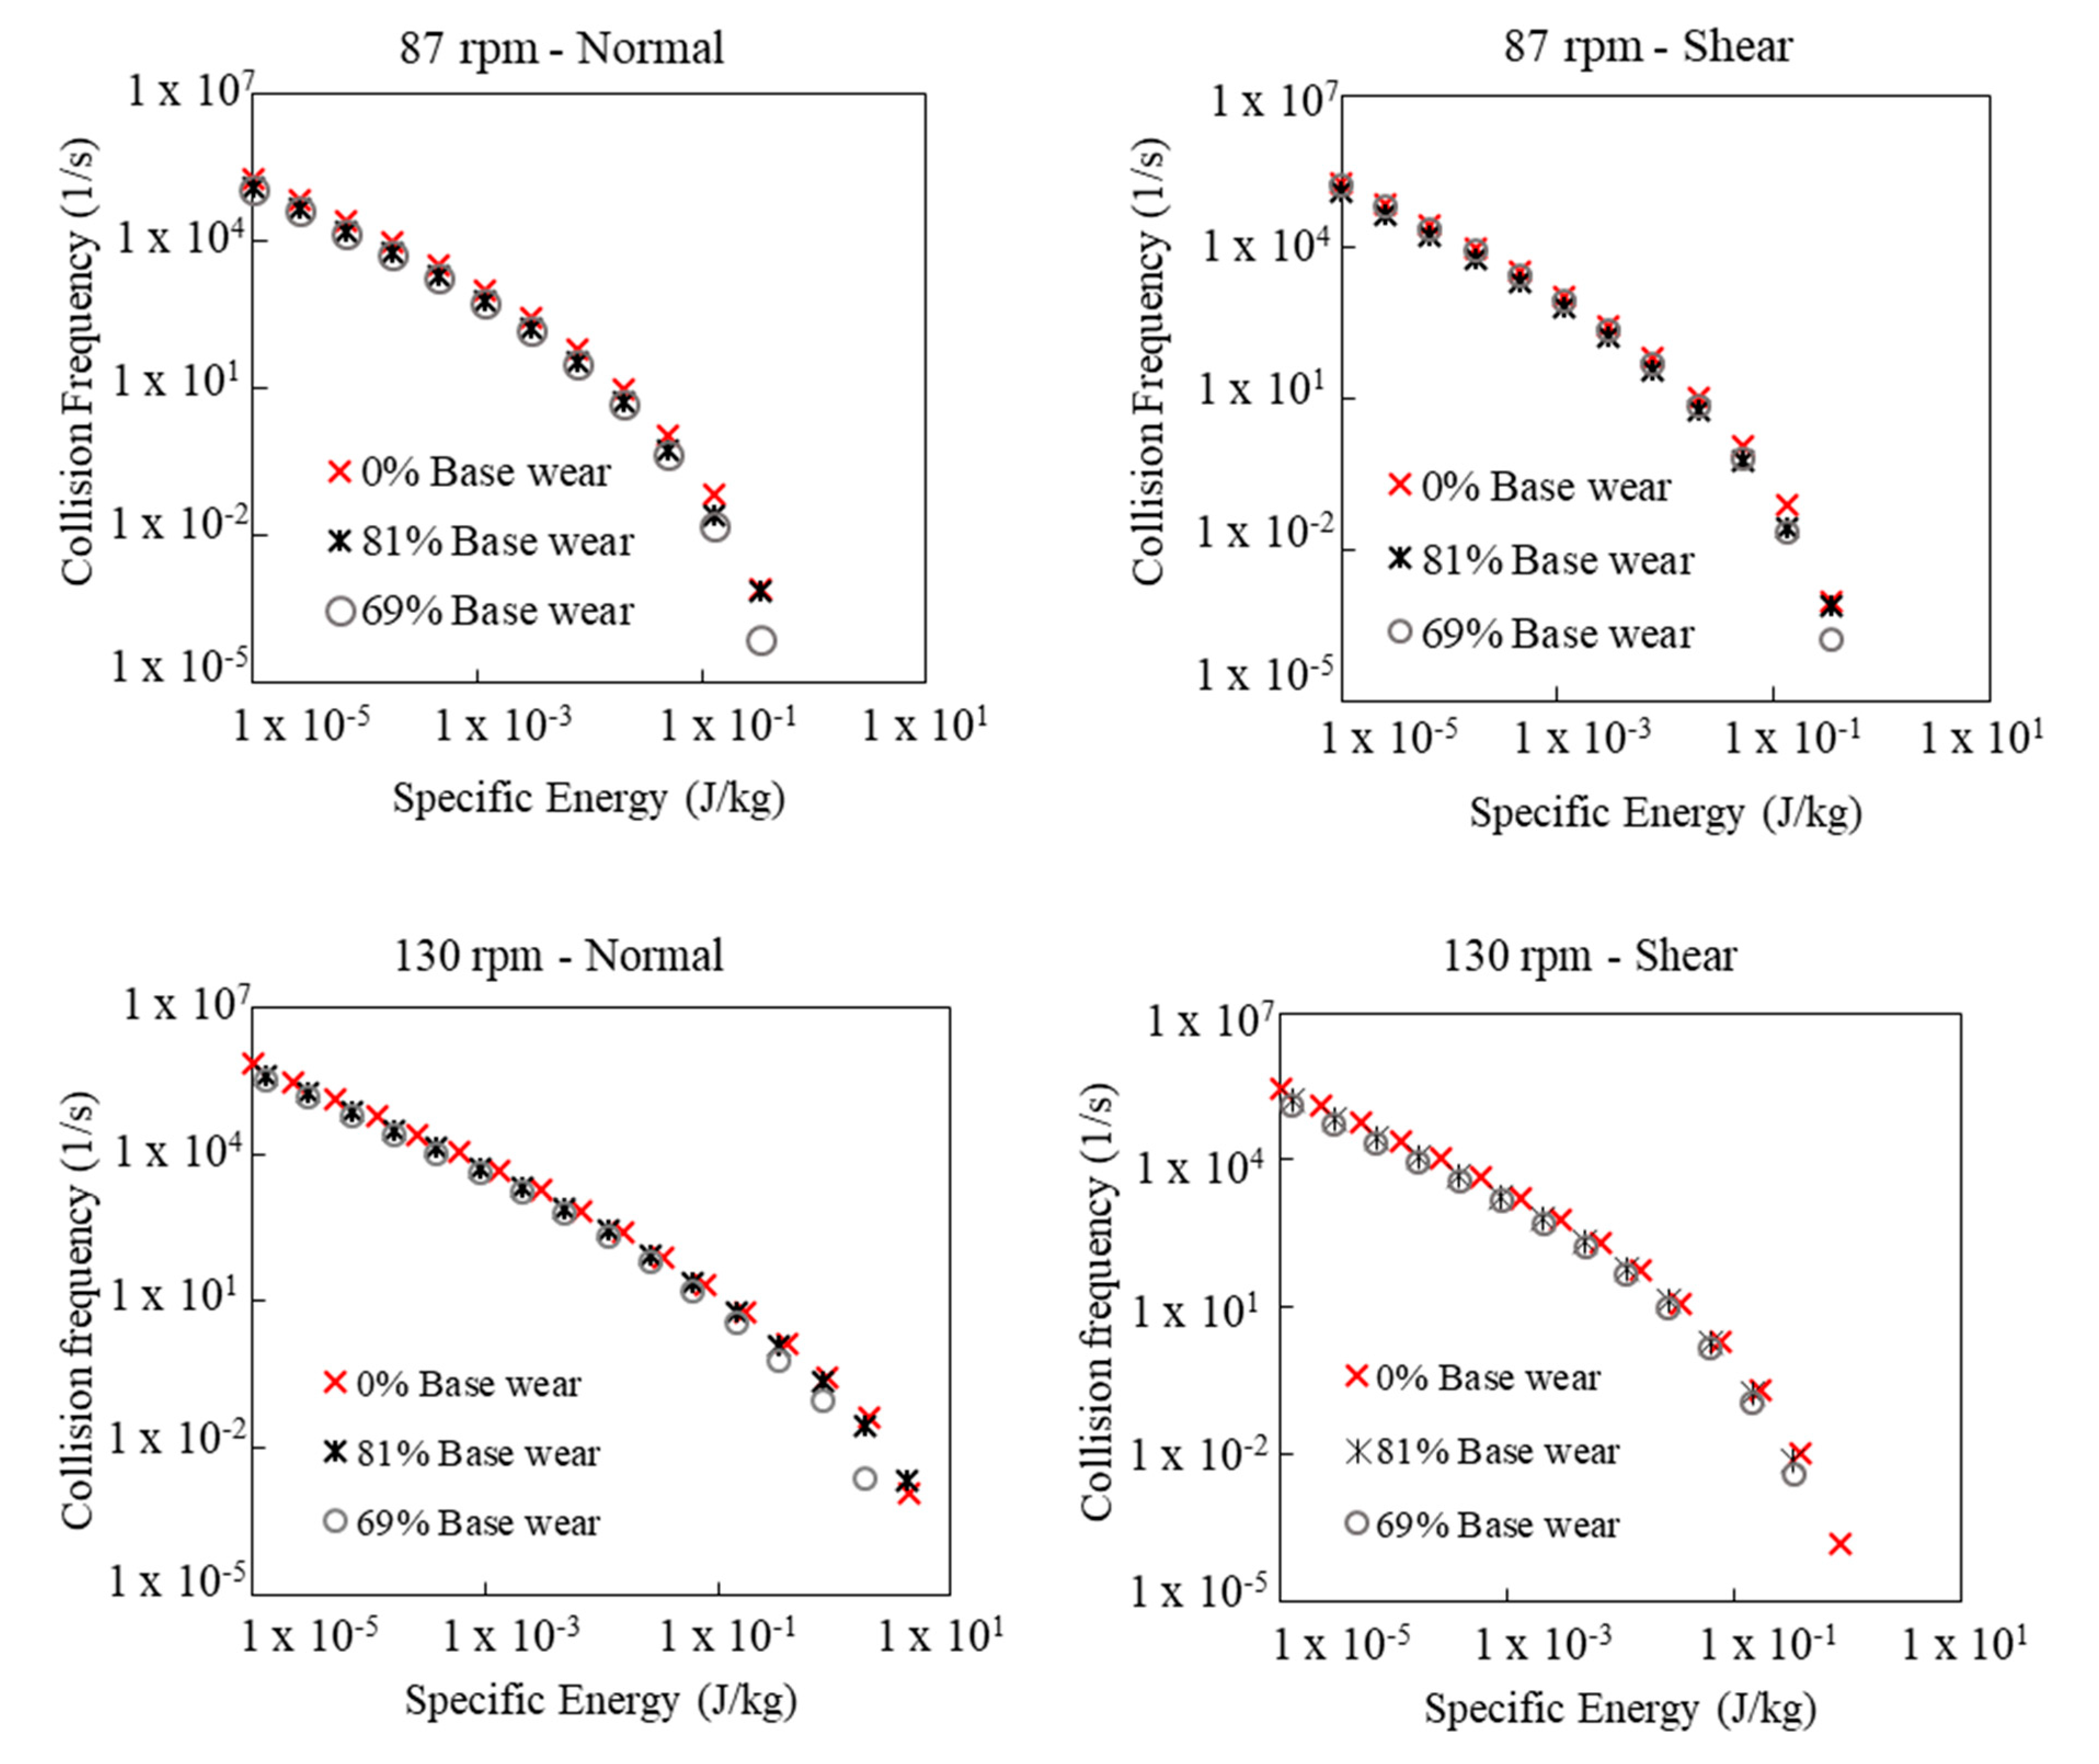
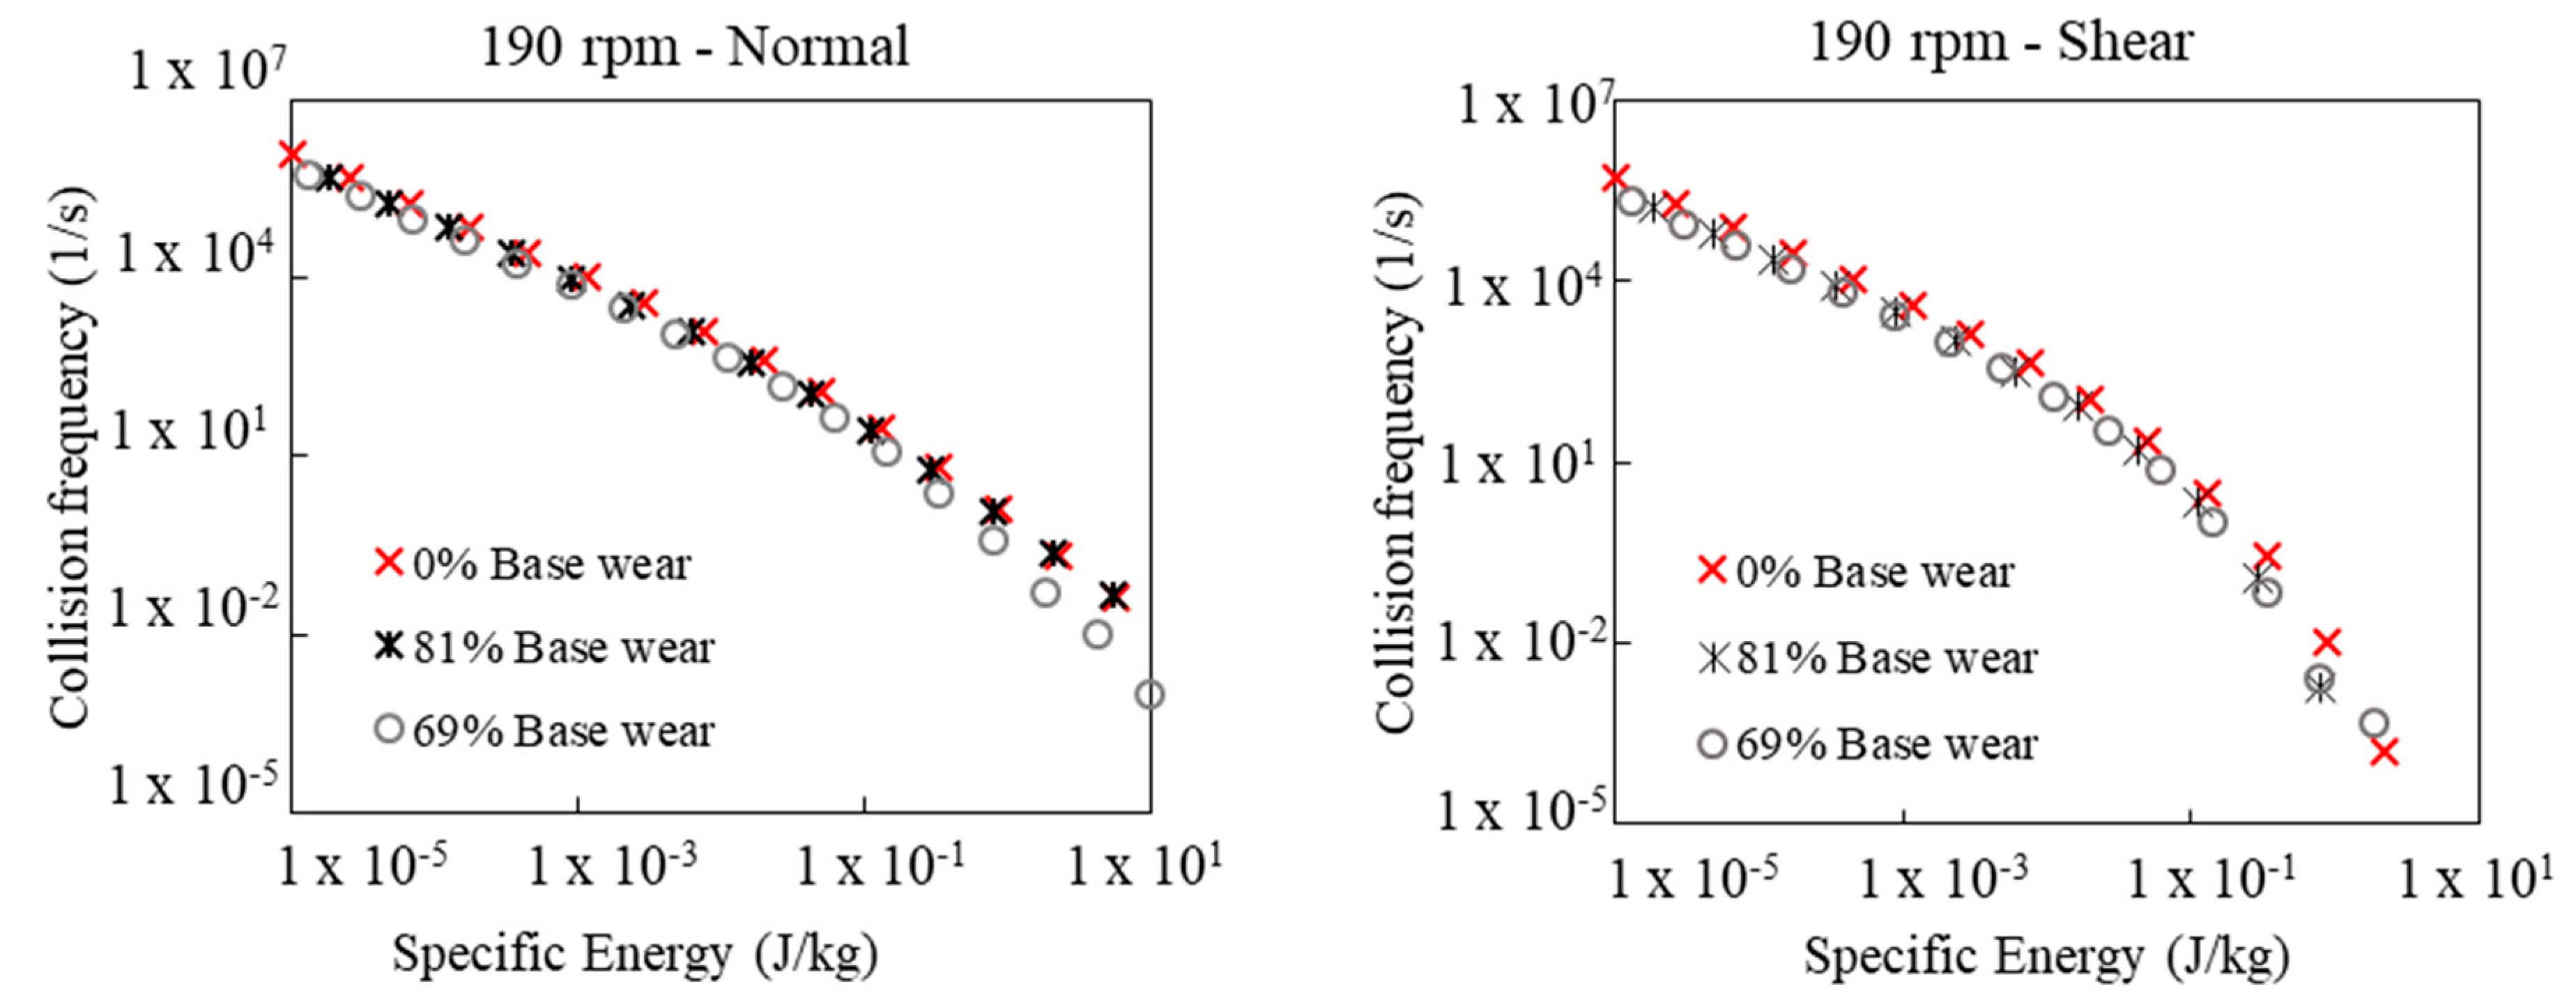
4.2.3. Particle Spectrum
Figure 17 shows normal and shear energy spectrums for the three operational velocities, at different wear stages. By comparing shear (right) and normal (left) collision spectra, it is possible to note that normal contacts are more affected by wear. In this sense, a greater reduction in the collision frequency was observed for normal contacts, in comparison to shear. This reduction is emphasized at greater specific energies, especially above 1 × 10
−1 J/kg. Based on the idea that collisions of greater specific energies can lead to an inefficient use of energy, it can be suggested that wear scenarios can be related to a better energy use behavior. This indicates that the agitator wear pattern affects mostly high energy contact, while maintaining low energy contacts that present a better energy efficiency behavior. However, it is important to emphasize that the collision frequency and energy reduction will probably generate a coarser product, and thus, the better energy use behavior will be mainly caused by the overall power consumption reduction. Recently, Oliveira [
31] applied a mechanistical model to predict product size distribution by using the particle contact spectra obtained with DEM simulations. The simulation considered grinding media as the mill charge, in the absence of ore and slurry. By taking into consideration different proportions of shear power involved in inter particle collision, the model successfully predicted product size distribution of laboratory-scale experiment, for different solids concentration ratios. In this sense, this model can be applied to quantify the wear effect on product size distribution.
In the operational context, it is important to evaluate the effect on the target product size, such as mineral liberation, to prevent mineral losses in further beneficiation processes. In this sense, a wider evaluation is necessary to guarantee the overall process efficiency, which includes a proper understanding of the effect on the downstream process. As an alternative, various operational conditions can be approached to guarantee the obtaining of the target mineral product size, while maximizing energy efficiency. In the specific case of the Mins-Rio project, the product requirement is in relation to fines generation, for pipeline transport requirements. In this sense, it is necessary to evaluate the effect on fines generation to guarantee the product adequacy.
Comparing the collision spectra behavior at different mill rotational velocities it can be noted that higher rotational velocities intensified the overall collision frequency reduction, such as reduced the maximum value of specific energy (J/kg). This explains the greater power reduction observed for this rotational velocity.
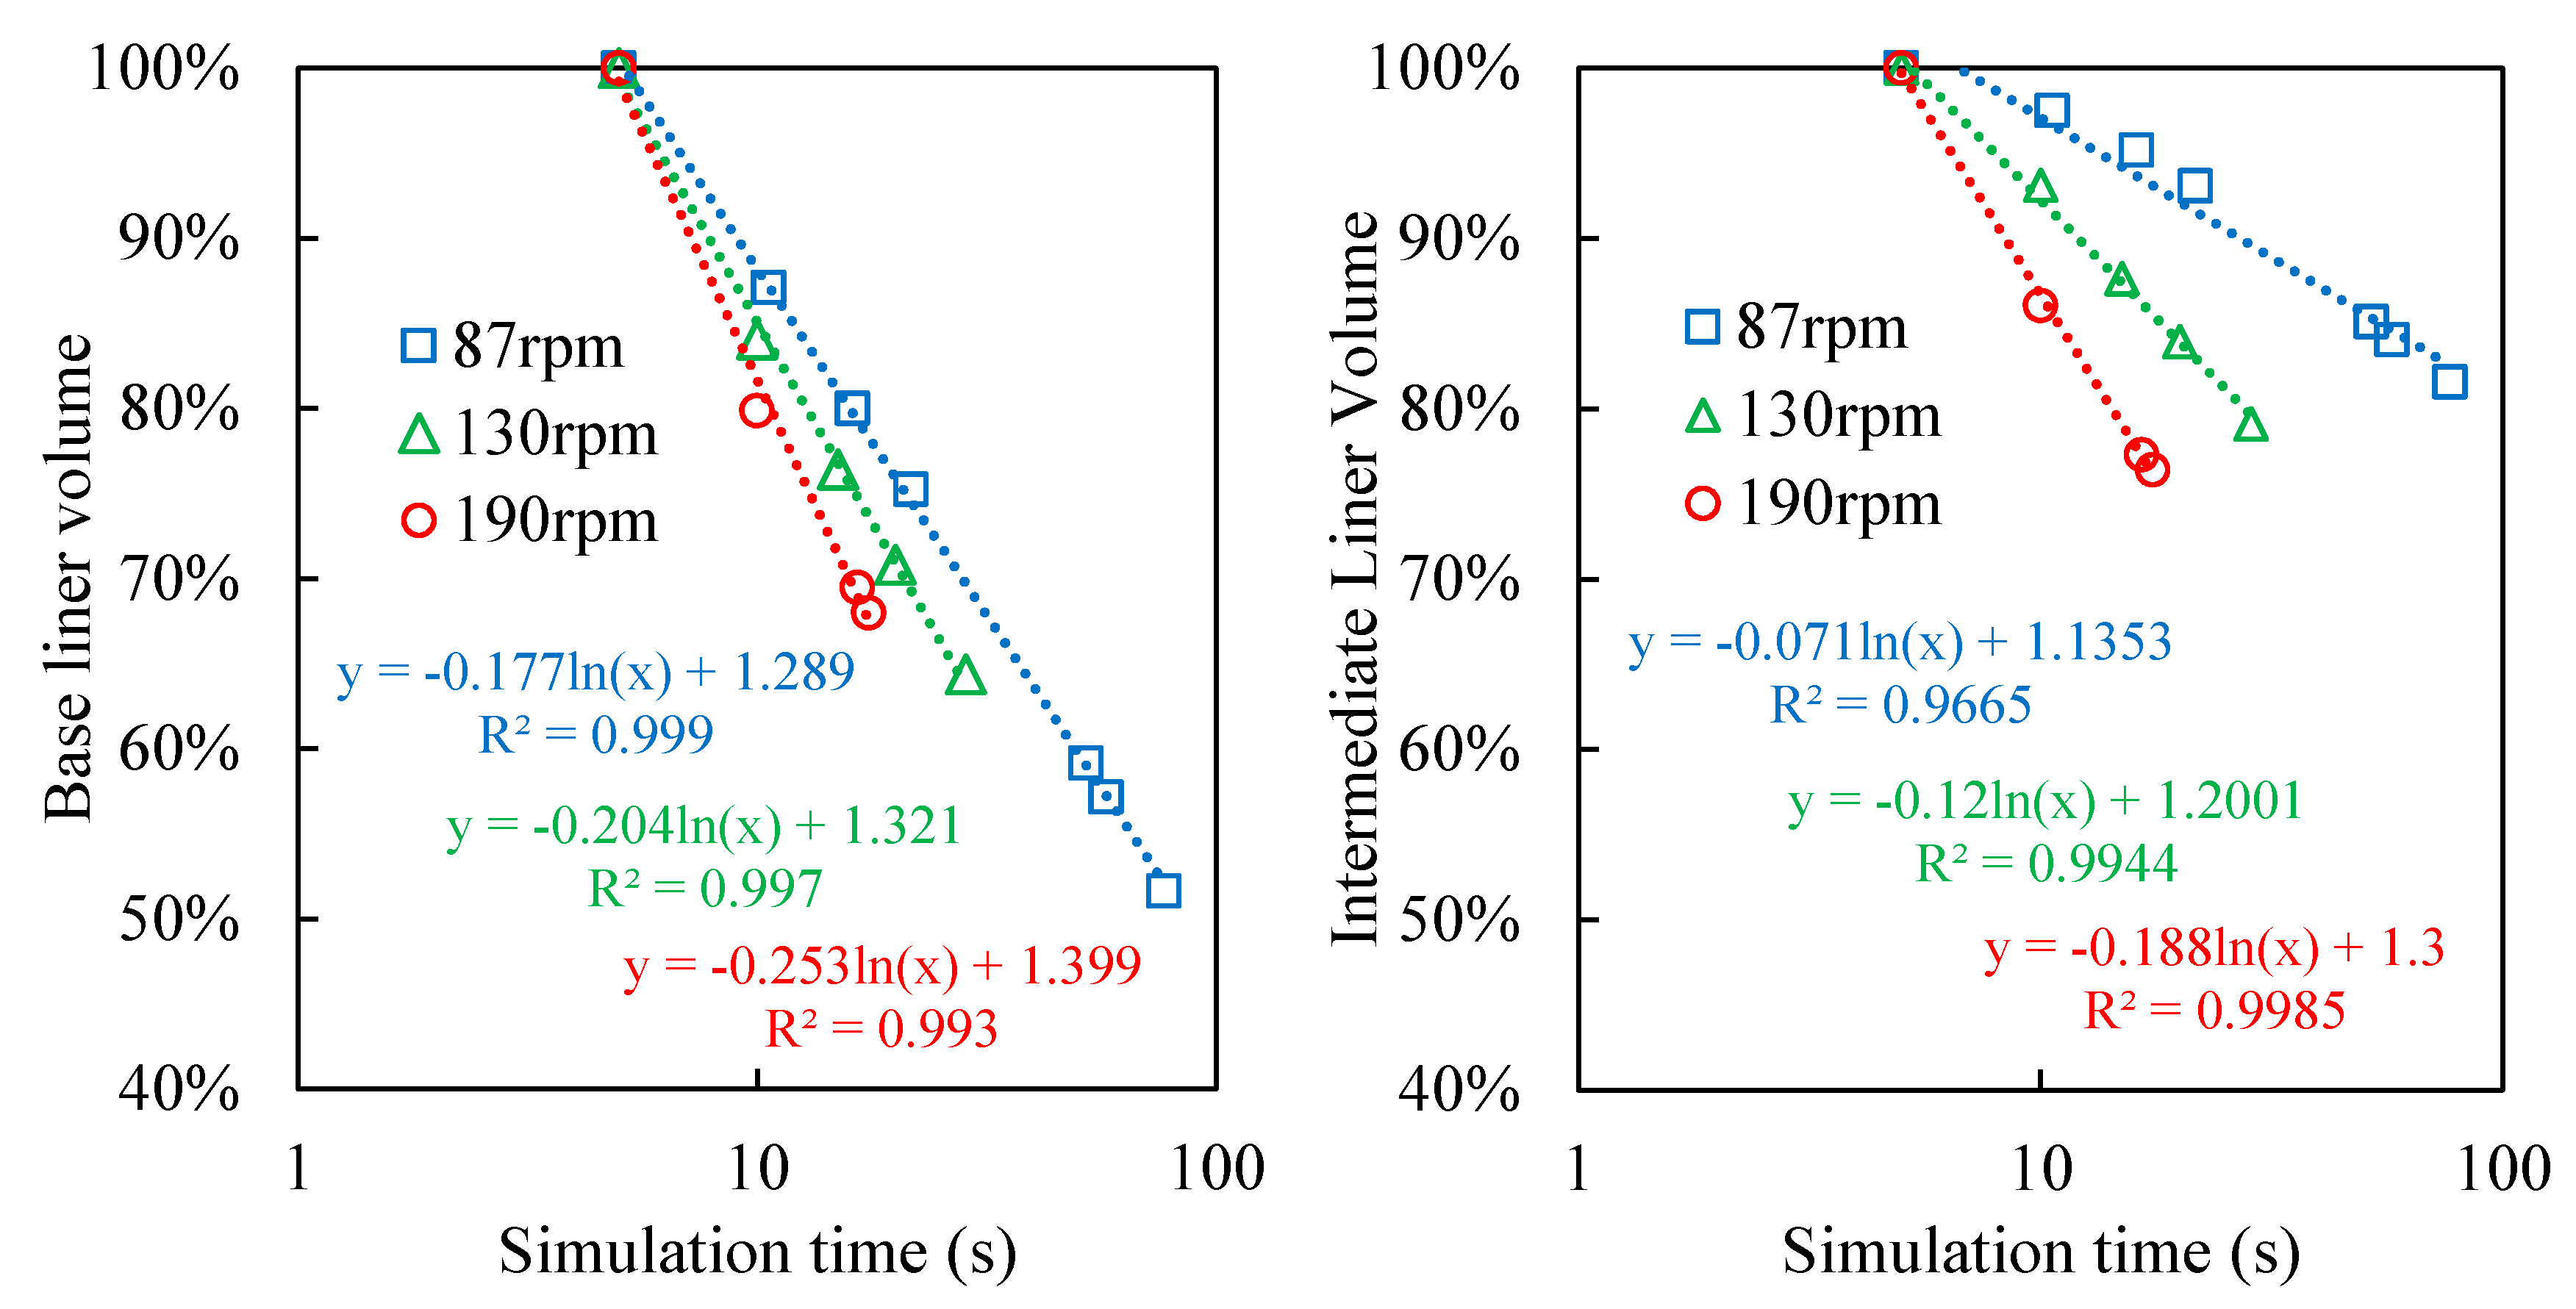
4.2.4. Wear Volume
The relationship between the liner volume and simulation time is shown in
Figure 18 for the base and intermediate liner parts. It can be noted that wear is more intensive in the base liner, resulting in a more representative volume reduction. The increase in the agitator velocity also intensifies wear. This effect is more representative of the intermediate liner part. This is a consequence of a wider distribution of particle trajectory when operating at higher rotational velocity, as shown in
Figure 18.
4.3. VTM-1500 Wear Measurement
Based on the three-dimensional scanning of VTM-1500 liner parts, [
30] presented the relationship between operational hours and liner mass, separately for the base and intermediate liner parts.
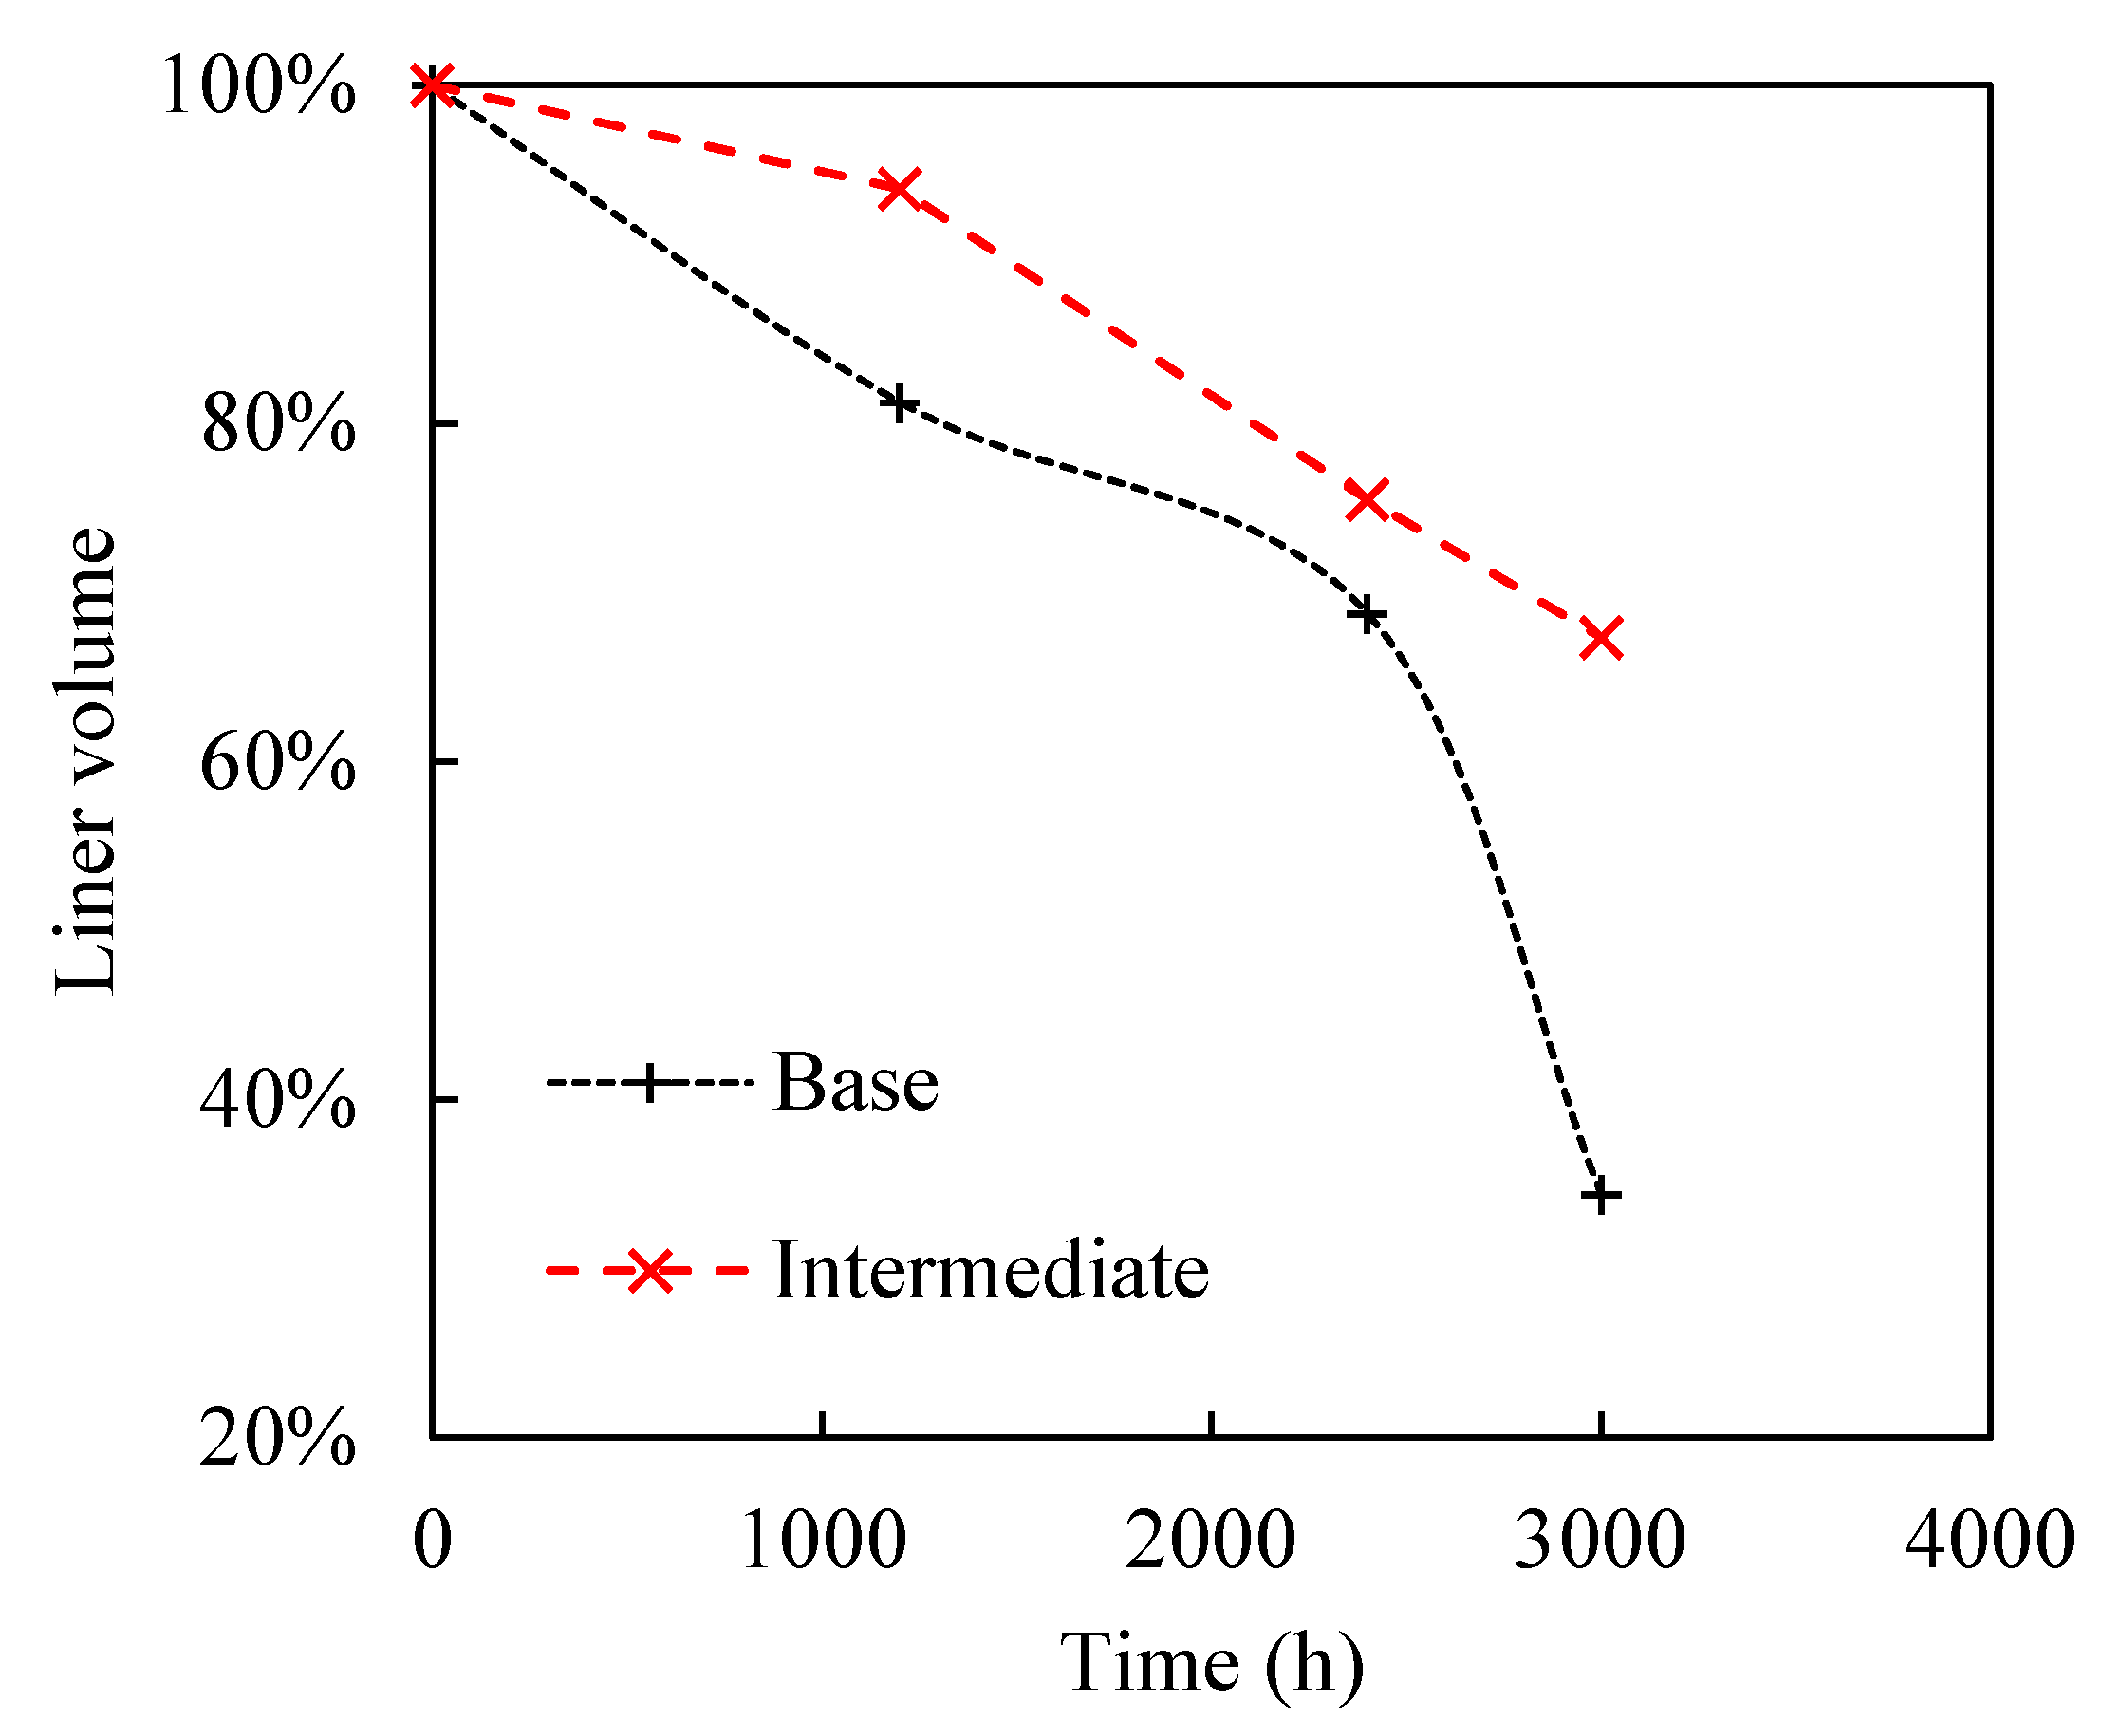
The absolute mass value was converted as liner volume percentage, and are presented in
Figure 19, in relation to the operational time. The wear ratio is defined as the relationship between wear percentage and operational time.
The liner volume comparison between the two liner parts reinforces that wear is more aggressive in the base liner. In this sense, at the end of the lifecycle, or 3000 h, the intermediate liner reached approximately 67% of the initial volume, while the base liner reached 35.5% of its initial volume. Because of that, the base liner requires sooner and more frequent replacement. Moreover, the base liner wear ratio significantly increases after 2000 h.
4.4. DEM Wear Modeling
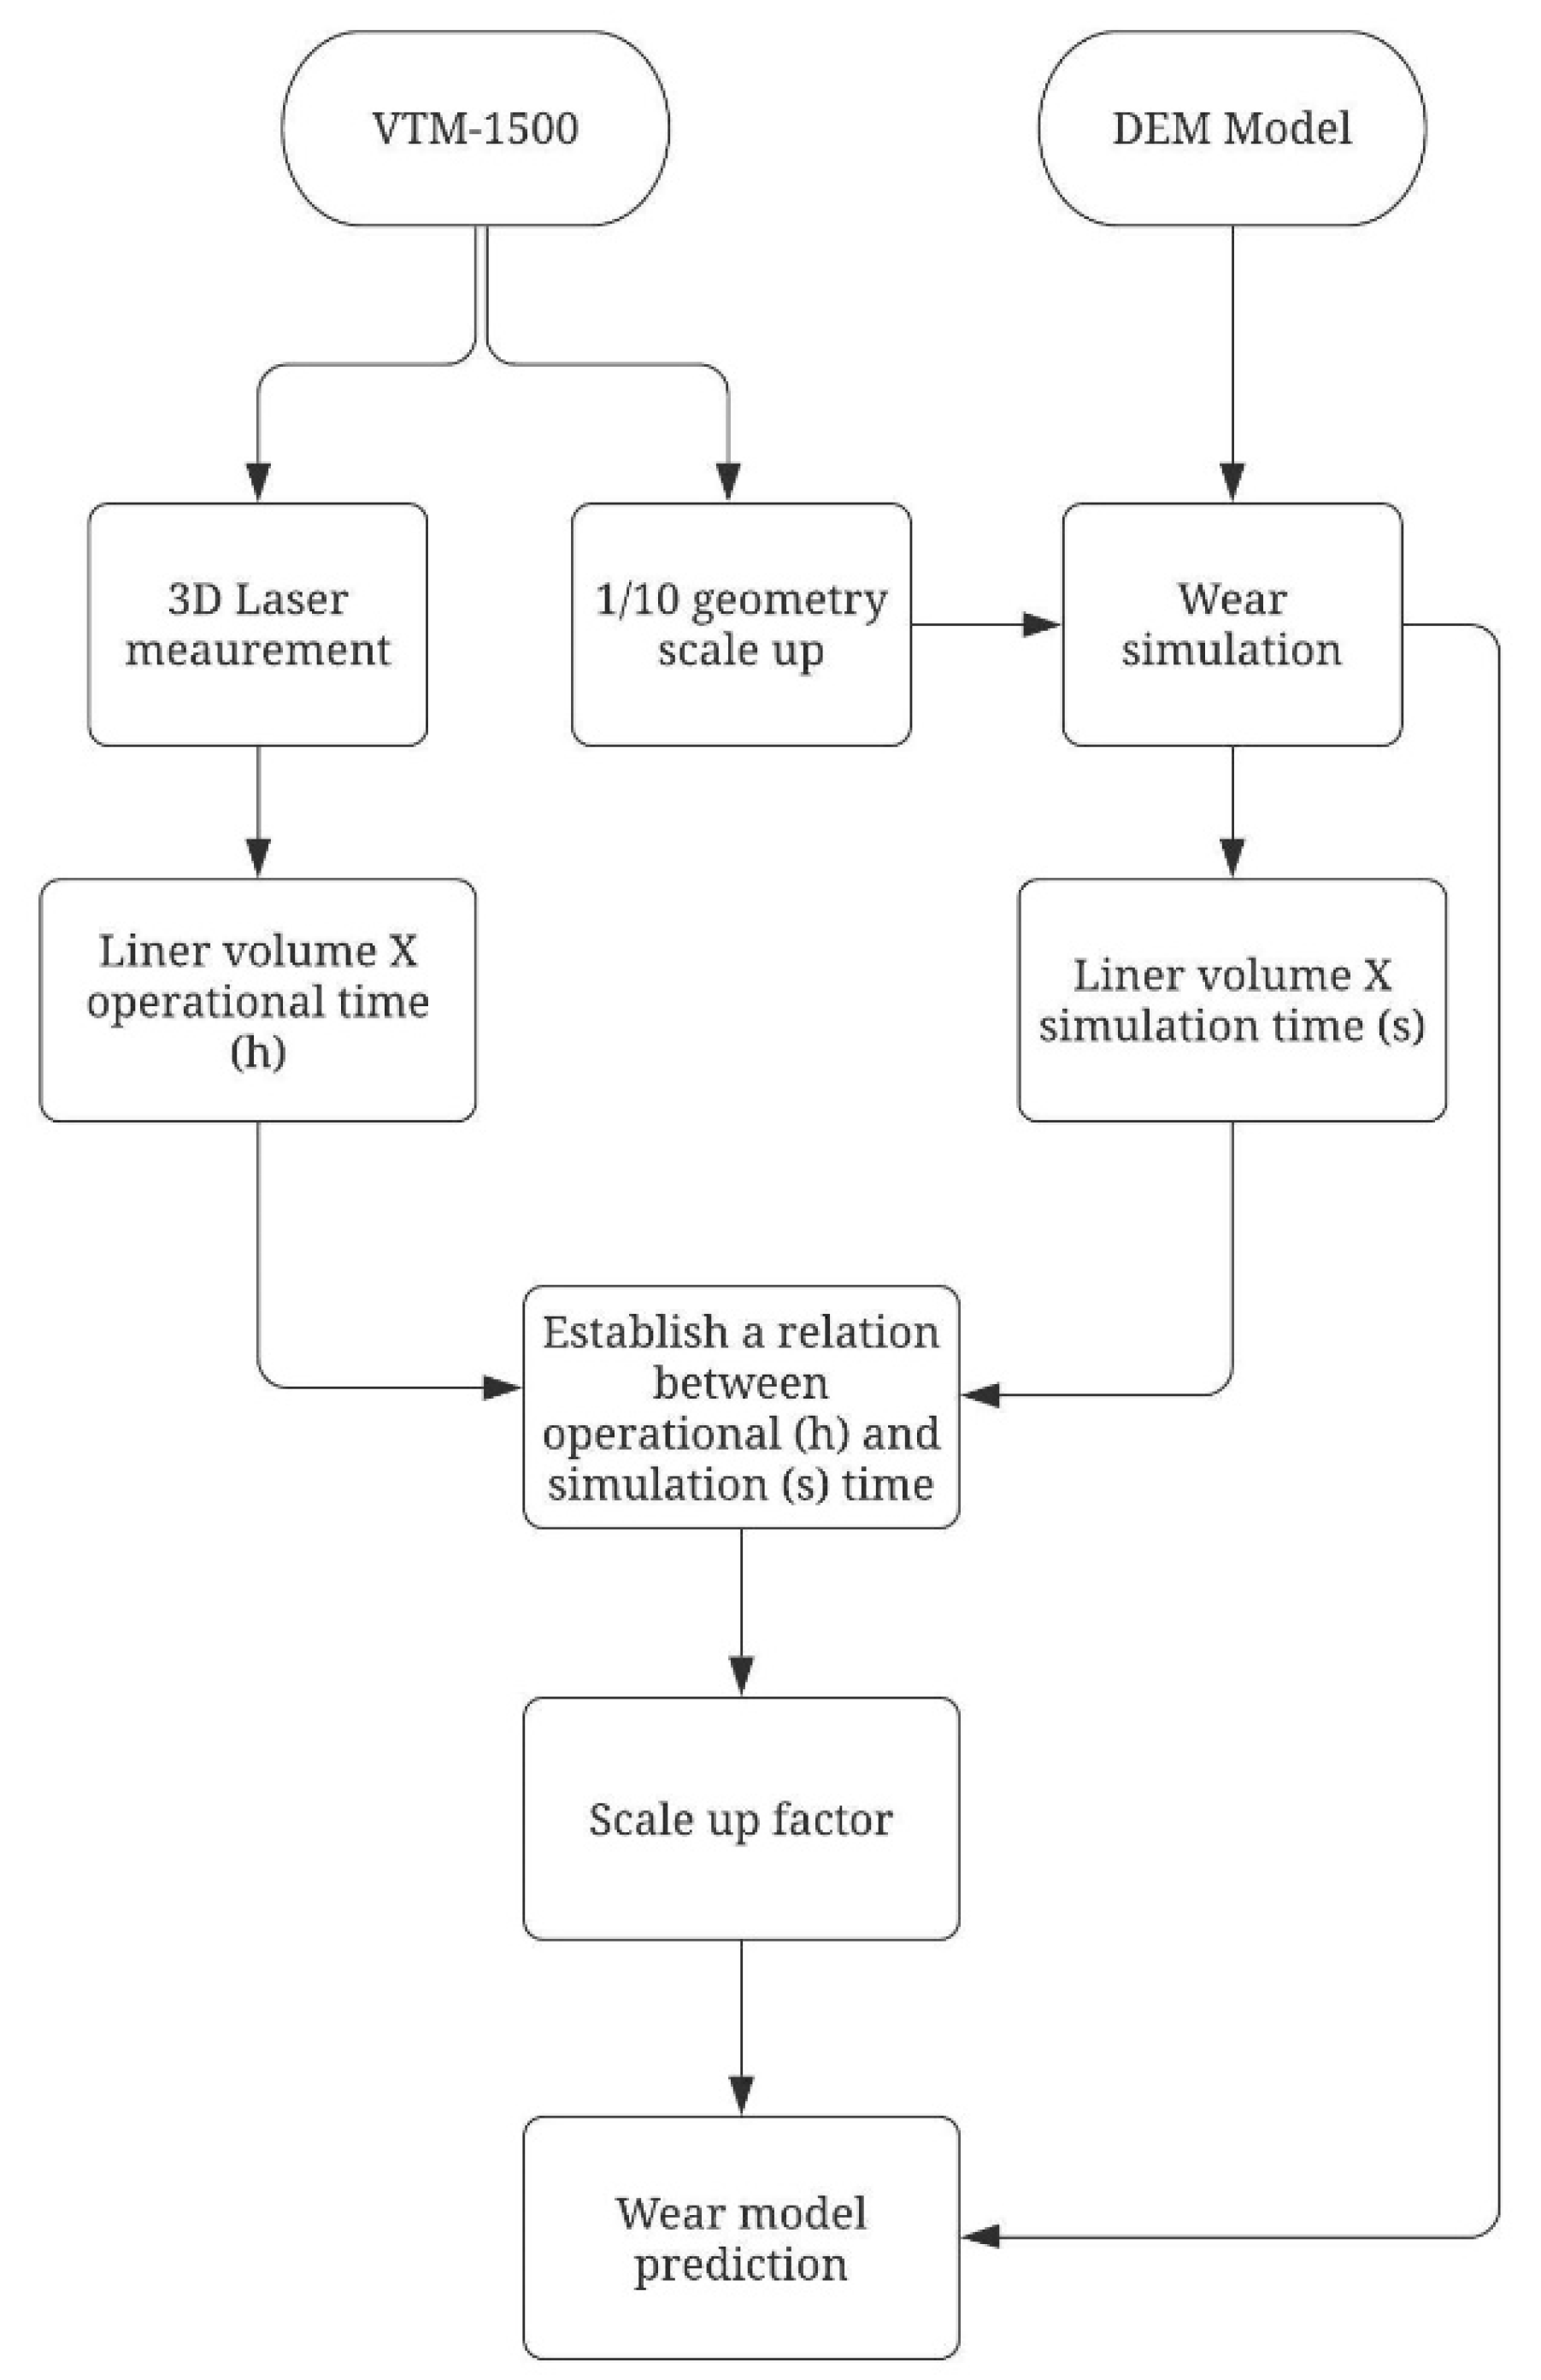
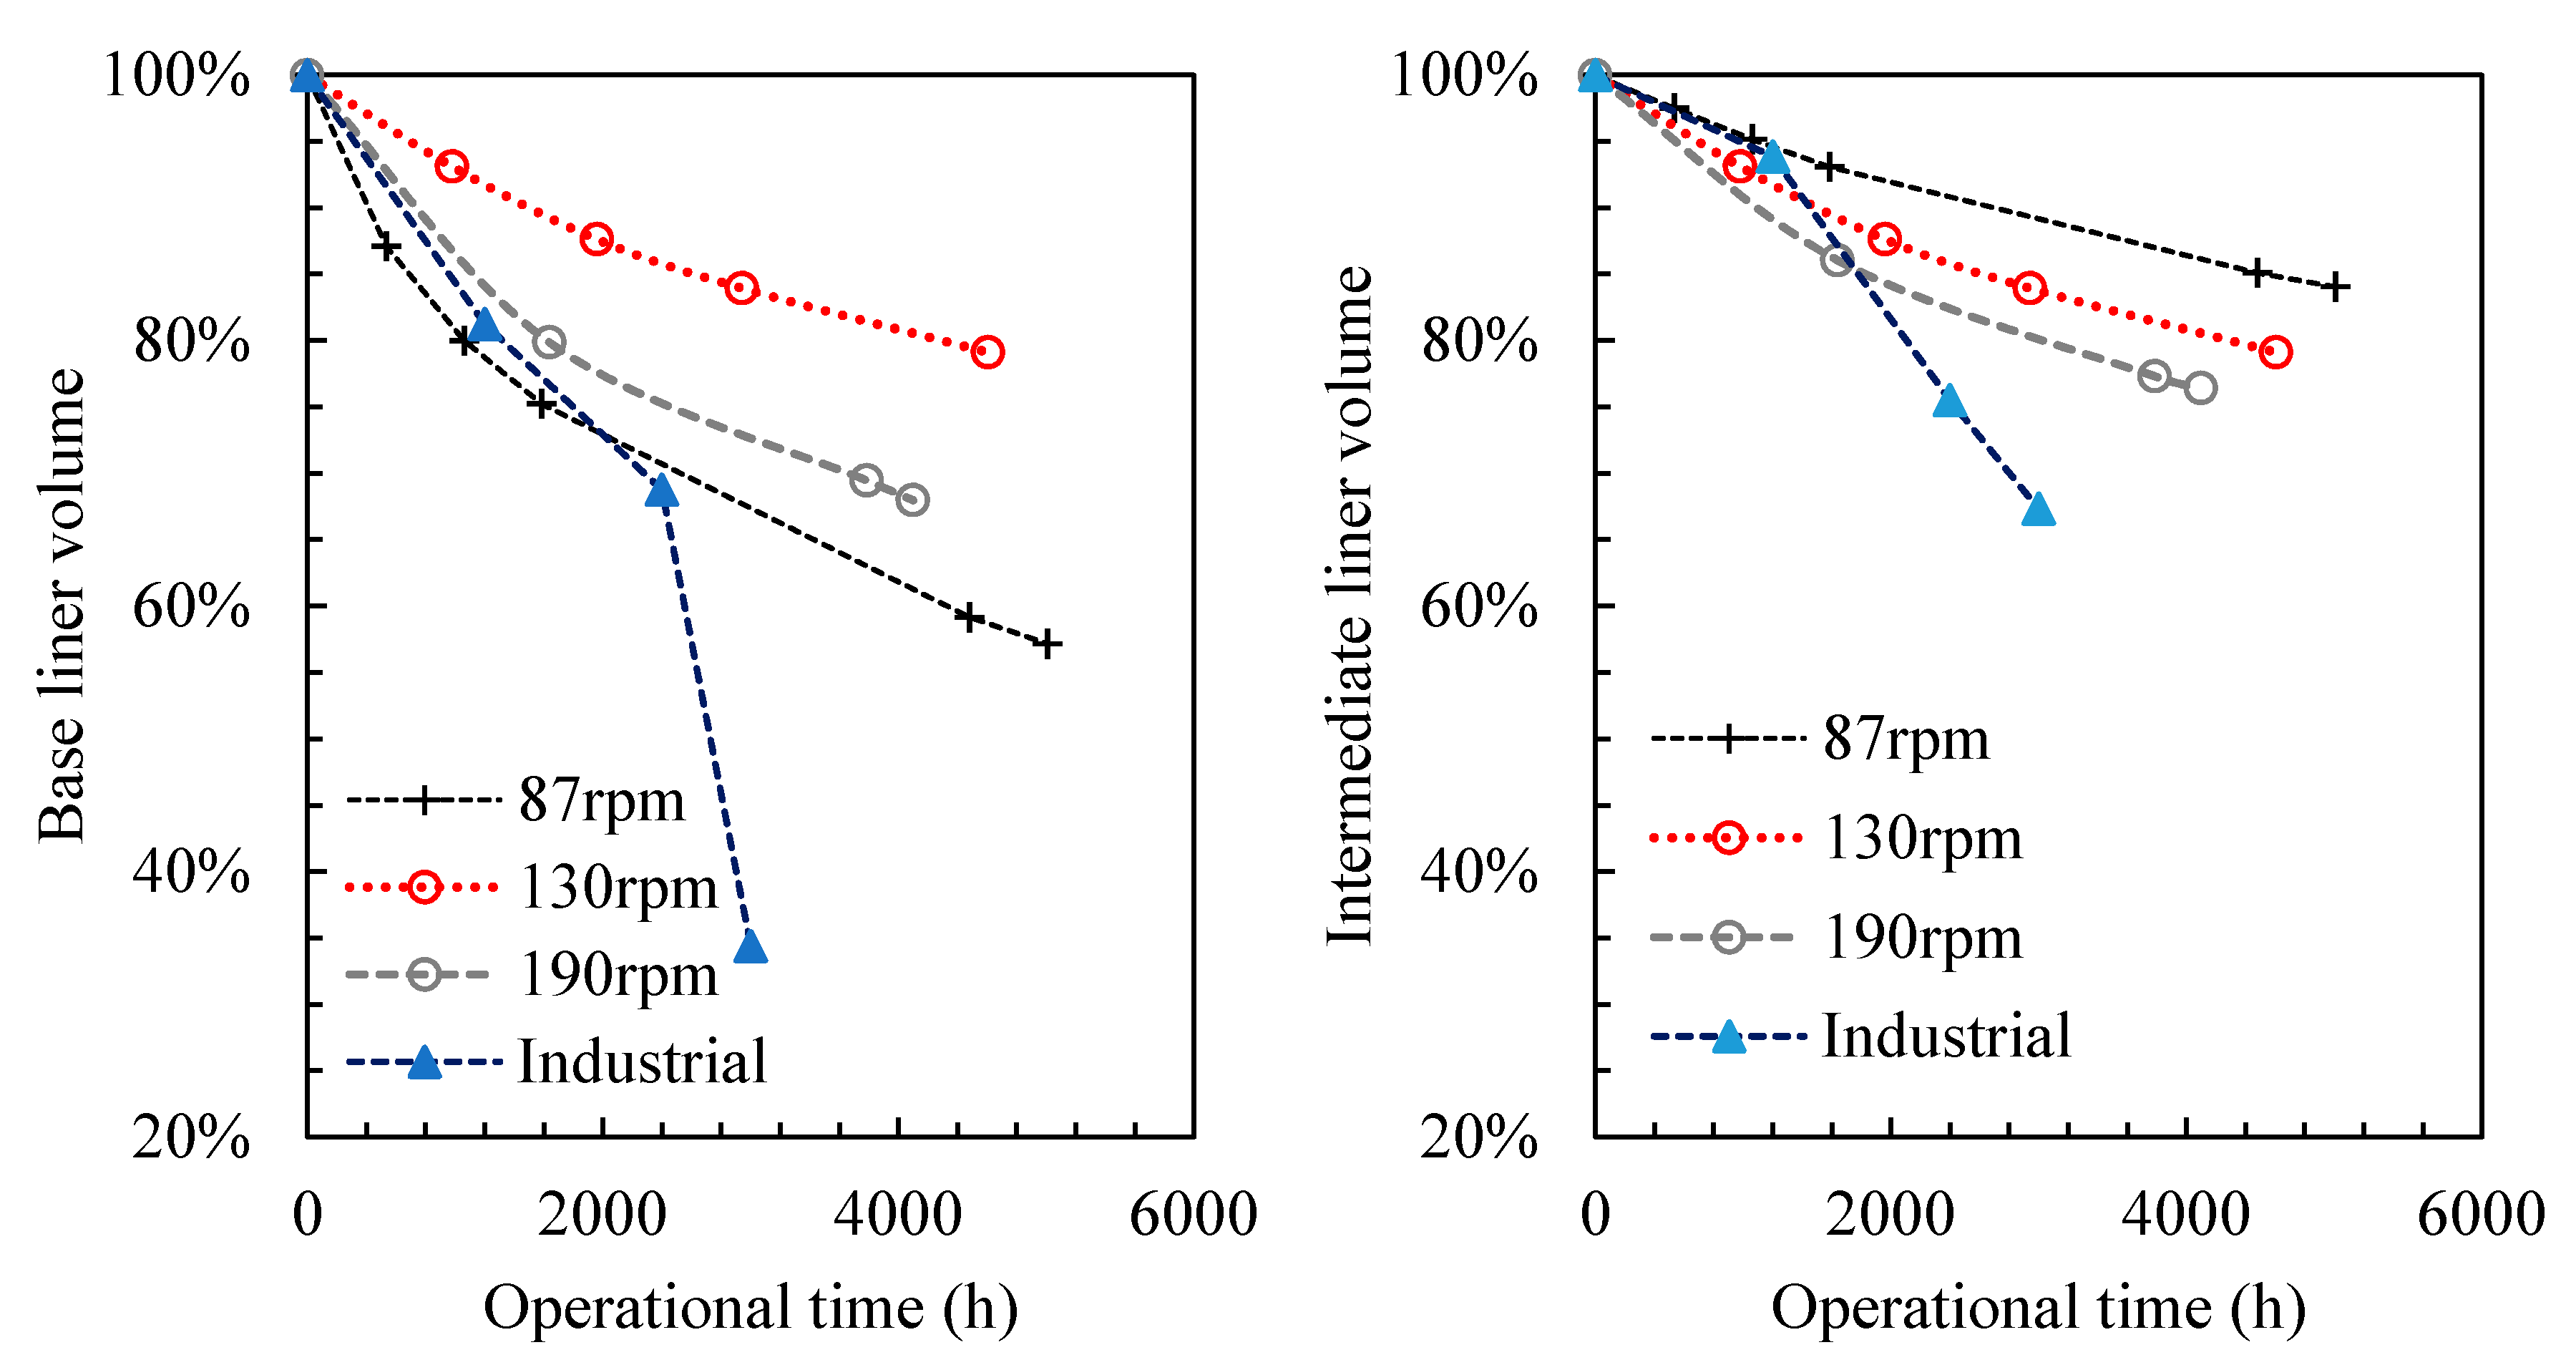
Figure 20 compares the simulated geometry and industrial liner designs under several wear conditions. The visual comparison between wear patterns shows that DEM provided a remarkably similar wear design. The next stage would be to quantify the wear relation. For that, a time relation was established in order to obtain a scale-up factor that correlates simulation seconds and operational hours. The scale-up factors were calculated for the base and intermediate liners, at each operational velocity. The final scale-up factor, per velocity, was obtained as an average value in between the liner and intermediate factors.
Figure 21 shows the predicted liner volume, based on the obtained DEM model. By comparing the intermediate and base liner predictions, a better agreement was achieved when using the 87 rpm as agitator velocity. In relation to the base liner, the results compared favorably during most of the operational time, except for the last liner measurement, which corresponds to approximately 3000 h. This is probably because the last liner measurement presents an aggressive behavior, which representatively differs from the trend.
For the intermediate liner, the behavior was well predicted up to approximately 1500 h. This is probably due to the fact of filling increases during the liner lifetime. The filling increasing is performed during the liner lifetime with the aim to keep constant power by activating upper parts of the mill. Because of that, added grinding media gets in contact with upper parts of the intermediate liner, thus resulting in additional wear. In contrast, the liner volume predictions for 130 rpm and 190 rpm did not fit very well when evaluating base and intermediate liner parts.
To summarize, it was noted that the wear prediction presented a relative agreement with industrial measurements in the first half of the liner lifecycle. Differently, the agreement was not very effective for the second half of the lifecycle, especially for the intermediate liner part. In relation to the liner part, the disagreement can be explained by the wear compensation in the industrial context. In order to keep constant power consumption, additional grinding media is added to the mill, thus activating the upper parts of the intermediate and generating extra wear. This filling compensation was not taken into account by the DEM simulation, and then it can be expected a lower wear rate and the end of the lifecycle for the intermediate liner part. In relation to the base liner, the differences after 3000 h can be explained by a possible variation in the material properties after several wears, which should be confirmed by liner material properties evaluation. In this sense, the intensive wear could substantially affect liner material resistance properties, thus reducing wear resistance for very worn conditions. This effect was not taken into account by the DEM simulations, resulting in a large difference for the base liner prediction after 3000 h.
5. Conclusions
Once the vertical stirred mill screw liner is responsible for media movement, and consequently, grinding, it is very important to perform accurate monitoring of wear progress. However, it is not possible to directly install a sensor for wear measurement. The paper addressed this issue by performing DEM simulations, with the aim to provide a better understanding of screw liner wear behavior and effects. The simulation was performed for a 1:10 reduced scale geometry from the Metso Vertimill VTM-1500 model, to reduce simulation effort.
The simulations applied different scale-up methodologies for agitator rotational velocity. In this sense, three different mill velocities were simulated. Firstly, a reduced velocity was obtained based on a dataset model. This consists of a more recent approach for velocity scale-up in laboratory-scale equipment. Moreover, a direct scale-up factor based on the geometry reduction was applied, thus resulting in a higher operational velocity of 190 rpm. Finally, an intermediary velocity was tested to provide a better understanding of the effects of operating in between the lower and maximum mill velocities.
The wear simulation results qualitatively showed that the wear profile obtained using DEM presents a relative similarity to the wear design observed in the full-scale equipment at the beginning of the liner lifecycle. The worn agitator geometries were exported, at different simulation times, to provide a volume quantification of wear. By comparing worn geometries obtained from DEM simulations and industrial measurement, a time correlation was proposed. In this sense, a scale-up factor was obtained to correlate simulation time, in seconds, and operational time, in hours. This scale-up factor was then applied to simulation results to predict wear in the operational context, for the base and intermediate liner parts. By comparing the obtained wear prediction and industrial measurement, a better agreement was encountered for the 87 rpm mill velocity. Based on that, the recommendation would be to apply the developed model under different operational conditions, to evaluate different strategies for wear compensation, such as changing mill speed and grinding media filling.
Additionally, DEM outputs were evaluated to provide a better understanding of wear effects. From that, it was noted that wear introduced a significant decrease in simulation power and particle average translational velocity. In relation to particle trajectory, the particle velocity reduction was intensified in the top and bottom parts of the mill, thus resulting in null particle motion in those areas. In the bottom part of the mill, this is known as the dead zone effect. The particle collision spectra indicated that wear affects more intensively normal contacts of greater specific energy. Although this might cause a decrease in fines generation, this can lead to an improvement in energy usage. This is because the predominance of low energy contacts is related to an increase in energy efficiency, once this reduces the occurrence of high-intensity contacts, which apply greater energy than required for particle breakage.
To summarize, the obtained results indicate that liner wear affects particle breakage and energy consumption. A better understanding and proper quantification about its effects can play a key role in the development of strategies for optimizing operational procedures to keep grinding efficiency and to reduce wear rates. In this sense, the recommendations would be to evaluate the relationship between operational conditions and liner wear, in the industrial context.
The model did not consider particle breakage, as ore particles itself are not included in the simulation. Grinding media wear also not considered. Finally, the current work did not consider the slurry (fluid), so as there would be a recommendation to apply CFD (computational fluid dynamics) or SPH (smoothed particle hydrodynamics) to describe the mill charge with more details.


