Article

Preparation of Antimony Sulfide and Enrichment of Gold by Sulfuration–Volatilization from Electrodeposited Antimony

1
Faculty of Metallurgical and Energy Engineering, Kunming University of Science and Technology, Kunming 650093, China
2
National Engineering Laboratory for Vacuum Metallurgy, Kunming University of Science and Technology, Kunming 650093, China
3
College of Chemistry and Chemical Engineering, Central South University, Changsha 410083, China
4
State Key Laboratory of Complex Nonferrous Metal Resources Clear Use, Kunming University of Science and Technology, Kunming 650093, China
*
Author to whom correspondence should be addressed.
Submission received: 31 December 2021 / Revised: 10 February 2022 / Accepted: 17 February 2022 / Published: 19 February 2022

Abstract

:
Electrodeposited antimony can be treated with sulfuration–volatilization technology, which causes antimony to volatilize in the form of antimony sulfide. During this process, gold is enriched in the residue, thereby realizing the value-added use of antimony and the recovery of gold. In this study, the thermodynamic conditions of antimony sulfide were analyzed by the Clausius–Clapeyron equation. Moreover, the volatilization behavior of antimony sulfide and the enrichment law of gold were studied by heat volatilization experiments. The effects of the sulfide temperature and volatilization pressure on the separation efficiency of antimony and gold enrichment were investigated. The results demonstrate that the sulfuration rate was the highest, namely 96.06%, when the molar ratio of sulfur to antimony was 3:1, the sulfur source temperature was 400 °C, the antimony source temperature was 550 °C, and the sulfuration time was 30 min. Antimony sulfide prepared under these conditions was volatilized at 800 °C over 2 h at an evaporation pressure of 0.2 atm, and the volatilization rate was the highest, namely 92.81%. Antimony sulfide with a stibnite structure obtained from the sulfuration–volatilization treatment of electrodeposited antimony meets the ideal stoichiometric ratio of sulfur and antimony in Sb2S3 (3:2), and gold is enriched in the residue.

1. Introduction

Antimony is a rare metal, and its average abundance in the earth’s crust is only 0.2–0.5% [1]. In 2014, the European Union classified antimony as a key raw material [2]. The conductivity of antimony is between conductor and insulator, it is not easily oxidized at room temperature, and it has corrosion resistance. In addition, antimony compounds also have the excellent characteristics of high heat resistance and low resistance, and are often used to manufacture laser-guided bombs, various missile seekers, and friction materials. Sb and its compounds were first only used in fireworks, firewood, and other daily life fields. With the rapid development of science and technology, antimony and its compounds have become widely used in the nuclear industry, batteries, semiconductors, catalysis, enamel, and alloys, as well as in the medical and pharmaceutical fields, the military, etc. Antimony is also characterized by low substitution and high military demand, and a single supply source mainly obtained via primary mining [3,4,5].
Antimony is a traditionally dominant mineral resource in China. According to survey data released by the United States Geological Survey (USGS), China’s antimony ore resource reserves account for 25% of the world’s total reserves, with antimony ore reserves ranking first in the world. Moreover, China’s antimony ore mining accounted for 52% of the world’s antimony mining in 2020, with extraction of antimony ores also ranking first in the world [6]. With the increasing development of mining technology, the production process of antimony mineral resources, mainly jamesonite and stibnite, has become increasingly mature. At present, the research on antimony production in China has gradually shifted to investigations of complex polymetallic symbiotic ores, represented by antimony–gold deposits [7]. The traditional treatment method of antimony minerals is the smoke method [8,9]; this is because antimony–gold ore contains gold and other minerals, and gold is often associated with sulfides, such as pyrite, antimonite, and arsenopyrite. In addition to natural gold and continuous gold, which represent the free existence of raw gold, most gold is embedded in sulfide and oxide minerals, which belong to the category of refractory gold mines [10,11,12,13,14]. Considering the enrichment and extraction of precious metals, sodium sulfide leaching–sodium thioantimonate solution electrodeposition is a commonly used technology for the treatment of antimony–gold ore.
Antimony–gold ore can be treated by a sodium sulfide leaching–sodium thioantimonate solution electrowinning process. However, during this treatment, up to 10.3% of the gold in the ore will be dissolved into the leaching solution, and this gold will be precipitated during electrowinning before the antimony in the leaching solution is reduced; the antimony produced in this solution system contains not only a large amount of sodium salt, but also gold [15,16,17,18]. Therefore, there is an urgent need to explore processes that can simultaneously purify electrodeposited antimony and achieve gold enrichment. The recovery and value-added use of valuable metals from metallurgical by-products can be achieved by sulfidation [19] and vacuum distillation [20,21]. Zhang [22] purified electrodeposited antimony by vacuum distillation and enriched gold in the residue. The present research is based on the problem that electrodeposited antimony contains precious gold, the smelting product of antimony–gold ore. By using the basic principle whereby the saturated vapor pressure difference between Sb, Sb2S3, and Au is significant, a two-stage process of sulfuration–volatilization is used to directly sulfurate the electrodeposited antimony. Antimony sulfide can be produced and purified by distillation via a novel process for the treatment of electrodeposited antimony. In this process, antimony is volatilized in the form of sulfide antimony, while gold is enriched in the residue, thereby realizing the value-added use of the main metal antimony and the recovery of gold.

2. Materials and Methods

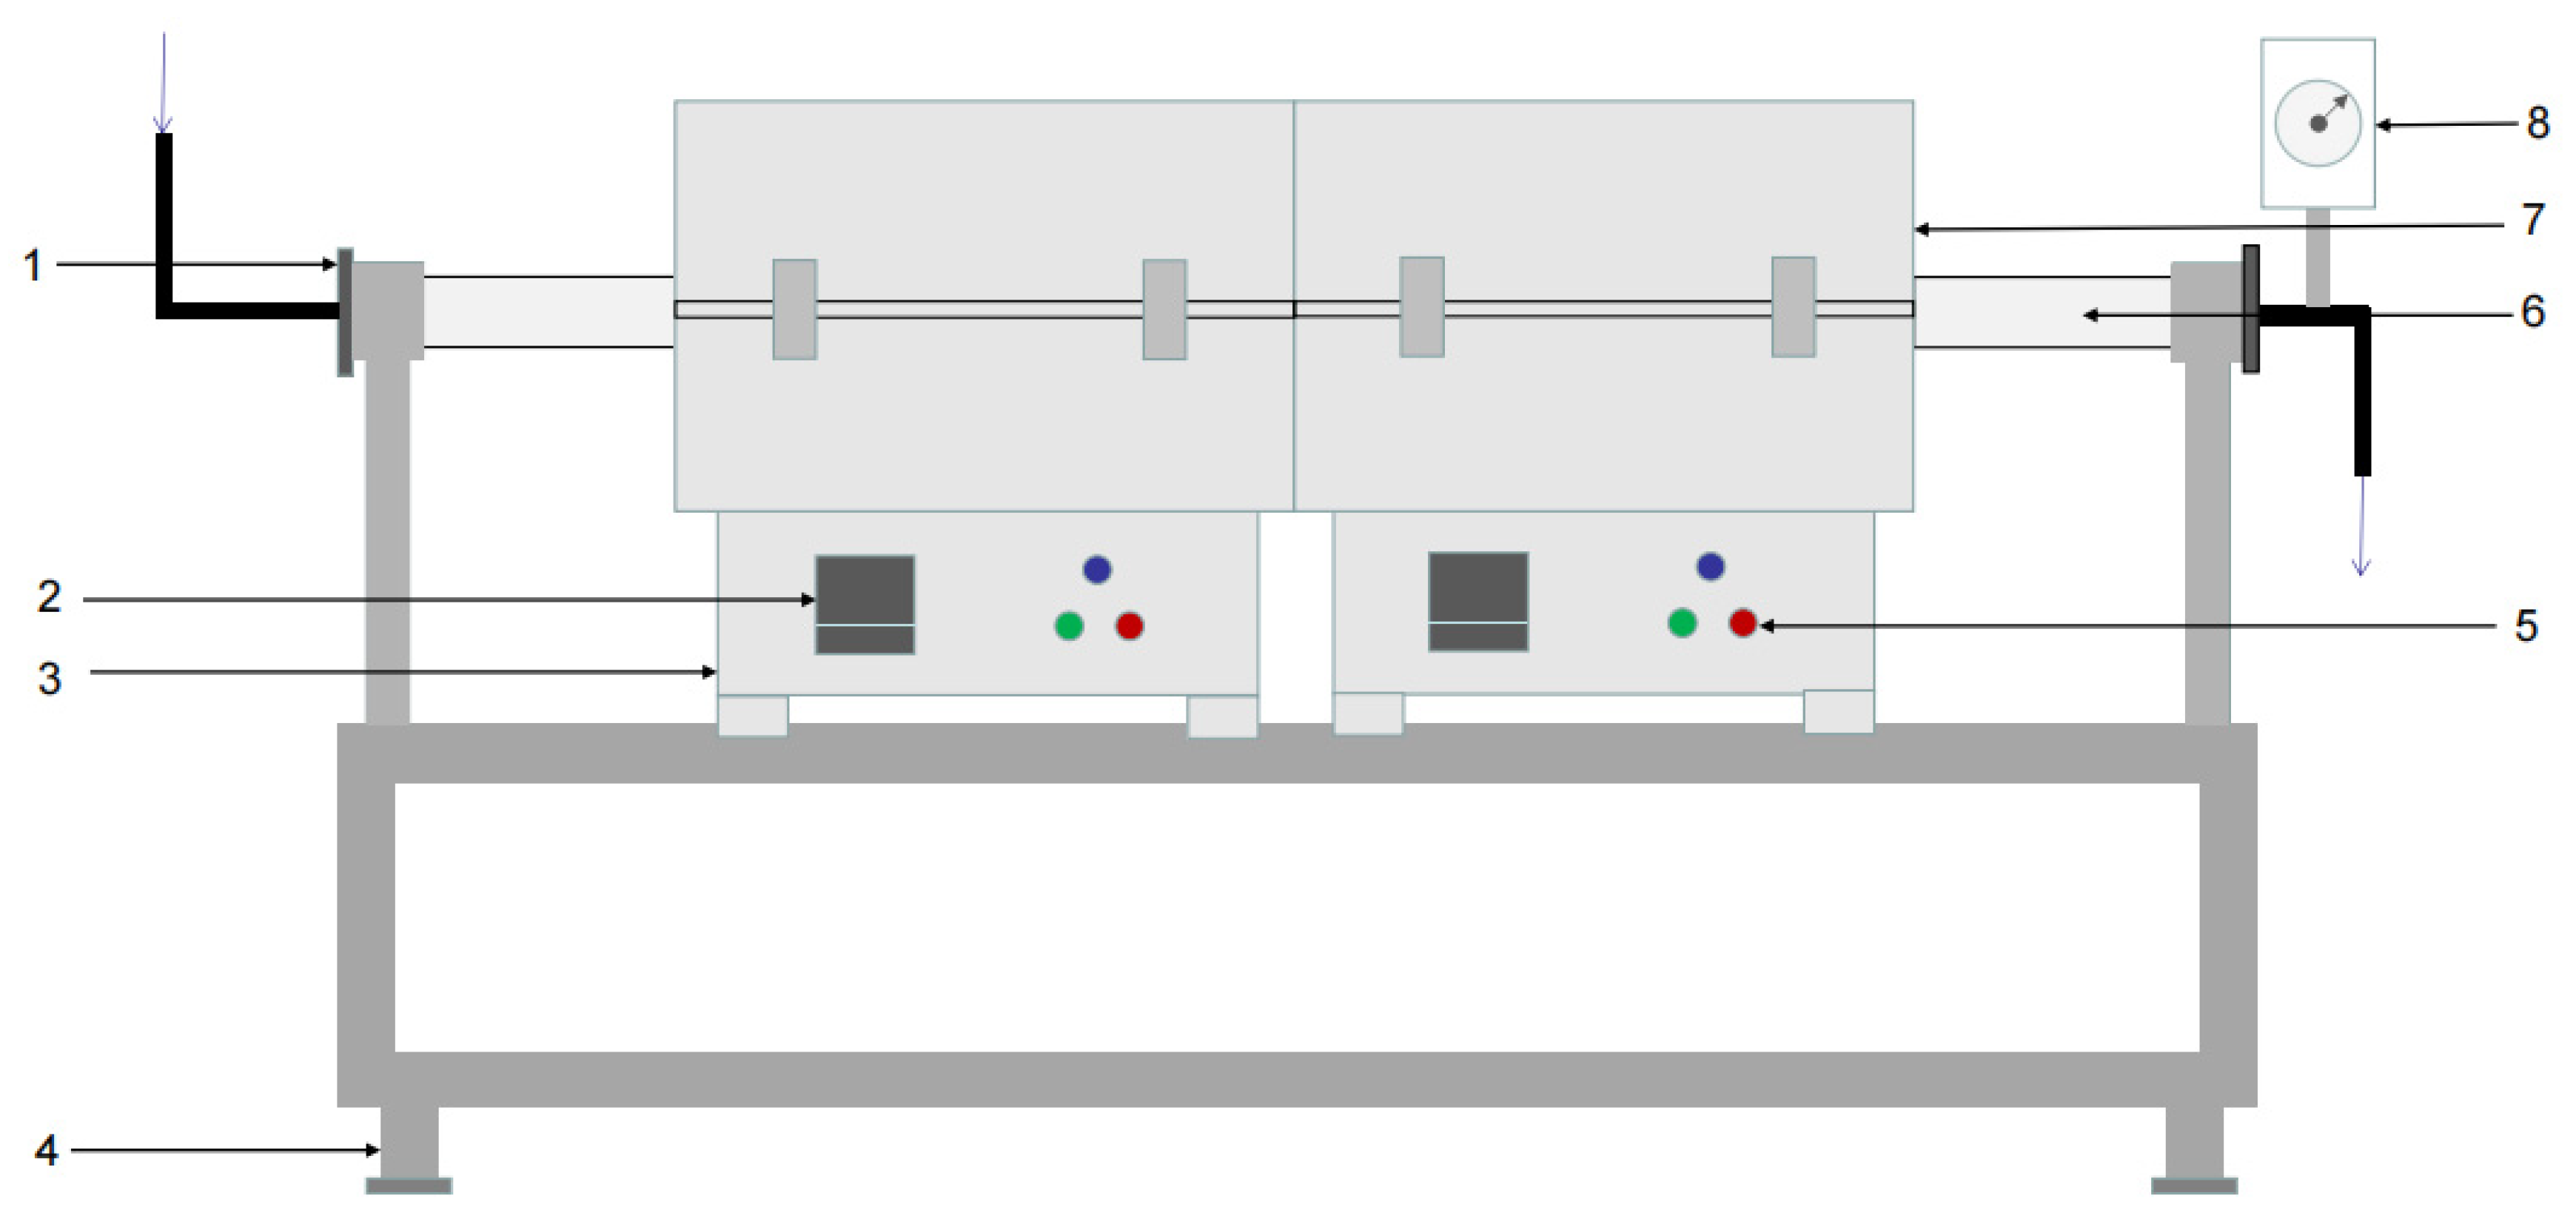
2.1. Materials and Device

The experimental raw materials used in this study were electrodeposited antimony produced by Shandong Hengbang Group (Yantai, China) and sulfur powder produced by Tianjin Fengchuan Chemical Reagent Technology Co., Ltd. (Tianjin, China). Chemical analysis and gravimetric methods were used to quantitatively determine the chemical composition of the electrodeposited antimony and sulfur powder. The chemical composition of antimony electrodeposited from raw materials was obtained via chemical analysis and X-ray fluorescence, and the results are reported in Table 1.
In this experiment, to fully react the electrodeposited antimony, excess sulfur powder was needed; thus, the molar ratio of S: Sb was set to 3:1. The tube furnace was filled with argon. One of the dual-temperature-zone tube furnaces was the sulfuration temperature zone with an antimony crucible, the other was the sulfur volatilization temperature zone with a sulfur crucible, and the temperature of the sulfuration temperature zone was set to 400–650 °C. The temperature gradient was set to 50 °C, and the heating rate was 10 °C∙min−1. The volatilization system was set to 400 °C, the heating rate was 8 °C∙min−1, the pressure was 1 atm, and the temperature was maintained for 30 min. A furnace box of the tube furnace was used for the volatilization test, and graphite paper was placed at both ends to collect volatiles. The samples obtained under optimal vulcanization conditions were volatilized at 800 °C. The atmospheric pressure in the volatilization zone was respectively set to 0.2, 0.4, 0.6, 0.8, and 1.0 atm, and the temperature was maintained for 120 min.
Reactions in the system:
2Sb + 3S → Sb2S3
The reaction flowchart is presented in Figure 1.
The experimental device was a dual-temperature-zone tube furnace, produced by Shanghai Yifeng Electric Furnace Co., Ltd. (Shanghai, China), as shown in Figure 2. The shell of the tube furnace was welded with a thin steel plate at the edge, and the furnace lining was made of refractory fiber material. The spiral heating element was made of an iron-chromium-aluminum alloy electric heating wire and inserted into the furnace lining. The tube furnace was equipped with a temperature controller and an Ni-Cr-Ni-Si thermocouple, which could measure, indicate, and automatically control the furnace temperature. Thermocouples for temperature measurement and control were inserted through the thermocouple holes, and the gaps between the holes and thermocouples were filled with cotton fiber.

2.2. Methods

Scanning electron microscopy (SEM, VEGA3 TESCAN, Brno, Czech Republic) was employed to observe the microscopic morphology of antimony sulfide. Raman spectroscopy was performed with a Renishaw (London, England). Raman microscope equipped with a 514 nm laser, integrated switchable gratings with 600 or 1800 lines/mm, and a CCD detector. An electron probe micro-analyzer (EPMA-1720H, Shimadzu, Shimane, Japan) was used to scan the elemental distributions of the samples. Energy-dispersive spectroscopy (TM3030Plus, HITACHI, Tokyo, Japan) was employed for the elemental analysis of the micro-samples. X-ray photoelectron spectroscopy (XPS, PHI5000 Versaprobe-II, ULVAC-PHI, Chigasaki, Japan) was carried out to measure the binding energy of the electrons to identify the chemical properties and composition of the volatiles.
The sulfuration rate of electrodeposited antimony was calculated by the following formula:
Sulfuration rate = (m1 − m0)/m,
where m0 is the mass (g) of the empty crucible before the experiment; m1 is the total mass of the crucible containing the electrodeposited antimony after the reaction; and m is calculated by the chemical reaction equation of the reaction between elemental sulfur and elemental antimony.
The volatilization rate of samples after vulcanization was calculated by the following formula:
Volatilization rate = (m2 − m3)/m2,
where m2 is the mass of the sample prepared under the optimal vulcanization conditions before volatilization in the crucible, and m3 is the mass of the residue in the crucible after volatilization.

3. Theoretical Calculation

The theoretical basis for vacuum metallurgical separation, purification, and refining is based on the different saturated vapor pressures of various substances. The relationship between pressure and temperature when a pure substance reaches two-phase equilibrium can be expressed by the Clausius–Clapeyron equation:
dp/dT = H/T(Vg − Vl)
In the process of substance sublimation and evaporation, p represents the saturated vapor pressure of the substance at temperature T, Pa; T represents temperature, K; H represents the latent heat of vaporization of the substance, J/mol; Vg represents the molar volume of the substance in the gas phase volume, m3/mol; and Vl indicates the molar volume of the substance in the liquid phase, m3/mol.
For gas–liquid equilibrium, the equilibrium pressure was the vapor pressure of the liquid phase. Since the molar volume Vg when the substance was in the gas phase was much larger than the molar volume Vl when the substance was in the liquid phase, Vl can be ignored, namely:
Vg − Vl = Vg
Therefore, the Formula (4) was simplified to:
dp/dT = Hl/T Vg
The liquid phase has a low saturated vapor pressure and can be treated as an ideal gas. The gas phase follows the ideal gas law:
p Vg = R T
Substituting Formula (7) into Formula (6), we can get:
dp/dT = Hl p/R T2
Owing to dp/p = p lnp, Formula (8) becomes:
dp/dT = Hl p/R T2
When the temperature changes, the change in latent heat of evaporation cannot be ignored, then:
Hl = H0 + aT + bT2 + cT3 + ……
Substituting Formula (10) into Formula (9), we can get:
ln p = −L0/RT + a/R lnT + b/R T + ……+ c
To further simplify:
lg p = AT1 + B lgT + CT + D
From Equation (12), it can be seen that the image is a curve, representing a non-linear relationship.
The constants A, B, C, and D in Formula (12) are evaporation constants, which can be obtained by consulting related thermodynamic manuals.
From the literature [23,24]:
For metal Sb:
lg p = 8.00 − 6060/T   T ≤ 1573 °C
lg p = 9.15 − 7880/T   T > 1573 °C
For Sb2S3:
lg p = 14.67 − 11,200/T   673 °C ≤ T < 773 °C
lg p = 9.92 − 7068/T   773 °C ≤ T < 1223 °C
For Au:
lg p = (14.50 − 19,280/T) − 1.01 × lgT
Therefore, the relationship between saturated vapor pressure and temperature can be obtained as shown in Table 2 and Figure 3:
Table 2 and Figure 3 show that in the temperature range of 400 °C to 900 °C, the saturated vapor pressure of Au was much less than that of Sb and Sb2S3, while the saturated vapor pressure of Sb was much lower than that of Sb2S3, and varied with increasing temperature. The difference in saturated vapor pressure between Sb and Sb2S3 also gradually increases.
In summary, the saturated vapor pressures of Sb2S3 and Sb were much greater than that of Au, and the saturated vapor pressure of Sb2S3 was much greater than that of Sb, indicating that Au was less volatile and Sb2S3 was more volatile than Sb. In this experiment, sulfur vapor was first used to vulcanize Sb to produce Sb2S3, and then to volatilize the vulcanized Sb2S3. Recovery of antimony sulfide from electrodeposited antimony and enrichment of gold.

4. Experimental Analysis

4.1. Sulfuration Reaction

4.1.1. Sulfuration Rate Calculation
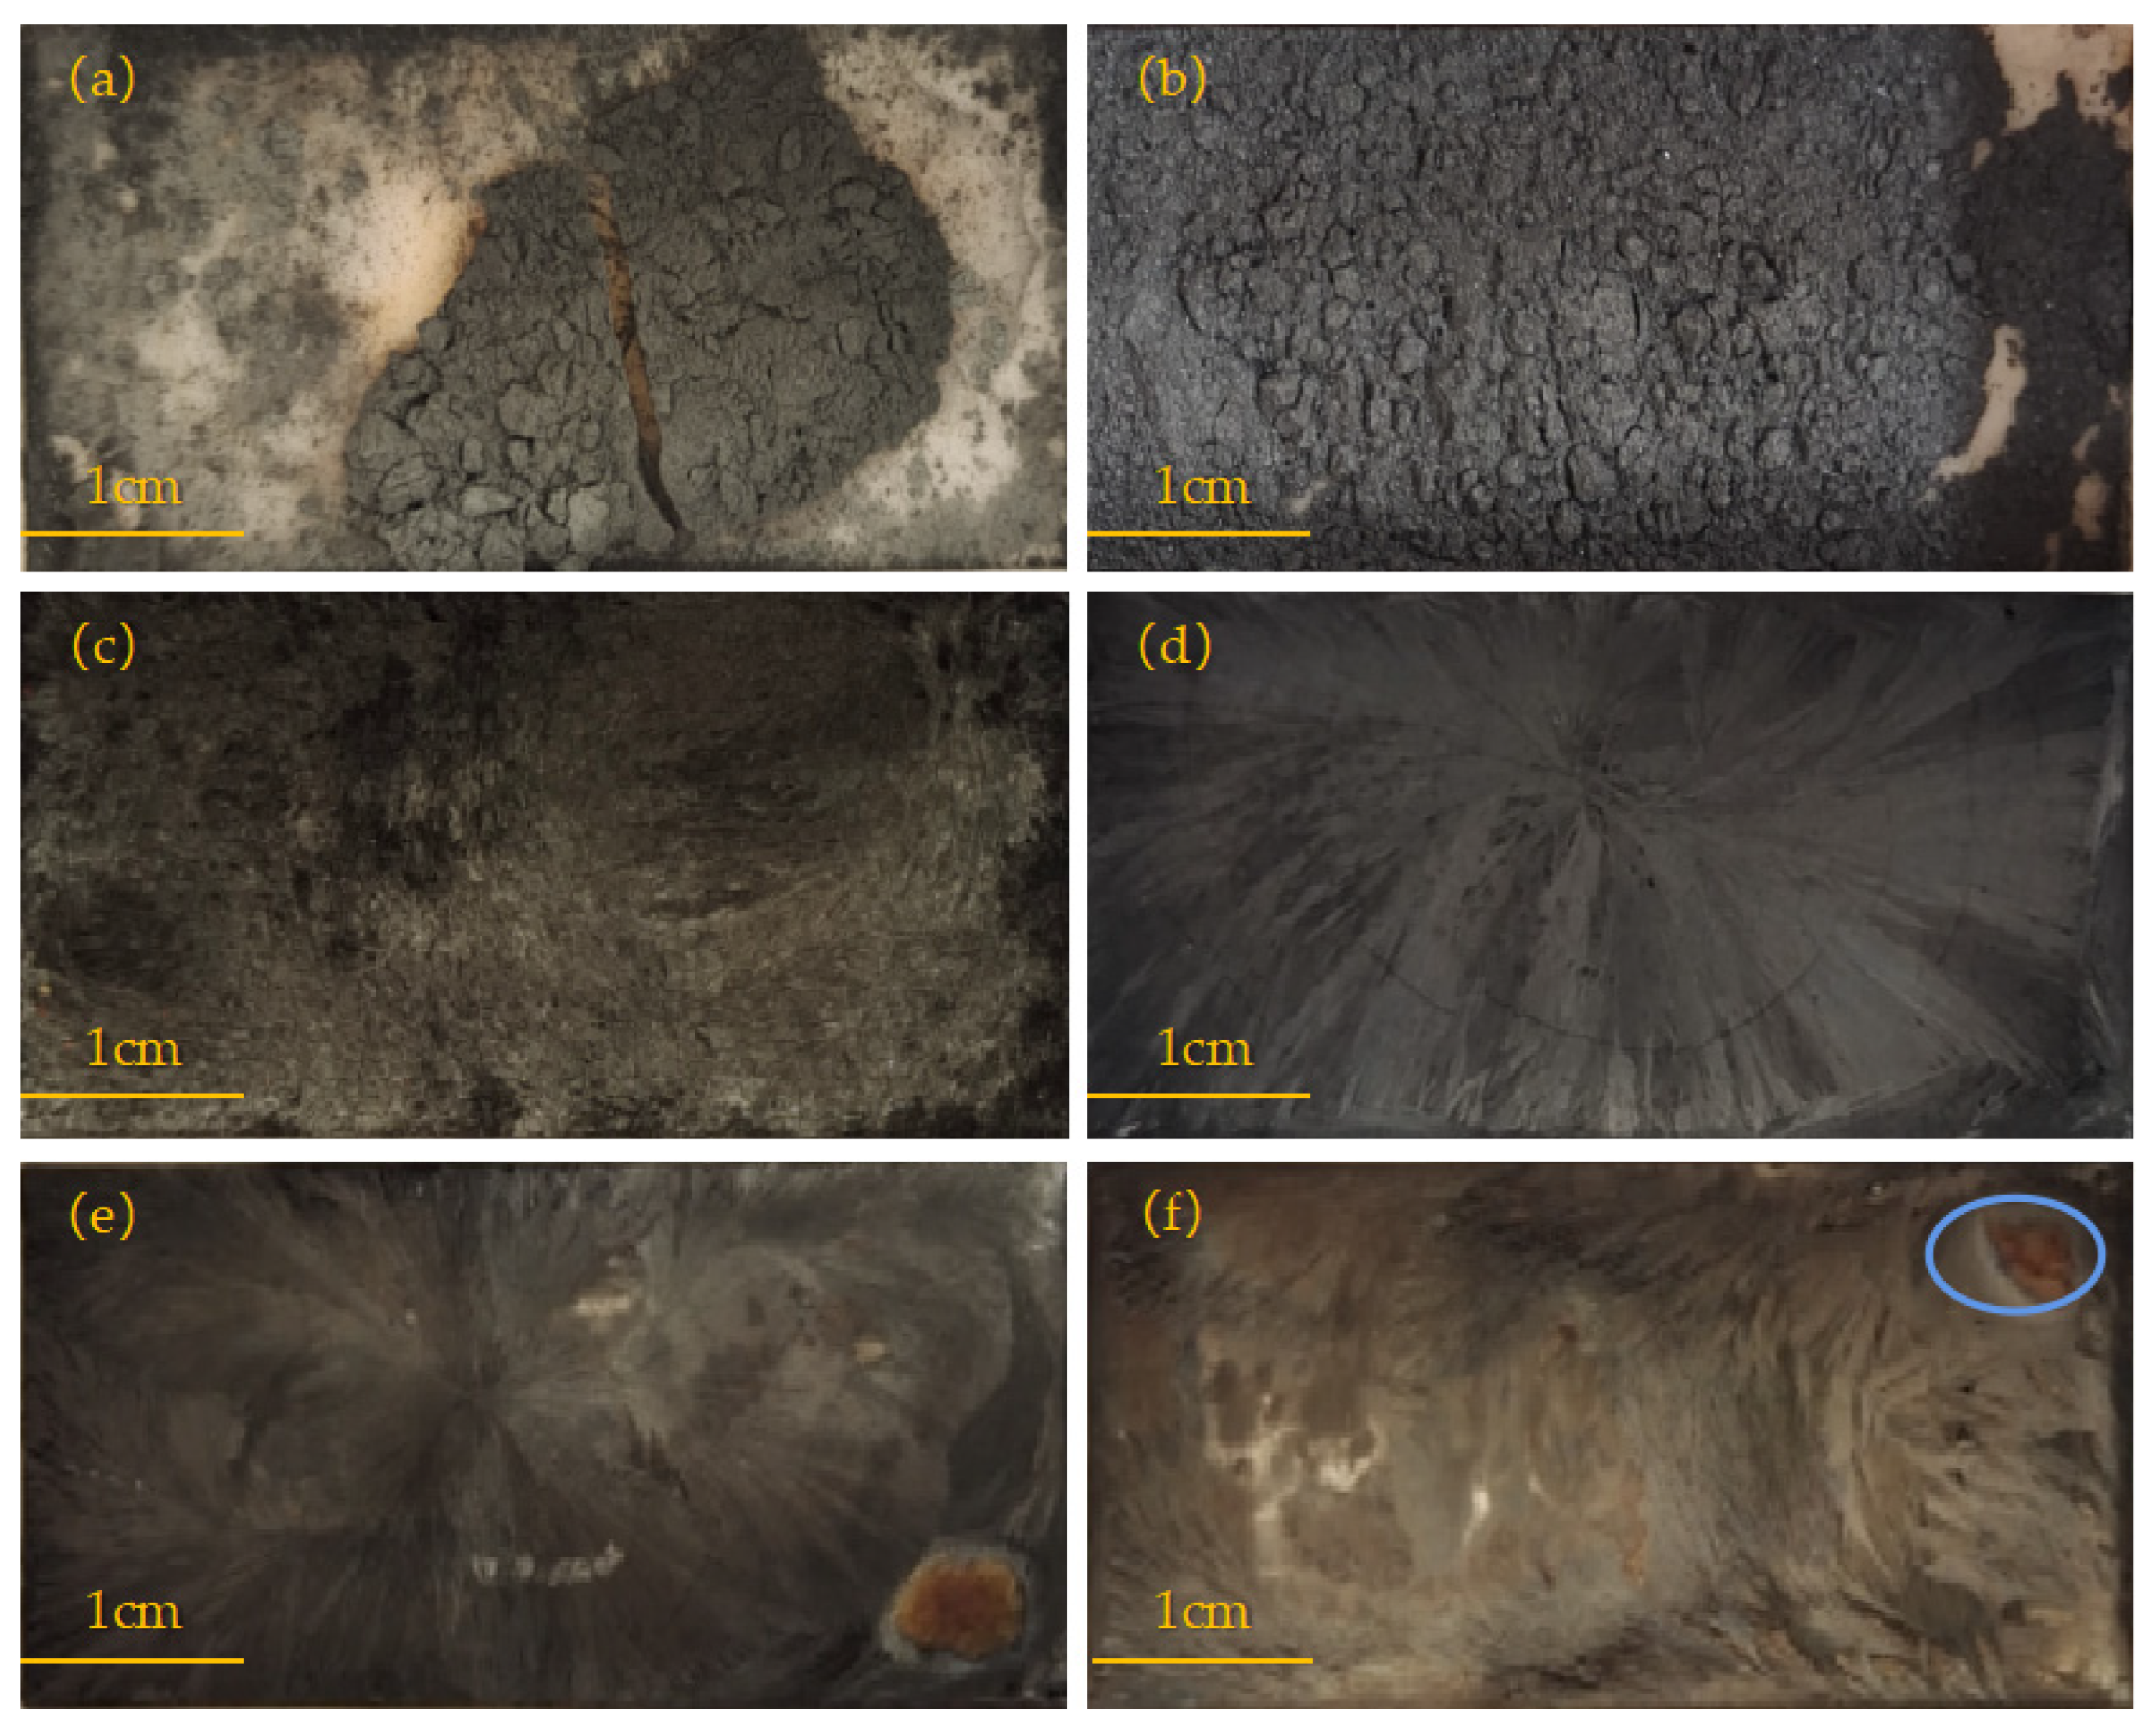
During the sulfuration process, a small portion of the generated antimony sulfide will volatilize. The volatile Sb2S3 was condensed in the non-heating zone and adhered to the wall of the quartz tube. A portion of the antimony sulfide generated during the sulfuration process was volatilized, resulting in the calculated sulfuration rate being lower than the actual sulfuration rate. At 400 and 450 °C, the electrodeposited antimony was not fully vulcanized, and the sulfuration rates were only 79.57% and 79.21%, respectively. The sulfuration rate reached 89.78% at 500 °C. A good sulfuration rate of 96.06% was achieved at 550 °C. However, the calculated sulfuration rates at 600 and 650 °C were only 88.89% and 89.78%, respectively. The reason for this is that a portion of the antimony will be in the melting–recrystallization zone, as shown in Figure 4.

4.1.2. SEM Analysis

Figure 5 displays the SEM images of the samples after sulfuration at constant atmospheric pressure and a constant holding time. The SEM images (Figure 5a, b) reveal that a large number of bright particles inside the electrodeposited antimony were not vulcanized at 400 and 450 °C. At 500 °C, the sulfuration rate increased to 89.78%, and the unsulfurated electrodeposited antimony particles were relatively reduced as compared to those at 400 and 450 °C; however, there remained a considerable amount of unsulfurated electrodeposited antimony. At 550 °C, the number of bright electrodeposited antimony particles in the visible field of view was very small, and they had been vulcanized to form Sb2S3. At 600 and 650 °C, the number of brightly electrodeposited antimony particles in the electron microscopic view decreased significantly as compared with that in the low-temperature reaction.

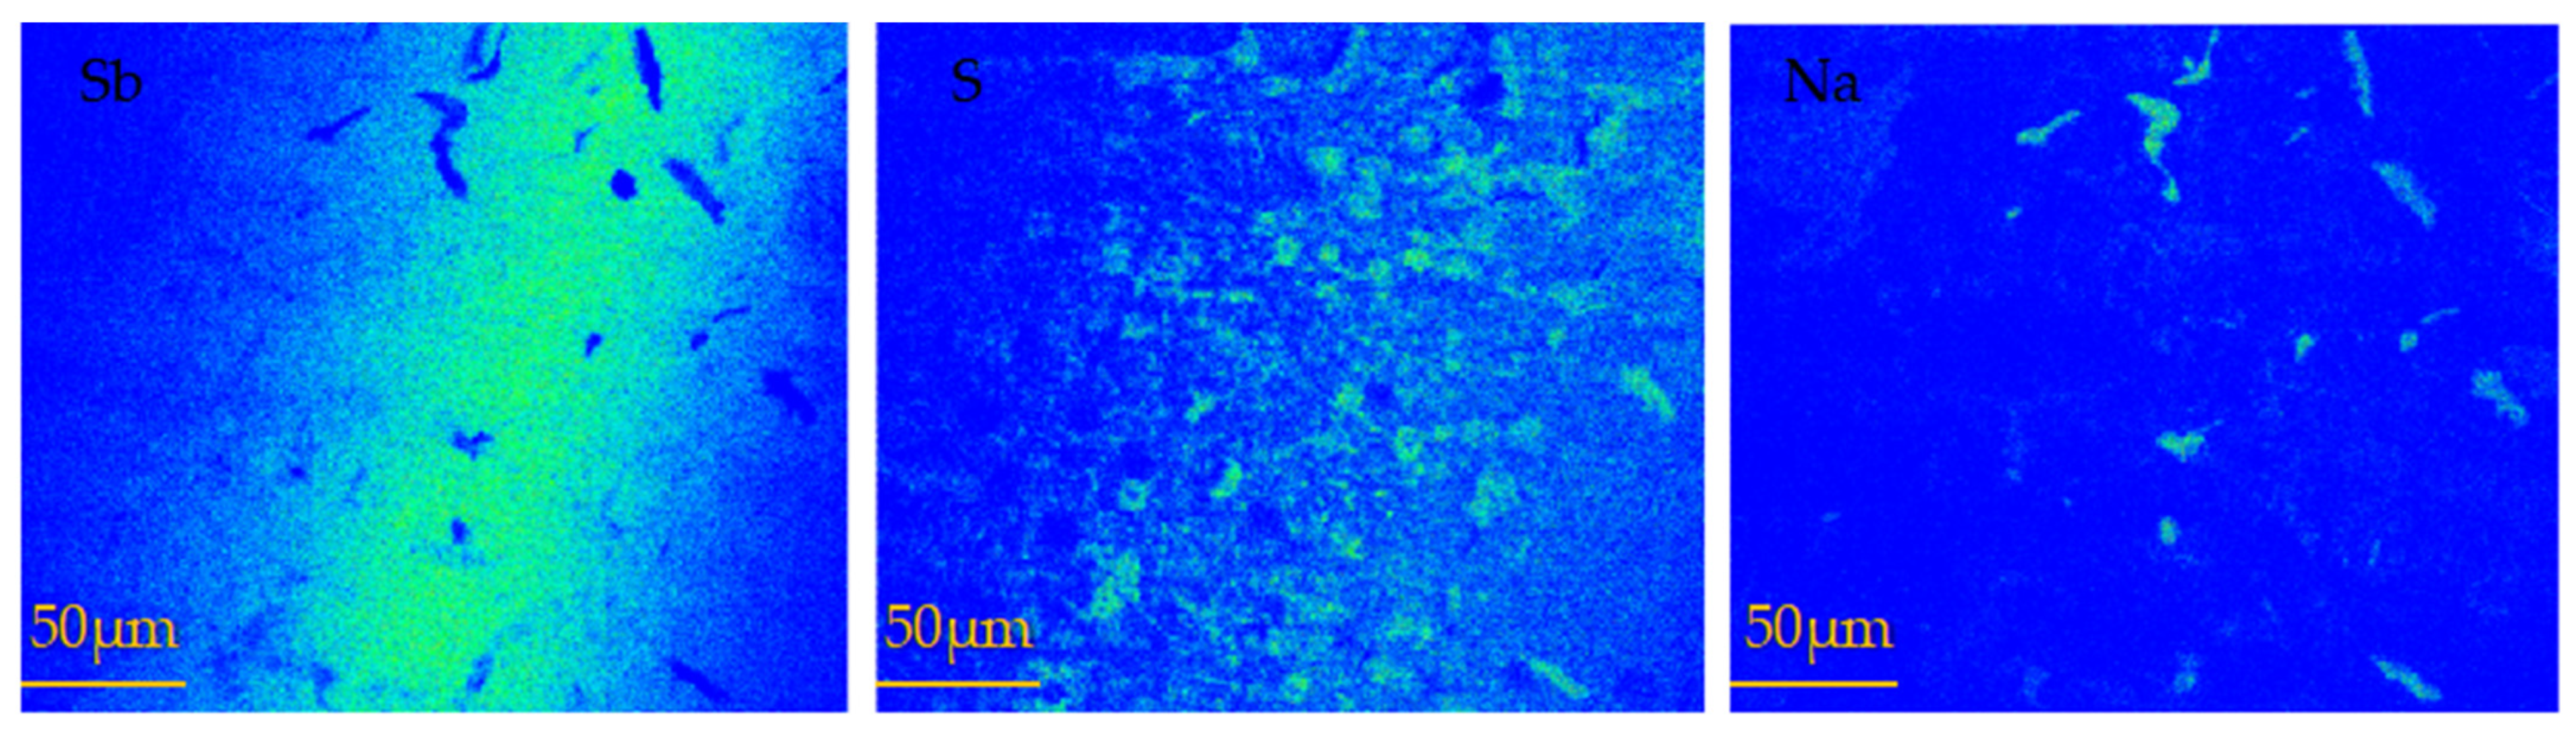
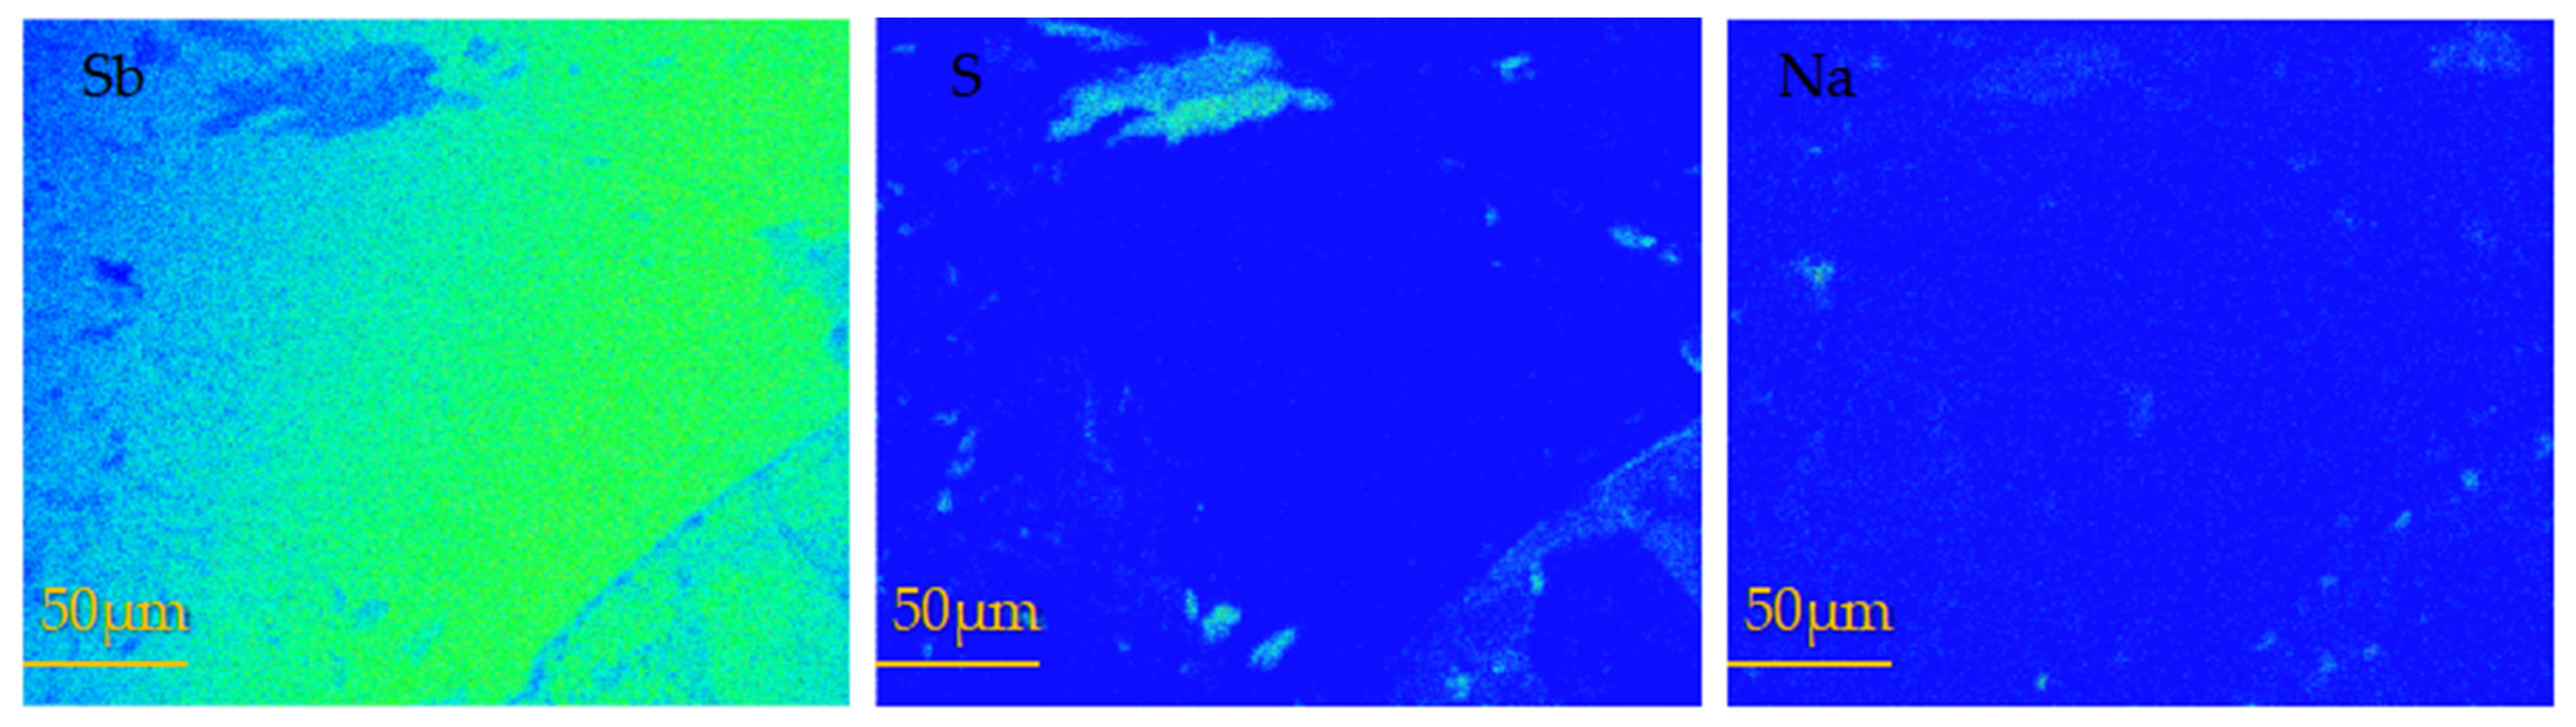
4.1.3. EPMA Analysis

When a certain temperature was reached, the sulfuration rate decreased with the increase of the sulfuration temperature; this issue was further investigated. After reacting at 600 and 650 °C, melting and recrystallized regions of antimony appeared in the crucible (Figure 4). The samples sulfurized at 650 °C were analyzed by electron probe microanalysis (EPMA). Figure 6 presents the surface scanning images of the antimony sulfide area at 650 °C. The images of elemental Sb and elemental S reveal that their distributions were basically consistent. However, as indicated in the image of elemental Sb, there were some areas where the Sb content was very low, but in the image of elemental Na, the area of concentrated Na was the empty area in the image of elemental Sb.
Figure 7 presents the surface scanning images of the melting–recrystallization zone of antimony at 650 °C (the area circled in Figure 4). The figure reveals that the recrystallization zone was mainly unsulfurated metal Sb, resulting in a decrease in the vulcanization rate, and some areas were enriched with Na.
In comprehensive consideration of the images of the sulfide samples presented in Figure 4 and the EPMA results, the main reasons for the occurrence of the melting–recrystallization zone at 600 and 650 °C are the following. (1) The sulfur source temperature remained constant at 400 °C, so the sulfur partial pressure remained certain. With the increase of the antimony source temperature, the amount of sulfur vapor diffused to the antimony end gradually decreased, and the collision between sulfur and antimony at the upper end of the antimony source decreased, resulting in the decrease of the vulcanization rate. (2) With the increase of the reaction temperature, the pressure of the reaction system increases, and the sulfur pressure in the antimony reaction zone becomes higher than that in the low-temperature zone; thus, the gas moves to the sulfur end. (3) When the pressure of the reaction system is high, the gas reaction proceeds in the direction of volume shrinkage, and the gaseous sulfur particles collide with each other to form macromolecular liquid sulfur, resulting in the reduction of sulfur involved in the vulcanization reaction.

4.1.4. EDS Analysis

The chemical formula of antimony sulfide is expressed as Sb2S3, the S/Sb ratio of which is 1.5. At 400 and 450 °C, the highest S/Sb ratio calculated by the obtained EDS data was about 1.32, indicating that the vulcanization at 400 and 450 °C was insufficient. At 500 °C, the S/Sb ratio was higher than those at 400 and 450 °C, and the calculated value was 1.45, which was close to the ideal value of 1.50. However, there remained an unsulfurated area, indicating that the vulcanization effect at 500 °C was still not ideal. At 600 and 650 °C, the obtained S/Sb values were distributed in the range of 0.9–1.3. However, as reported in Section 4.1.1, the melting–recrystallization zone of metal antimony appeared at 600 and 650 °C, which led directly to a reduction in the vulcanization rate and ultimately caused the vulcanization effect to be less than ideal. At 550 °C, an S/Sb ratio of 1.46 was obtained, and the sample was well vulcanized; compared with the S/Sb value under other temperature conditions, this was the optimal value. The EDS data also confirm that the best vulcanization effect was achieved at 550 °C.

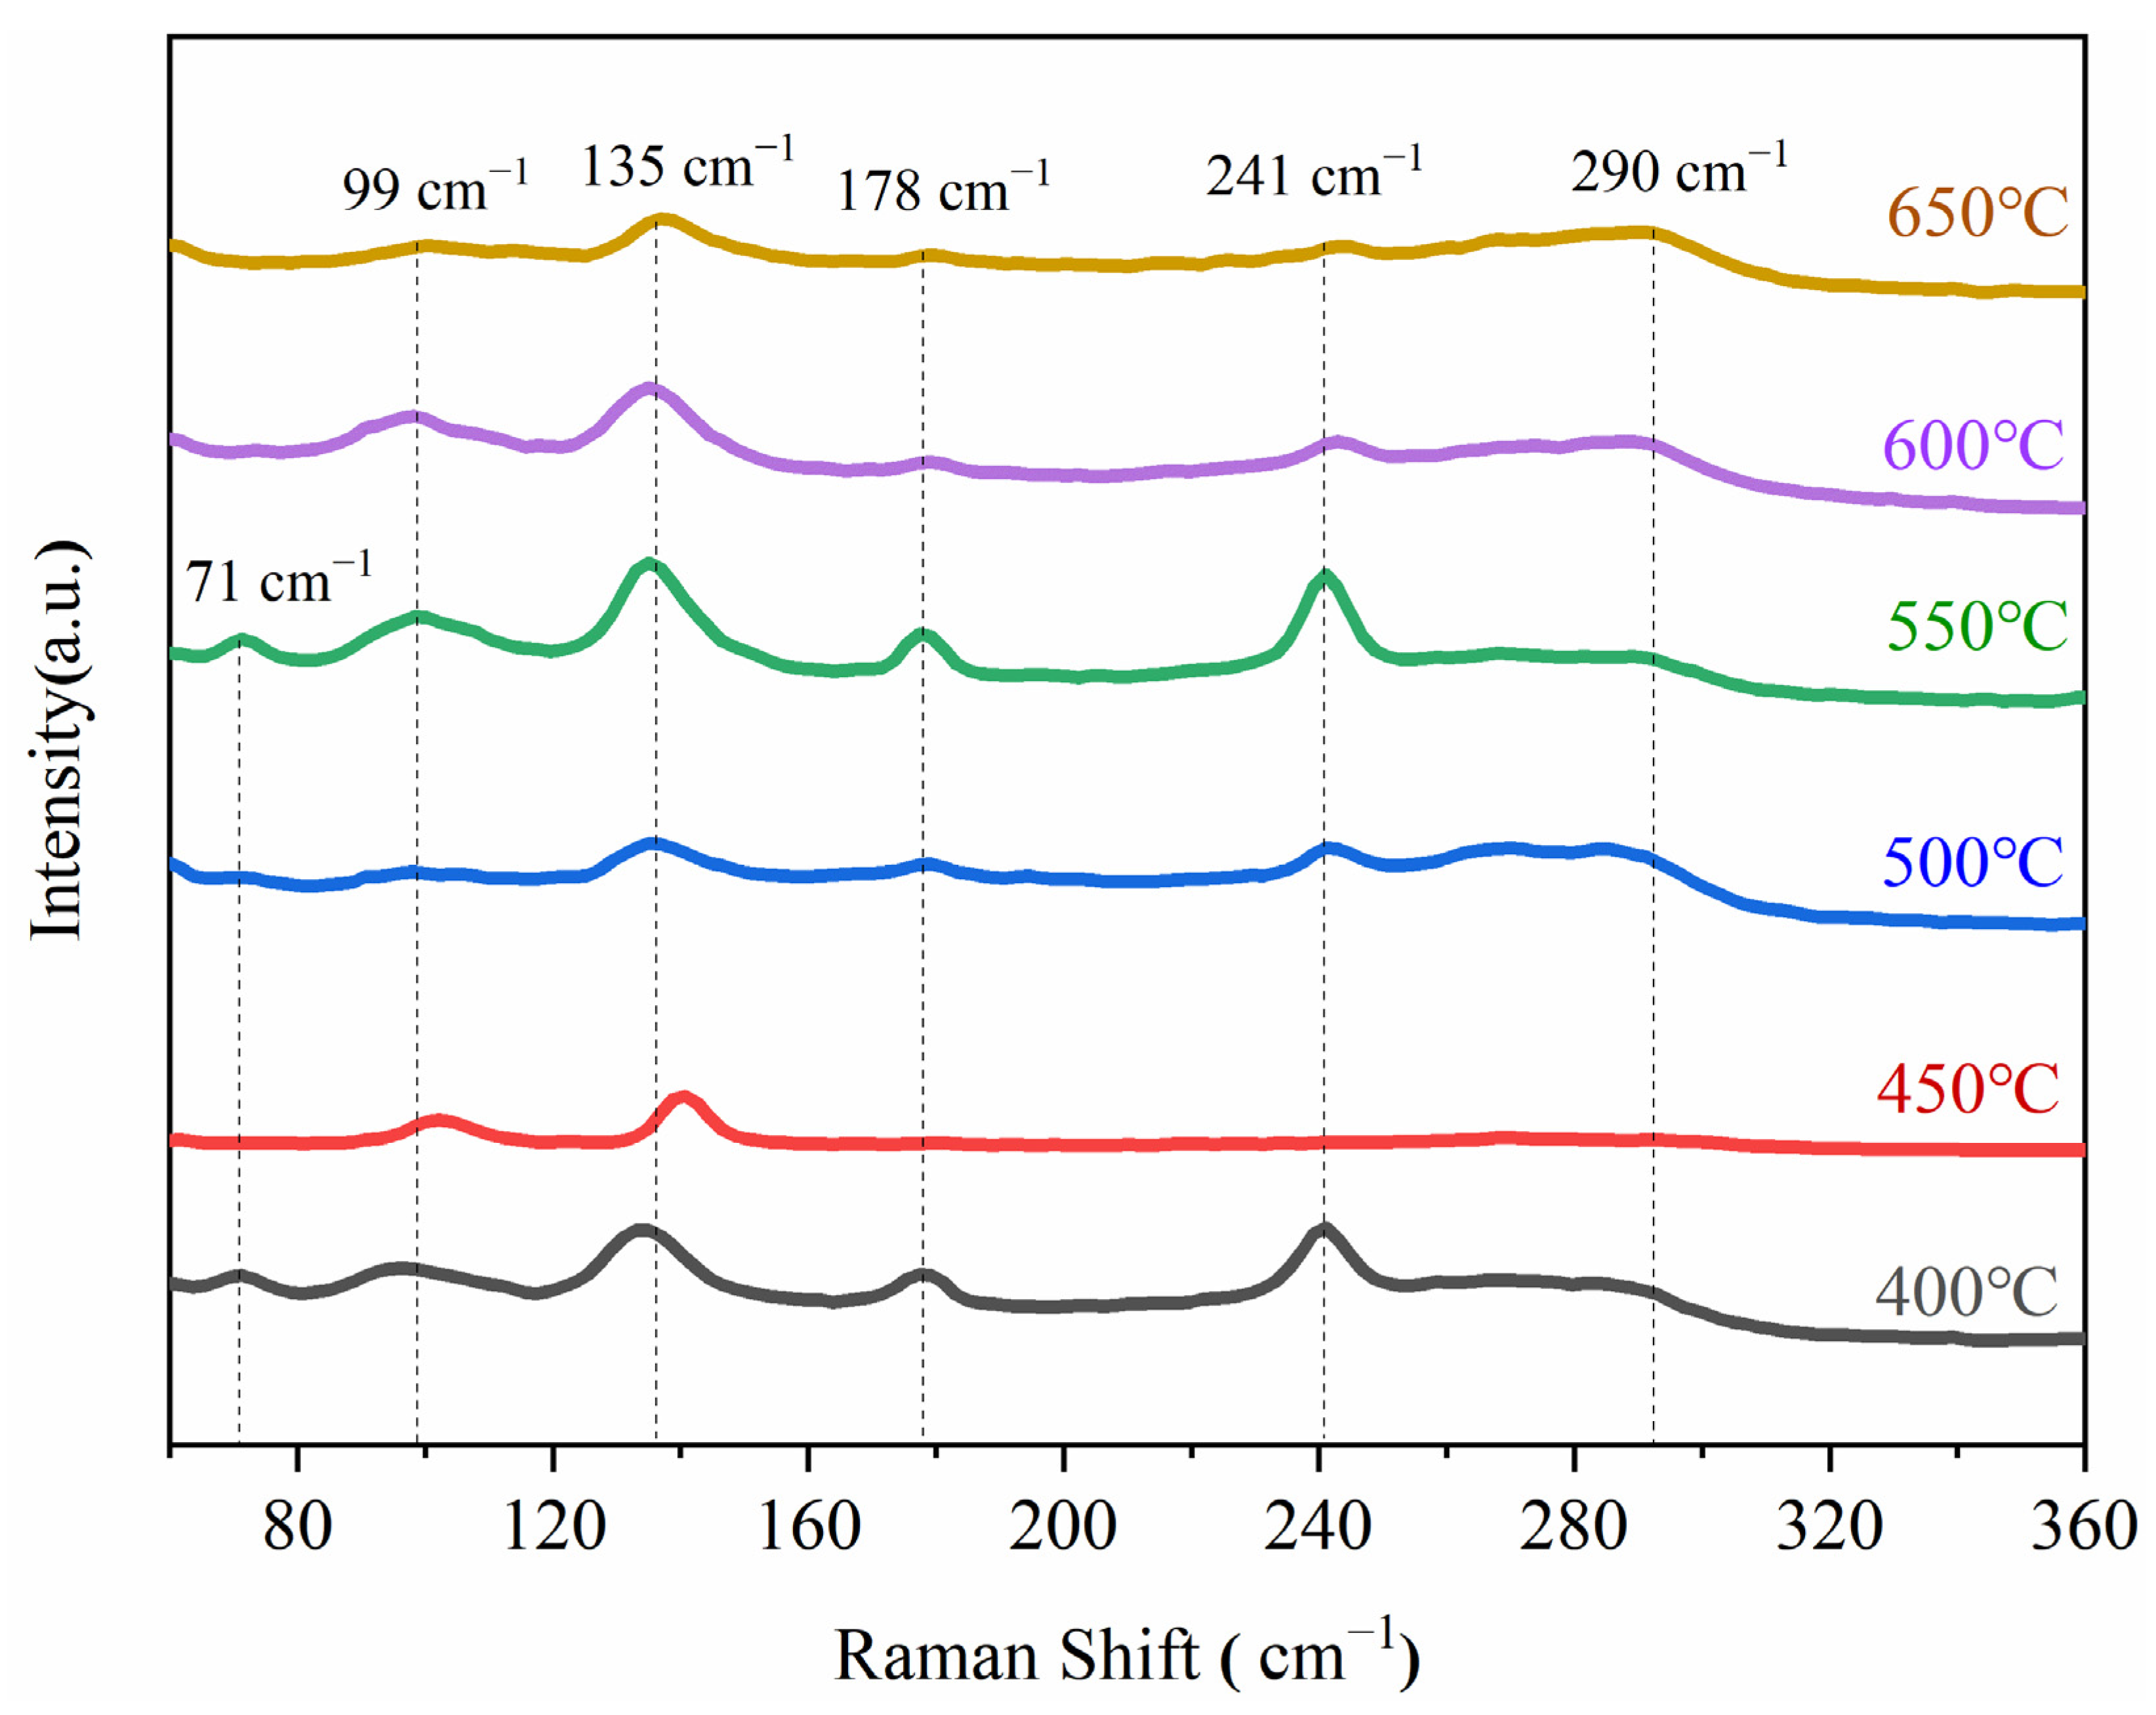
4.1.5. Raman Spectroscopy Analysis

The experimental results revealed that strong Raman peaks appeared at 71, 99, 135, 178, 241, and 290 cm−1; according to the existing literature [25,26,27,28], these are characteristic peaks of antimony sulfide (Figure 8). Figure 8 also shows that at 550 °C, the characteristic peaks of Sb2S3 corresponding to 135, 178, and 241 cm−1 changed from broad and scattered peaks to narrow and sharp peaks, indicating a better degree of crystallinity of the sulfide formed at this reaction temperature.
In summary, the sulfuration effect was the best under conditions of standard atmospheric pressure, a temperature of 550 °C, and a holding time of 30 min. The number of bright electrodeposited antimony particles in the SEM scanning field of sulfide at 550 °C was very small, and these particles had been basically vulcanized to form Sb2S3 with a sulfuration rate of 96.06%. As determined by the EDS data, the best S/Sb ratio of 1.46 was achieved at 550 °C, and was the closest to the theoretical value of S/Sb = 1.5.

4.2. Volatilization Reaction
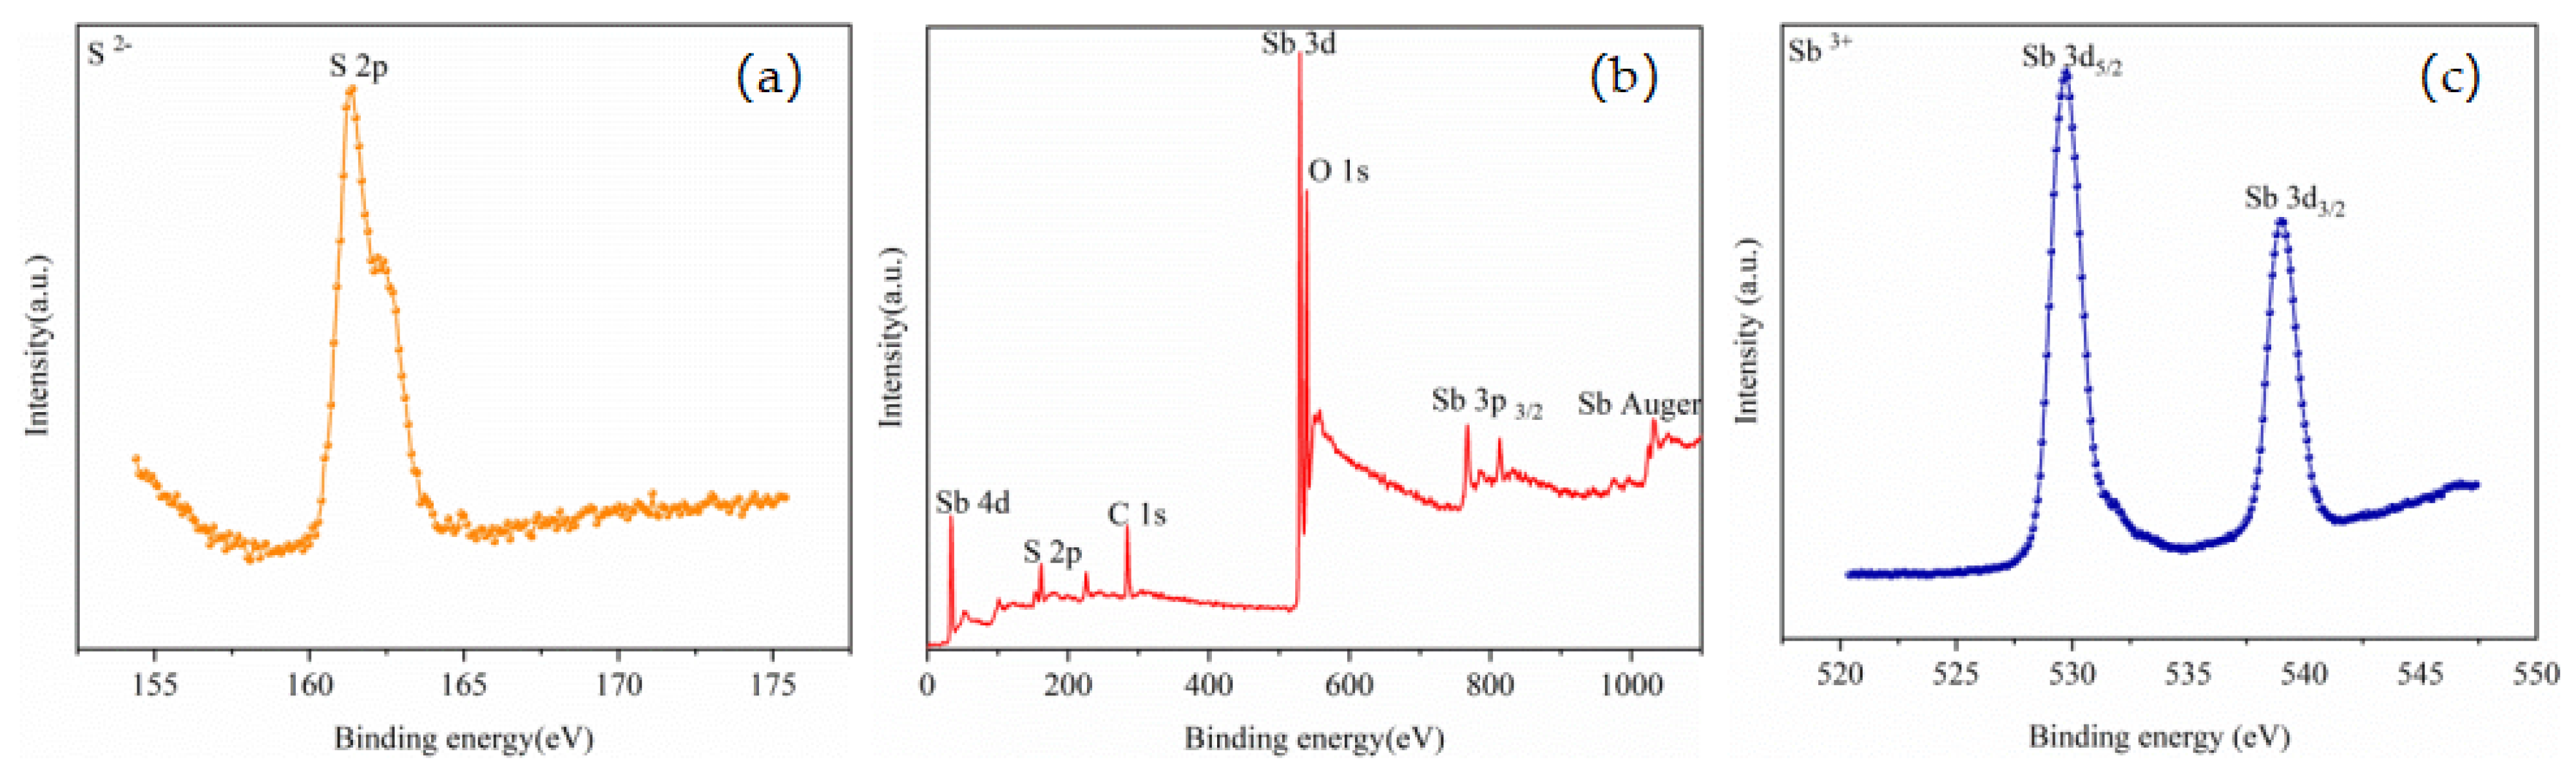
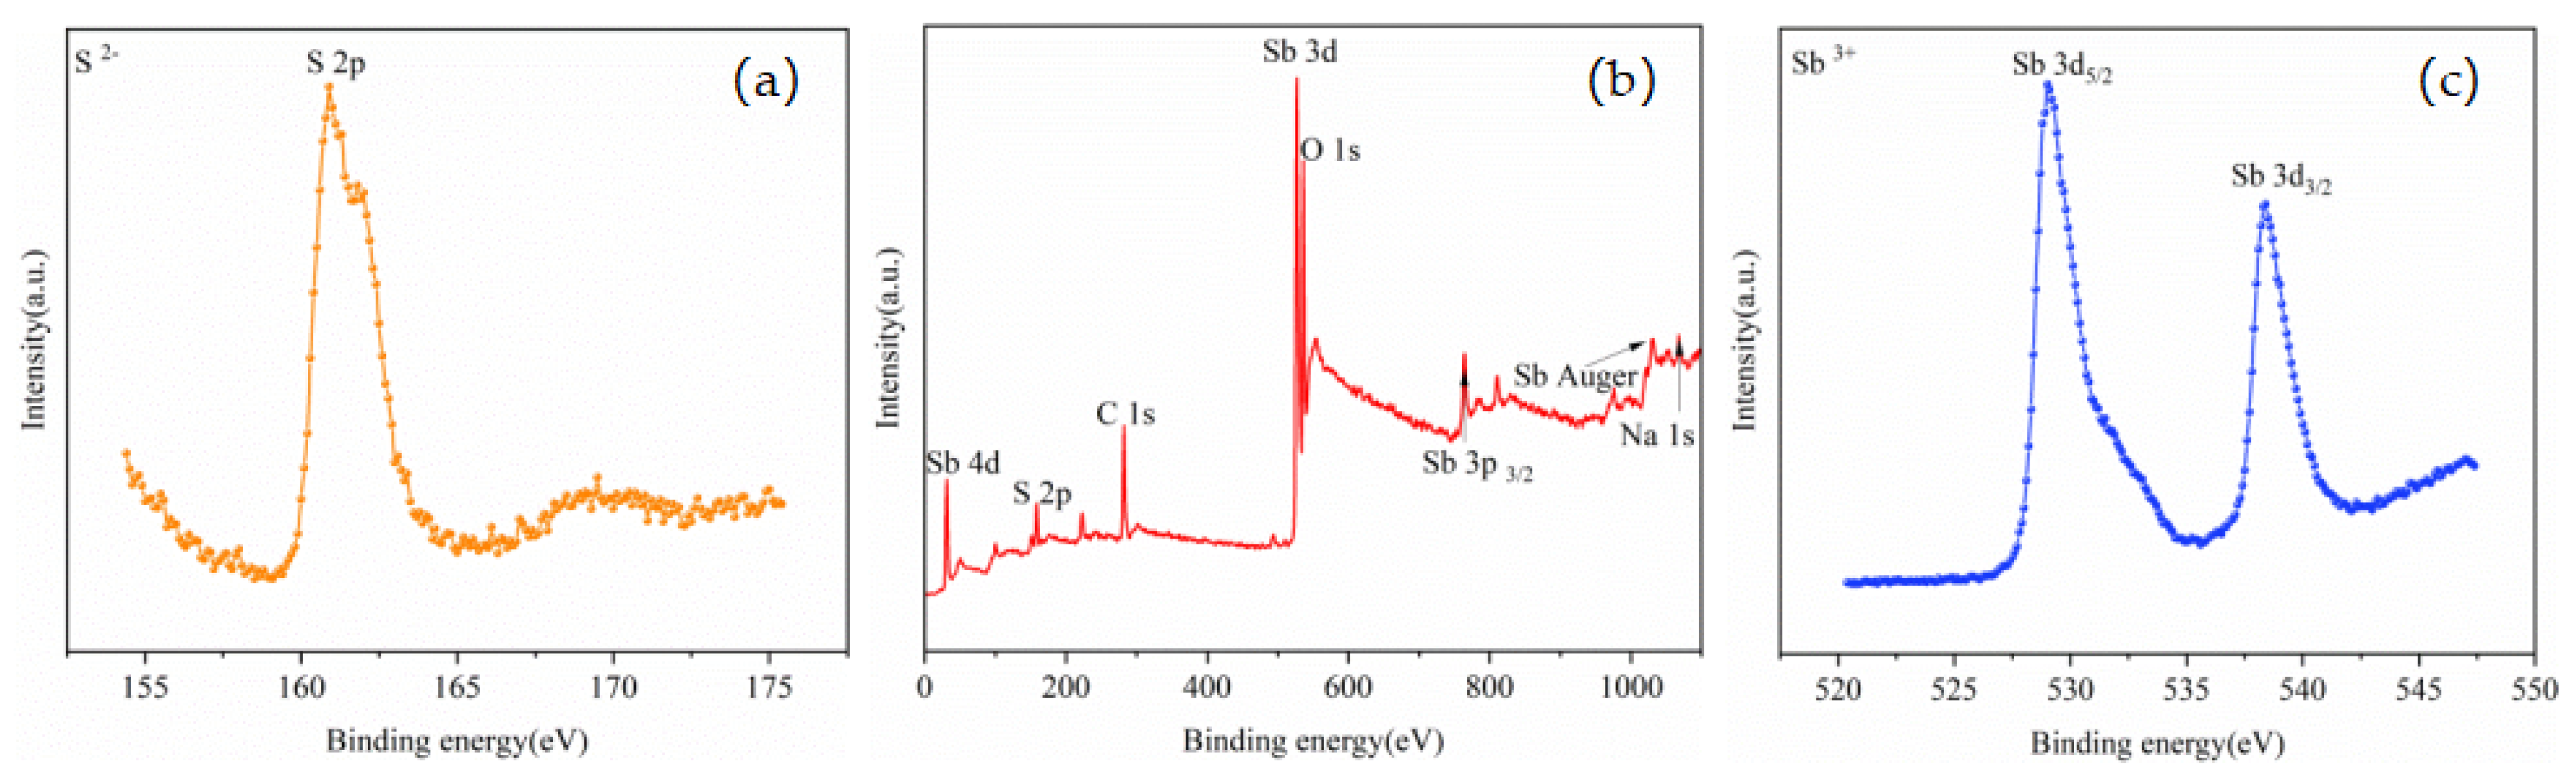
4.2.1. XPS Analysis

The optimal sulfuration conditions of standard atmospheric pressure, a temperature of 550 °C, and a heat preservation time of 30 min were adopted to prepare sulfuration samples as the raw material for the volatilization experiment. In the experiment, the holding time was set to 2 h, the volatilization temperature zone was set to 800 °C, the volatilization pressure gradient was set to 0.2 atm, and the pressure values were 0.2, 0.4, 0.6, 0.8, and 1.0 atm, respectively.
According to the experimental and calculation results, the volatilization rate of antimony sulfide at 0.2 atm was 92.81%, and the contents of Na, Fe, and Se were lower than those under other pressure conditions. To characterize the chemical state of the product, XPS analysis was performed on the volatiles and residues under the conditions of 0.2 atm, 800 °C, and 2 h. The results are presented in Figure 9 and Figure 10, which respectively display the representative XPS spectra of the volatiles and residues. The binding energy of C 1s was designated as the standard value of 284.8 eV [29], and a correction was carried out; the corrected values of charge displacement were respectively 2.50 and 2.40 eV.
The high-resolution XPS spectrum of S 2p is presented in Figure 9a, while the high-resolution XPS spectrum of Sb 3d is exhibited in Figure 9c. The double peaks of Sb 3d5/2 and Sb 3d3/2 related to the Sb-S bond were observed around 529.80 and 539.05 eV, respectively; these peaks are both characteristic of the Sb3+ state. The S 2p peak was observed near 161.50 eV. The peak positions of Sb and S were similar to those reported in the existing literature [30,31,32,33], indicating that the phase representing the volatile was Sb2S3.
The high-resolution XPS spectrum of S 2p is presented in Figure 10a, and the S 2p peak was observed near 160.90 eV. The high-resolution XPS spectrum of Sb 3d is presented in Figure 10c, and the double peaks of Sb 3d5/2 and Sb 3d3/2 related to the Sb-S bond were observed around 529.00 and 538.40 eV, respectively; these peaks are both characteristic of the Sb3+ state. The peak positions of Sb and S were similar to those reported in the existing literature [25,26,27,28], indicating that the phase of the residue was Sb2S3. The Na 1s peak was clearly observed near 1071.32 eV, and the binding energy of Na 1s in the sodium compounds was found to be between 1071.00 and 1071.50 eV based on a database [34]. However, no obvious Na was observed in the XPS spectra of the volatiles; there was no obvious Na 1s peak, indicating that most of the elemental Na remained in the residue.

4.2.2. Chemical Composition Analysis

The chemical compositions of the volatiles and residues under the optimal conditions of a temperature of 800 °C, a pressure of 0.2 atm, and a holding time of 2 h were analyzed. As reported in Table 3, the Na and Fe elements were well separated; compared with their contents in the raw materials, their contents in the volatiles were reduced by about 7.4 and 58.6 times, respectively. Elemental Au was not detected in the volatile species, and it was enriched in the residue by about 1.6 times. These findings demonstrate that this experimental method can realize the enrichment of all the Au in the electrodeposited antimony in the residue, volatilization to obtain the antimony sulfide, and the effective removal of the Na and Fe elements in the antimony sulfide volatiles. Excluding As and Se, other impurities are basically concentrated in the residue. The experimental results reveal that 0.2 atm was the best volatilization pressure within the experimental pressure range. Under this condition, the gold in the electrodeposited antimony was effectively enriched and antimony sulfide was formed simultaneously.

5. Conclusions

In this study, an electrodeposited antimony sulfuration–volatilization method was proposed to prepare antimony sulfide while enriching gold. The feasibility of the process was demonstrated on a laboratory scale, thereby providing theoretical guidance for the value-added use of the electrodeposited antimony obtained via the alkaline leaching of antimony–gold ore. In the experimental temperature range, as the temperature gradually increased, the S/Sb value of the vulcanized sample was also found to gradually increase. The best S/Sb ratio of 1.46 achieved at 550 °C was close to the theoretical S/Sb ratio of 1.50 at 550 °C. The results of SEM and Raman analyses proved that the reaction conditions were the best curing conditions in the experimental range. Under these conditions, the sulfuration rate was the best, namely 96.06%. Moreover, as compared to those under the other pressure conditions, the S/Sb value of the volatile substance under the condition of 0.2 atm was closer to the theoretical value of S/Sb = 1.5. Compared with their contents in the raw materials, the contents of Na and Fe in the volatile matter were reduced by about 7.4 and 58.6 times, respectively. Elemental Au was not detected in the volatile species, and it was enriched in the residue by about 1.6 times. In summary, all the Au in the electrodeposited antimony was basically enriched in the residue, and the effective removal of the Na and Fe elements in the antimony sulfide volatiles was simultaneously realized. The best volatilization pressure within the experimental pressure range was found to be 0.2 atm, and the best volatilization conditions were found to be a pressure of 0.2 atm, a temperature of 800 °C, and a heat preservation time of 2 h. Electrodeposited antimony was found to enrich the gold in the residue via sulfuration–volatilization treatment and generate antimony sulfide, which effectively increased the added value of these products. Antimony sulfide has good volatility and high commercial value. This method increases the product value and reduces the energy consumption of the reaction. Furthermore, this technology has no toxic and harmful by-products, which can reduce environmental pollution and realize clean and effective metallurgy.

Author Contributions

In this joint work, each author was in charge of their expertise and capability: conceptualization, W.W. and J.Y.; methodology, W.W., S.W., J.Y., C.C., K.H., L.X., J.Z., B.X. and B.Y.; theoretical basis, W.W. and C.C.; formal analysis, W.W.; investigation, K.H.; J.Z. and L.X.; resources, B.X. and B.Y.; data curation, W.W., J.Y. and C.C.; writing—original draft, W.W.; writing—review and editing, W.W. and S.W.; visualization, L.X.; supervision, J.Y.; project administration, J.Y.; funding acquisition, J.Y. All authors have read and agreed to the published version of the manuscript.

Funding

This research was funded by National Natural Science Foundation of China (No. 52104350), the Natural Science Foundation of Yunnan Province (No. 2018FD037, 202001AT070045), Personnel Training Project of Kunming University of Science and Technology (No. KKSY201663027). Independent Project of Innovation Center for Complex Nonferrous Metal Resources Clear Use in Yunnan Province (No. KKPT201663012). The Central Government guides local funds for scientific and Technological Development (Yunnan) (No. KKST202052004). Analysis and Measurement Center of Kunming University of Science and Technology (2017T20160012, 2020M20192202047).

Data Availability Statement

The data presented in this study are available on request from the corresponding author. The data are not publicly available due to unfinished related ongoing further studies.

Conflicts of Interest

The authors declare no conflict of interest. The funders had no role in the design of the study, in the collection, analyses, or interpretation of data, in the writing of the manuscript, or in the decision to publish the results.

References

  1. Majzlan, J. Primary and secondary minerals of antimony. Antimony 2021, 17–47. [Google Scholar] [CrossRef]
  2. Dupont, D.; Arnout, S.; Jones, P.T.; Binnemans, K. Antimony Recovery from End-of-Life Products and Industrial Process Residues: A Critical Review. J. Sustain. Metall. 2016, 2, 79–103. [Google Scholar] [CrossRef] [Green Version]
  3. Zhou, Y.J. Antimony Demand Forecast and Supply-Demand Pattern Analysis. Master’s Thesis, China University of Geosciences, Beijing, China, 2015. [Google Scholar]
  4. Anderson, C.G. The metallurgy of antimony. Geochemistry 2012, 72, 3–8. [Google Scholar] [CrossRef]
  5. Grund, S.C.; Hanusch, K.; Breunig, H.J.; Wolf, H.U. Antimony and antimony compounds. In Ullmann’s Encyclopedia of Industrial Chemistry; Wiley-VCH Verlag GmbH & Co. KGaA: Weinheim, Germany, 2000. [Google Scholar] [CrossRef]
  6. Proenza, J.A.; Torró, L.; Nelson, C.-E. Mineral deposits of Latin America and the Caribbean. Preface. Boletín De La Soc. Geológica 2020, 72, P250820. [Google Scholar] [CrossRef]
  7. Yuan, B.; Fan, J.T.; Yu, L.H. Situation Analysis and Countermeasures of Antimony Resources in China. China Land Resour. Dly. 2011, 24, 47–49. [Google Scholar]
  8. Guo, X.Y.; Xin, Y.T.; Wang, H.; Tian, Q.H. Mineralogical characterization and pretreatment for antimony extraction by ozone of antimony-bearing refractory gold concentrates. Trans. Nonferrous Met. Soc. China 2017, 27, 1888–1895. [Google Scholar] [CrossRef]
  9. Guo, X.Y.; Xin, Y.T.; Wang, H.; Tian, Q.H. Leaching kinetics of antimony-bearing complex sulfides ore in hydrochloric acid solution with ozone. Trans. Nonferrous Met. Soc. China 2017, 27, 2073–2081. [Google Scholar] [CrossRef]
  10. Chen, J.; Huang, Z.L.; Yang, R.D.; Du, L.J.; Liao, M.Y. Gold and antimony metallogenic relations and ore-forming process of Qinglong Sb (Au) deposit in Youjiang basin, SW China: Sulfide trace elements and sulfur isotopes. Geosci. Front. 2021, 12, 605–623. [Google Scholar] [CrossRef]
  11. Zhang, L.; Yang, L.Q.; Groves, D.I.; Sun, S.C.; Liu, Y.; Wang, J.Y.; Li, R.H.; Wu, S.G.; Gao, L.; Guo, J.L.; et al. An overview of timing and structural geometry of gold, gold-antimony and antimony mineralization in the Jiangnan Orogen, southern China. Ore Geol. Rev. 2019, 115, 103173. [Google Scholar] [CrossRef]
  12. Yang, T.Z.; Xie, B.Y.; Liu, W.F.; Zhang, D.C.; Chen, L. Enrichment of Gold in Antimony Matte by Direct Smelting of Refractory Gold Concentrate. JOM 2018, 70, 1017–1023. [Google Scholar] [CrossRef]
  13. Rusalev, R.E.; Rogozhnikov, D.A.; Naboichenko, S.S. Investigation of complex treatment of the gold-bearing antimony flotation concentrate. Solid State Phenom. 2018, 284, 863–869. [Google Scholar] [CrossRef]
  14. Guo, X.D.; Wang, X.J.; Zhao, Y.L.; Tang, M.G.; Xiao, L. Structural characteristics and ore-controlling analysis of Jinlongshan gold-antimony ore belt in Shanxi Province. Depos. Geol. 2014, 33, 387–388. [Google Scholar] [CrossRef]
  15. Ubaldini, S.; Veglio, F.; Fornari, P.; Abbruzzese, C. Process flow-sheet for gold and antimony recovery from stibnite. Hydrometallurgy 2000, 57, 187–199. [Google Scholar] [CrossRef]
  16. Yang, T.Z.; Rao, S.; Liu, W.F.; Zhang, D.C.; Chen, L. A selective process for extracting antimony from refractory gold ore. Hydrometallurgy 2017, 169, 571–575. [Google Scholar] [CrossRef]
  17. Celep, O.; Alp, I.; Deveci, H. Improved gold and silver extraction from a refractory antimony ore by pretreatment with alkaline sulphide leach. Hydrometallurgy 2011, 105, 234–239. [Google Scholar] [CrossRef]
  18. Zhang, D.C.; Xiao, Q.K.; Liu, W.F.; Chen, L.; Yang, T.Z.; Liu, Y.N. Pressure oxidation of sodium thioantimonite solution to prepare sodium pyroantimonate. Hydrometallurgy 2015, 151, 91–97. [Google Scholar] [CrossRef]
  19. Zhang, X.F.; Huang, D.X.; Jiang, W.L.; Zha, G.Z.; Deng, J.H.; Deng, P.; Kong, X.F.; Liu, D.C. Selective separation and recovery of rare metals by vulcanization-vacuum distillation of cadmium telluride waste. Sep. Purif. Technol. 2020, 230, 115864. [Google Scholar] [CrossRef]
  20. Zhang, X.F.; Liu, D.C.; Jiang, W.L.; Xu, W.J.; Deng, P.; Deng, J.H.; Yang, B. Application of multi-stage vacuum distillation for secondary resource recovery: Potential recovery method of cadmium telluride photovoltaic waste. J. Mater. Res. Technol. 2020, 9, 6977–6986. [Google Scholar] [CrossRef]
  21. Li, H.L.; Wu, X.Y.; Wang, M.X.; Wang, J.; Wu, S.k.; Yao, X.L.; Li, L. Separation of elemental sulfur from zinc concentrate direct leaching residue by vacuum distillation. Sep. Purif. Technol. 2014, 138, 41–46. [Google Scholar] [CrossRef]
  22. Zhang, F. Study on Purification of Electrodeposited Antimony Enriched Gold by Vacuum Distillation. Master’s Thesis, Kunming University of Science and Technology, Kunming, China, 2021. [Google Scholar]
  23. Dai, Y.J. China Antimony Industry; Metallurgical Industry Press: Beijing, China, 2014. [Google Scholar]
  24. Ouyang, Z. Study on Clean Extraction Process of Reduction and Sulfur Fixation Roasting of Antimony Sulfide Concentrate. Master’s Thesis, Hunan University of Technology, Zhuzhou, China, 2020. [Google Scholar]
  25. Parise, R.; Katerski, A.; Gromyko, I.; Rapenne, L.; Roussel, H.; Karber, E.; Appert, E.; Krunks, M.; Consonni, V. ZnO/Ti-O2/Sb2S3 Core-Shell Nanowire Heterostructure for Extremely Thin Absorber So-lar Cells. J. Phys. Chem. C 2017, 121, 9672–9680. [Google Scholar] [CrossRef]
  26. Yoshioka, A.; Nagata, K. Raman spectrum of sulfur under high pressure. J. Phys. Chem. Solids 1995, 56, 581–584. [Google Scholar] [CrossRef]
  27. Escorcia-Garcia, J.; Becerra, D.; Nair, M.-T.-S.; Nair, P.-K. Heterojunction CdS/Sb2S3 solar cells using antimony sulfide thin films prepared by thermal evaporation. Thin Solid Film. 2014, 569, 28–34. [Google Scholar] [CrossRef]
  28. Tang, A.; Yang, Q.; Qian, Y.-T. Formation of crystalline stibnite bundles of rods by thermolysis of an antimony (III) diethyldithiocarbamate complex in ethylene glycol. Inorg. Chem. 2003, 42, 8081–8086. [Google Scholar] [CrossRef]
  29. Briggs, D.; Beamson, G. Primary and secondary oxygen-induced C1S binding-energy shifts in X-Ray photoelectron-spectroscopy of polymers. Anal. Chem. 1992, 64, 1729–1736. [Google Scholar] [CrossRef]
  30. Salinas-Estevane, P.; Sanchez, E.-M. Preparation of Sb2S3 nanostructures by the ionic Liquid-Assisted low power Sonochemical method. Mater Lett. 2010, 64, 2627–2630. [Google Scholar] [CrossRef]
  31. Mittal, V.K.; Bera, S.; Narasimhan, S.V.; Velmurugan, S. Sorption of Sb(III) on carbon steel surface in presence of molybdate and selenite in citric acid medium. Appl. Surf. Sci. 2011, 258, 1525–1530. [Google Scholar] [CrossRef]
  32. Hanafi, Ζ.M.; Ismail, F.M. Colour Problem of Antimony Trisulphide: IV-X-Ray Photoelectron and Diffuse Reflectance. Z. Für Phys. Chem. 1987, 268, 573–577. [Google Scholar] [CrossRef]
  33. Gheorghiu, A.; Lampre, I.; Dupont, S.; Senemaud, C.; Raghni, M.E.I.; Lippens, P.E.; Olivier-Fourcade, J. Electronic structure of chalcogenide compounds from the system Tl2S-Sb2S3 studied by XPS and XES. J. Alloys Compd. 1995, 28, 143–147. [Google Scholar] [CrossRef]
  34. Kohiki, S.; Ohmura, T.; Kusao, K. Appraisal of a new charge correction method in X-ray photoelectron spectroscopy. J. Electron. Spectrosc. Relat. Phenom. 1983, 31, 85–90. [Google Scholar] [CrossRef]
Figure 1. Process flow chart of electrodeposited antimony sulfide volatilization and enrichment of gold.
Minerals 12 00264 g001
Figure 2. Structure chart of double temperature zone tube furnace: 1—flange connector at inlet, 2—numerical control display, 3—furnace body, 4—holder, 5—control switch, 6—quartz tube, 7—resistance furnace box, and 8—vaccum gauge.
Minerals 12 00264 g002
Figure 3. Saturated vapor pressure curves of Sb, Sb2S3 and Au.
Minerals 12 00264 g003
Figure 4. Sulfide sample pictures: (a) 400 °C, (b) 450 °C, (c) 500 °C, (d) 550 °C, (e) 600 °C, and (f) 650 °C.
Minerals 12 00264 g004
Figure 5. SEM images of antimony sulfide synthesized by electrodeposited antimony sulfide and electrodeposited antimony at different temperatures: (a) 400 °C, (b) 450 °C, (c) 500 °C, (d) 550 °C, (e) 600 °C, and (f) 650 °C.
Minerals 12 00264 g005
Figure 6. EPMA scanning maps of vulcanized sample at 650 °C.
Minerals 12 00264 g006
Figure 7. EPMA scanning maps of recrystallization zone in metal antimony melting at 650 °C.
Minerals 12 00264 g007
Figure 8. Raman spectra of vulcanized samples at different temperatures.
Minerals 12 00264 g008
Figure 9. XPS spectra of volatiles: (a) S 2p core level, (b) Typical XPS survey spectrum, and (c) Sb 3d core level.
Minerals 12 00264 g009
Figure 10. XPS spectra of residue: (a) S 2p core level, (b) typical XPS survey spectrum, and (c) Sb 3d core level.
Minerals 12 00264 g010
Table 1. Chemical composition of electrodeposited antimony.
ElementNaFeAsSeSbAu 1
Content/wt%0.4000.1700.0440.03393.69038
1 The unit of Au content was g/t.
Table 2. Saturated vapor pressure of Sb2S3 and Au.
SubstanceSaturation Vapour Pressure/Pa
773 K873 K973 K1073 K1173 K
Sb1.4511.4459.13225.05674.15
Sb2S35.9866.65447.582127.467752.19
Au4.38 × 10−142.79 × 10−114.65 × 10−92.96 × 10−79.19 × 10⁻⁶
Table 3. Chemical composition of volatiles and residues at 800 °C and 0.2 atm.
TypeContent/wt%
NaFeAsSeSbAu 1
Volatile0.0540.0030.0370.01773.1800
Remains2.5000.1500.0000.01868.95060
1 The unit of Au content was g/t.
Publisher’s Note: MDPI stays neutral with regard to jurisdictional claims in published maps and institutional affiliations.

