
Microplastic Extraction from the Sediment Using Potassium Formate Water Solution (H2O/KCOOH)


1
Institute of Geological Sciences, Faculty of Geography and Geology, Jagiellonian University, ul. Gronostajowa 3a, 30-387 Krakow, Poland
2
Faculty of Chemistry, Jagiellonian University, ul. Gronostajowa 2, 30-387 Krakow, Poland
*
Author to whom correspondence should be addressed.
Minerals 2022, 12(2), 269; https://0-doi-org.brum.beds.ac.uk/10.3390/min12020269
Submission received: 22 January 2022
/
Revised: 17 February 2022
/
Accepted: 17 February 2022
/
Published: 20 February 2022
(This article belongs to the Section Mineral Processing and Extractive Metallurgy)
Abstract
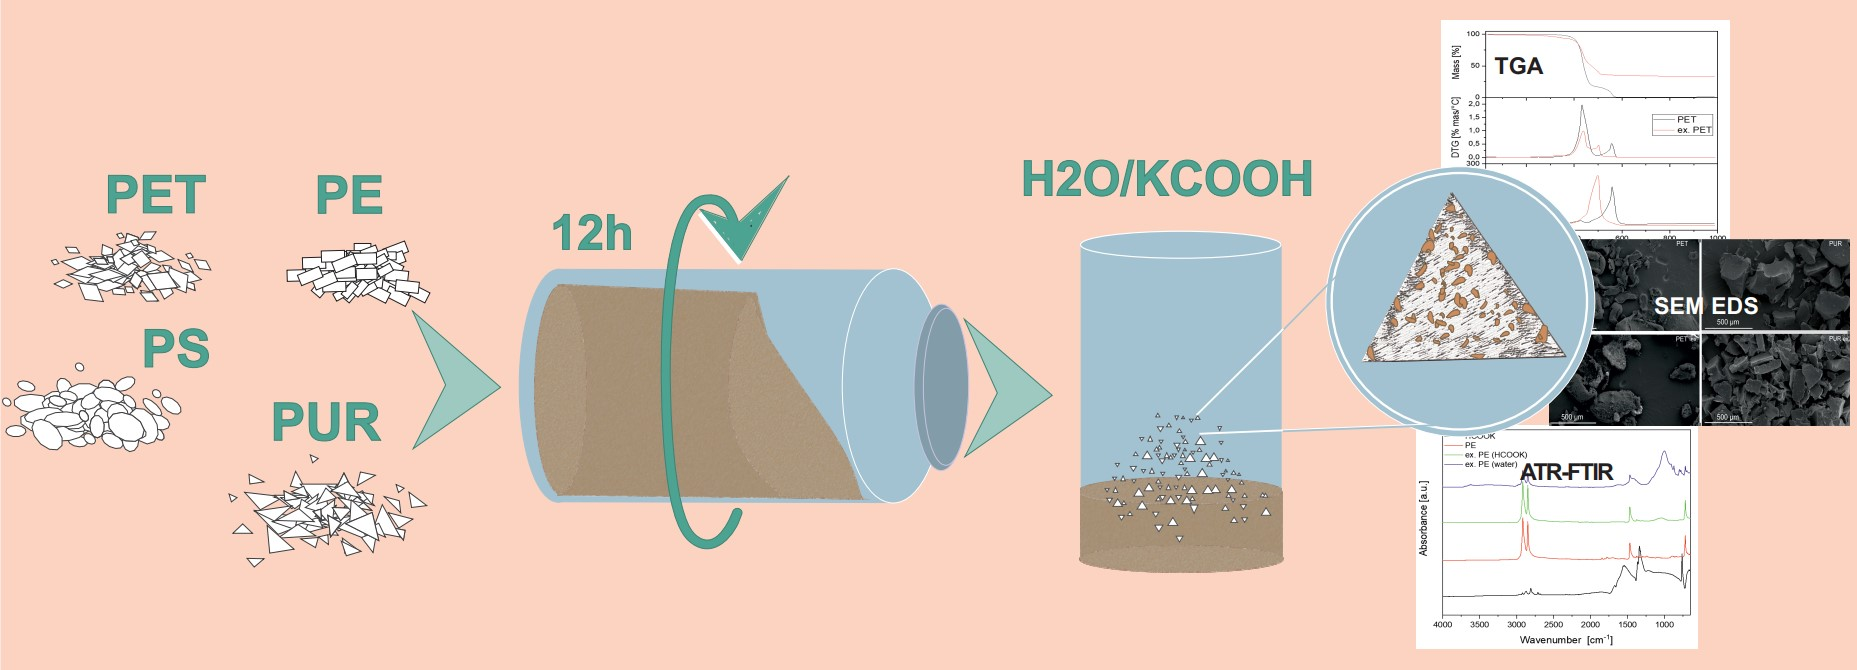
:Microplastics (MPs) are considered an important stratigraphic indicator, or ‘technofossils’, of the Anthropocene. Research on MP abundance in the environment has gained much attention but the lack of a standardized procedure has hindered the comparability of the results. The development of an effective and efficient method of MP extraction from the matrix is crucial for the proper identification and quantifying analysis of MPs in environmental samples. The procedures of density separation used currently have various limitations: high cost of reagents, limited solution density range, hazardous reagents, or a combination of the above. In this research, a procedure based on density separation with the use of potassium formate water solution (H2O/KCOOH) in controlled conditions was performed. Experimental sediment mixtures, spiked with polyethylene (PE), polystyrene (PS), polyurethane (PUR) and polyethylene terephthalate (PET) particles were prepared and an extraction procedure was tested in the context of a weight-based quantitative analysis of MPs. This article discusses the effectiveness and safety of the method. It additionally provides new information on the interactions between MP particles and the mineral matter of the sediment. Results were acquired with the use of instrumental methods, namely thermogravimetry (TG), Fourier Transform Infrared (FTIR) spectroscopy, Field Emission Scanning Electron microscopy and Energy Dispersive spectrometry (SEM/EDS), as well as X-ray fluorescence (XRF) analysis.

1. Introduction
1.1. Microplastics in Sediments
Materials made with synthetic polymers have characteristics that are interesting from a geological perspective. Plastic is always of anthropogenic origin [1] so all its forms (e.g., MPs) can be traced back solely to human activity. In the year 2000, Crutzen and Stromer proposed a new geological epoch, the Anthropocene. The Subcommission on Quaternary Stratigraphy tasked the Anthropocene Working Group with introducing that geological unit and setting its boundary. Synthetic polymers were immediately noticed as a visible record of global scale human dominance [2,3]. Other stratigraphically useful traits are their durability and versatility. Synthetic polymers were invented to serve the need for a cheap and resistant material [4] but their persistence also resulted in them becoming an emerging pollutant [5]. The omnipresence of MPs provides an example of how the atmosphere, hydrosphere and lithosphere are penetrated by anthropogenic materials [6]. In comparison to anthropogenic macro-objects, the relatively small size of MP particles (a maximum less than five millimeters along the largest diameter; [7] Thomson et al., 2004), allows them to accumulate unnoticeably and easily penetrate different media [8]. Particles much smaller than the millimeter size range are also considered microplastics—down to 1 µm. Due to this wide size range for particles, there are subdivisions of MPs for identifying for e.g., small MPs in the 201,000 µm size range [9].
The current discussion concerning MP classification often emphasizes the need for harmonizing size categories as well as making them less arbitrary and founded on a physical or biological basis instead [10,11]. The main difficulty encountered in this area lies in the fact that the first, broader definition has already been widely adopted and research papers in the thousands have used this definition. Therefore, changes in classification can potentially add to problems of research incomparability that already exist due to methodological challenges [12].
The amount of plastic produced yearly is alarmingly high and rose from 359 million tonnes to 368 million tons between 2018 and 2019 (Plastic Europe 2020). The most recent comparable data on plastic production and consumption are from before the COVID-19 pandemic. This crisis affected global production [13] and possible pathways of single-use plastic into the environment [14,15]. A significant part of the plastic produced is never properly treated after the end-of-life of the product. Almost every plastic that is not utilized, recycled or subject to waste treatment procedure, e.g., incineration, will, in turn, become a ‘technofossil’ in sediment or part of the anthropogenic sediment layer as a whole—the material record of human activity.
Apart from its role as pollutant or ‘technofossil’, methods of microplastic research in sediment must be improved to accurately describe those phenomena. Moreover, emphasis must be put on interactions between the sediment and microplastic particles. In terms of MP preservation and the efficiency of MP separation, there is a visible lack of not only a unified method but also research standards [16]. The presence of microplastics in sediments, their toxicity, degradation patterns, their ways of penetrating the environment and how they themselves change during this process cannot be thoroughly examined without the proper procedures [17,18,19,20]. These allow an assessment of the dangers behind microplastic abundance as well as its stratigraphic potential.
1.2. Density Separation Methods
Research on microplastic pollution has been conducted simultaneously by a vast number of research teams [21,22,23]. It is also a popular subject of citizen science [24,25,26]. Thus, protocol safety, both towards people and the environment, must be thoughtfully taken into consideration. Prioritization of the principles of green chemistry in MP research is key, as this research is often performed for environmental protection reasons. Apart from some far-reaching conclusions, the phenomenon of MP abundance in the environment is still rather poorly known [27]. Based on large scale reviews [28,29]) density separation is the most widespread approach, either as a part of a multistep extraction and analytical procedure or combined with a solely optical inspection. It was originally proposed with the first formal definition of a microplastic [7] and has been developing ever since. There are differences in the quantity of sediment, the volume and type of solution used and the chemical composition and laboratory equipment involved. These different solutions are not cost-effective enough, are possibly hazardous, are not time-effective or omit some popular higher density synthetic polymers [30]. There has been a constant search for better solutions and improved procedures [16,31,32] with cost-effective, fast and environmentally friendly approaches being the most desired.
Density separation has already been described in 124 research papers to date [30]. In a comparative perspective [30] H2O/KCOOH has not been mentioned among the solutions used for density separation. NaI has been found to be problematic as it blackens the cellulose filters, making visual inspection borderline impossible and ZnBr2 is hazardous. Using NaCl is cheapest but the most time consuming as it requires careful sediment washing (e.g., three times according to [32]) and has a wide error margin since it does not allow for the recovery of low-density microplastics. Using high-density solutions is crucial to raising the recovery rate and obtaining slim error bars [32]. However popular high-density solutions are classified as harmful and toxic by GHS (Globally Harmonized System) Hazard Statements: NaI (hazard code: H303, H315, H319, H400), ZnCl2 (H302, H314, H400, H410), or contain elements the identification of which is important for environmental pollution analysis and it is preferable to not be forced to omit them. The answer for those challenges could be H2O/KCOOH.
1.3. Density Separation with Potassium Formate Solution (H2O/KCOOH)
Formic acid potassium salt (potassium formate—KCOOH) biodegradation in the environment is a fast and very effective process [33]. Its effectiveness is not diminished in low temperatures and both aerobic and anaerobic conditions. As such, it has been proposed as a safer alternative to popular but less biodegradable chloride salts (NaCl and CaCl2) for road winter de-icing purposes [33]. Potassium formate, as well as cesium and sodium formate solutions, has been used in massive amounts in the oil and gas drilling industry as a major component of drilling fluids for at least three decades [34,35,36]. The major advantage of these solutions is their capability of stabilizing polymers (such as polyglycol or polyanionic cellulose polymer) added to the mud, which makes the drilling fluids more temperature resistant. The other important reason to use them, apart from their good performance in a wide range of conditions, comes from the positive parameters in terms of the toxicological and ecotoxicological properties of KCOOH [37]. Drilling fluids based on (H2O/KCOOH) and containing synthetic polymers, have been classified as temperature resistant (up to 200 °C) and meeting biological toxicity discharge requirements/criteria for the first level sea area [38] KCOOH is also being used in the design of water harvesters as a non-corrosive and more environmentally friendly alternative [39] (Ayyagar et al., 2021). The non-corrosivity is additionally important because in plastic research all the equipment used for experimental needs to be plastic free and is thus often made of steel.
There has been a mention of using ~1.5 g/cm3 H2O/KCOOH in studies from China regarding MP [40,41]. It was also simply described as being too expensive [42], which is refutable, as prices of the pure reagent differ vastly. For this research procedure, KCOOH was purchased in retail, at a price of around 20 USD/kg (Krakchemia S.A, Kraków, Poland). There seems to be no reason not to use the H2O/KCOOH solution of the same density instead of a NaCl/NaI mixture in a closed-loop setting.
In this study, experimental mixtures of sand-dominated mineral material mixed with different types of polymer grains were used as MP-polluted sand analogues. The efficiency of separation was verified using TG, ATR-FTIR and SEM-EDS.
2. Materials and Methods
2.1. Sediment with Microplastic
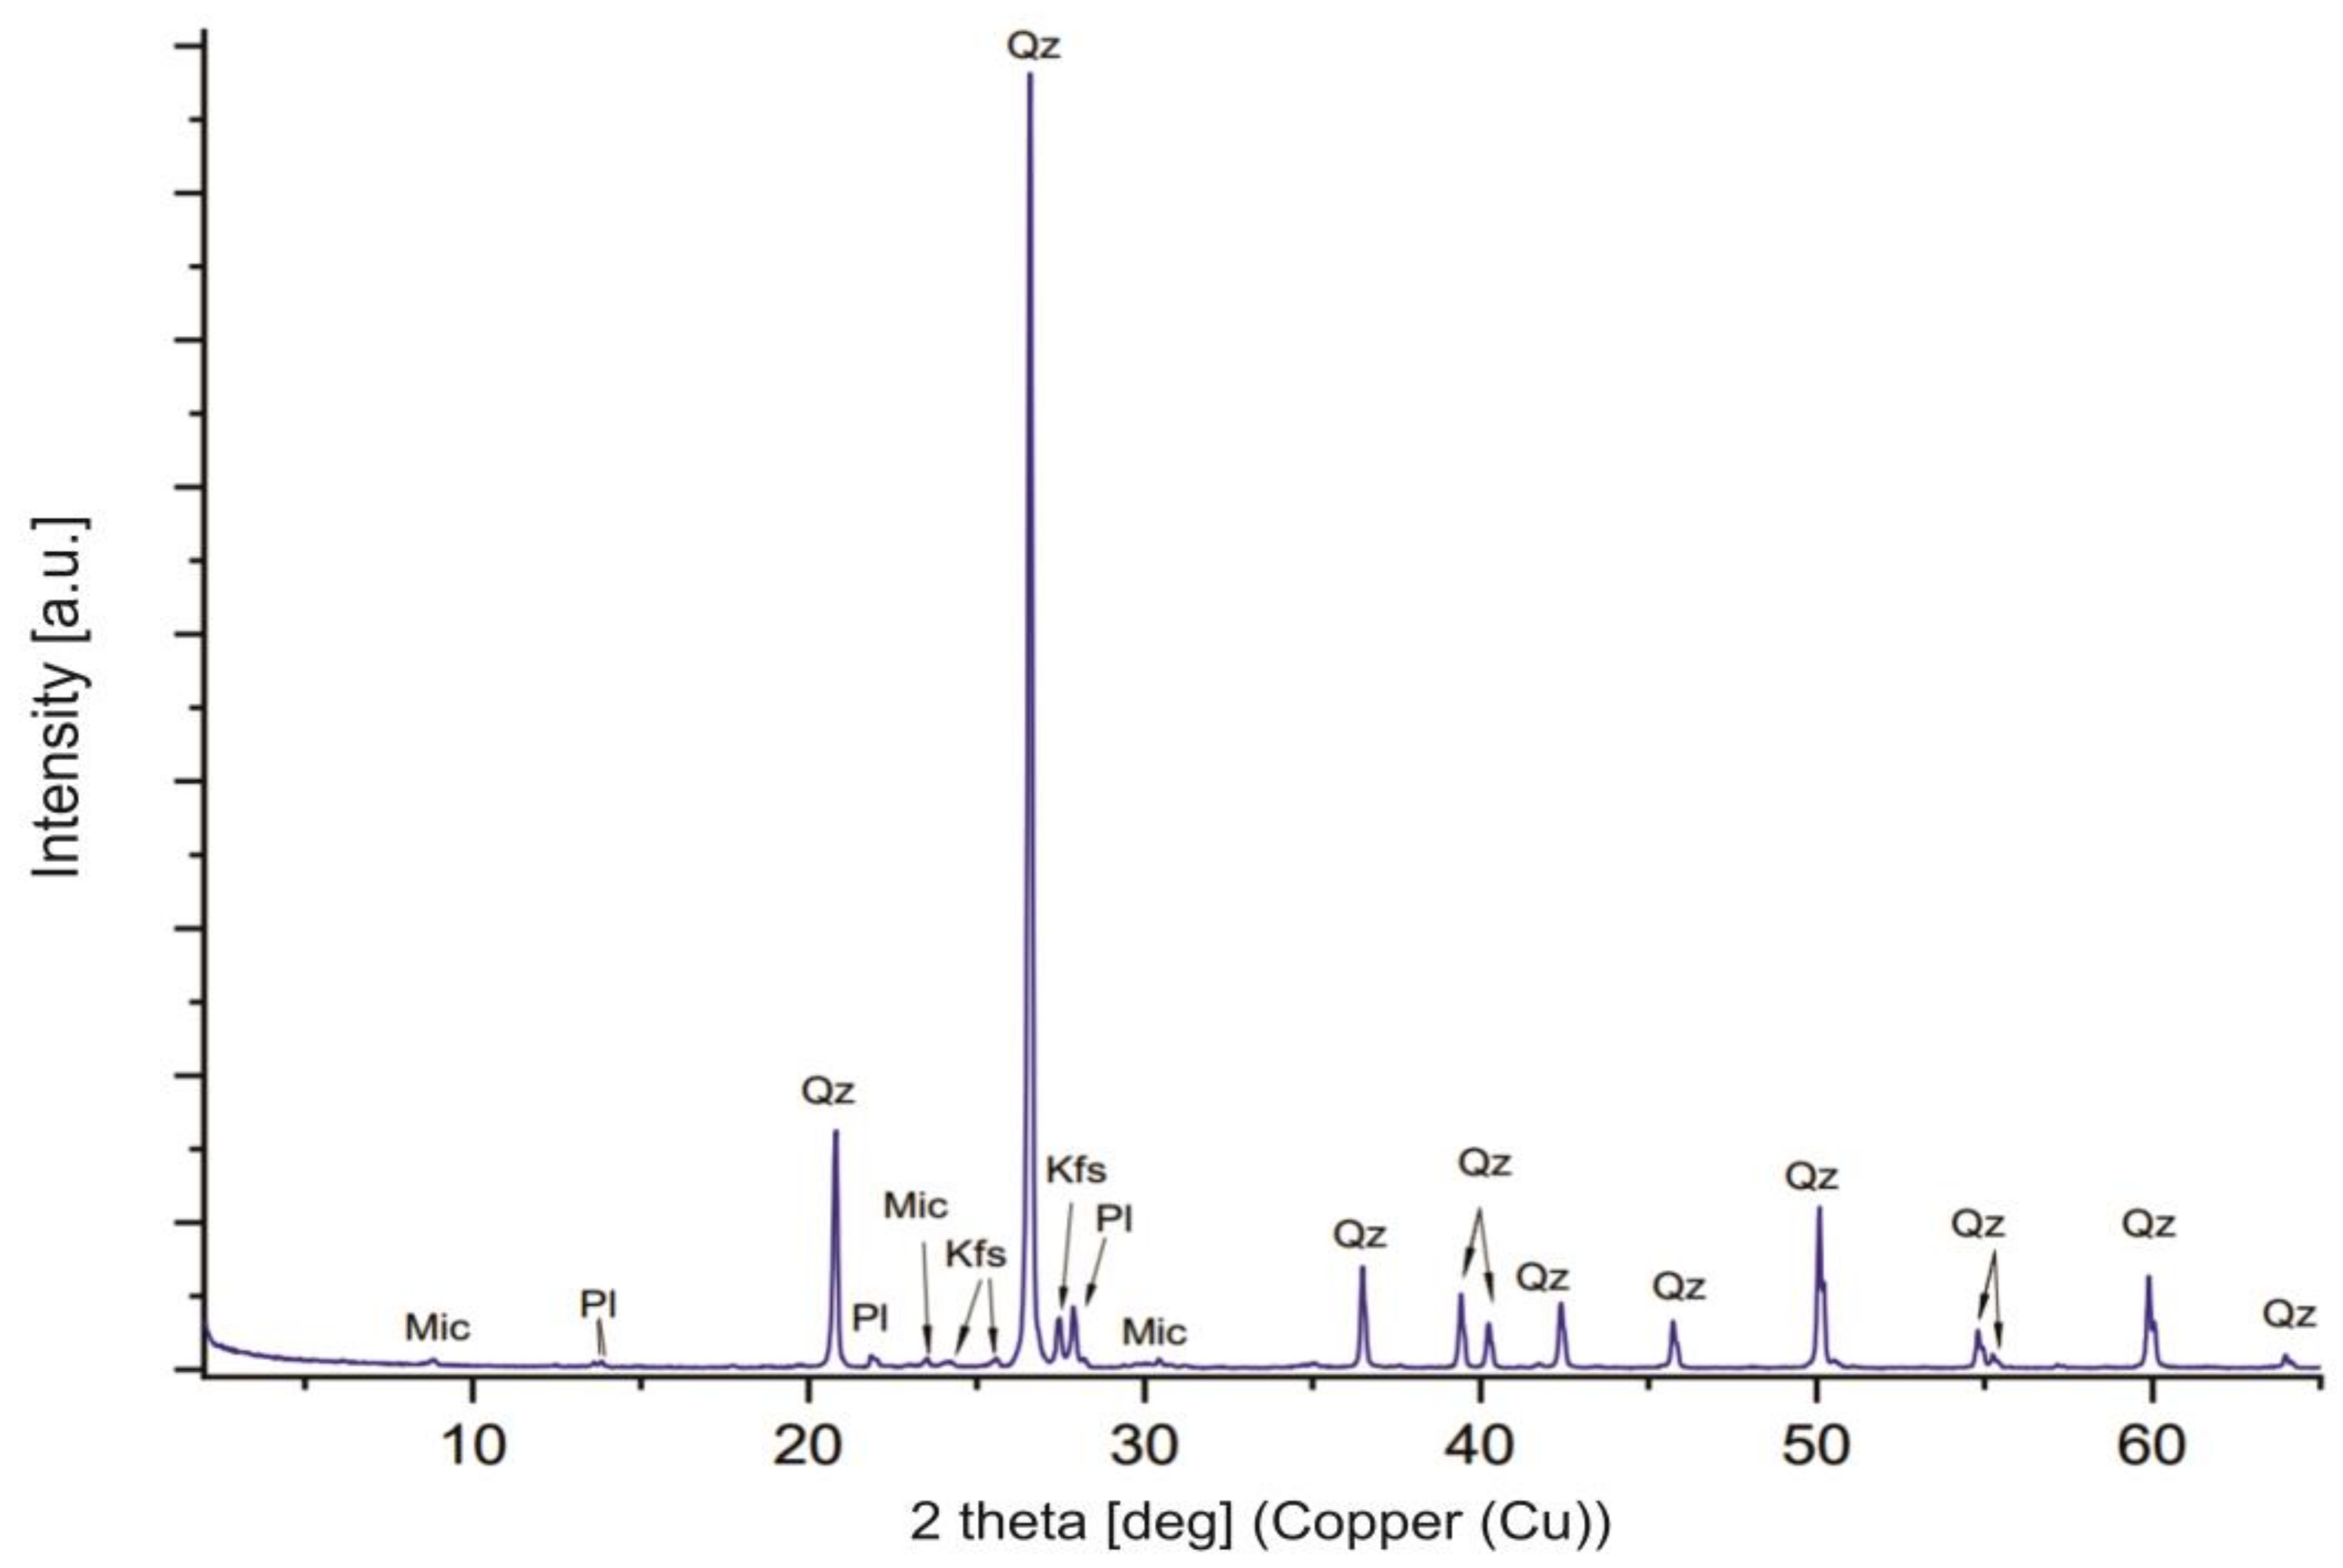
The environmental sample analogue was obtained by adding prepared microplastics to a pure sediment sample. The sampling site for the sediment was a sand mine in Jadowniki (Southern Poland). This sand deposited in the Pleistocene is of fluvioglacial origin. The top layer of sand was freshly removed by a hydraulic excavator. The sand was then collected from a one-meter depth and was placed in glass containers to avoid contamination. One kilogram of sediment was used to perform granulometric analysis using a set of sieves (Figure 1). Sediment was dominated by a sand fraction of 0.063–2.0 mm. X-ray diffraction analysis (XRD) confirmed that the sediment was composed mostly of quartz, but potassium feldspar, mica minerals and plagioclases were also present (Figure 2).
The four diverse MP samples were prepared from different synthetic polymers representing different densities (from 0.91 to 1.40 g/cm3). The polymers were chosen from the most popular types commonly used for packaging and in the production of construction materials (Plastic Europe 2020) as well as those most often identified in environmental samples of different origins [17,28,43,44] (Akgogan et al., 2019; Van Cauwenberghe et al., 2015; Yang et al., 2021 Zhang et al., 2017), including expandable polystyrene beads—PS (before expanding); polyurethane—PUR from polyurethane foam; polyethylene—PE from granules prefabricate; polyethylene terephthalate—PET, from a plastic bottle (cleaned using deionized water). All polymers were finely ground using the grinder. The grinding process was performed in intervals to avoid the overheating of the plastic. The size range of the obtained polymer particles was from 0.02 to 0.8 mm (measured in SEM).
In the next step, one gram of MP prepared in this way was added to one kilogram of sediment. Six samples were prepared, five containing microplastics and one blank sample. Each analogue was mixed in the glass container on a roller mixer for 12 h to obtain a homogenous mixture and to simulate mechanical interactions such as friction or the crushing or flattening of synthetic polymers due to the movement of the sediments and weight of the overlying material.
2.2. Potassium Formate Solution Preparation
The solution was prepared by dissolving KCOOH in prefiltered deionized water (~60% concentration) in a 5 L glass beaker while stirring on a heated magnetic stirrer set for 26 °C. The temperature was set above room temperature to facilitate the endothermic process. After returning to room temperature (22 °C) some of the potassium formate formed crystals. The density of solution was then measured using a 25 mL pycnometer (triple measurement) and the result was 1.41 g/cm3.
2.3. Density Separation Protocol
Each of the six samples was divided into eight high beakers of 800 mL capacity and each was filled with 500 mL of H2O/KCOOH (~60% concentration, density 1.41 g/cm3). The samples were stirred for 2 min by hand using a glass rod and left for at least 48 h for the sedimentation of mineral compounds and the separation of the MPs. This was determined by the clarity of the liquid above the sediment. The time required for the effective separation of the MPs from the matrix needed to be analyzed in two aspects: (1) the velocity of the sediment moving downwards due to gravitational forces and (2) the time necessary for the MPs to emerge to the surface. The second parameter was more complicated to determine due to the heterogenic nature of MPs (Ahmed et al., 2021) including their shape, porosity, the biofilms formed on materials attached to their surface and the effect settling process [45]. It was also analyzed to determine the behavior of MPs in the water environment [46]. The filtration was performed with the use of a vacuum filtration set and 1.2 µm Whatman® glass microfiber filters of 47 mm diameter with deionized water. The filter was then also rinsed with deionized water. For each mixture, 4 l of solution was prepared and divided in 8 equal portions (0.5 L) and added to 800 mL high beakers with the spiked sediment. An additional sample of the sediment spiked with PE was treated with deionized water instead of H2O/KCOOH in the same way. The filtrated, washed and dried samples of extracted polymers exhibited a loose form; therefore, they could be dumped from the fiber glass filter to the Petri dish. As-prepared materials were used in the SEM observations. However, before the TG and ATR measurements, all the samples were homogenized by gentle grinding in a small agate mortar (8 mL of volume).
2.4. Instrumental Methods
X-ray Powder Diffraction (XRD) of the sediment used to prepare the analogue was conducted with the use of a Θ-2Θ PHILIPS X’pert APD diffractometer. The diffractometer had a PW 3830 generator and a vertical goniometer PW 3020 installed, with radiation monochromatized by a graphite diffracted-beam monochromator. An accelerating voltage of 40 kV and a 30 mA current of a cathode filament was used. All measurements were taken on Bragg–Brentano geometry. For raw samples, the angular range was 2–65°, while the measurement time point was 2 s per step and with a step equal to 0.02°.
Thermal analysis of the initial microplastic samples and the microplastic samples separated from the sediment was performed using a TA Instruments SDT Q600 thermal analyzer. Each time, 10 mg (+/−0.2 mg) of a sample was heated in the temperature range of 30–1000 °C in air flow (100 mL/min) at a heating rate of 20 °C/min. The sample was dried before the measurement at 80 °C overnight. TG, DTG and heat flow curves were recorded.
ATR-FT-IR spectra samples (previously ground in a small agate mortar) were recorded in the wavenumber range of 4000–650 cm−1 (Mid-IR) using a Nicolet 6700 FT-IR spectrometer equipped with an ATR (Attenuated Total Reflectance) accessory (Smart iTR, Thermo Scientific) and MCTA detector. The measurements were carried out at the resolution of 2 cm−1 collecting 100 scans for each spectrum.
Field Emission Scanning Electron Microscopy and Energy Depressive Spectrometry (SEM-EDS) were also carried out. A HITACHI S-4700 field emission scanning electron microscope equipped with NORAN NSS energy dispersive spectrometer was used to check the size and morphology of the microplastic grains and thechemical composition of material deposited on MP particles after the experiment. For imaging, the secondary electron (SE) mode was applied at a 10 or 20 kV accelerating voltage. Spot chemical analyses were performed at a 20 kV voltage and an acquisition time of 100 s. For element content quantification, the standardless method was used. Microplastic grains were analyzed prior to the experiments and after the separation from the experimental mixtures. Samples were mounted on carbon adhesive discs and coated with carbon.
2.5. QA/QC
Measures were taken to prevent external contamination and assure the quality of the analysis. Before the sediment preparation and extraction procedure the laboratory was carefully cleaned. All the surfaces were washed using laboratory grade tissue paper with prefiltered, deionized water and then swiped with ethanol. All the equipment used was made of glass, except for the magnetic stirring bar covered with PTFE (density 2.2 g/cm3, therefore unable to be extracted by this solution). Deionized water used to clean the laboratory, as well as to prepare the H2O/KCOOH solution, was prefiltered with Whatman® glass filters with a mesh size of 1.2 µm. The solution was also prefiltered to avoid contamination from the reagent. The filter was changed after 4 L of fluid filtration. The glassware was cleaned and then rinsed with prefiltered deionized water. The blank sample (sediment without the addition of polymers) in the same amount as the spiked mixtures (1 kg) was analyzed along with the experimental mixture of polymers and sediment and no synthetic polymers were detected in the blank sample. The filtration set, as well as the beakers, was covered with aluminum foil at all times. Steel devices were used to collect sand and all the containers were decontaminated beforehand.
3. Results and Discussion
3.1. Microplastic Recovery and Identification
3.1.1. Density Separation with Deionized Water
Taking into consideration PE density, it should be possible to extract it effectively with water. The separation of the supernatant was challenging without the perturbation of the sediment. Rinsing the walls of the glass beaker was also difficult as the sediment tended to stick to them. It was noticeable because of the large amounts of MPs added to the mixture and this phenomenon could be neglected in the environmental samples, causing potential errors. After the extraction and drying process, the mass of the extracted material was 0.86 g. In comparison with the initial white PE MP, the extracted material was beige. Closer inspection showed very fine sediment particles attached to the polymer. The sample was then analyzed by FTIR and the quartz absorption bands were noted in the spectra ~1100 cm−1 and ~780–800 cm−1 (Figure 3).
3.1.2. Density Separation with H2O/KCOOH and Analysis of Extracted Microplastics
The water separation PE was compared with the effectiveness of H2O/KCOOH by comparing the weights of the separated materials and their composition (Figure 3) The composition was analyzed by first homogenizing a small amount of the extracted material.
As for PE identification, there were characteristic peaks visible associated with: -C-H asymmetric stretching ~2910 cm−1 and ~2850 cm−1, C-H bending vibration ~1460 cm−1, C-C rocking vibration ~730 cm−1. In the case of water-extracted PE, C-C rocking and C-H bending vibrations peaks were partly covered with the spectra of minerals present in the sediment.
After the comparison of the PE samples, higher density MPs were only treated with the H2O/KCOOH as water extraction was ineffective even for the lowest density MP. For the samples treated with the H2O/KCOOH solution, it was easier to extract microplastics, but some of the microplastics still stuck to the sides of the beaker.
Potassium formate is often used in drilling fluids as an additive responsible for limiting the swelling of clay minerals [47,48]. This property might have prevented some of the fine sediments from dispersion. This resulted in much less mineral content in the extracted material (Figure 3).
Apart from their higher density compared to PE, both PUR and PS MP emerged more easily to the surface of the supernatant and the layer of fine sediment was formed on the surface of the rest of the settled sediment. It was less easy to agitate the sediment; however, it remained a difficulty.
Except for PET MP, the separated PE, PUR and PS MP particles floated to the top without noticeable differences. In the case of the PET MP particles, most of them floated on the surface of the supernatant; however, the rest were suspended in the fluid column or left in the sediment mixture.
Comparing the spectra of HCOOK and PE, in cases where some residue was left on the MP particles this might have led to misleading readings in the identification process; however, HCOOK dissolved very effectively and did not (Figure 3 and Figure 4) affect the identification. The amount of deionized water needed for rinsing was minimal. The least clear spectrum came from the sample where water extraction was performed. This is a strong confirmation of the visual inspection results which showed a considerable amount of sediment particles entering the sample during the elutriation phase. The predictable outcome was that some part of the microplastic would not reach the surface of the water. However, even the MP that reached the surface was coated by sediment to the point where it made the identification significantly more difficult and the gravimetric analysis results inaccurate.
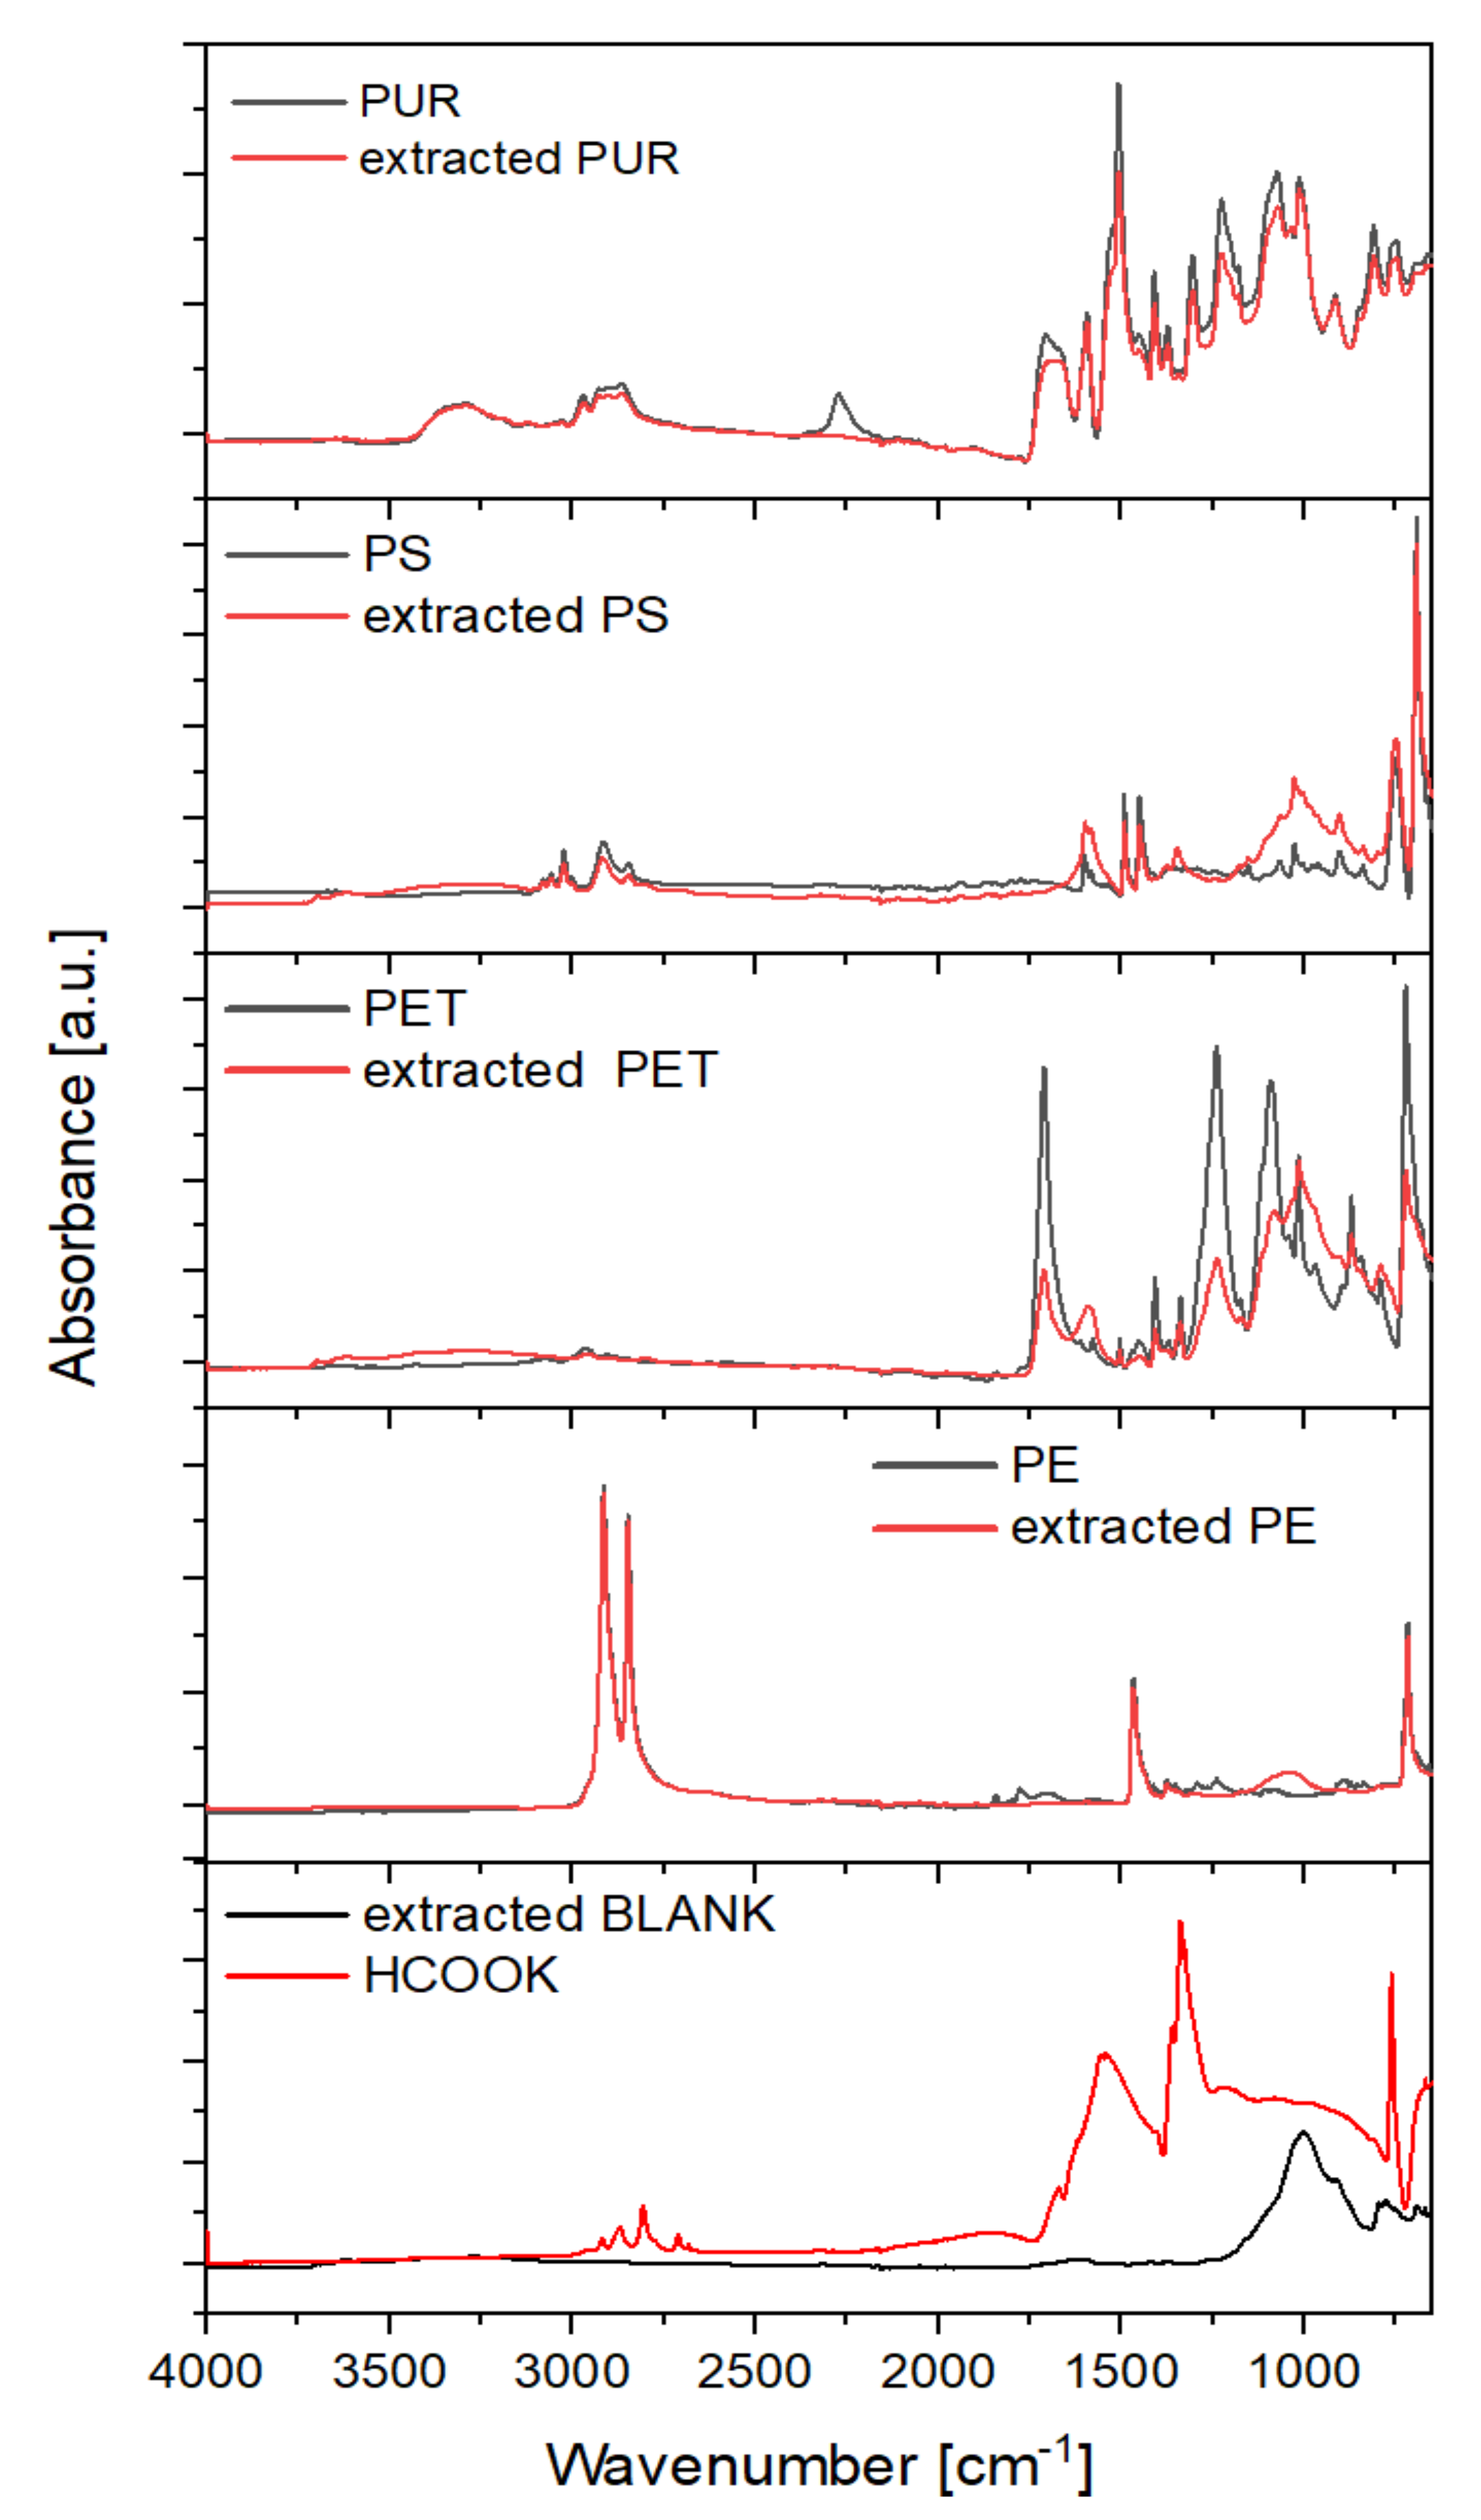
Synthetic polymer types can be identified by their specific IR absorption peaks [49,50,51]. The characteristics of the present polymers (Figure 3) are listed below.
PUR: Strong peak of stretching vibrations of the C=O carbonyl group at 1707 cm−1, the stretching and bending vibrations of the N-H as a strong band at 1507 cm−1, the intense peak at 1595 cm−1 from the stretching skeletal vibrations of C=C bonds present in the aromatic rings, weak symmetric and asymmetric stretching vibrations of -CH2- aliphatic groups at 2971 cm−1 and 2868 cm−1, the deformation vibrations of the C-H at 1410 cm−1, the stretching vibration of C(O)O-C groups band at 1227 cm−1.
PS: Presence of 1600 cm−1 of C=C bonds from the stretching vibration of the aromatic rings, 3025 cm−1 aromatic C-H cm−1 stretch, 2845 cm−1 C-H stretch, 1492 cm−1 aromatic ring stretch, 1451 cm−1 -CH2- bend, 1027 cm−1 aromatic C-H bend and very strong peak-694 cm−1 of aromatic C-H out-of-plane bend. Additionally, the absence of ~1720 cm−1 peak of the carbonyl group was helpful in distinguishing PS from other synthetic polymers with similar characteristics.
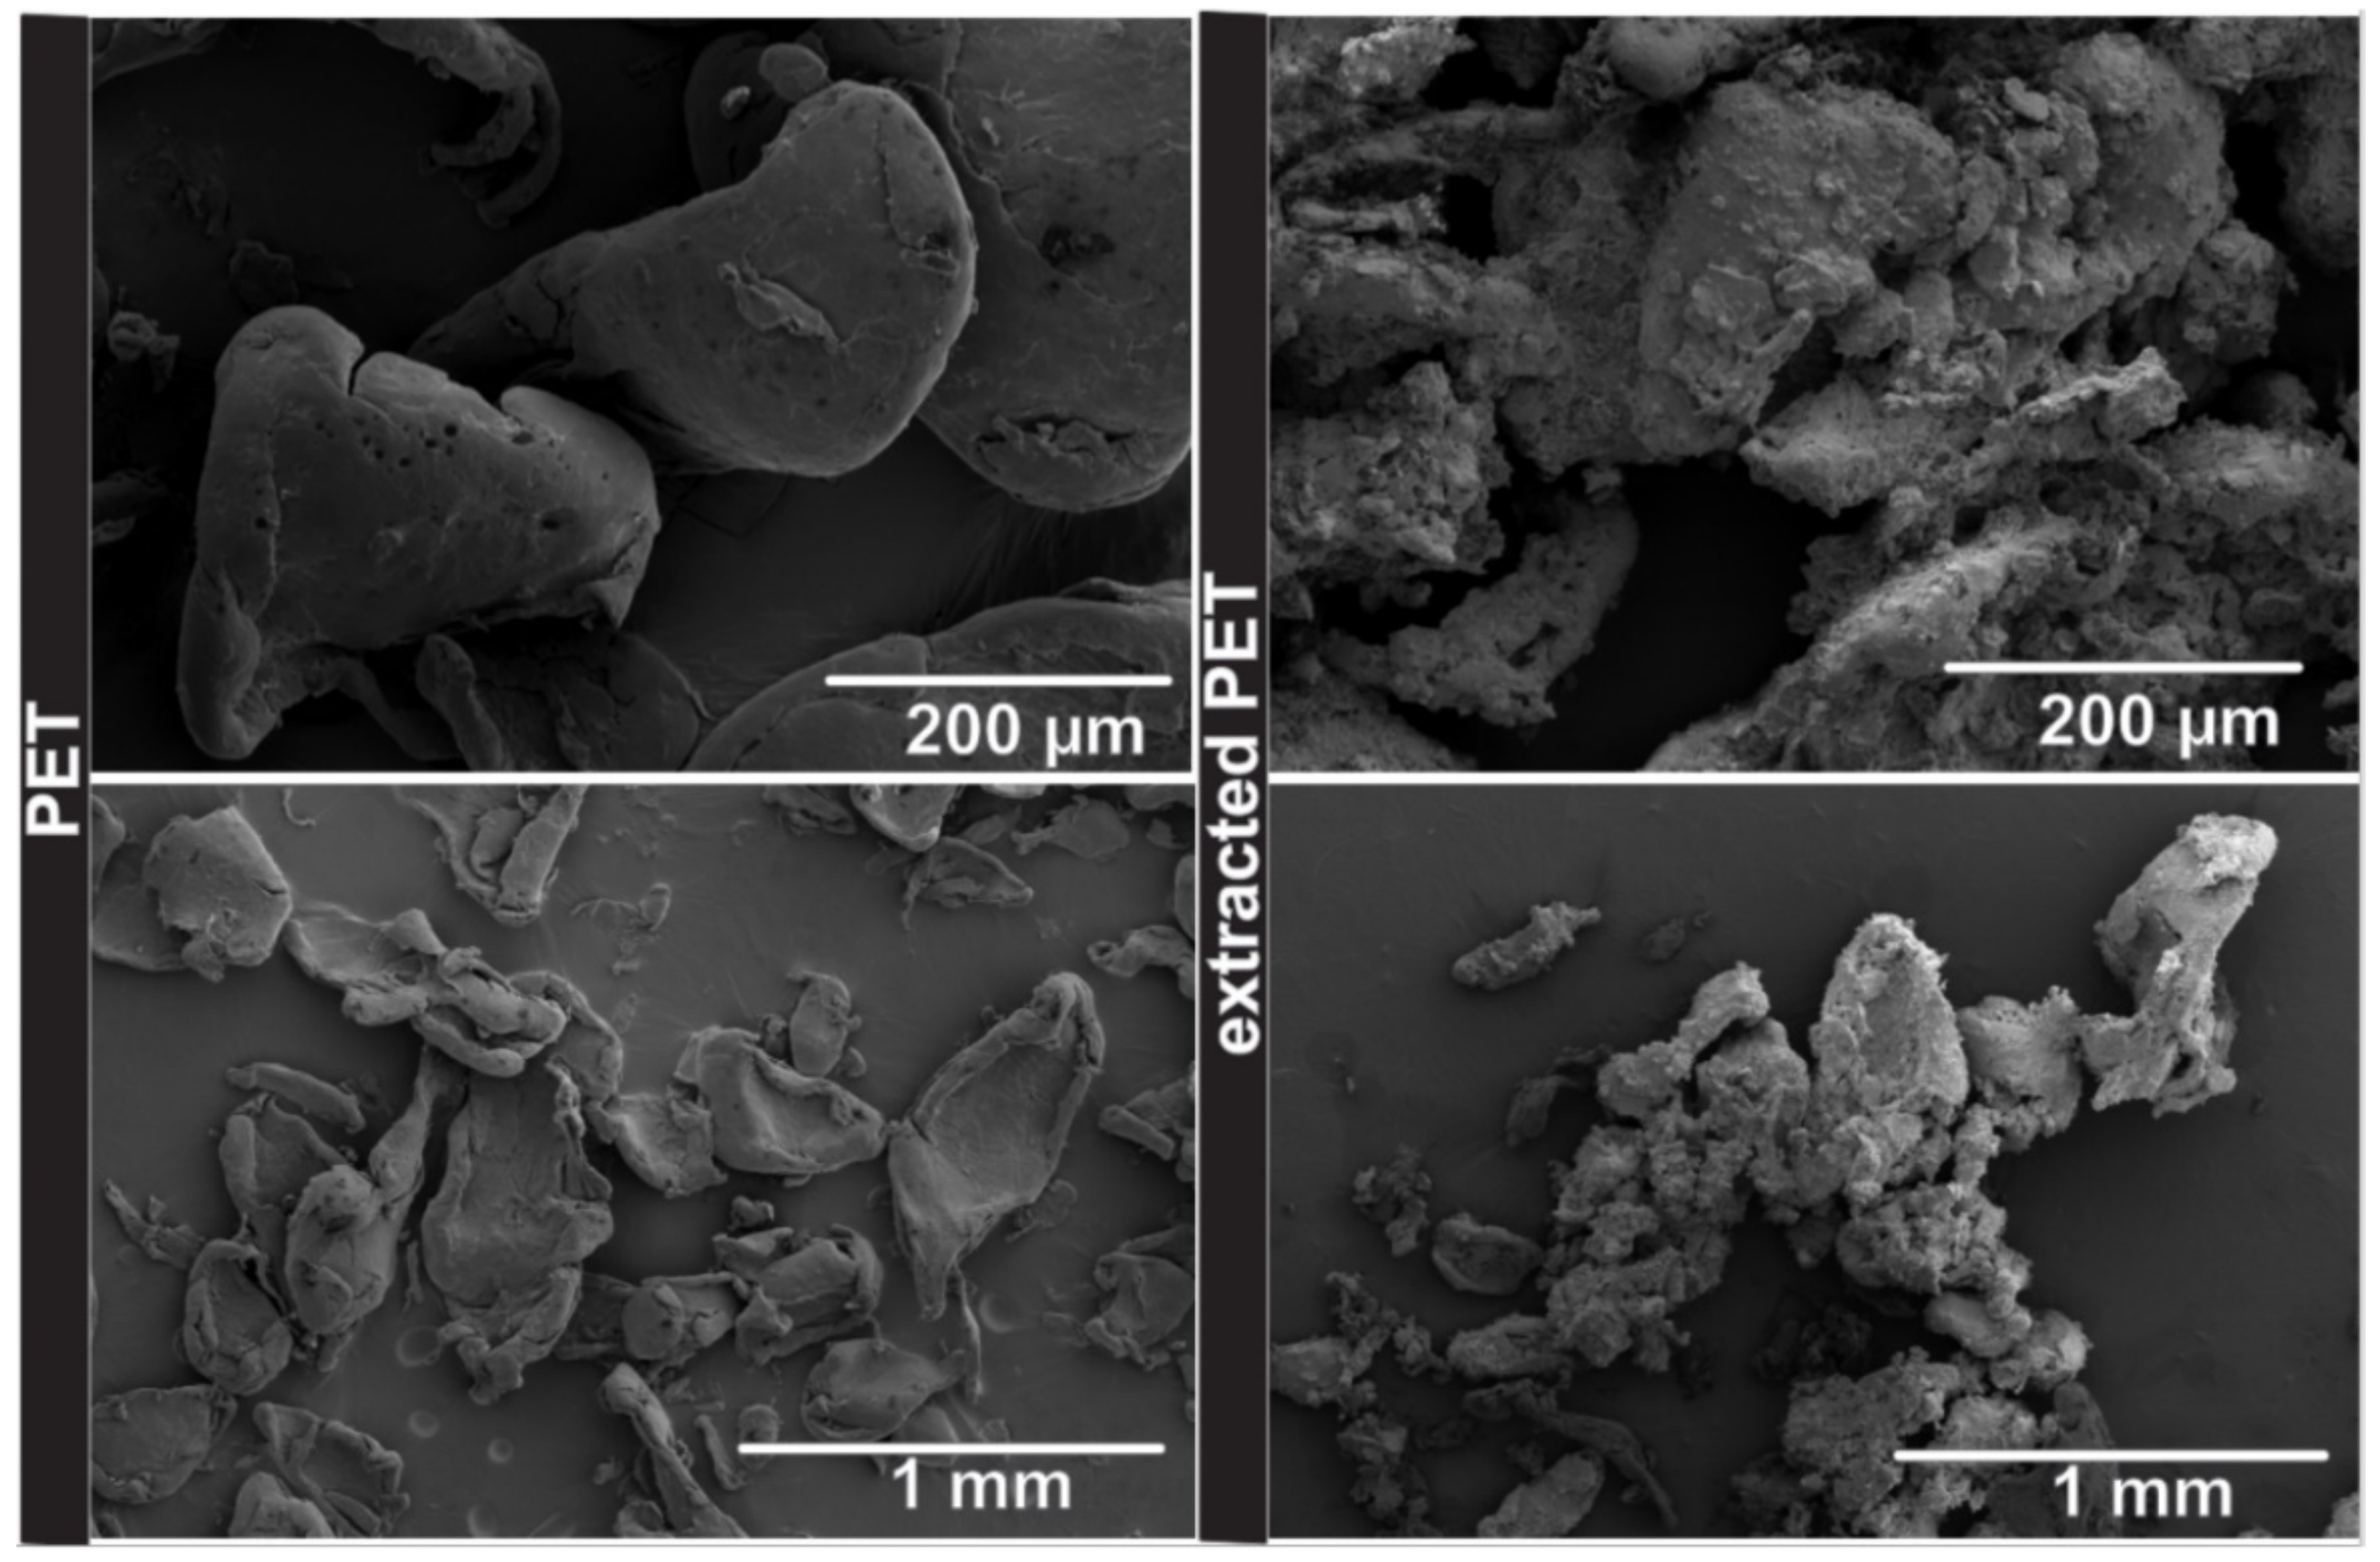
PET: Presence of C=O carbonyl group stretch—1711 cm−1, 1238 cm−1 C-O stretch, in the virgin PET there was a characteristic 1091 cm−1 peak from the C-O stretch that is visible, whereas in the extracted polymer spectra there was a visible trace of background in this area and the peak moved to the area of 1082 cm−1, the 722 cm−1 aromatic C-H out of plane bend was strongly present in both samples of PET. The spectra of PET samples differed but it was still possible to identify the extracted one.
PE: The extracted spectra overlapped the initial PE spectra accurately and all the distinctive peaks for characterization were very much visible. The presence of 2916 cm−1 and 2848 cm−1 C-H stretch, 1471 cm−1 and 1468 cm−1 -CH2- bend and 716 cm−1 -CH2- rock. The absence of ~1720 cm−1 peak made the identification easier as in the PS case.
The greatest compatibility of the spectra recorded between the standard (pure) and the extracted polymer was observed for the PE sample. The high purity of the extracted MP was also reached for PUR and PS MP. However, a visible discrepancy between the spectra of the extracted PET and its reference was noticed. This was due to the high contamination of the sample with residue from the sediment, which was confirmed via optical identification (color changes) and later analyses (SEM observation, thermal analysis and XRF analysis of the residue). The polymer type could be determined because of the overlapping of the spectra from the virgin polymers and the extracted polymers. The peaks of characteristic functional groups were also visible. In the blank sample, the absorption features of quartz were visible [52]. Peaks in the range of 1200 cm−1 to 900 cm−1 are assigned to the asymmetric stretching vibration of the Si-O groups with a maximum at 1082 cm−1. Remains of organic matter in the form of the C-H vibration were also visible at 2970–2682 cm−1.
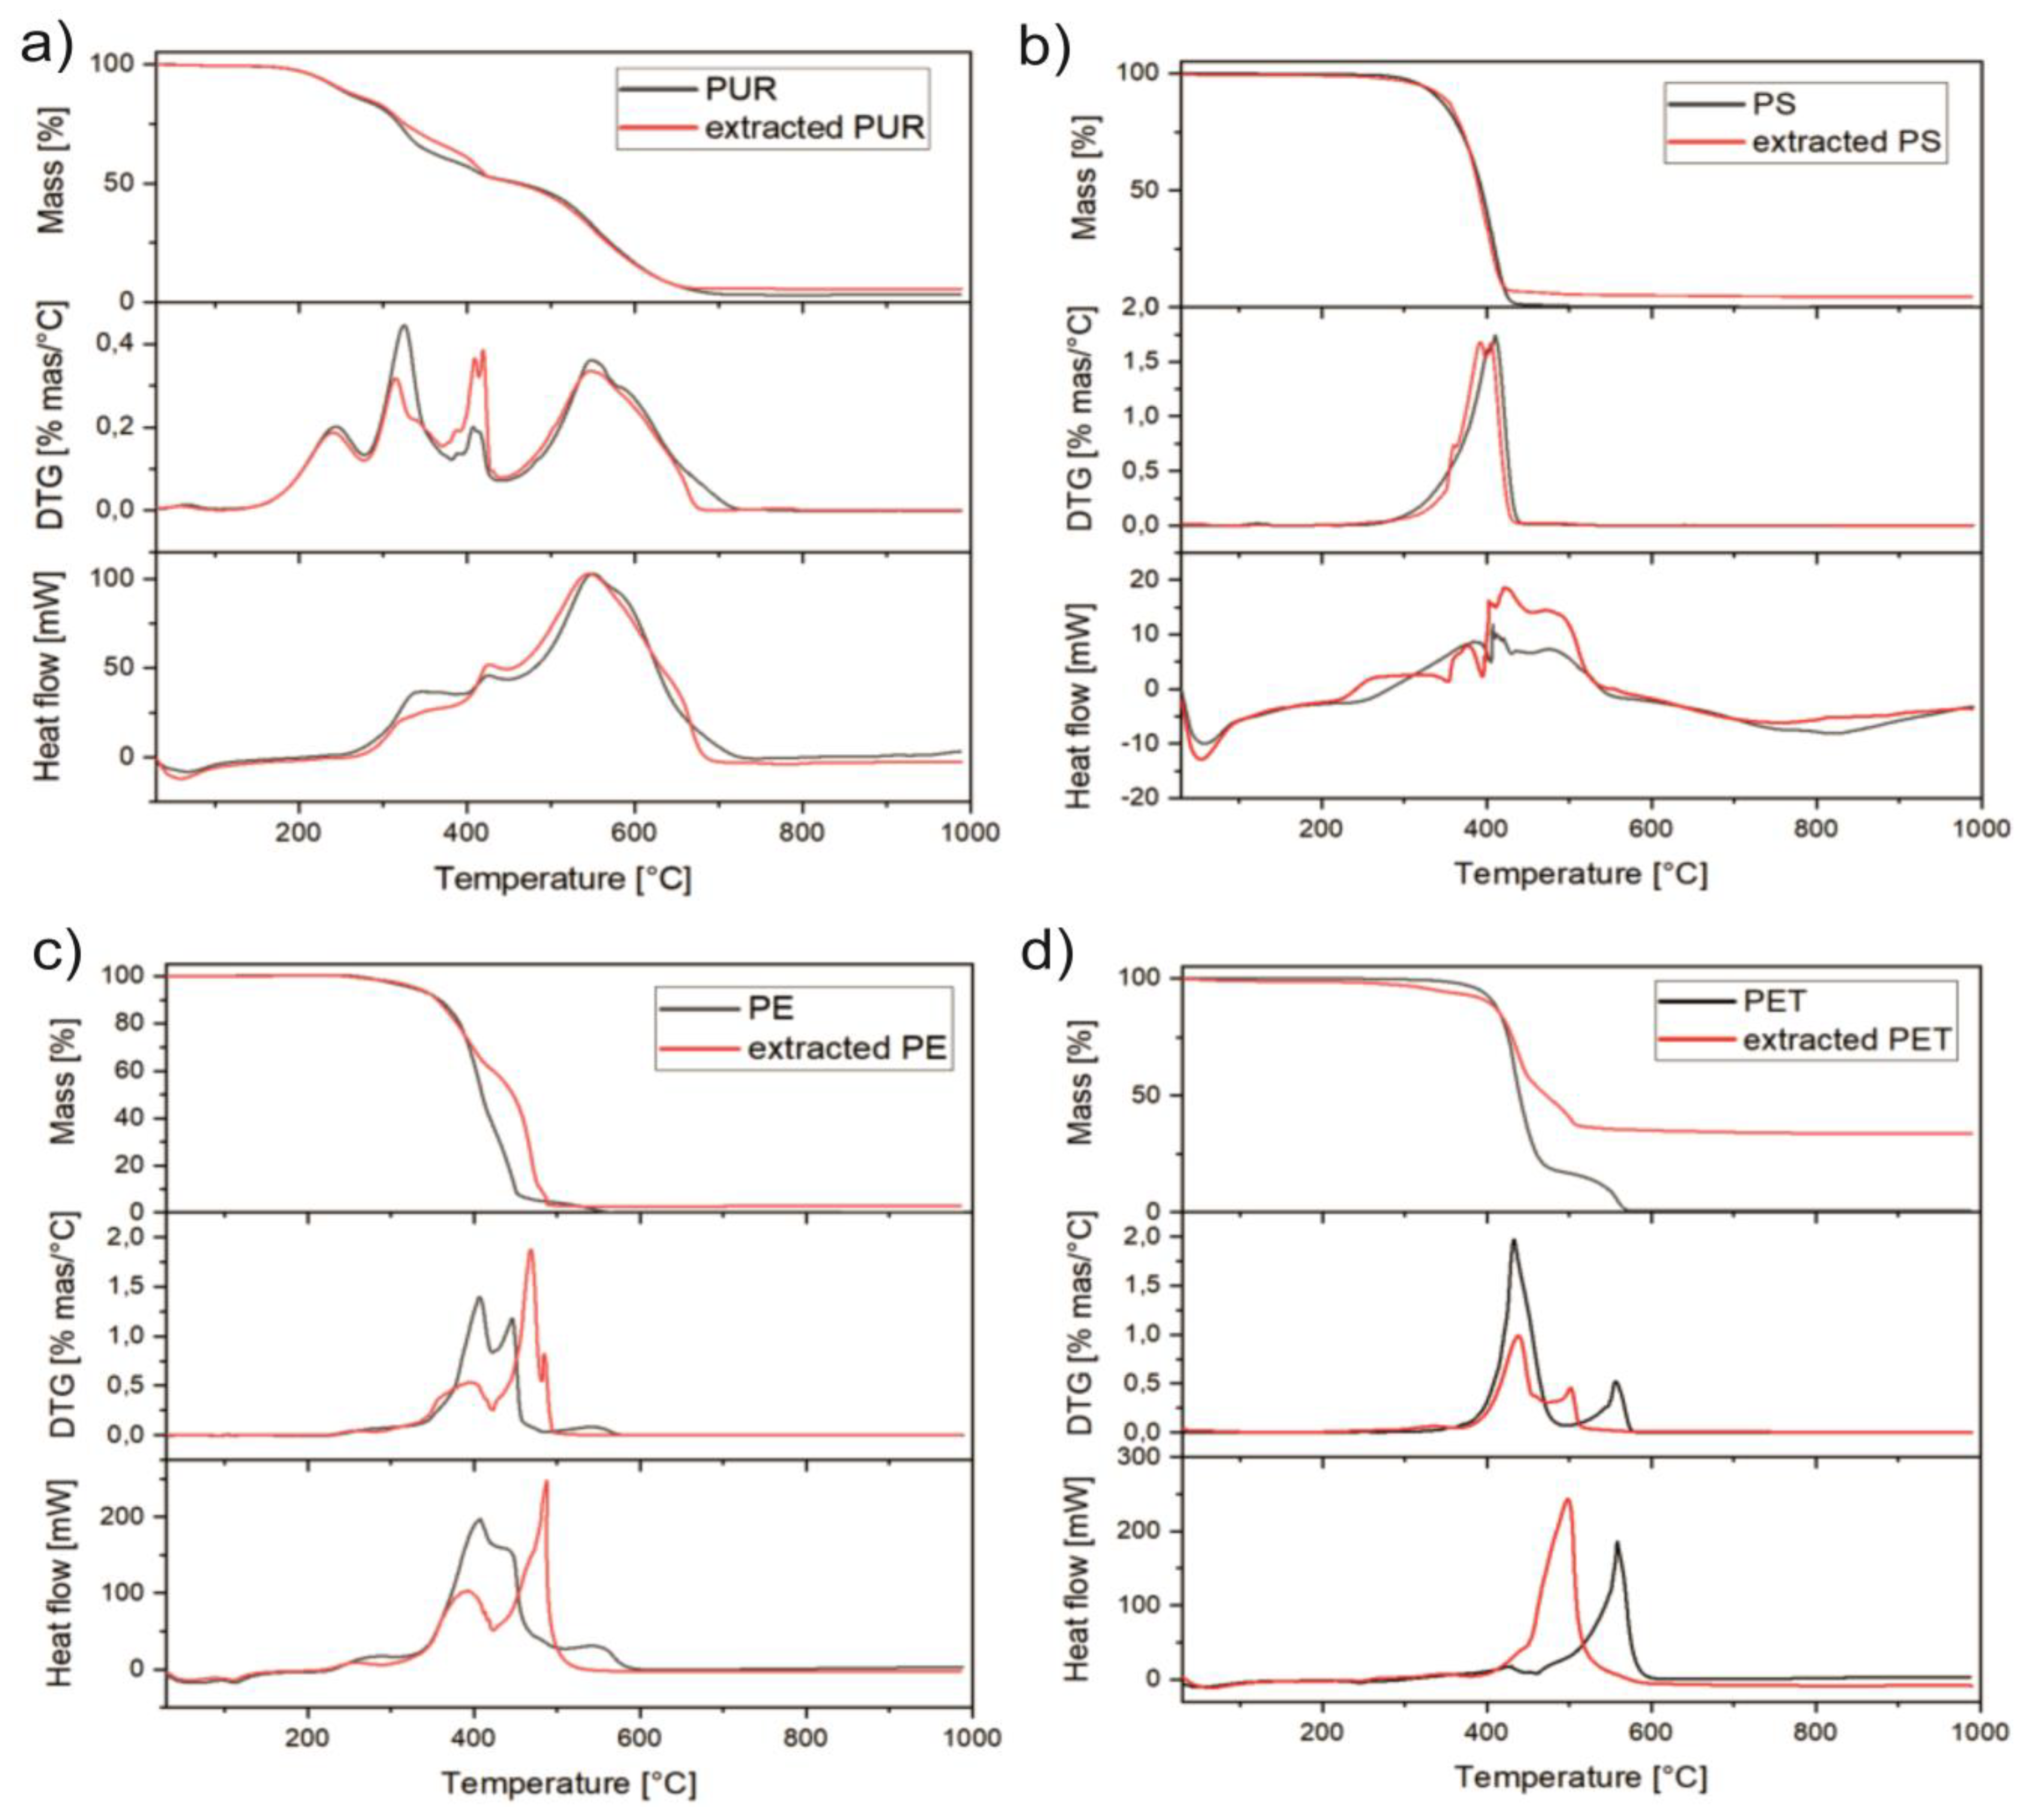
Thermal analysis (Figure 5) was conducted to eliminate the errors in assessing the extraction efficiency connected to the adhesion of the sediment to the surface of the MP and the determination of sediment content in extracted polymers. The collected results also provided information about the thermal decomposition of the examined synthetic polymers.
The obtained results confirmed that the PS, PE and PUR microparticles could be effectively separated from the matrix using the KCOOH method (Table 1). In these cases, TG data for initial and extracted MP indicated the low content of inorganic, c.a. 2.4, 2.8 and 4.1 wt%, ashes for PS, PE and PUR, respectively. On the other hand, the extracted PET sample revealed a high amount of sediment residue (38.2 wt%). The high density of PET is a natural cause for the difficulty in separating the polymer from the sediment. Moreover, the signals on DTG and heat flow curves showed that PET decomposition is especially affected by the sediment content and it leads to the faster thermal oxidation of the PET MP.
3.2. Microplastic–Sediment Interaction
In the sample of pure sediment after the mixing process mainly large (circa 500 µm) grains of quartz (Figure 6) were present. Lesser size fractions were composed of different clay minerals (Figure 6) but particles formed from the abrasion of larger grains during the mixing were also present.
The grinding of the MPs in the same conditions resulted in polymer fragmentation into different forms. During the visual inspection, the main difference was in the final product color. It was white in the case of PE, PET and PS and light beige for finely ground PUR. There were no other visible differences in the size or shape of particles within one sample and between samples. During SEM inspection (Figure 7, Figure 8, Figure 9 and Figure 10) the size distribution, morphology of the surfaces and general shape differed significantly according to MP type.
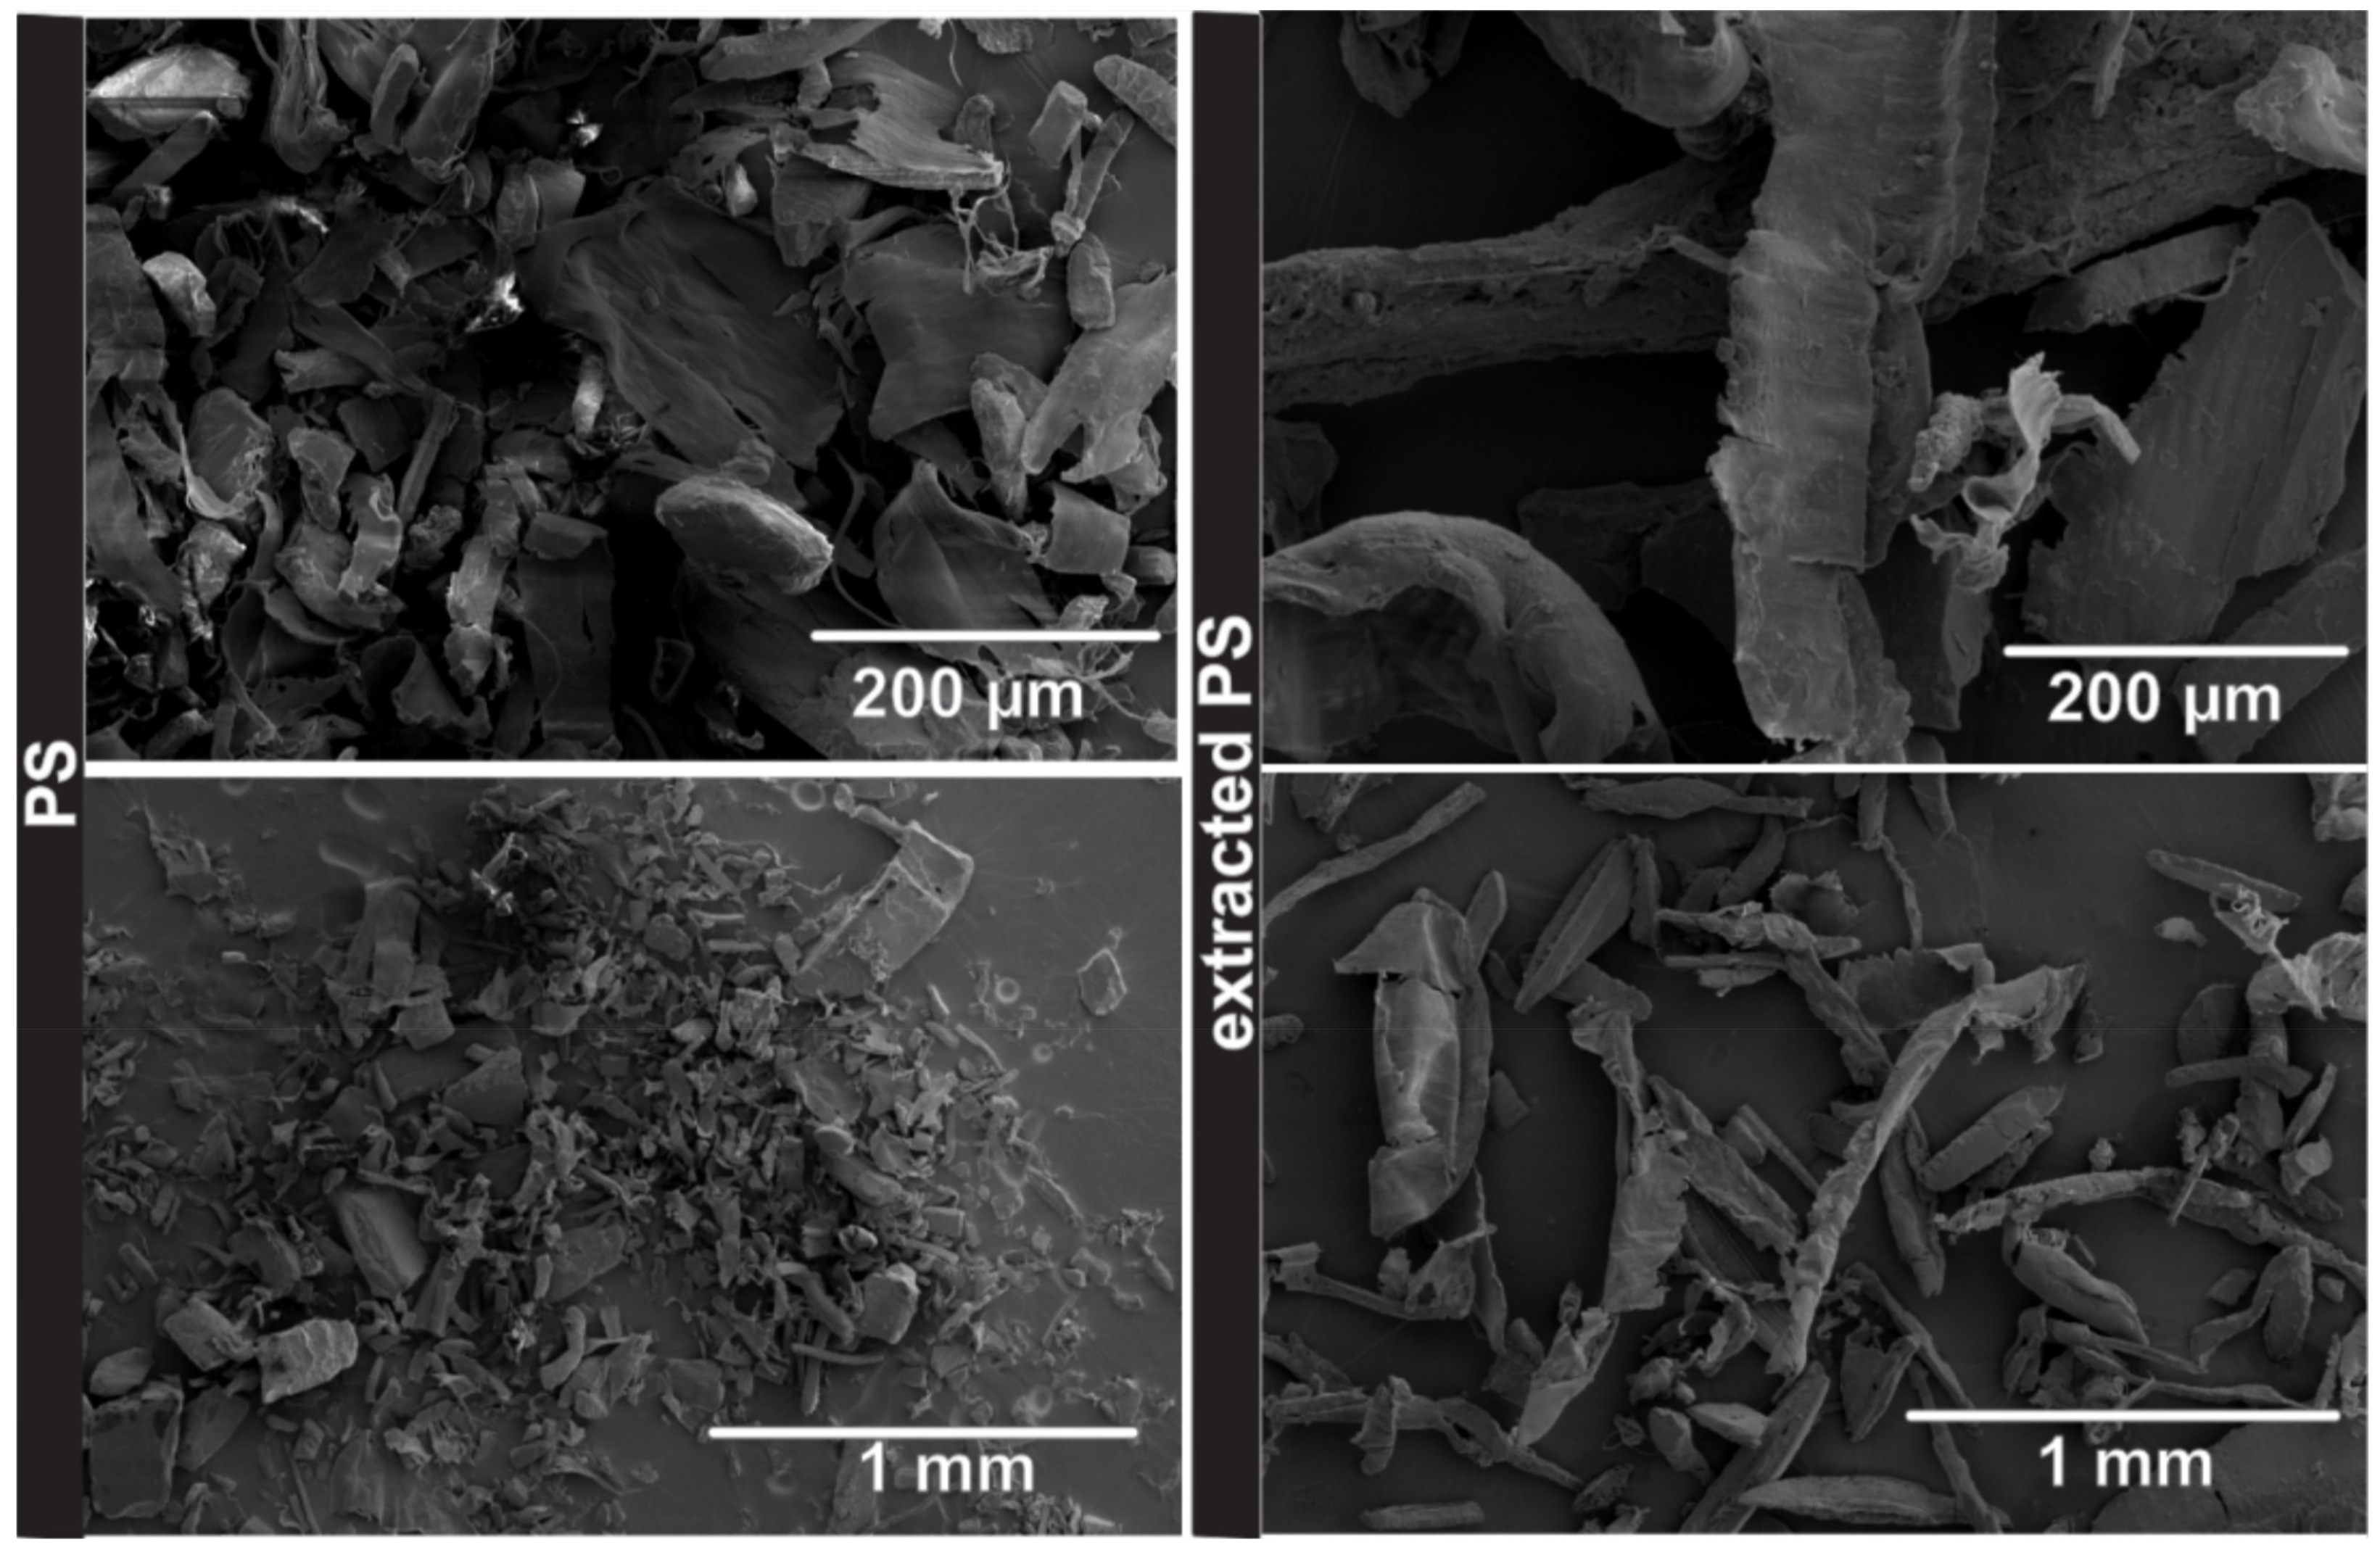
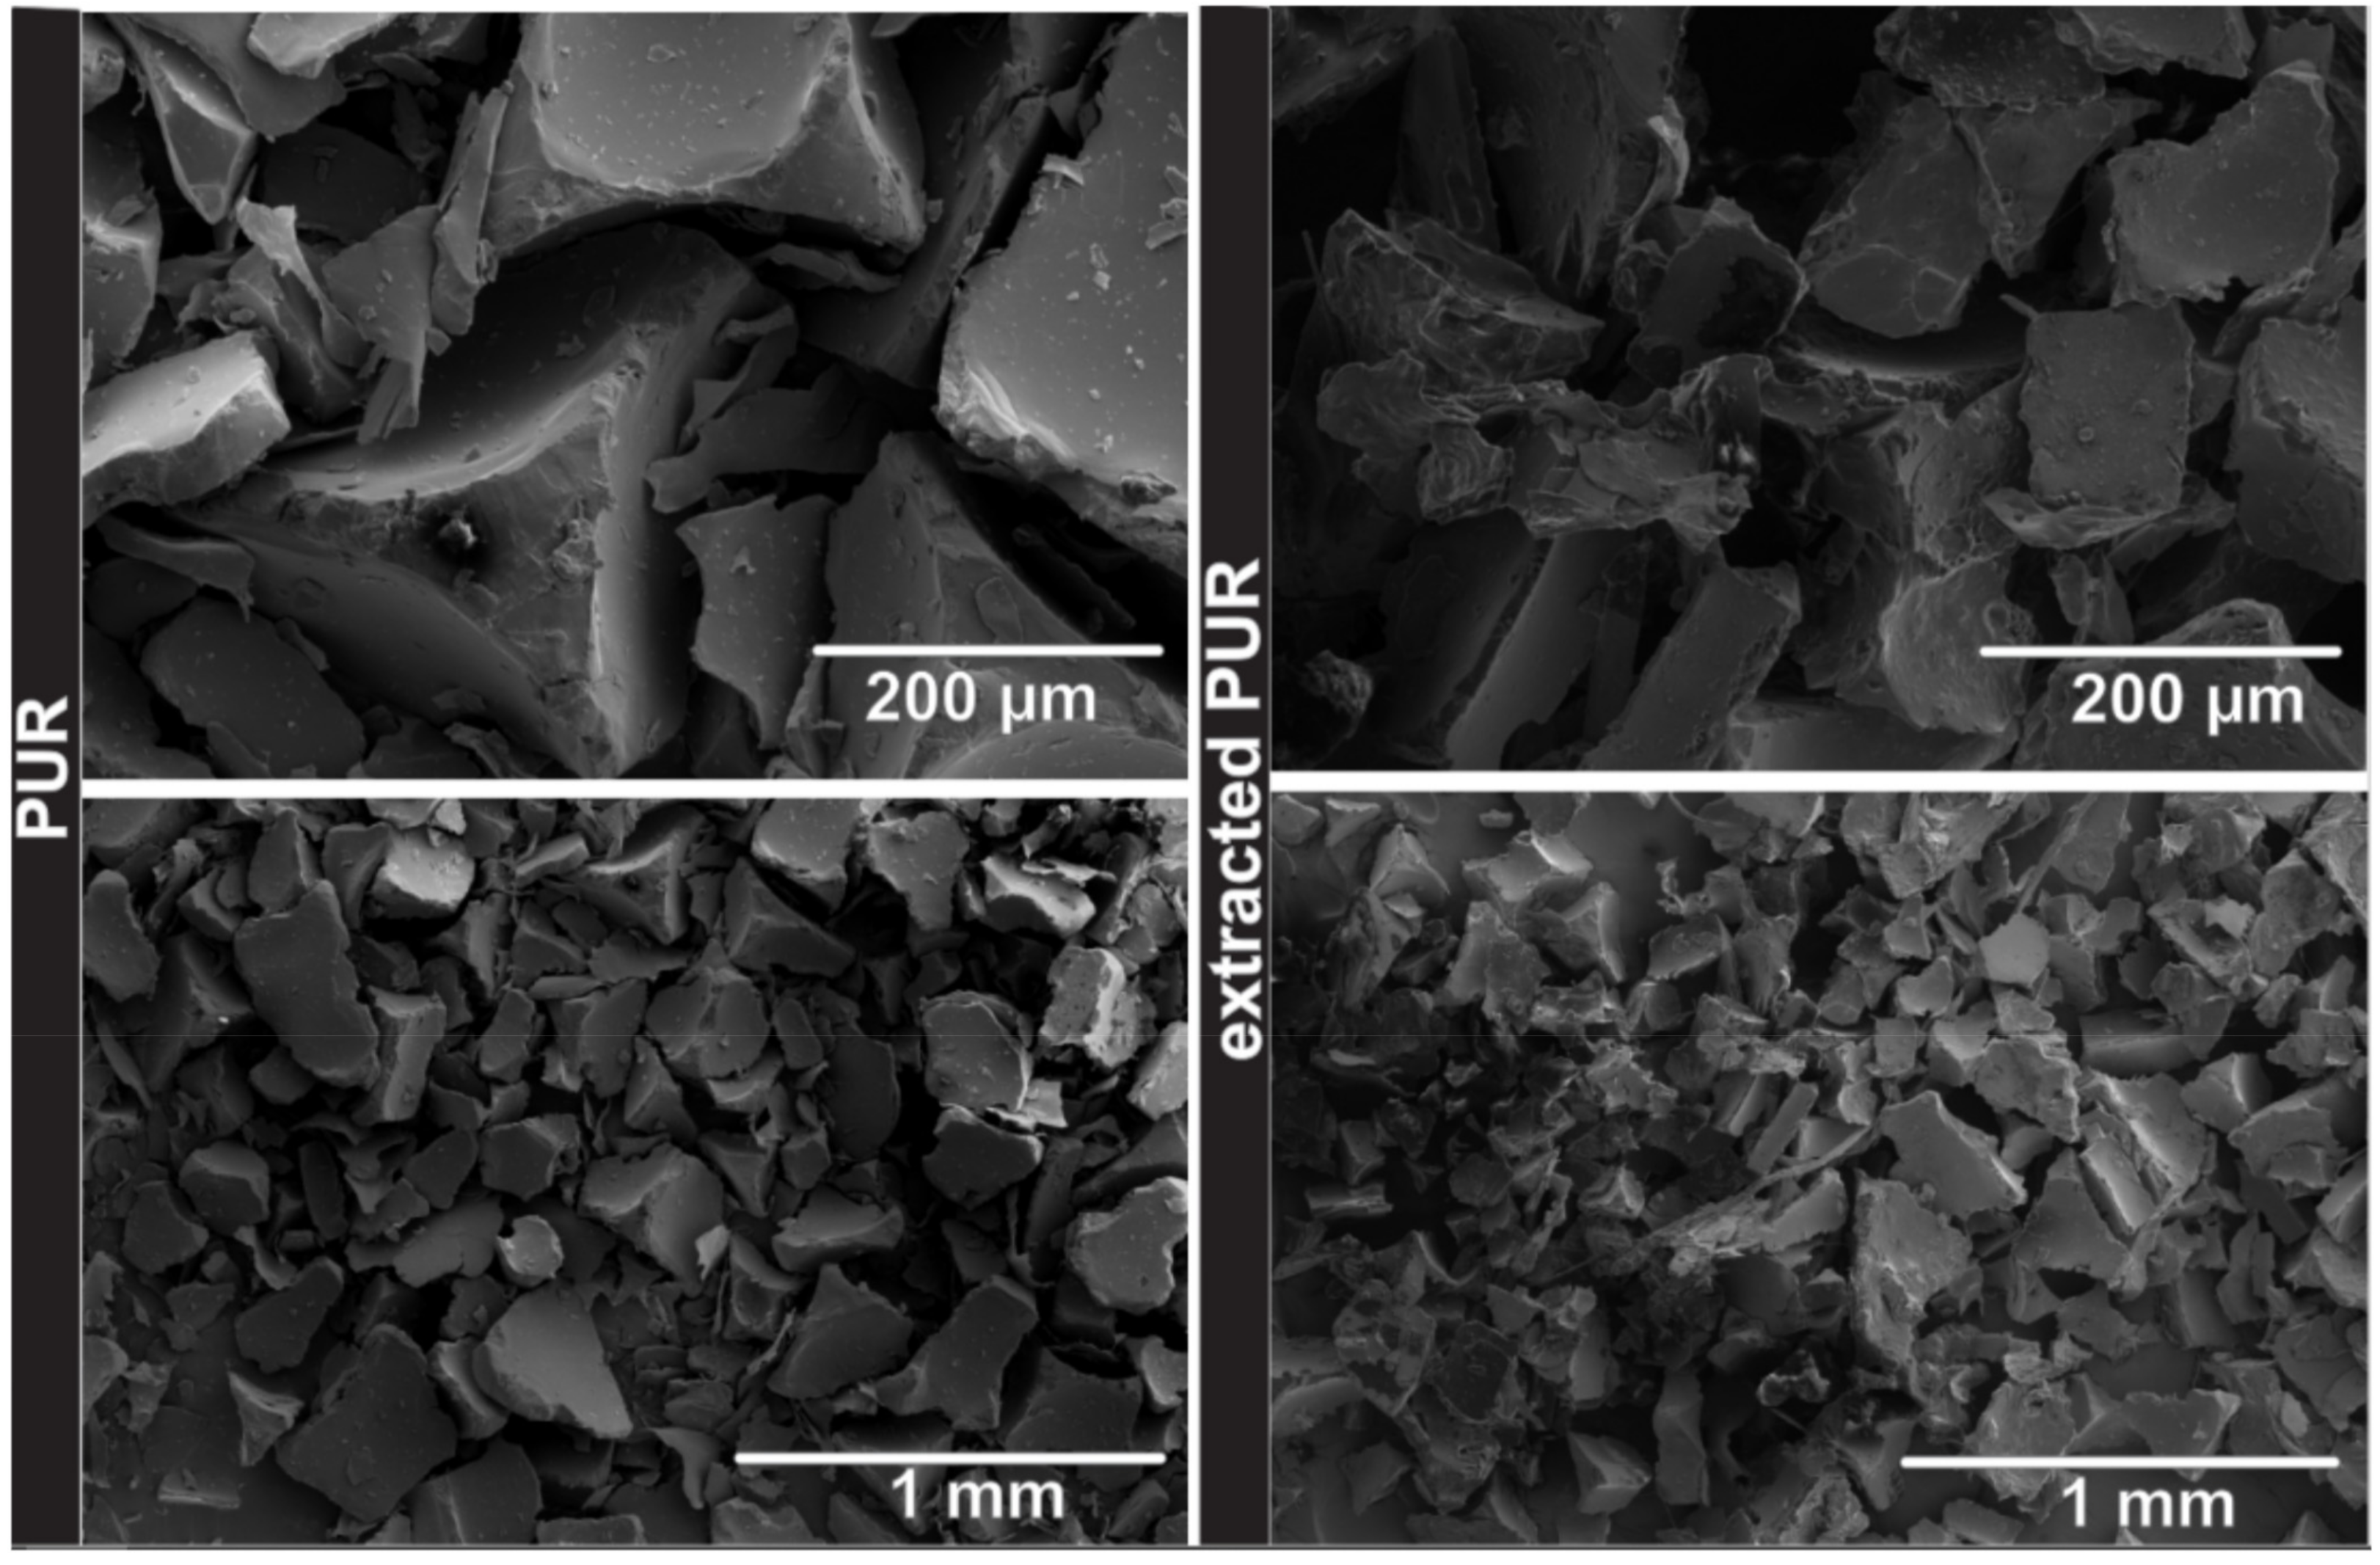
Visibly, different MPs also divided further in the sediments in different ways. The most isometric and regular in shape was PUR MP. PUR, which after the grinding process took a very unitary form, deteriorated in the sediments into foil-like particles. PS was characterized by various shapes of particles (ranging from fibrous to isometric) during the grinding process.
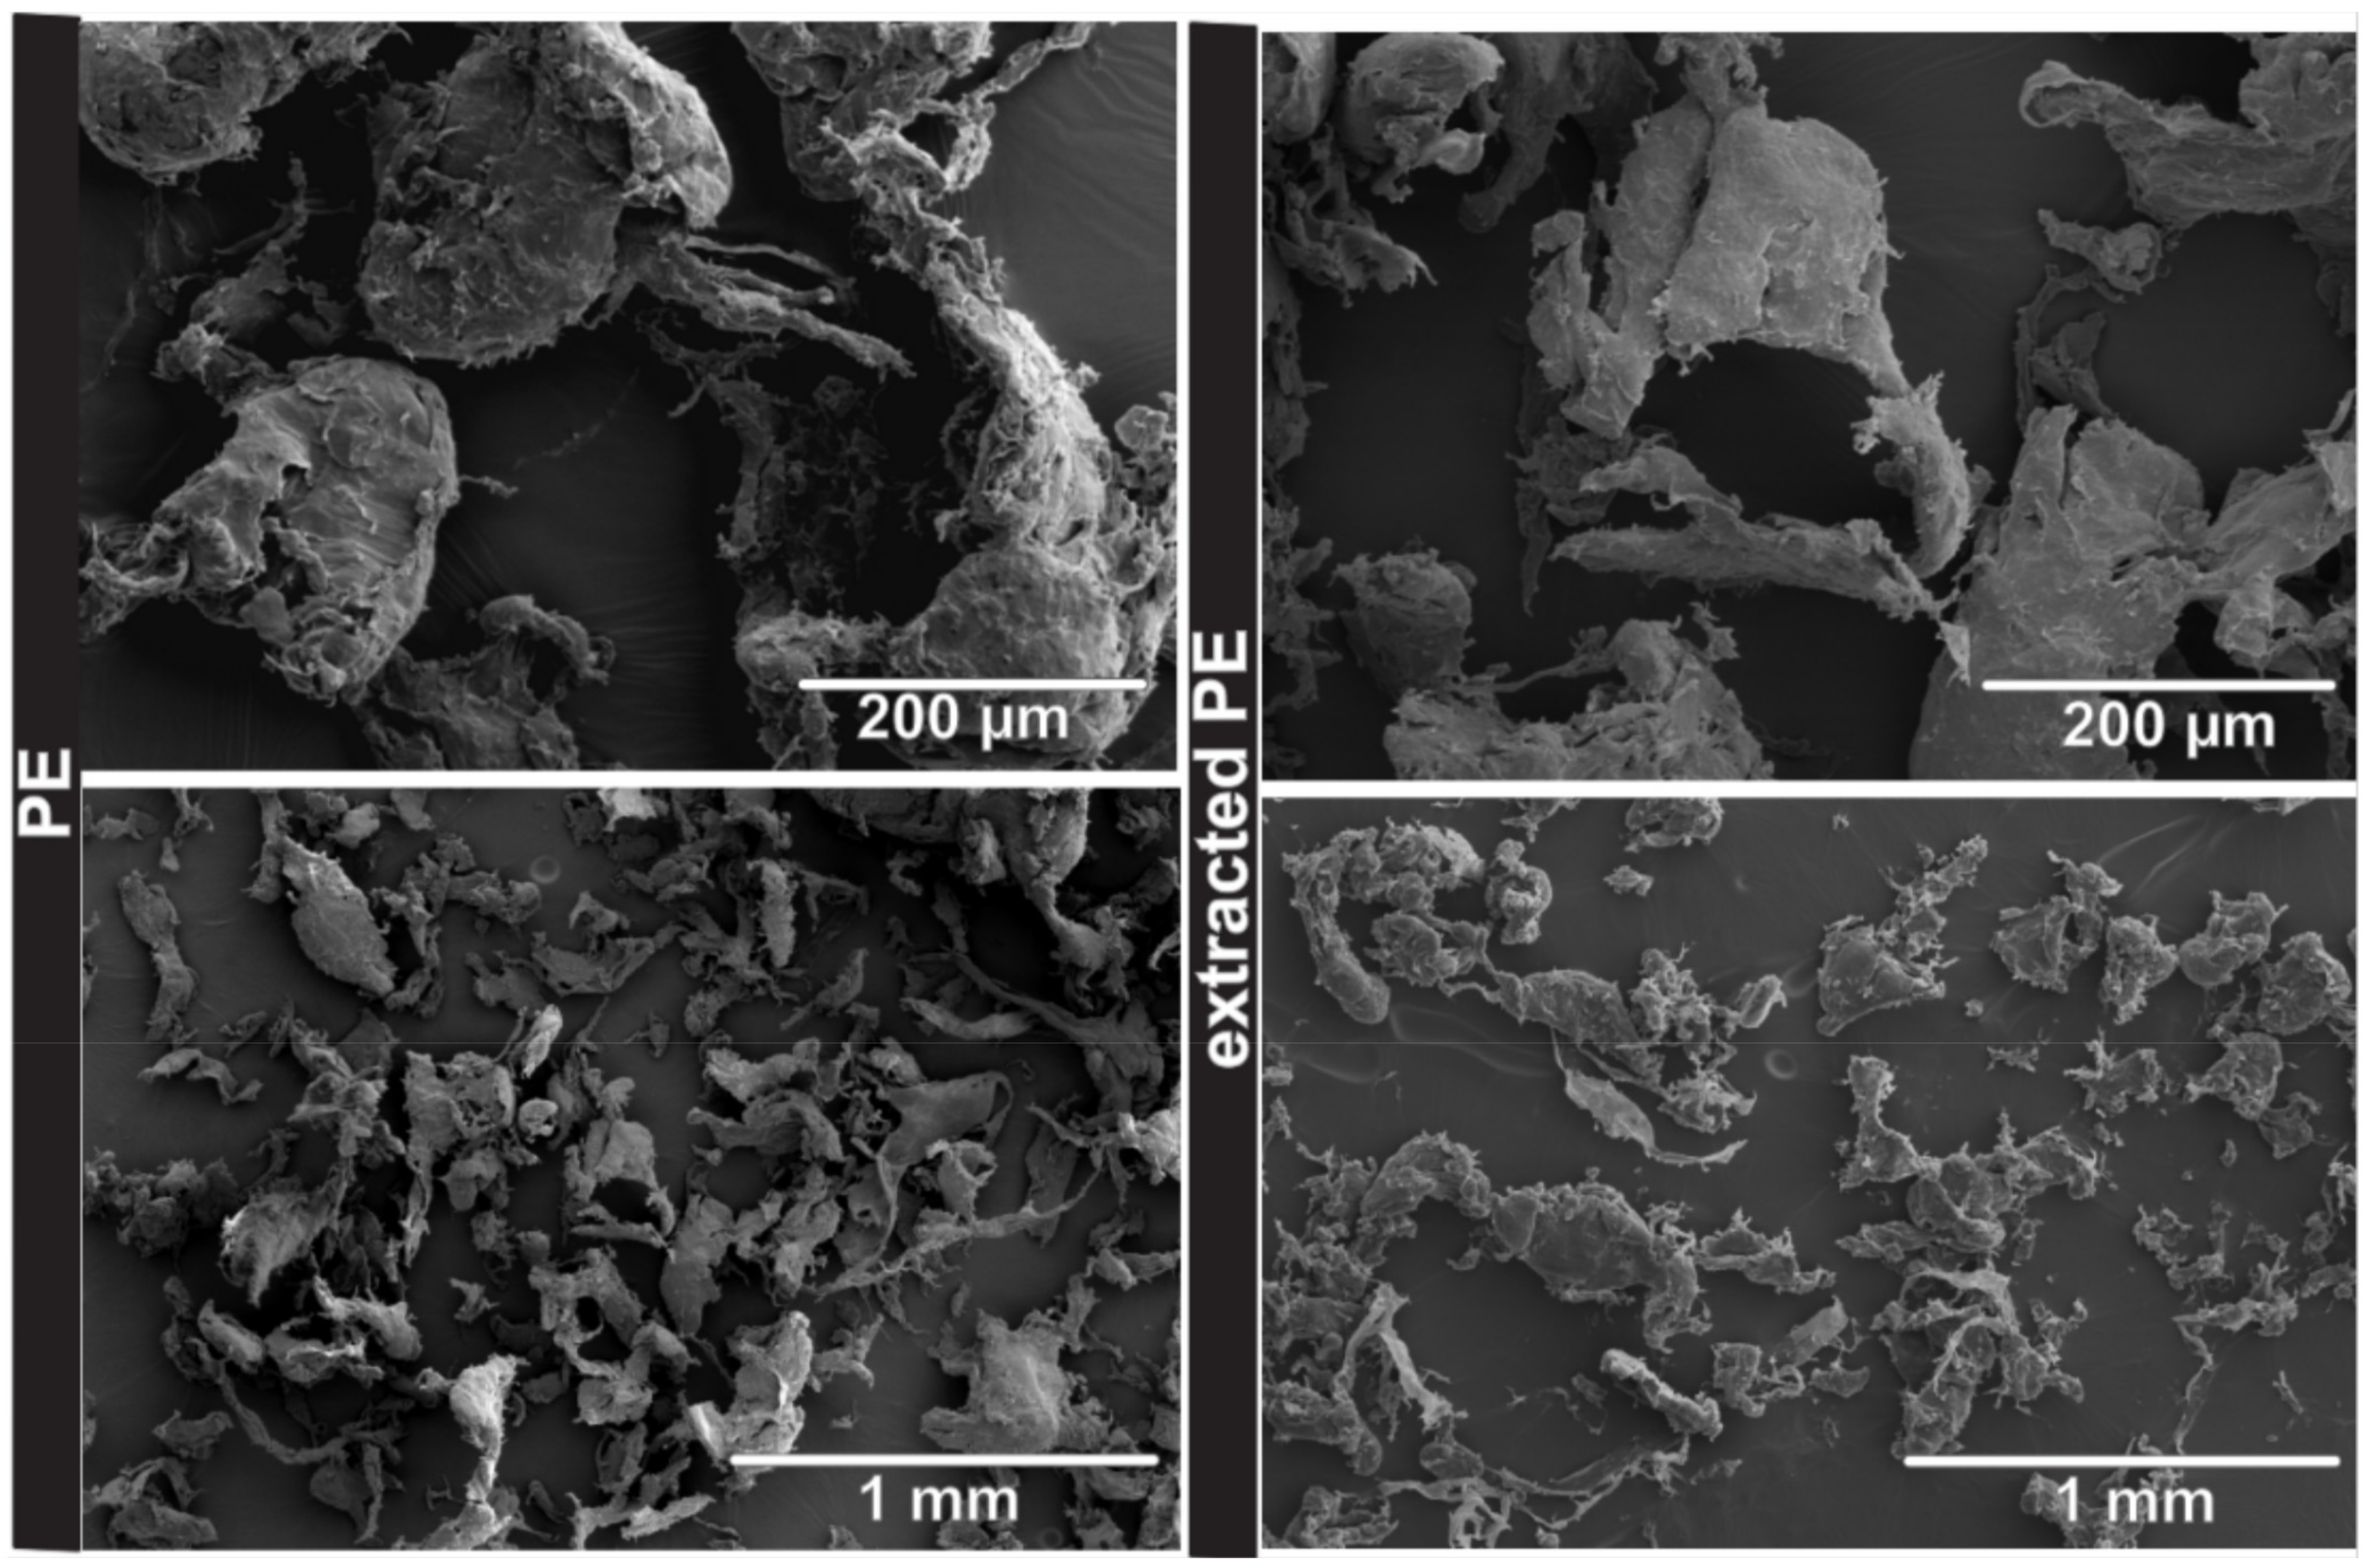
The PE surface had a similar topography to PET. The difference was mainly visible in the shape of the particles. The PE sample was composed of fibers and oblong fragments. The surfaces of both had visibly jagged fractures. PET transformed mostly into irregular particles during grinding.
Primary spherical PS pellets after grinding generally broke up into different shapes (but mostly elongated particles and flat fine sheets) or finally disintegrated in fibrous forms. The size of PS, PE and PET particles did not differ between virgin and extracted analogues, contrary to PUR where the material extracted was visibly smaller.
A major amount of sediment was left on the surfaces of PET particles, which was coherent with the TG analysis. On the surfaces of other MPs some sediment was also observed, but to a lesser extent.
Closer inspection showed that the PET surface was densely covered with mineral particles (Figure 11). SEM/EDS and thermal analysis confirmed that the real mass of polymer extracted was inaccurately measured due to this phenomenon and it is important to consider this in developing weight-based quantification methods and in the validation of extraction methods. There was also some natural organic content (e.g., small stems) attached to the surface of PET. The amount of low-density material present in the sediment (indicated in the analysis of the blank sample) did not affect the overall assessment of effectiveness of the extraction. The mass of extracted material was only 0.008 g. However, in the spiked analogue, it emerged to the surface of the PET particles.
The minerals present on the surface were of different sizes and compositions. They covered the entire surface and were the same size and bigger than the mineral phases on the surface of the quartz grains (Figure 6).
In the case of PET, the residue amount was high enough to conclude an XRF analysis to obtain general information about its chemical composition (Table 2).
The mineralogical composition of the sediment used for the experiment (Figure 2 and Figure 6) indicates that, in terms of chemical composition, it was mostly composed of SiO2. The residue represented the part of the sediment attached to the polymers and SiO2 was underrepresented in comparison to the base sediment (Table 2). The chemical composition was related to the fine-grained fraction of the sediment—clay minerals, potassium feldspars and iron oxides. All elements composing potassium feldspar (KAlSi3O8) were present in the sample. The high abundance of K was partly because of the potassium feldspar, mica and clay minerals present—K in the mineral structure and due to the absorption of ions from the solution [54] (Mitra and Prakash, 1957); it could also be potentially partly due to unwashed KCOOH residue. The traces of titanium and iron could result from the presence of mica group minerals clay minerals or oxide/hydroxide minerals.
3.3. Areas of Further Development of the Method
The solution prepared needs to be of a higher density to efficiently separate PET and polyvinyl chloride (PVC). It could be obtained by controlling the temperature of the laboratory or even the system itself in use. The main issues were associated not with the fluid itself but with the procedure. Separating fluid with MPs from the sediment in an efficient way proved to be especially challenging. Different amounts of sediment–microplastic mixture were tested and 500 mL was empirically confirmed to be the largest possible amount for non-problematic stirring. The reason behind this was to use the least possible amount of both the glassware and the solution. The chosen amount was 125 g (1 kg of spiked sediment divided into 8 equal parts). The method must be further validated and it might prove useful to consider H2O/KCOOH as a medium in existing devices or systems such as those presented in [55]. There is no reason not to consider recycling H2O/KCOOH after the procedure. This way of proceeding could be also useful for solving the problem of MPs sticking to the glass walls as mentioned beforehand.
3.4. Study and Method Limitations
The present study was constructed to bring a focus on the often-overlooked area of sediment and MP interactions during the extraction procedures. However, there are limitations to the chosen approach, as well as the proposed method itself. The sediment for the experimental mixture was prepared from an environmental sample, but the MPs were prepared from standard synthetic polymers and not environmental MPs. The mixing process aged the MPs to some point. It is still however not the same situation as with environmental particles where physio-chemical properties are potentially changed [7,56] and microliters are adsorbed to the surface [57]. The size range of the MPs prepared was also quite broad due to the preparation process and the quantification relying on mass comparison might overlook some losses of the smallest microplastics. Additionally, the methodology used did not allow for an analysis of MPs smaller than 0.02 mm. The particle count approach is deeply flawed because MPs keep disintegrating in the environment [58,59] and the total amount of plastic seems to be more important in the case of those pollutants which are persistent yet prone to further degradation. The testing of the separation of MPs from experimental mixtures with a known MP presence is what is distinctive about the study present, among other studies on popular separation methods. As with every procedure regarding preparation, it requires a detailed validation process. Proceeding with the experiment based on numerous repetitions of the process, a comparison of the results and an assessment of the errors will be the next steps before the method can be proposed as a standard procedure.
4. Conclusions
The proposed method for the separation of MP particles from the soil with the use of potassium formate solution allows for an efficient extraction of MP from environmental matrices in the case of the most widespread polymer microparticles. Especially promising effects were achieved for low-density polymers (e.g., polyolefins), where the recovery rate of the polymer material from the sample can reach more than 90%. The benefits of this method of acquiring samples come from not only from its effectiveness but also the wide use of potassium formate (e.g., being very popular in drilling muds) which is highly regarded as safe, non-toxic and relatively cheap.
Density separation procedures using potassium formate are promising and incomprehensibly have been omitted in discussions comparing different methods, despite having many advantages over other popular solutions. However, the proposed procedure needs enhancement in terms of the sample size and solution density as well as validation for different microplastic and microplastic mixtures.
Different MPs break into particles that look similar. There are visible differences in rates of microplastic disintegration when mixed with sediment, depending on the polymer type.
Suspended sediment–microplastic aggregates might be the main reason for insufficient recovery rates in many cases. The problem is overlooked in currently used procedures as the reactions between microplastic and the sediment are omitted. Fine sediment particles are attached in larger amounts to the surfaces of PET particles in comparison with other polymer types.
When using density separation methods, it is important to prepare a solution of a much greater density than the density of microplastic to be extracted and to consider the attachment of mineral phases that are invisible during direct observation to develop methods, procedures and validation.
Author Contributions
Conceptualization, K.J., P.N. and M.M.; methodology, P.N., K.J. and M.M.; investigation, K.J. and P.N.; resources, K.J.; data curation, K.J.; writing—original draft preparation, K.J.; writing—review and editing, P.N. and M.M.; visualization, K.J.; supervision, K.J.; project administration, K.J.; funding acquisition, K.J. All authors have read and agreed to the published version of the manuscript.
Funding
This research was funded by the Ministry of Science and Higher Education (Diamond Grant) DI2017 021647.
Data Availability Statement
Not applicable.
Acknowledgments
The authors would like to thank the reviewers for insightful comments and Shannon Hsieh for the proof-reading of the manuscript and language corrections.
Conflicts of Interest
The authors declare no conflict of interest.
References
- Davis, H. Life & death in the Anthropocene: A short history of plastic. In Art in the Anthropocene: Encounters Among Aesthetics, Politics, Environments and Epistemologies; Andrews McMeel Publishing: Kansas City, MO, USA, 2015; pp. 347–358. [Google Scholar]
- Zalasiewicz, J.; Williams, M.; Waters, C.N. Can an Anthropocene series be defined and recognized? Geol. Soc. Lond. Spec. Pub. 2014, 395, 39–53. [Google Scholar] [CrossRef] [Green Version]
- Zalasiewicz, J.; Waters, C.N.; Ivar do Sul, J.A.; Corcoran, P.L.; Barnosky, A.D.; Cearreta, A.; Edgeworth, M.; Gałuszka, A.; Jeandel, C.; Leinfelder, R.; et al. The geological cycle of plastics and their use as a stratigraphic indicator of the Anthropocene. Anthropocene 2016, 13, 4–17. [Google Scholar] [CrossRef] [Green Version]
- Bandsch, J.; Piringer, O. Characteristics of plastic materials. In Plastic Packaging Materials for Food: Barrier Function, Mass Transport, Quality Assurance, and Legislation; Wiley-VCH: Hoboken, NJ, USA, 2000; pp. 9–45. [Google Scholar]
- Thompson, R.C.Y.; Olsen, R.P.; Mitchell, A.; Davis, S.J.; Rowland, J.; John, A.W.G.; McGonigle, D.; Russell, A.E. Lost at sea: Where is all the plastic? Science 2004, 304, 838. [Google Scholar] [CrossRef] [PubMed]
- Leslie, H.A.; Brandsma, S.H.; Van Velzen, M.J.M.; Vethaak, A.D. Microplastics en route: Field measurements in the Dutch river delta and Amsterdam canals, wastewater treatment plants, North Sea sediments and biota. Environ. Int. 2017, 101, 133–142. [Google Scholar] [CrossRef]
- Chen, G.; Feng, Q.; Wang, J. Mini-review of microplastics in the atmosphere and their risks to humans. Sci. Total Environ. 2020, 703, 135504. [Google Scholar] [CrossRef]
- Thompson, R.C. Plastic debris in the marine environment: Consequences and solutions. Mar. Nat. Conserv. Eur. 2006, 193, 107–115. [Google Scholar]
- Erni-Cassola, G.; Gibson, M.I.; Thompson, R.C.; Christie-Oleza, J.A. Lost, but found with Nile red: A novel method for detecting and quantifying small microplastics (1 mm to 20 μm) in environmental samples. Environ. Sci. Technol. 2017, 51, 13641–13648. [Google Scholar] [CrossRef] [Green Version]
- Bermúdez, J.R.; Swarzenski, P.W. A microplastic size classification scheme aligned with universal plankton survey methods. MethodsX 2021, 8, 101516. [Google Scholar] [CrossRef]
- Shi, W.; Cui, T.; Wu, H.; LeBlanc, G.A.; Wang, F.; An, L. A proposed nomenclature for microplastic contaminants. Mar. Pollut. Bull. 2021, 172, 112960. [Google Scholar] [CrossRef]
- Rozman, U.; Kalčíková, G. Seeking for a perfect (non-spherical) microplastic particle—The most comprehensive review on microplastic laboratory research. J. Hazard. Mater. 2022, 424, 127529. [Google Scholar] [CrossRef]
- Sousa, F.D.B. Plastic and its consequences during the COVID-19 pandemic. Environ. Sci. Pollut. Res. 2021, 28, 1–12. [Google Scholar] [CrossRef]
- Silva, A.L.P.; Prata, J.C.; Walker, T.R.; Duarte, A.C.; Ouyang, W.; Barcelò, D.; Rocha-Santos, T. Increased plastic pollution due to COVID-19 pandemic: Challenges and recommendations. Chem. Eng. J. 2020, 405, 126683. [Google Scholar] [CrossRef]
- Shruti, V.C.; Pérez-Guevara, F.; Elizalde-Martínez, I.; Kutralam-Muniasamy, G. Reusable masks for COVID-19: A missing piece of the microplastic problem during the global health crisis. Mar. Pollut. Bull. 2020, 161, 111777. [Google Scholar] [CrossRef]
- Provencher, J.F.; Covernton, G.A.; Moore, R.C.; Horn, D.A.; Conkle, J.L.; Lusher, A.L. Proceed with caution: The need to raise the publication bar for microplastics research. Sci. Total Environ. 2020, 748, 141426. [Google Scholar] [CrossRef]
- Van Cauwenberghe, L.; Devriese, L.; Galgani, F.; Robbens, J.; Janssen, C.R. Microplastics in sediments: A review of techniques, occurrence and effects. Mar. Environ. Res. 2015, 111, 5–17. [Google Scholar] [CrossRef] [Green Version]
- Luo, H.; Liu, C.; He, D.; Xu, J.; Sun, J.; Li, J.; Pan, X. Environmental behaviors of microplastics in aquatic systems: A systematic review on degradation, adsorption, toxicity and biofilm under aging conditions. J. Hazard. Mater. 2021, 423, 126915. [Google Scholar] [CrossRef]
- Yin, L.; Wen, X.; Huang, D.; Zeng, G.; Deng, R.; Liu, R.; Pan, H. Microplastics retention by reeds in freshwater environment. Sci. Total. Environ. 2021, 790, 148200. [Google Scholar] [CrossRef]
- Wang, C.; Zhao, J.; Xing, B. Environmental source, fate, and toxicity of microplastics. J. Hazard. Mater. 2021, 407, 124357. [Google Scholar] [CrossRef]
- Xu, Y.; Chan, F.K.S.; He, J.; Johnson, M.; Gibbins, C.; Kay, P.; Zhu, Y.G. A critical review of microplastic pollution in urban freshwater environments and legislative progress in China: Recommendations and insights. Crit. Rev. Environ. Sci. Technol. 2020, 51, 1–44. [Google Scholar] [CrossRef]
- Hu, Y.; Gong, M.; Wang, J.; Bassi, A. Current research trends on microplastic pollution from wastewater systems: A critical review. Rev. Environ. Sci. Biotechnol. 2019, 18, 207–230. [Google Scholar] [CrossRef]
- Qi, R.; Jones, D.L.; Li, Z.; Liu, Q.; Yan, C. Behavior of microplastics and plastic film residues in the soil environment: A critical review. Sci. Total Environ. 2020, 703, 134722. [Google Scholar] [CrossRef]
- Barrows, A.P.; Christiansen, K.S.; Bode, E.T.; Hoellein, T.J. A watershed-scale, citizen science approach to quantifying microplastic concentration in a mixed land-use river. Water Res. 2018, 147, 382–392. [Google Scholar] [CrossRef] [PubMed]
- Forrest, S.A.; Holman, L.; Murphy, M.; Vermaire, J.C. Citizen science sampling programs as a technique for monitoring microplastic pollution: Results, lessons learned and recommendations for working with volunteers for monitoring plastic pollution in freshwater ecosystems. Environ. Monit. Assess. 2019, 191, 1–10. [Google Scholar] [CrossRef] [PubMed]
- Nel, H.A.; Smith, G.H.S.; Harmer, R.; Sykes, R.; Schneidewind, U.; Lynch, I.; Krause, S. Citizen science reveals microplastic hotspots within tidal estuaries and the remote Scilly Islands, United Kingdom. Mar. Pollut. Bull. 2020, 161, 111776. [Google Scholar] [CrossRef] [PubMed]
- Dąbrowska, A. A roadmap for a Plastisphere. Mar. Pollut. Bull. 2021, 167, 112322. [Google Scholar] [CrossRef]
- Yang, L.; Zhanga, Y.; Kanga, S.; Wang, Z.; Wu, C. Microplastics in freshwater sediment: A review on methods, occurrence, and sources. Sci. Total Environ. 2021, 754, 141948. [Google Scholar] [CrossRef]
- Elkhatib, D.; Oyanedel-Craver, V. A critical review of extraction and identification methods of microplastics in wastewater and drinking water. Environ. Sci. Technol. 2020, 54, 7037–7049. [Google Scholar] [CrossRef]
- He, D.; Zhang, X.; Hu, J. Methods for separating microplastics from complex solid matrices: Comparative analysis. J. Hazard. Mater. 2021, 409, 124640. [Google Scholar] [CrossRef]
- Akdogan, Z.; Guven, B. Microplastics in the environment: A critical review of current understanding and identification of future research needs. Environ. Pollut. 2019, 254, 113011. [Google Scholar] [CrossRef]
- Prata, J.C.; da Costa, J.P.; Duarte, A.C.; Rocha-Santos, T. Methods for sampling and detection of microplastics in water and sediment: A critical review. TrAC Trends Anal. Chem. 2019, 110, 150–159. [Google Scholar] [CrossRef]
- Hellsten, P.P.; Salminen, J.M.; Jorgensen, K.S.; Nysten, T.H. Use of potassium formate in road winter deicing can reduce groundwater deterioration. Environ. Sci. Technol. 2005, 39, 5095–5100. [Google Scholar] [CrossRef]
- Simpson, M.A.; Al-Reda, S.; Foreman, D.; Guzman, J.; Al-Fawzy, M.; Vice, P. Application and recycling of sodium and potassium formate brine drilling fluids for ghawar field HTHP gas wells. In Proceedings of the Offshore Technology Conference, Houston, TX, USA, 4–7 May 2009. [Google Scholar]
- Svendsen, O.; Toften, J.K.; Marshall, D.S.; Hermansson, C.L. Use of a novel drill-in/completion fluid based on potassium formate brine on the first open hole completioninthe gullfaks field. In Proceedings of the SPE Health, Safety and Environment in Oil and Gas Exploration and Production Conference, Houston, TX, USA, 27–29 March 1995. [Google Scholar]
- Howard, S.K. Formate brines for drilling and completion: State of the art. In Proceedings of the SPE Health, Safety and Environment in Oil and Gas Exploration and Production Conference, Houston, TX, USA, 27–29 March 1995. [Google Scholar]
- Downs, J.D.; Killie, S.; Whale, G.F.; Inglesfield, C.H. Development of environmentally benign format-based drilling and completion fluids. In Proceedings of the SPE Health, Safety and Environment in Oil and Gas Exploration and Production Conference, Jakarta, Indonesia, 25–27 January 1994. [Google Scholar]
- Liu, X.; Gao, Y.; Hou, W.; Ma, Y.; Zhang, Y. Non-toxic high temperature polymer drilling fluid significantly improving marine environmental acceptabiiity and reducing cost for offshore drilling. In Proceedings of the International Petroleum Technology Conference, Beijing, China, 26–28 March 2019. [Google Scholar]
- Ayyagari, V.; Hwang, Y.; Kim, J. Design and development of potassium formate based atmospheric water harvester. Energy 2021, 221, 119726. [Google Scholar]
- Zhang, K.; Su, J.; Xiong, X.; Wu, X.; Wu, C.; Liu, J. Microplastic pollution of lakeshore sediments from remote lakes in Tibet plateau, China. Environ. Pollut. 2016, 219, 450–455. [Google Scholar] [CrossRef]
- Xiong, X.; Zhang, K.; Chen, X.; Shi, H.; Luo, Z.; Wu, C. Sources and distribution of microplastics in China’s largest inland lake–Qinghai Lake. Environ. Pollut. 2018, 235, 899–906. [Google Scholar] [CrossRef]
- Han, X.; Lu, X.; Vogt, R.D. An optimized density-based approach for extracting microplastics from soil and sediment samples. Environ. Pollut. 2019, 254, 113009. [Google Scholar] [CrossRef] [PubMed]
- Ahmed, M.B.; Rahman, M.S.; Alom, J.; Hasan, M.S.; Johir, M.A.H.; Mondal, M.I.H.; Lee, D.Y.; Park, J.; Zhou, J.L.; Yoon, M.H. Microplastic particles in the aquatic environment: A systematic review. Sci. Total Environ. 2021, 775, 145793. [Google Scholar] [CrossRef]
- Zhang, K.; Xiong, X.; Hu, H.; Wu, C.; Bi, Y.; Wu, Y.; Zhou, B.; Lam, P.K.; Liu, J. Occurrence and characteristics of microplastic pollution in Xiangxi bay of three gorges reservoir, China. Environ. Sci. Technol. 2017, 51, 3794–3801. [Google Scholar] [CrossRef]
- Karlsson, T.M.; Vethaak, A.D.; Almroth, B.C.; Ariese, F.; van Velzen, M.; Hassellöv, M.; Leslie, H.A. Screening for microplastics in sediment, water, marine invertebrates and fish: Method development and microplastic accumulation. Mar. Pollut. Bull. 2017, 122, 403–408. [Google Scholar] [CrossRef]
- Waldschlager, K.; Schuttrumpf, H. Effects of particle properties on the settling and rise velocities of microplastics in freshwater under laboratory conditions. Environ. Sci. Technol. 2019, 53, 1958–1966. [Google Scholar] [CrossRef]
- Gaczoł, M. Influence of ionic hydration inhibitors on triple inhibition system mud properties—Technological parameters. AGH Drill. Oil Gas 2017, 34, 95–101. [Google Scholar] [CrossRef] [Green Version]
- Wysocki, S. Influence of ionic hydration inhibitors on triple inhibition system mud properties—Clay rock swelling. AGH Drill. Oil Gas 2017, 34, 629. [Google Scholar] [CrossRef] [Green Version]
- Asensio, R.C.; Moya, M.S.A.; de la Roja, J.M.; Gómez, M. Analytical characterization of polymers used in conservation and restoration by ATR-FTIR spectroscopy. Anal. Bioanal. Chem. 2020, 395, 2081–2096. [Google Scholar] [CrossRef] [PubMed]
- Barszczewska-Rybarek, I.; Jaszcz, K.; Chladek, G.; Grabowska, P.; Okseniuk, A.; Szpot, M.; Zawadzka, M.; Sokołowska, A.; Tarkiewicz, A. Characterization of changes in structural, physicochemical and mechanical properties of rigid polyurethane building insulation after thermal aging in air and seawater. Polym. Bull. 2021, 75, 1–23. [Google Scholar] [CrossRef]
- Noda, I.; Dowrey, A.E.; Haynes, J.L.; Marcott, C. Group frequency assignments for major infrared bands observed in common synthetic polymers. In Physical Properties of Polymers Handbook; Mark, J.E., Ed.; Springer: Berlin/Heidelberg, Germany, 2017. [Google Scholar]
- Müller, C.M.; Pejcic, B.; Esteban, L.; Piane, C.D.; Raven, M.; Mizaikoff, B. Infrared attenuated total reflectance spectroscopy: An innovative strategy for analyzing mineral components in energy relevant systems. Sci. Rep. 2014, 4, 6764. [Google Scholar] [CrossRef] [Green Version]
- Mitra, S.P.; Prakash, D. Adsorption of potassium as influenced by concentration and pH of the solution. Clay Miner. Bull. 1957, 3, 151–153. [Google Scholar] [CrossRef]
- Campanale, C.; Savino, I.; Pojar, I.; Massarelli, C.; Uricchio, V.F. A practical overview of methodologies for sampling and analysis of microplastics in riverine environments. Sustainability 2020, 12, 6755. [Google Scholar] [CrossRef]
- Li, C.; Cui, Q.; Zhang, M.; Vogt, R.D.; Lu, X. A commonly available and easily assembled device for extraction of bio/non-degradable microplastics from soil by flotation in NaBr solution. Sci. Total Environ. 2021, 759, 143482. [Google Scholar] [CrossRef]
- Corcoran, P.L. Degradation of microplastics in the environment. In Handbook of Microplastics in the Environment; Springer: Berlin/Heidelberg, Germany, 2020; pp. 1–12. [Google Scholar]
- Liu, X.; Xu, J.; Zhao, Y.; Shi, H.; Huang, C.-H. Hydrophobic sorption behaviors of 17β-Estradiol on environmental microplastics. Chemosphere 2019, 226, 726–735. [Google Scholar] [CrossRef]
- Yuan, J.; Ma, J.; Sun, Y.; Zhou, T.; Zhao, Y.; Yu, F. Microbial degradation and other environmental aspects ofmicroplastics/plastics. Sci. Total Environ. 2020, 715, 136968. [Google Scholar] [CrossRef]
- Bacha, A.U.R.; Nabi, I.; Zhang, L. Mechanisms and the engineering approaches for the degradation of microplastics. ACS ES&T Eng. 2021, 1, 1481–1501. [Google Scholar]
Figure 1.
Grain size distribution of the sediment used for the experiment.

Figure 2.
XRD pattern of the pure sediment used to prepare the experimental mixtures (Qz-quartz, Kfs-potassium feldspar, Pl-plagioclase, Mic-mica).
Figure 2.
XRD pattern of the pure sediment used to prepare the experimental mixtures (Qz-quartz, Kfs-potassium feldspar, Pl-plagioclase, Mic-mica).

Figure 3.
The ATR-FTIR spectra of polyethylene (PE): Extracted from sediment with water, the potassium formate water solution and clean PE and potassium formate as references.
Figure 3.
The ATR-FTIR spectra of polyethylene (PE): Extracted from sediment with water, the potassium formate water solution and clean PE and potassium formate as references.

Figure 4.
The ATR-FTIR spectra of PUR, PS, PET, PE and residuum from the blank sample.

Figure 5.
TG-DTG-DTA curves recorded for the initial and extracted MP samples: (a) PUR, (b) PS, (c) PE, (d) PET.
Figure 5.
TG-DTG-DTA curves recorded for the initial and extracted MP samples: (a) PUR, (b) PS, (c) PE, (d) PET.

Figure 6.
SEM images of the sediment without polymers after mixing (A); SEM image and EDS analysis of pure sediment surface after mixing (B).
Figure 6.
SEM images of the sediment without polymers after mixing (A); SEM image and EDS analysis of pure sediment surface after mixing (B).

Figure 7.
SEM images of polyethylene terephthalate particles before they were added to the sediment (PET) and extracted from the sediment (extracted PET).
Figure 7.
SEM images of polyethylene terephthalate particles before they were added to the sediment (PET) and extracted from the sediment (extracted PET).

Figure 8.
SEM images of polyethylene particles before they were added to the sediment (PE) and extracted from the sediment (extracted PE).
Figure 8.
SEM images of polyethylene particles before they were added to the sediment (PE) and extracted from the sediment (extracted PE).

Figure 9.
SEM images of polystyrene particles before they were added to the sediment (PS) and extracted from the sediment (extracted PS).
Figure 9.
SEM images of polystyrene particles before they were added to the sediment (PS) and extracted from the sediment (extracted PS).

Figure 10.
SEM images of polyurethane particles before they were added to the sediment (PUR) and extracted from the sediment (extracted PUR).
Figure 10.
SEM images of polyurethane particles before they were added to the sediment (PUR) and extracted from the sediment (extracted PUR).

Figure 11.
SEM images of the surface of the PET particle extracted from the sediment (with positions and the results of the EDS analysis).
Figure 11.
SEM images of the surface of the PET particle extracted from the sediment (with positions and the results of the EDS analysis).


Table 1.
Extraction efficiency for different polymers.
| Polymer Type | Extraction Fluid | Total Extracted Material Mass (g) | MP Retained from Initial 1 g of Polymer Mass (g) * | Polymer Specific Density (g/cm3) [53] |
|---|---|---|---|---|
| PE | H2O | 0.860 | N/A | 0.92 |
| PE | H2O/KCOOH | 0.975 | 0.953 | 0.92 |
| PS | H2O/KCOOH | 0.995 | 0.959 | 1.04 |
| PUR | H2O/KCOOH | 0.698 | 0.681 | 1.20 |
| PET | H2O/KCOOH | 0.452 | 0.312 | 1.38–1.40 |
| blank | H2O/KCOOH | 0.008 | - | - |
* MPex = EMtot—(EMtot × residue % wt); MPex—MP retained from initial 1 g of polymer mass (g); EMtot—Total extracted material mass (g); residue % wt—wt % of ashes (%).
Table 2.
Results of the XRF analysis of the residue left after the thermal analysis of PET.
| Compound | m/m% | Standard Error | Element | m/m% | Standard Error |
|---|---|---|---|---|---|
| SiO2 | 21.16 | 0.41 | Si | 9.89 | 0.19 |
| K2O | 15.71 | 0.29 | K | 13.04 | 0.24 |
| Al2O3 | 8.36 | 0.11 | Al | 4.42 | 0.06 |
| Fe2O3 | 2.98 | 0.09 | Fe | 2.09 | 0.07 |
| MgO | 0.50 | 0.12 | Mg | 0.304 | 0.070 |
| TiO2 | 0.231 | 0.011 | Ti | 0.128 | 0.006 |
Publisher’s Note: MDPI stays neutral with regard to jurisdictional claims in published maps and institutional affiliations. |
© 2022 by the authors. Licensee MDPI, Basel, Switzerland. This article is an open access article distributed under the terms and conditions of the Creative Commons Attribution (CC BY) license (https://creativecommons.org/licenses/by/4.0/).
Share and Cite
MDPI and ACS Style
Jarosz, K.; Natkański, P.; Michalik, M. Microplastic Extraction from the Sediment Using Potassium Formate Water Solution (H2O/KCOOH). Minerals 2022, 12, 269. https://0-doi-org.brum.beds.ac.uk/10.3390/min12020269
AMA Style
Jarosz K, Natkański P, Michalik M. Microplastic Extraction from the Sediment Using Potassium Formate Water Solution (H2O/KCOOH). Minerals. 2022; 12(2):269. https://0-doi-org.brum.beds.ac.uk/10.3390/min12020269
Chicago/Turabian StyleJarosz, Kinga, Piotr Natkański, and Marek Michalik. 2022. "Microplastic Extraction from the Sediment Using Potassium Formate Water Solution (H2O/KCOOH)" Minerals 12, no. 2: 269. https://0-doi-org.brum.beds.ac.uk/10.3390/min12020269
Note that from the first issue of 2016, this journal uses article numbers instead of page numbers. See further details here.