Article

Fibrous Ferrierite from Northern Italy: Mineralogical Characterization, Surface Properties, and Assessment of Potential Toxicity

1
Department of Pure and Applied Sciences, University of Urbino Carlo Bo, 61029 Urbino, Italy
2
Department of Earth Sciences, Sapienza University of Rome, 00185 Rome, Italy
3
Laboratory for Waste Management, Paul Scherrer Institute, Forschungsstrasse 111, 5232 Villigen, Switzerland
4
Department of Biomolecular Sciences, University of Urbino Carlo Bo, 61029 Urbino, Italy
5
Centro Studi Ambientali (CSA Group), Via al Torrente 22, 47923 Rimini, Italy
*
Author to whom correspondence should be addressed.
Submission received: 6 April 2022 / Revised: 3 May 2022 / Accepted: 11 May 2022 / Published: 14 May 2022
(This article belongs to the Special Issue Elongated Mineral Particles and Health)

Abstract

:
Nowadays, fibrous minerals pose as significant health hazards to humans, and exposure to these fibers can lead to the development of severe pulmonary diseases. This work investigated the morphology, crystal structure, chemistry, and surface activity of fibrous ferrierite recently found in northern Italy through an integrated approach using scanning electron microscopy–energy dispersive spectroscopy, electron microprobe, inductively coupled plasma atomic emission spectrometry, X-ray powder diffraction, and electron paramagnetic resonance. Our results show that a notable amount of ferrierite fibers are breathable (average length ~22 µm, average diameter 0.9 µm, diameter-length ratio >> 1:3) and able to reach the alveolar space (average Dae value 2.5 μm). The prevailing extra-framework cations are in the Mg > (Ca ≈ K) relationship, R is from 0.81 to 0.83, and the Si/Al ratio is high (4.2–4.8). The <T-O> bond distances suggest the occurrence of some degree of Si,Al ordering, with Al showing a site-specific occupation preference T1 > T2 > T3 > T4. Ferrierite fibers show high amounts of adsorbed EPR probes, suggesting a high ability to adsorb and interact with related chemicals. According to these results, fibrous ferrierite can be considered a potential health hazard, and a precautionary approach should be applied when this material is handled. Future in vitro and in vivo tests are necessary to provide further experimental confirmation of the outcome of this work.

1. Introduction

Fibrous minerals represent severe environmental and occupational hazards; exposure to these fibers is one of the leading causes of the development of pulmonary diseases [1,2,3]. Asbestos minerals (chrysotile and five types of asbestiform amphiboles) are the most infamous [2,4]. Asbestos is commonly recognized as a toxic and carcinogenic agent, associated with mesothelioma induction, lung tumors, and other lung diseases [4,5]. The crucial features governing toxicity, inflammation, and pathogenicity of asbestos mineral fibers are morphology, biopersistence, and surface reactivity [6,7,8,9].
However, other non-regulated fibrous minerals are potentially as dangerous as the regulatory asbestos because they share similar physical and chemical properties. These fibrous minerals are identified as elongate mineral particles (EMPs) [10]. In particular, several studies have recently been performed on different EMPs, such as the fibrous zeolites erionite [11,12,13,14,15,16,17,18], offretite [11,19], ferrierite [20,21,22], mordenite [23,24], thomsonite and mesolite [14], the amphiboles fluoro-edenite [25,26,27,28], winchite [29], richterite [30,31,32], and fibrous glaucophane [29,33,34], but also fibrous antigorite [35], balangeroite [36] and epsomite [37]. In this scenario, the case of Turkish fibrous erionite is significant [38]. According to epidemiological data [38,39,40], erionite has been classified as a carcinogenic mineral for human health and is listed as Class-I by the International Agency for Research on Cancer [4,41]. According to the IARC [42], the scarcity of studies on fibrous minerals other than asbestos and erionite is also a cause of concern. Here, we focused our attention on a natural fibrous zeolite, specifically ferrierite recently discovered in Northern Italy [43]; it has already been reported as a possible risk to human health [20,21].
The mineral ferrierite was firstly described at Kamloops Lake, British Columbia, Canada, by Graham [44]. The International Mineralogical Association [45] has elevated the name to series status to include three species with the same crystal structure (FER framework-type, [46]) but different extra-framework cations (Mg, K, and Na). Ferrierite-Mg is the new name for the original material, while ferrierite-Na and ferrierite-K are new species with the type localities at Altoona (Wahkiakum County, Washington, DC, USA) and Santa Monica Mountains (Los Angeles County, CA, USA), respectively.
Ferrierite is a high-silica natural zeolite with the general chemical formula (Na,K)Mg2Ca0.5[Al6Si30O72] 20H2O belonging to the mordenite group [47,48]. Those structures share the presence of sheets, often puckered, made of six-membered rings of TO4 tetrahedra (T=Si, Al in natural samples). In the same sheet, half of the tetrahedral apices point upward and half downward, causing the formation of a 3D framework. Specifically, the maximum symmetry of the framework topology of ferrierite is orthorhombic, space group Immm [49,50], albeit some authors observed the lowering of the symmetry to Pnnm [51] and, for an Mg-poor sample, to P21/n [52]. Reduction of symmetry from Immm relaxes a straight T-O-T angle, which is unfavorable from an energetic point of view. This feature has been observed in mordenite, too [53]. The unit cell parameters are a = 18.90–19.45 Å, b = 14.12–14.28 Å and c = 7.48–7.54 Å. The Mg-poor monoclinic sample was characterized by a β angle of 90.0(1)° [52]. As mentioned, the framework of ferrierite is built of corrugated sheets parallel to (100), linked by six-membered rings (6MR). This structural arrangement produces channels formed by 10-member rings (10MR) running along with c (5.2 × 4.2 Å). Those channels intersect with eight-member channels (8MR) running along b (4.8 × 3.5 Å) [48]. The framework density, FD, is 17.7 T/1000 Å3 and the average R, Ra = Si/(Si + Al) is 0.83, ranging from 0.78 to 0.88 [54].
Ferrierite generally has a hydrothermal origin, and most of its occurrences are associated with fractures, vesicles, or other cavities in altered basalt or andesite flows and flow breccia [54]. Ferrierite has also been recognized in diagenetic settings of sedimentary rock, such as rhyolitic tuff interbedded with lacustrine sediment and andesitic sediment in near-arc basins [54,55]. One of the significant occurrences of ferrierite as a diagenetic product of rhyolitic pyroclastic rocks is represented by the deposit of Lovelock, NV, USA. [20,55], where its content is so high (>50 wt.%, zeolite-rich rock) as to make the host rock well-suitable for mineral exploitation. It is noteworthy that in all occurrences, ferrierite is closely associated with other high-silica zeolites (commonly mordenite and clinoptilolite), as well as carbonates, sulfates, phosphates, chalcedony, feldspar, and quartz [20,54].
Ferrierite crystals may display several habits, ranging from lath-like/lamellar, prismatic, needle-like, acicular, and fibrous to asbestiform [20]. Recently, a variety of ferrierite with a particularly fibrous–asbestiform habit and chemical–physical properties very similar to those of erionite has been described by Gualtieri et al. [20]. If we consider that erionite is known to induce malignant mesothelioma and is classified as a carcinogen for humans [4,41], it is natural to hypothesize that other fibrous-asbestiform zeolites such as ferrierite could also be potentially dangerous for human health. This is even more relevant if the rocks containing this ferrierite are mined and used for industrial applications. In this case, the processing of the friable host rocks can generate airborne asbestos-type fibers [56], which may represent a potential environmental and health hazard.
According to the requirements of the recent guidelines [5], we present detailed morphological, mineralogical, and physicochemical characterization and the surface activity of fibrous ferrierite recently found in northern Italy. Data from scanning electron microscopy energy dispersive spectroscopy (SEM-EDS), electron microprobe (EMP), inductively coupled plasma-atomic emission spectrometry (ICP-AES), X-ray powder diffraction (XRPD), and an electron paramagnetic resonance (EPR) analysis were combined and integrated. In particular, the EPR technique using selected spin probes has already demonstrated to be a very helpful tool for analyzing the interaction capacity of zeolite surfaces, providing important information on surface properties and interfaces [11,14]. Our aims were (i) to investigate the relationships between morphology, crystal structure, mineral chemistry, and interacting ability of this zeolite surface, (ii) to provide background knowledge for upcoming experiments on the biological activity of ferrierite, and (iii) to assess if fibrous ferrierite may represent a potential health hazard.

2. Materials and Methods

2.1. Materials

The ferrierite samples selected for this study (FER1 and FER5, Figure 1) are from Albero Bassi locality, Santorso, Vicenza Province, Veneto, Italy. They were found as secondary minerals [43] in voids and vesicles of fine-grained basalt flows belonging to the Tertiary Veneto Volcanic Province, northern Italy [57,58]. Orange–reddish, transparent, thin blades represent the most frequent type (FER1) to acicular/fibrous sub-millimetric crystals, filling vesicles and vugs. In fewer vesicles (~15%), ferrierite is present as spherules and sub-spheric radial aggregates (up to 2 mm) of closely matted, colorless acicular/fibrous crystals partially to completely coat the vesicle walls (FER5). From these two samples, which have been chosen to represent the two varieties, ferrierite fibers were manually separated from the matrix under a stereoscopic optical microscope. Different fractions were used depending on the experimental method applied.

2.2. ESEM and EMP Investigation

Morphological observations were performed using an Environmental Scanning Electron Microscope (ESEM) FEI Quanta 200 FEG (FEI, Hillsboro, OR, USA), equipped with an energy-dispersive X-ray spectrometer (EDS) for microchemical analyses. Operating conditions were 25 kV accelerating voltage, variable beam diameter, 10–12 mm working distance, and 0° tilt angle. The ESEM low vacuum mode was used, with a specimen chamber pressure set from 0.80 to 0.90 mbar. The images were obtained using a single-shot detector (SSD) or an Everhart–Thornley secondary electron detector (ETD). The dimensions of the individual fibers were measured directly on several ESEM images. The widths and lengths of more than 1000 fibrils were measured. Qualitative chemical data were collected at several analytical points on different ferrierite crystals to check homogeneity in composition. Additional chemical analyses were also performed on impurities detected on the crystal surface for their major element compositions.
Quantitative microchemical data were collected with a Quanta 400 SEM (FEI, Hillsboro, OR, USA) equipped with an EDX Genesis EDS system following the procedures described by [59]. Operating conditions were: 15 kV accelerating voltage, 13.4 mm working distance, and 0° tilt angle. For comparison, selected ferrierite crystals from the FER1 sample were embedded in epoxy resin and analyzed by EMPA using a Jeol JXA-8200 WD/ED combined microanalyzer. The quantitative determination of zeolite compositions was performed according to the recommended protocol by Campbell et al. [60] using an acceleration voltage of 15 kV and the smallest beam diameter (1 µm). A series of standards consisting of oxides and silicate minerals with traceable provenience was measured for calibration. The chemical data were reported, corresponding to the average values calculated from several individual point analyses for each crystal.
The balance error formula E% [61] was used to select the positive analyses. The cut-off was set to 10%. The final crystal-chemical formulae were calculated, after renormalization of the chemical analyses, considering the water content determined by thermogravimetric data in the case of SEM-EDX, based on 36 (Si + Al) atoms per formula unit (apfu). Thermogravimetric analyses were performed on the FER1 sample using a TGA 400 Perkin Elmer with a heating ramp of 20.0 °C/min under N2 flow, at 20 to 800 °C. EMPA of FER1 indicated a FeO content of 1.97 wt.% arising from the Fe-rich phyllosilicate particles sticking at the surface. For this reason, iron was not included in the calculation of the crystal-chemical formula.

2.3. Fiber Density and Dae Calculations

The deposition region of mineral fiber in the respiratory tract is directly related to its equivalent aerodynamic diameter (Dae) [62]. For the calculation of Dae, the fiber’s density represents a fundamental parameter. Particles with Dae < 100 μm (inhalable fraction) are deposited in the nasopharyngeal tract, particles with Dae < 10 μm pass the larynx (thoracic fraction), and particles with Dae < 4 μm (respirable fraction) may reach the alveoli. The theoretical density of ferrierite was obtained using the following formula: (molecular weight * number of molecules per unit cell)/(unit cell volume * Avogadro’s number). For the Dae calculation, the equation by Gonda and Abd El Khalik [63] was used, where d = fiber diameter; β = fiber length/d (aspect ratio); ρ = density; ρ0 = unit density (1 g/cm3).

2.4. ICP-AES Investigation

The elemental composition of the ferrierite sample was determined by inductively coupled plasma-atomic emission spectrometry (ICP-AES Varian720ES, Varian Inc., Palo Alto, CA, USA). The sample dissolution was carried out by the EPA 3052 1996 method: 100 mg of dry samples were digested in a mixture of 9 mL of HNO3, 3 mL HCl, 2 mL of HF was concentrated for 15′ at 180 °C, followed by the addition of 10 mL H3BO3 at 5% for 20′ at 150 °C in a block digestor DigiPREP MS (SCP Science, Canada), and filtrated. All chemicals used in the sample treatment were suprapure grade; ultrapure water was used for all solutions. After sample dissolution, the elemental determination was carried out with the EPA 6010D 2018 method. The originating solutions were analyzed by ICP-AES. A quality control check was performed to consider the possible impurity of reagents and release from containers and instrumentation. A blank sample was prepared by mixing all reagents and applying the same procedures without the sample addition. Interferences need to be assessed, valid corrections applied, or data flagged to indicate problems. The method’s accuracy was verified using recovery tests with a laboratory control system (LCS) constituted by a blank sample added with known quantities of analytes (reference sample). A difference of 20% of the mean results from the expected values was obtained by replicating the preparation and analysis of the reference sample (analytical standard errors). The reproducibility of metal determinations (precision), based on variation in the replicate analysis on the same sample, was 10% lower.

2.5. X-ray Powder Diffraction

A representative amount of pure ferrierite crystals from FER1 and FER5 samples were hand-picked under a binocular. The samples were gently ground in an agate mortar, and the resulting powders were loaded in 0.7 mm diameter SiO2-glass capillaries aligned on a standard goniometer head. Powder diffraction data were collected on a focusing-beam D8 Advance (Bruker AXS, Karlsruhe, Germany), which operates in transmission mode and θ-θ geometry. The goniometer is fitted with a PSD VÅntec-1 set to an opening angle of 6° 2θ. Measurements were collected in the 5–145° 2θ angular range, 0.022° 2θ step size, and 10 s counting time using CuKα radiation. Rietveld refinements were carried out with Topas V.6 [64]. The software adopts the fundamental parameters approach (FPA) [65] for line-profile fitting. The fibrous morphology of the samples produced anisotropic peak broadening that was approximated by normalized symmetrized spherical harmonics functions [66]. Absorption effects were accounted for by the equation of Sabine et al. [67] for a cylindrical sample. Minor preferred orientation effects, commonly found in samples prepared as capillaries [22], were modeled by normalized symmetrized spherical harmonics functions, selecting the appropriate number of terms (sixth-order, nine refinable parameters) based on the procedure indicated by Ballirano [68]. The structure of the two samples was refined in the Immm space group. Starting structural parameters were taken from Giacobbe et al. [22] for a fibrous ferrierite sample from British Columbia (Canada) owing to chemical similarities. The model includes two partly occupied cation sites (K1 and Mg1) located, respectively, within the 10-member channel and the [010] channel. H2O molecules populate five sites (W1, W2, and W3 coordinated to Mg1 to form a disordered Mg(H2O)62+ complex; W4 and W5 at the bonding distance from K1). A preliminary analysis of the FER1 pattern revealed the occurrence of minor quartz and an abundant 15 Å Fe-bearing phyllosilicate phase, as indicated by the relatively high level of the background. In the case of sample FER1, the starting structural data of quartz were those of Le Page and Donnay [69], and only its scale factor was optimized along with a single parameter for modeling the crystallite dependence of the peak broadening. Moreover, the abundant presence of the phyllosilicate phase was approximated with two peaks located at ca. 5.9 and 21.9° 2θ, not related to any structure, whose position, intensity, and breadth were optimized during the least-squares procedure using the same approach adopted by Pacella et al. [70]. However, owing to the possible unaccounted contribution of other reflections superimposed on those of ferrierite, the refined structure of FER1 resulted in significantly dispersed (1.519(8)–1.718(8) Å) individual T-O bond distances. For this reason, no detailed description of the structure will be reported in the following.
Isotropic displacement parameters of ferrierite were refined for groups of atoms (all tetrahedral cations, all framework oxygens, all extra-framework cations) in the initial stages of the refinements, whereas those of the oxygen atoms of H2O were kept fixed to the average value calculated from the structural data of [22]. A difference Fourier map, calculated at this stage, suggested the occurrence of a further H2O site (W6) located in the vicinity of the equally labeled site observed at room temperature by Arletti et al. [71]. After insertion of this site, in the final cycle of refinement, individual isotropic displacement parameters of the framework atoms were refined. Moreover, site scattering (s.s.) at extra-framework cation and H2O sites were refined. The framework and the extra-framework cation sites were modeled using neutral scattering curves of Si, O and K, and Mg, whereas fully ionized O−2 scattering curves were used for modeling the H2O molecule sites to empirically compensate for the presence of the bonded hydrogen atoms, following the same approach successfully adopted in the case of the Rietveld refinement of mordenite samples [24]. As a result, the total H2O pfu was refined to a value close to that observed from TGA data. In the last refinement cycles, the population of Al vs. Si at the various tetrahedral sites T was iteratively adjusted to adhere to that calculated from the evaluation of the corresponding <T-O> using the Jones equation [72].

2.6. Electron Paramagnetic Resonance

The analysis of EPR spectra, in terms of magnetic parameters and their interpretation based on the molecular structure, has made this technique very important for the characterization of solid zeolitic systems [11,14,73,74]. The spin probe technique was used to obtain information on the chemical–physical structure of these systems. Calculating the spectral parameters is crucial for comparing the spectra obtained from the interaction of the same probe on the various solids and between the spectra of several probes on the same sample.
Since zeolites lack an intrinsic paramagnetic center, it was necessary to introduce radical species able to interact with the surface. The 4-trimethylammonium, 2,2,6,6 tetramethyl-piperidine-1oxyl bromide (CAT1), and 4-octyl dimethylammonium, 2,2,6,6 tetramethyl-piperidine-1oxyl bromide (CAT8) probes have been selected to characterize the adsorption and interaction properties of these minerals to evaluate their carcinogenic potential [20]. These radical species belong to the class of compounds called ionic surfactants. Indeed, CAT8 is characterized by a cationic hydrophilic polar head and a hydrophobic hydrocarbon chain. The stability of these compounds is guaranteed by the presence of the four methyl groups, which considerably decrease reactivity by steric bulk. The radical solutions were prepared with Millipore bidistilled water at a final concentration of 1 mM and stored in the refrigerator. The samples for EPR analysis were prepared by mixing 125 mg of zeolite with 0.5 mL of CAT1 (Sigma-Aldrich) or CAT8 (Columbia University, NY, USA) 1 mM solution in water, under stirring overnight. Then, the supernatant (sur) solutions were analyzed and compared to the CAT1 and CAT8 (Bn) stock solutions, using 2 mm tubes in controlled and reproducible conditions to allow reliable evaluations of spectral intensities and to evaluate the intensity variations from non-adsorbed to adsorbed solutions. The solid fibers, after filtration, were gently dried on a filter paper until the solids recovered from the dry, dusty conditions. The dried fibers were inserted into a 2 mm tube and tested on the EPR spectrometer.
EPR spectra were recorded with an X-band EMX Bruker EPR spectrometer (9.5 GHz). The amplitude of the signal modulation was chosen to avoid line widening due to overmodulation (1 G). The attenuation was kept fixed at 10 dB to avoid signal saturation. To record the spectra, a PC with WinEPR Acquisit Bruker software interfaced with the spectrometer was used. The magnetic field of the spectrometer was calibrated by DPPH (g = 2.0036). All EPR spectra of the nitroxides in the solution were recorded in an aqueous solution and at room temperature.
Depending on the type of analyzed sample, three EPR spectra were obtained: the spectrum of the stock solution (Bn), the spectrum of the supernatant solutions, and the spectrum of the solid on which the radical probe is adsorbed. The measurements carried out aimed to study the interphase properties, accessibility to the internal phase, and the type of interactions between zeolites and cationic radicals. The magnetic parameters were obtained from the spectra of these radicals, in the presence or absence of ferrierite crystals, such as in correlation time (mobility of the radical and the interaction strength of the probe), the hyperfine coupling constant (polarity of the radical neighborhood), the double integral of the spectrum (concentration of radical species), and the intrinsic line width (spin–spin interactions).
In some cases, the spectra have two components superimposed on each other due to probes distributed in different environments; in fact, the typical EPR spectrum varies considerably based on experimental conditions, temperature, and solvent but in general, is given by the superposition of spectra of mobile, adsorbed or aggregated and blocked radicals [75]. The components were identified and simulated by the Multicomponent software [76]. Therefore, each component was calculated to obtain the parameters listed above, quantifying (in relative percentages) the fractions of probes distributed in the different environments.

3. Results

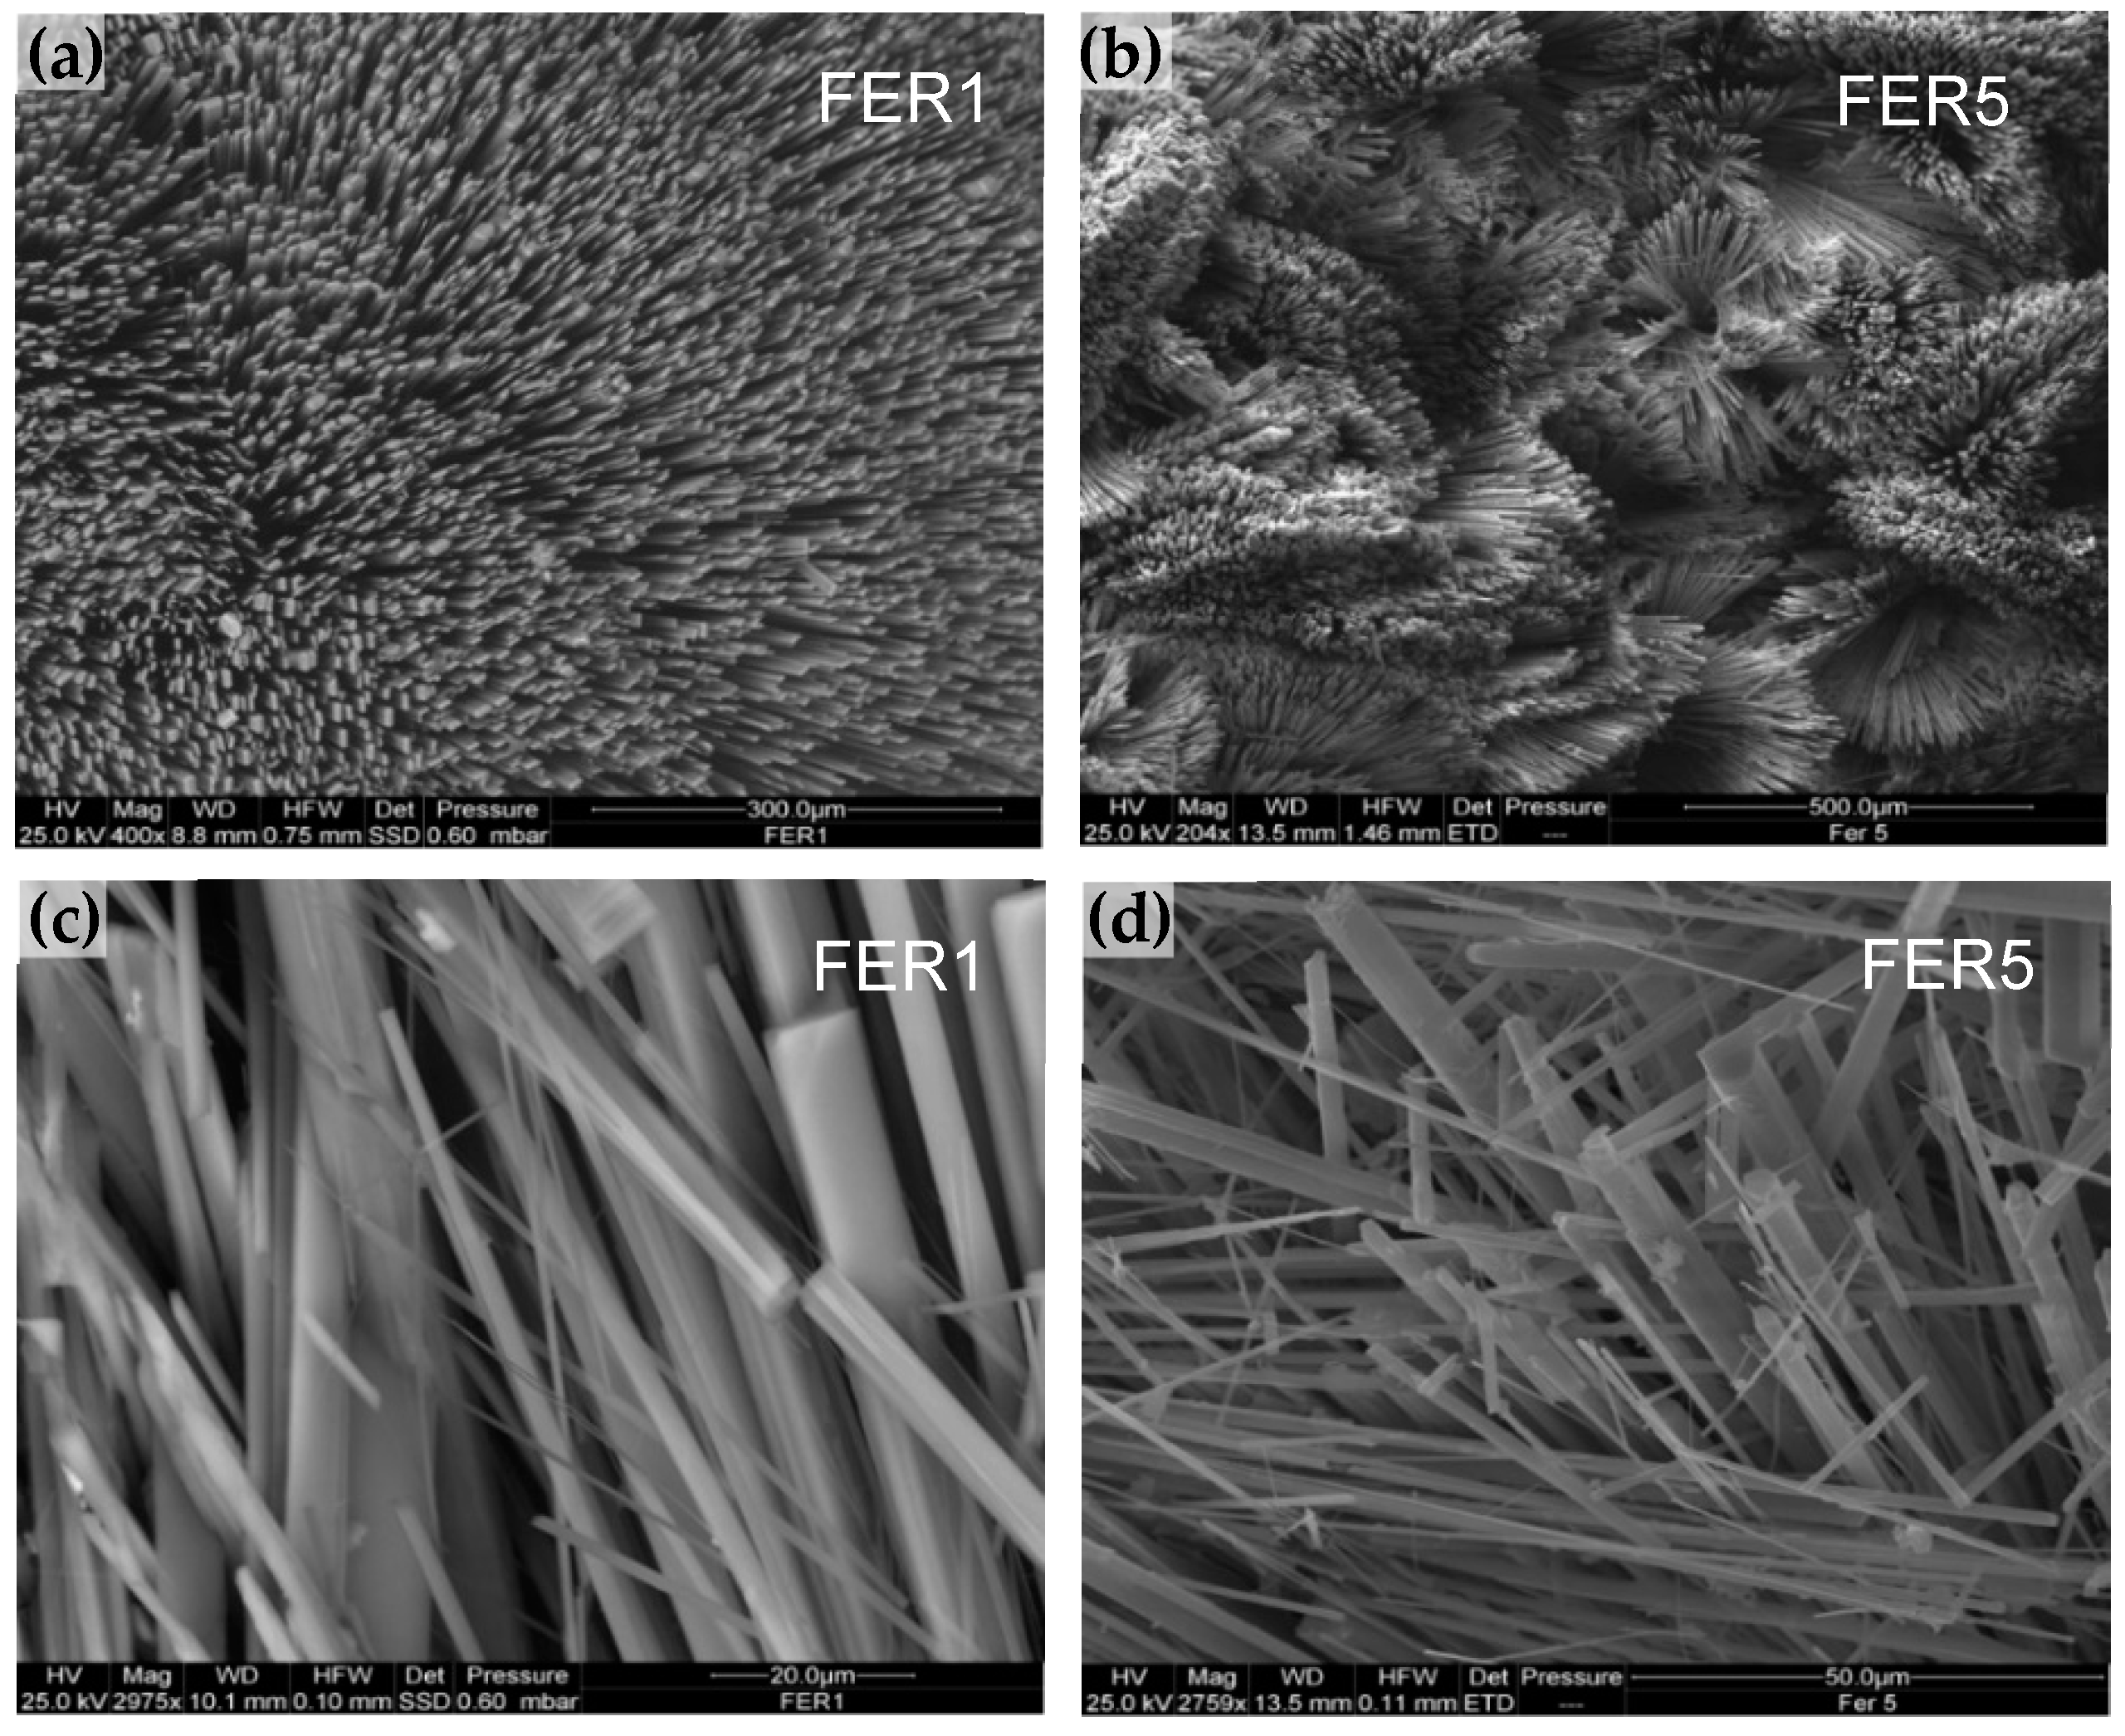
3.1. Morphology and Morphometry

The morphology and morphometry of minerals are essential factors in their potential for health impacts. For this reason, morphometric analyses were performed on selected ESEM images to quantify the size (length and diameter) of all the visible fibers in the pristine sample and those separated and deposited on the sampling plate, including those partially separated from the main crystals. These results are summarized in Table 1, while Figure 1 reports a selection of ESEM pictures of FER1 and FER2 samples.
Ferrierite from northern Italy occurs as flattened and very elongated prismatic crystals to highly fibrous habits with very low flexibility. ESEM investigations showed no remarkable variation in the morphology and morphometry of fiber particles among the two samples. They have a wide range of length values, ranging from 8 to 120 μm (averages 24.5–21.5 μm for FER1 and FER5, respectively), but about half of the fiber population is less than that 20 μm in length. The widths of the fibers range overall between 0.1 and 12 μm (averages 0.85–0.9 μm for FER1 and FER5, respectively), and more than 88% (FER1) and 91% (FER5) of the fibers show a width < 3 μm.
Applying the equation of Gonda and Abd El Khalik [63] to representative ferrierite fibers from the studied samples with theoretical density ρ = 2.136 g/cm3, mean lengths 24.5 μm (FER1), and 21.5 μm (FER5), and an average diameter 0.9 μm (FER1) and 0.85 μm (FER5), we obtained Dae values of 2.59 μm and 2.42 μm for FER1 and FER5, respectively.

3.2. Chemical Composition

Microchemical data of the investigated ferrierite crystals are summarized in Table 2. The chemical formulas of the two fibrous ferrierite, as determined from SEM-EDX and EMPA analyses are: (Mg2.22 K0.79Ca0.76Na0.30)[Si29.07Al6.93O72]·21.97H2O [E% = −1.56, with R = Si/(Si + Al) = 0.81] for the FER1 sample and (Mg1.77K0.65Ca0.65Na0.36)[Si29.80Al6.20O72]·22.76H2O (E% = +5.90, with R = 0.83) for the FER5 sample. The water content of the FER1 sample determined from the TG analysis was 14.80 wt.%, corresponding to ca. 22–23 H2O pfu and in agreement with the literature data [77]. This content was used for recalculation of the crystal-chemical formula of both samples. The two samples have a similar chemical composition and may be described as Mg-rich ferrierites. The prevailing extra-framework cations are in the Mg > (Ca ≈ K) relationship. The M/(M + D) ratio (M = Na + K; D = Ca + Mg + Mn) is in the 0.266–0.293 range. Na content is relatively low (0.30–0.36 apfu). ICP-AES chemical analyses (Table 3) confirm the presence of a significant amount of Fe (15,400 mg/kg), as already observed by EMPA of FER1 (FeO content of 1.97 wt.%). However, based on crystal-chemical data and formula calculations, the possible incorporation of Fe within the structure of ferrierite seems to be very improbable. We assume that the detected iron could be mainly related to Fe-rich particles or nanoparticles on the fiber surface for these reasons. ICP-AES data also show low content of both Ba (1460 mg/kg) and Sr (1330 mg/kg), but only the former was observed by EPMA in FER1. Other minor elements are absent or present in negligible amounts (e.g., Zn 322 mg/kg, Mn 345 mg/kg, Pb 110 mg/kg).

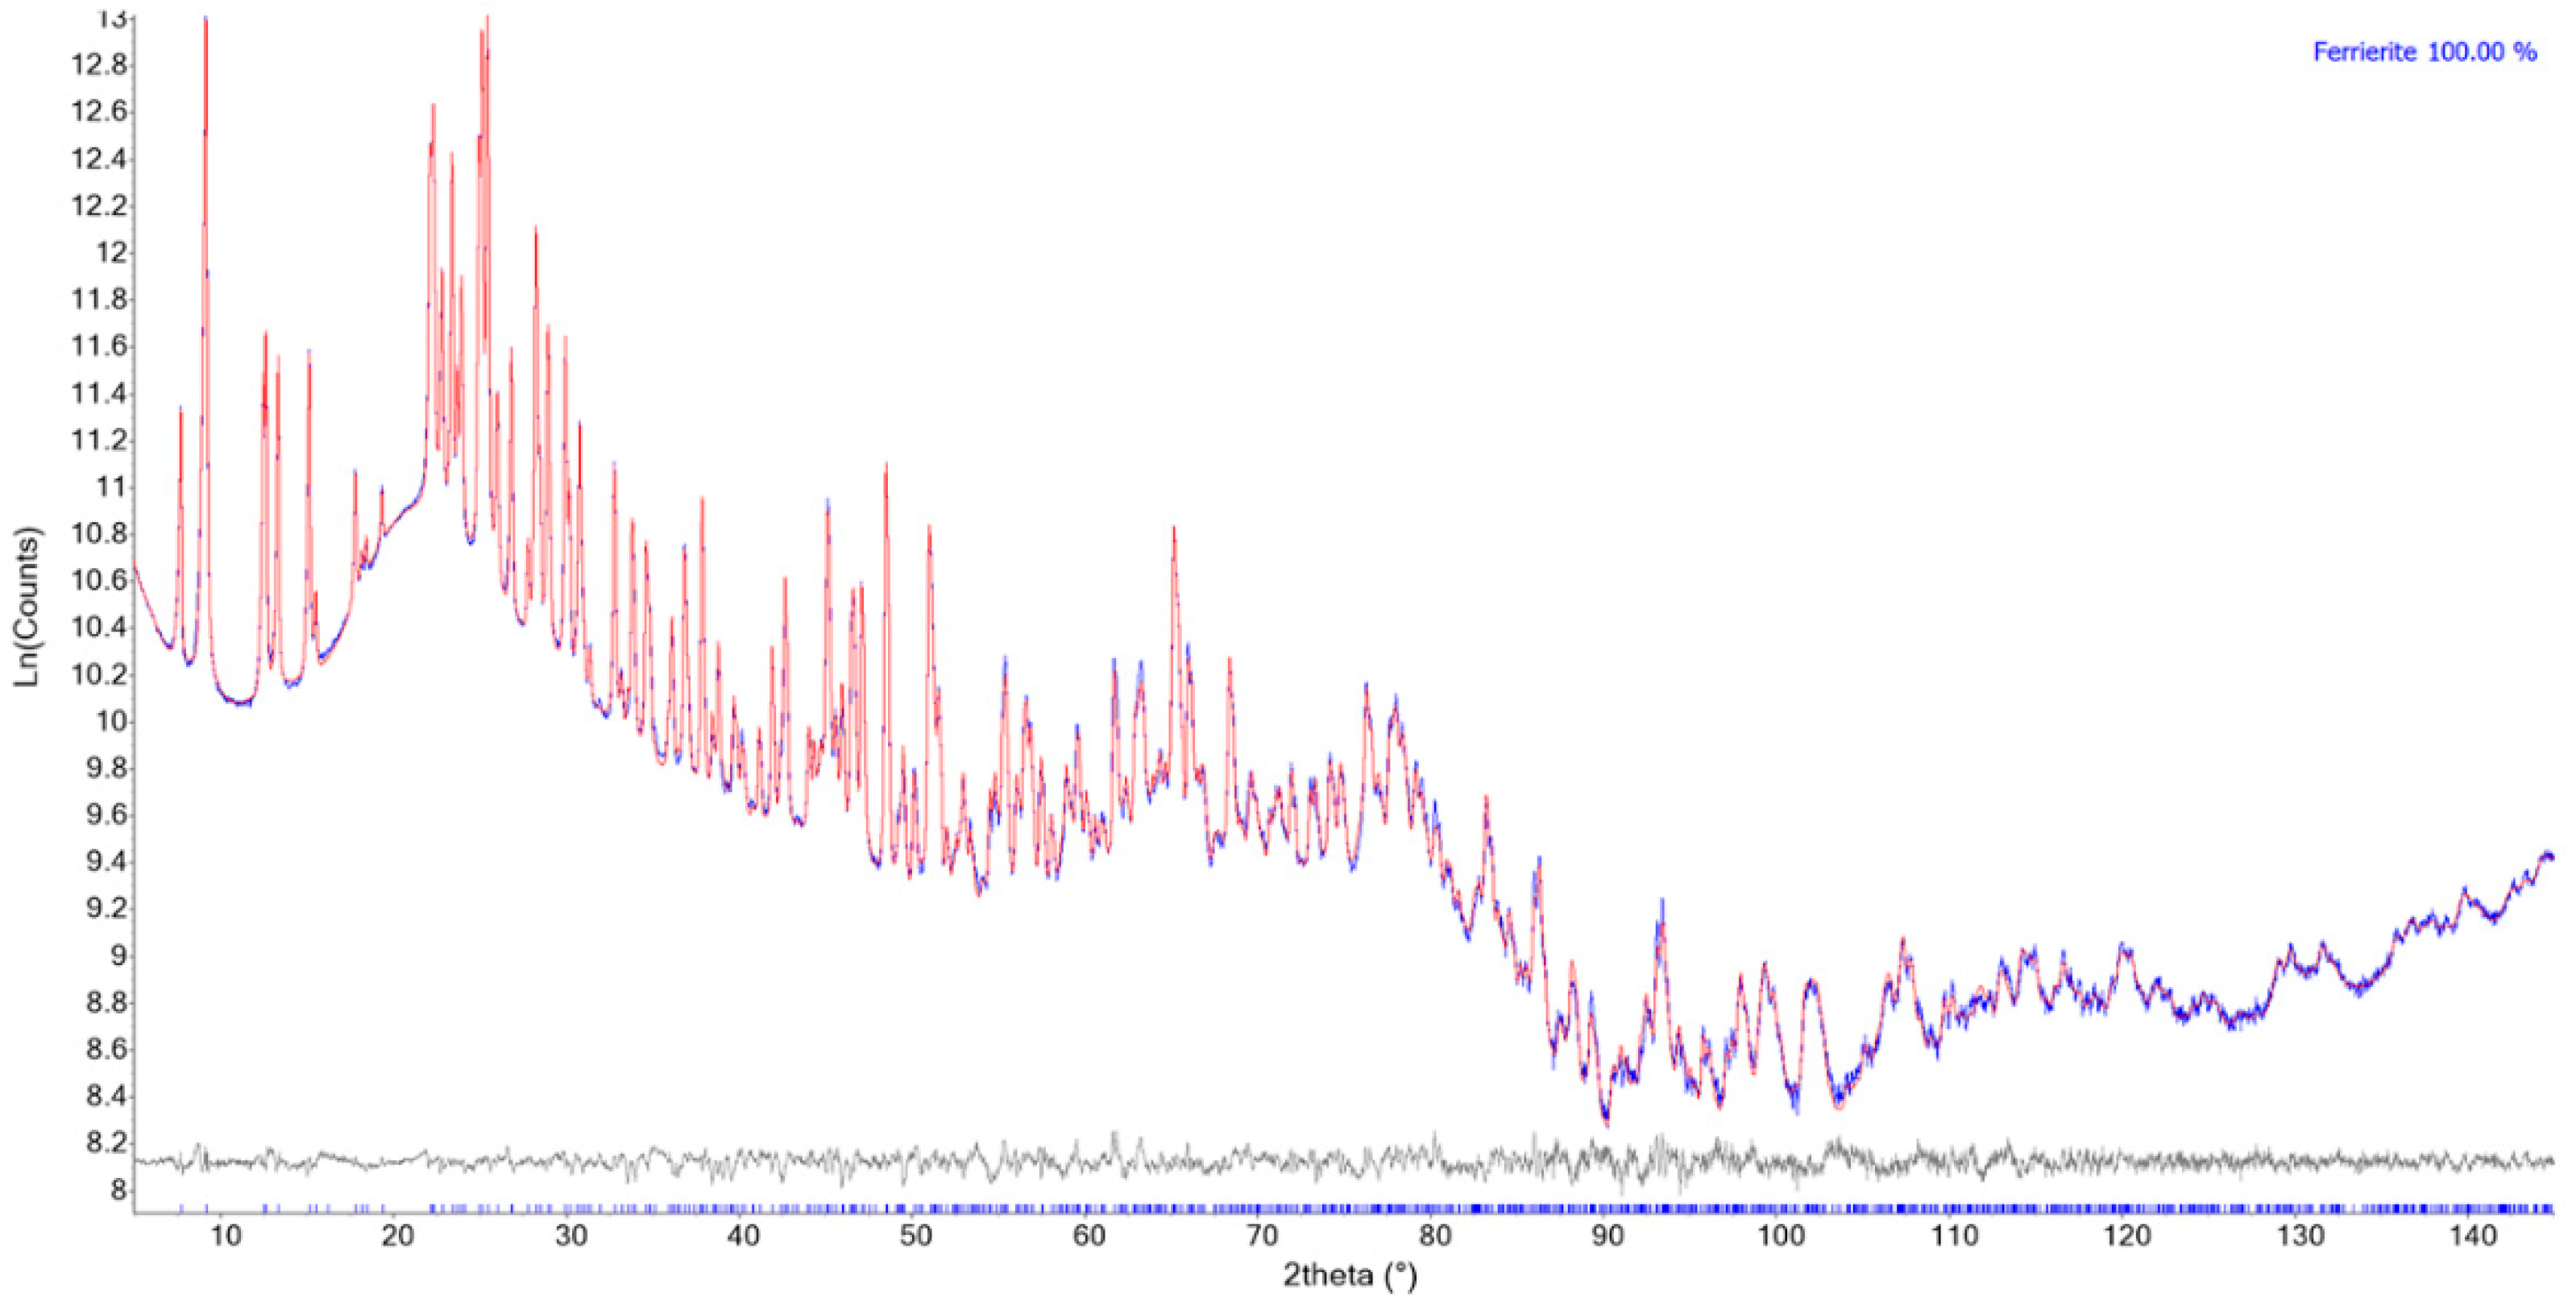
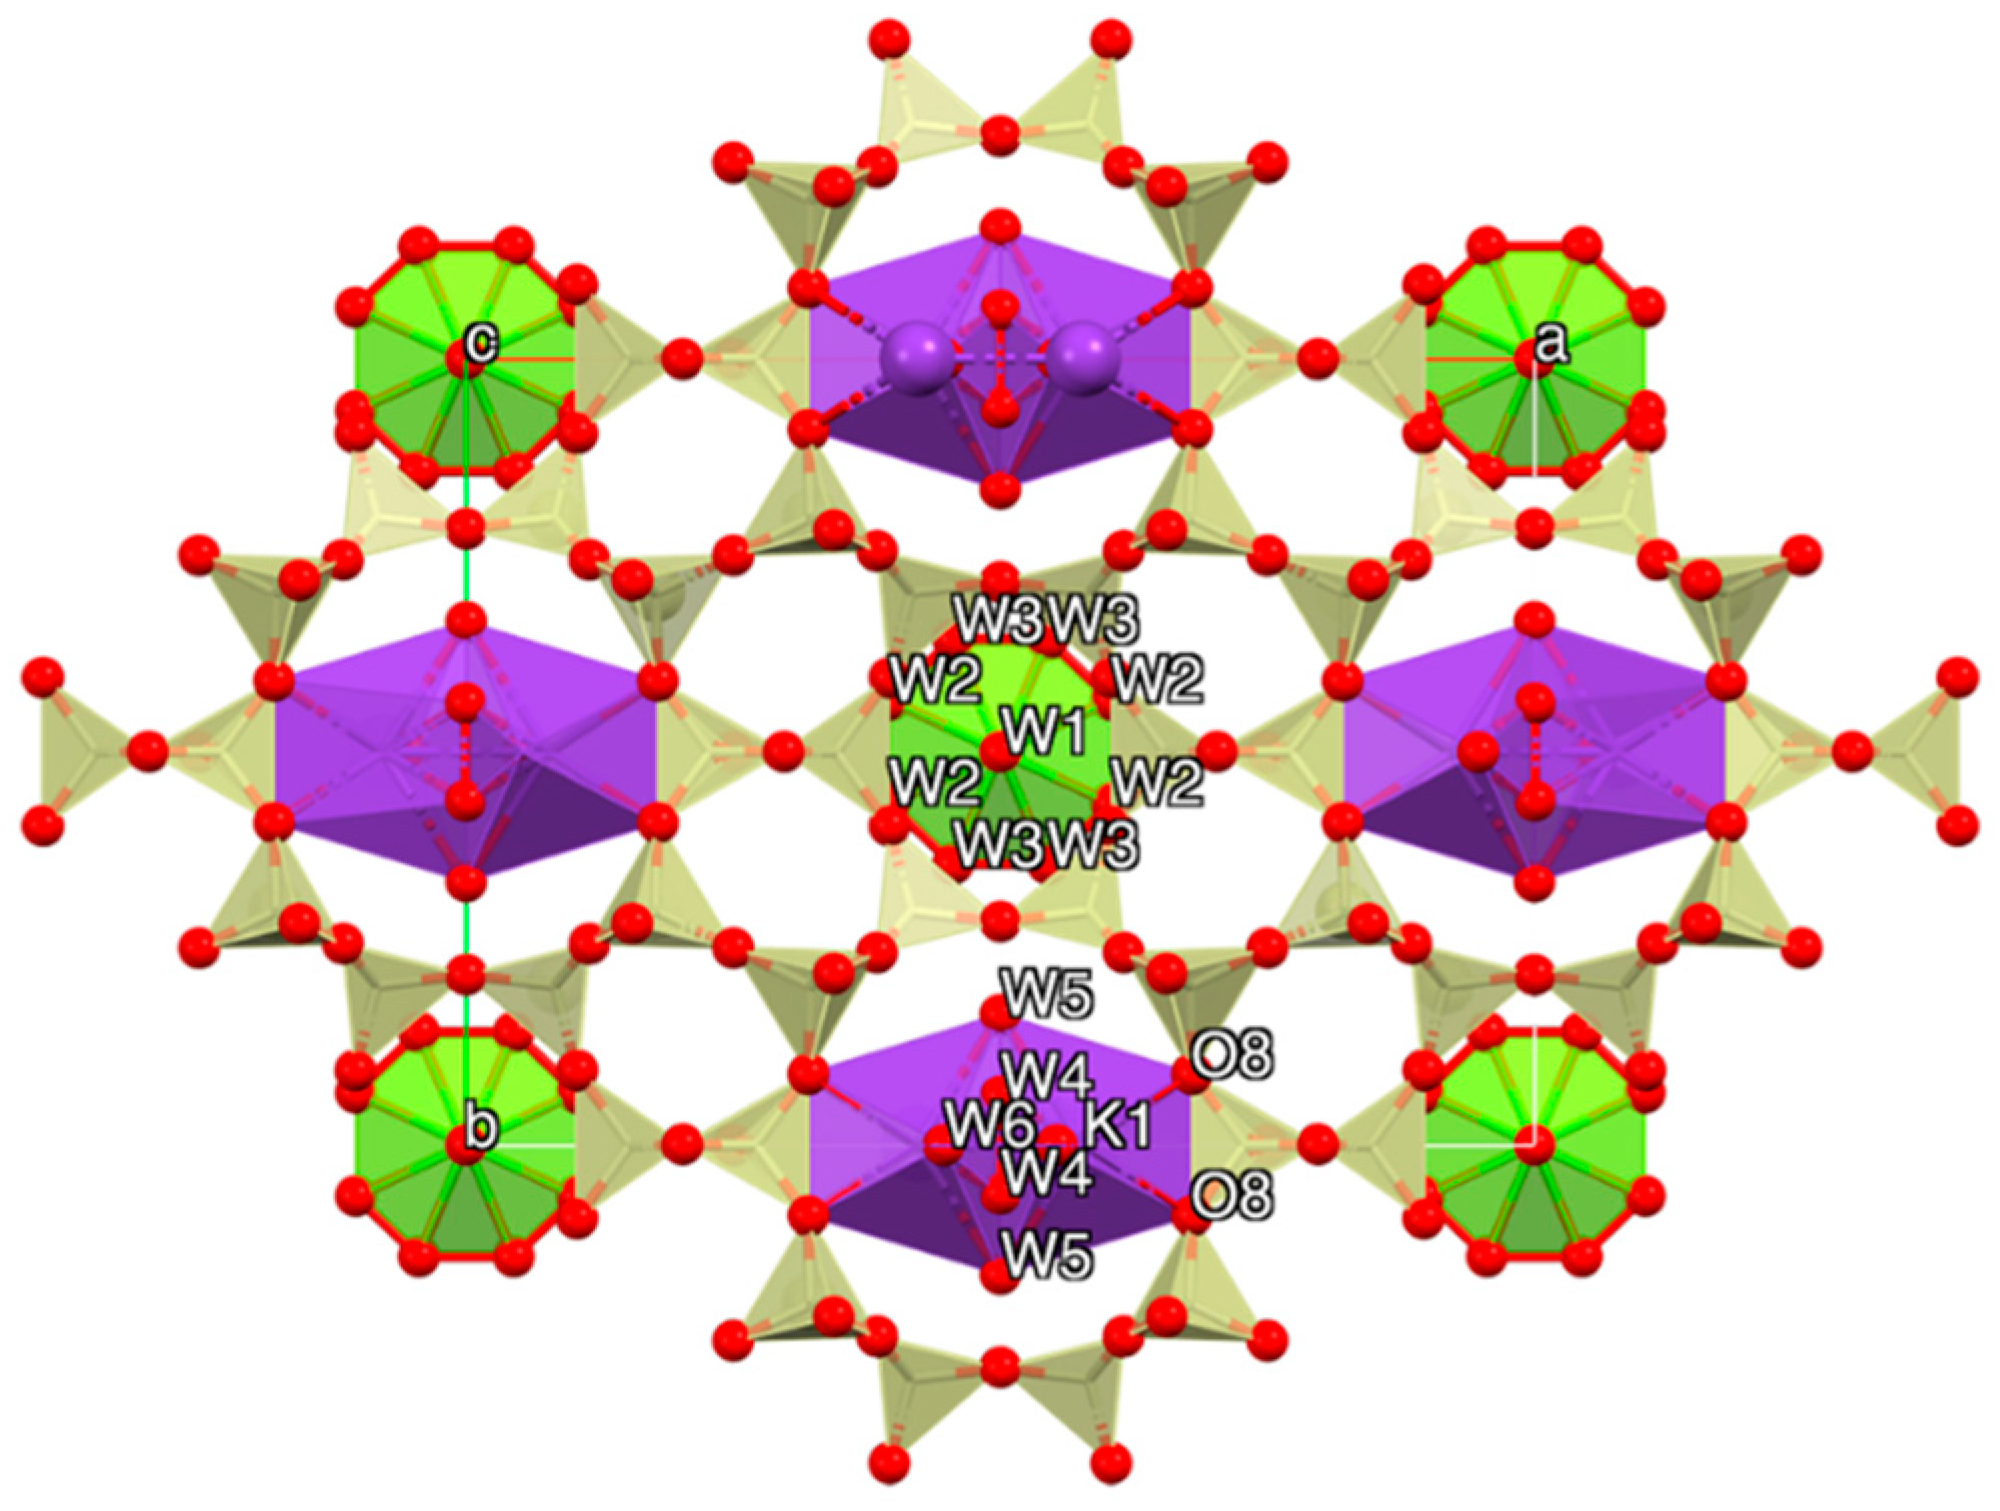
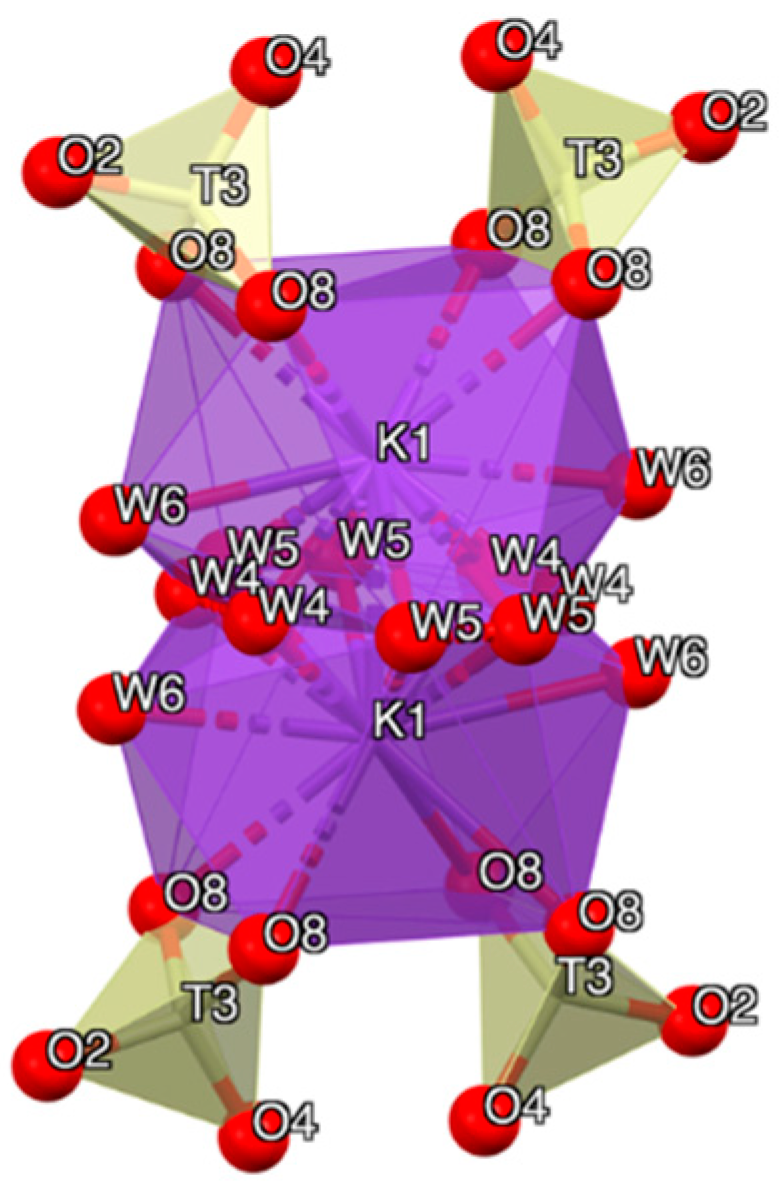
3.3. Crystal Structure
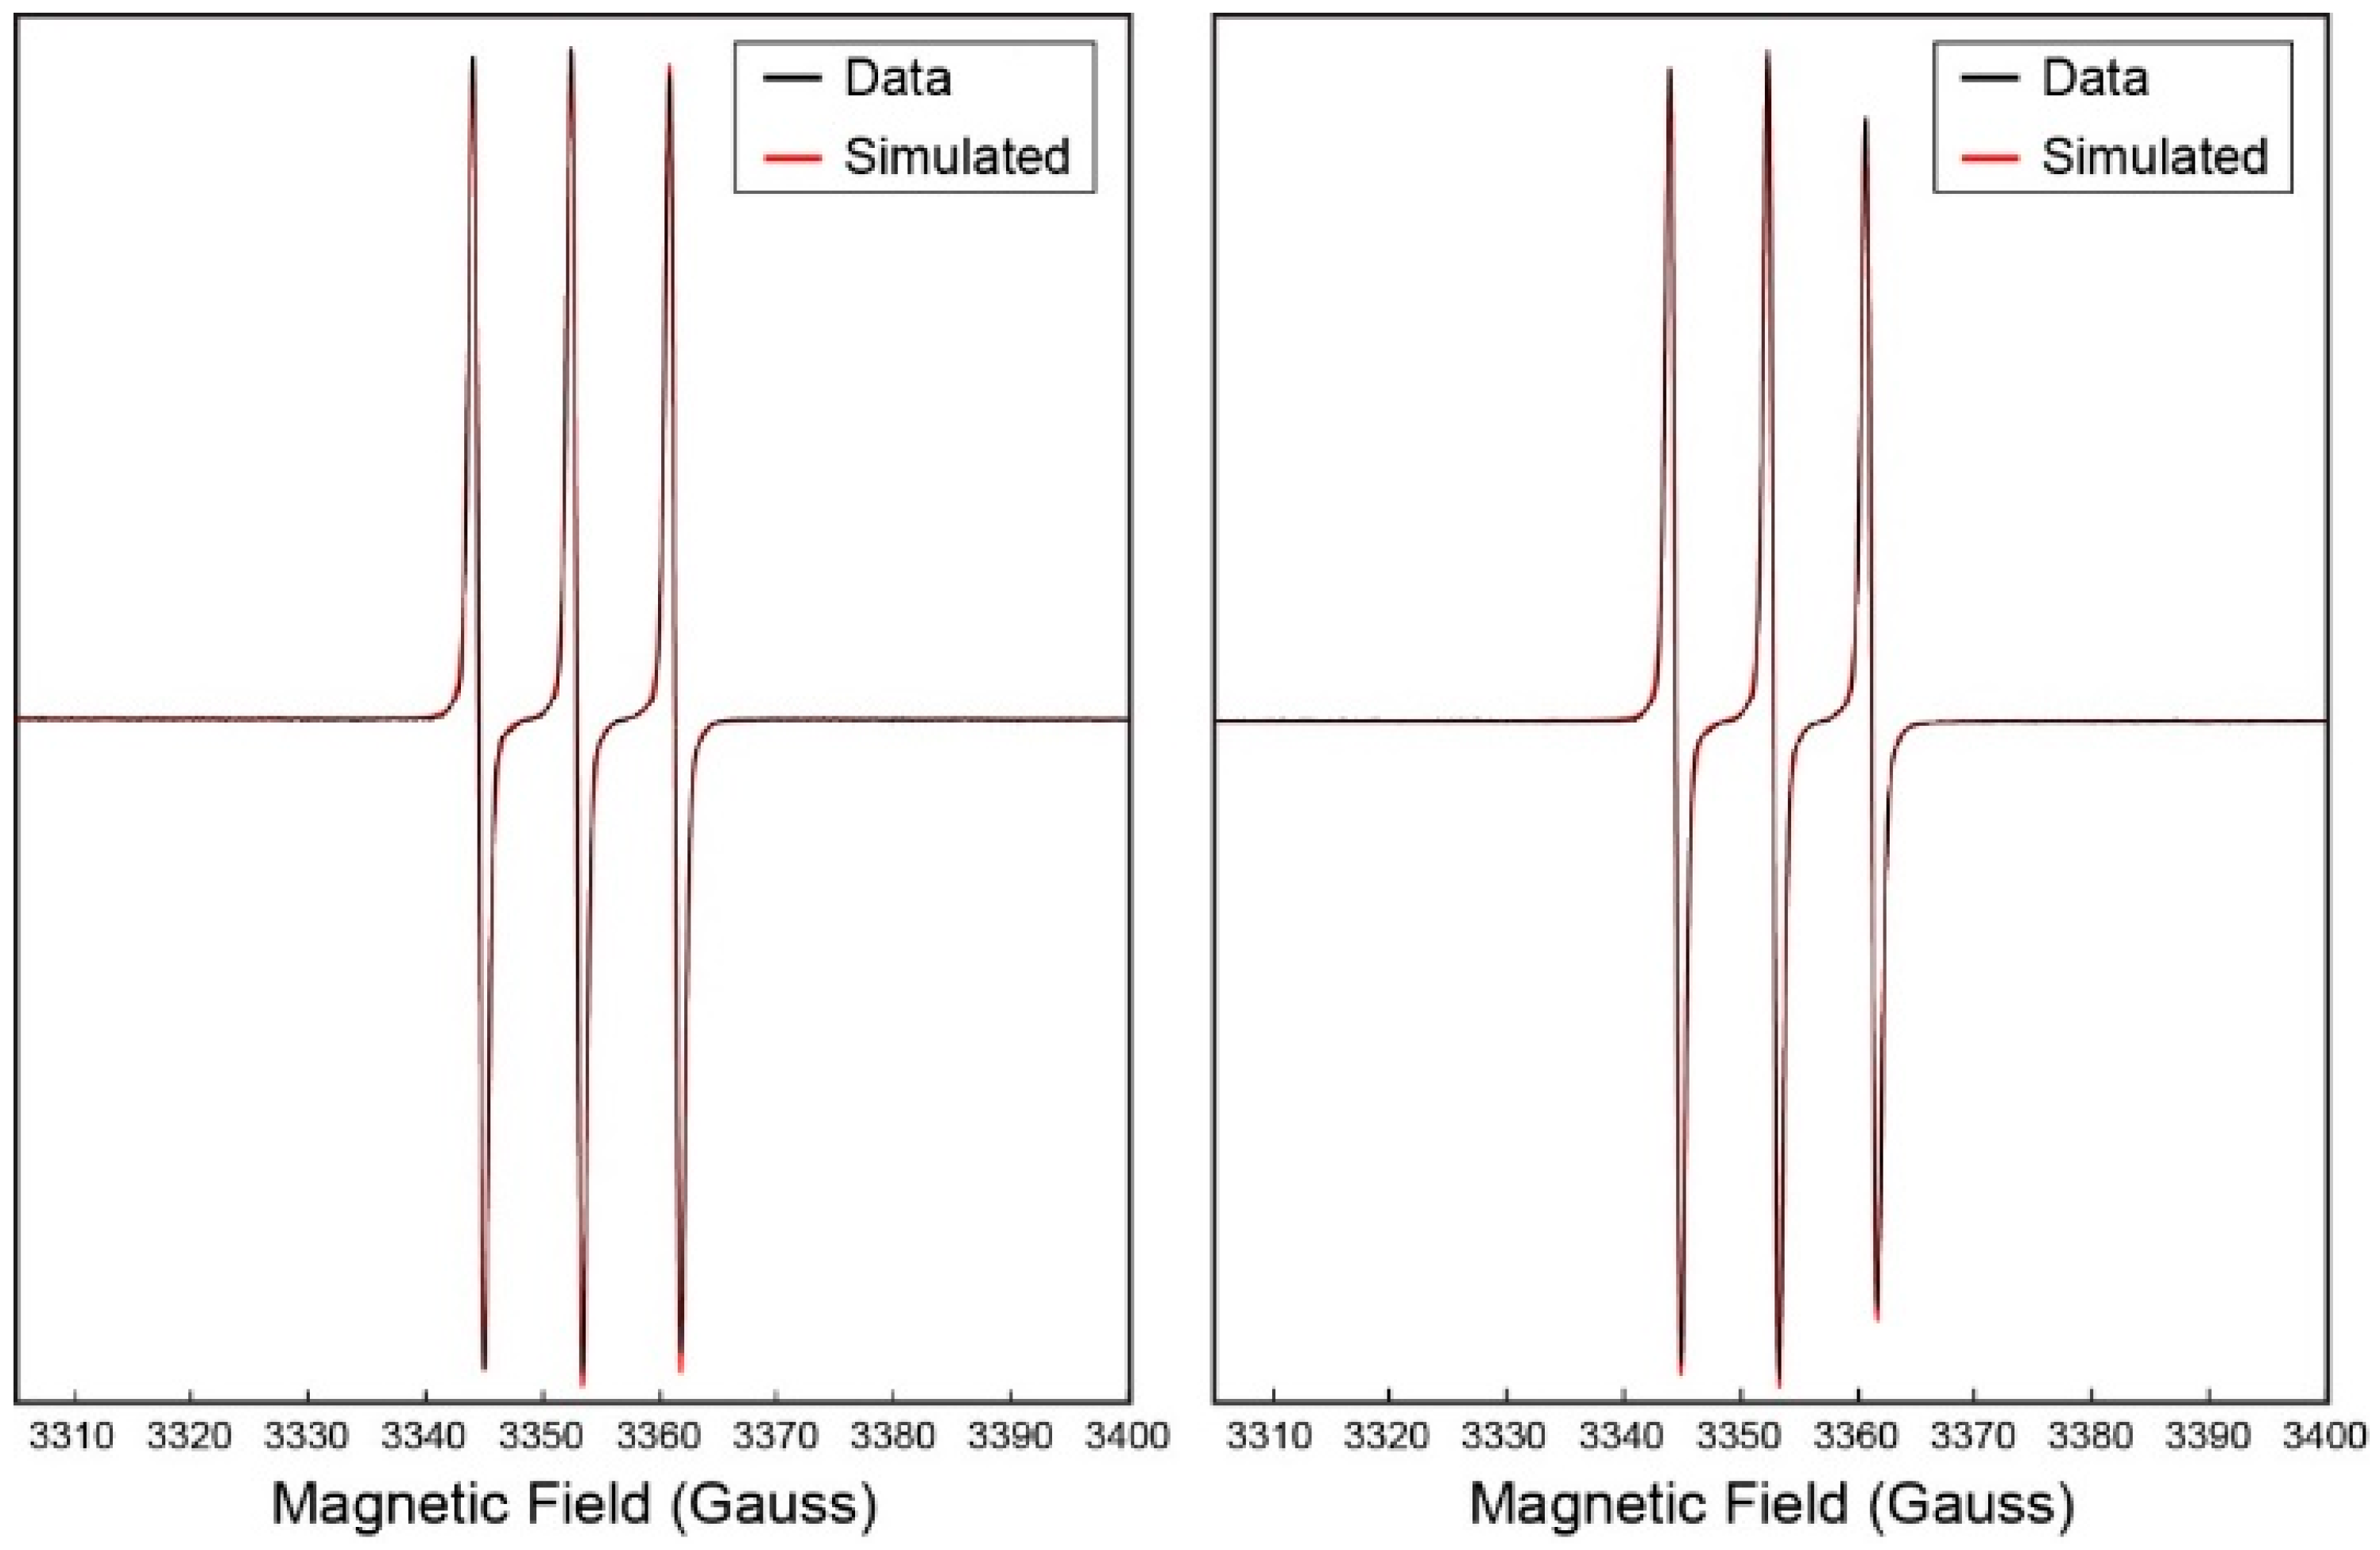
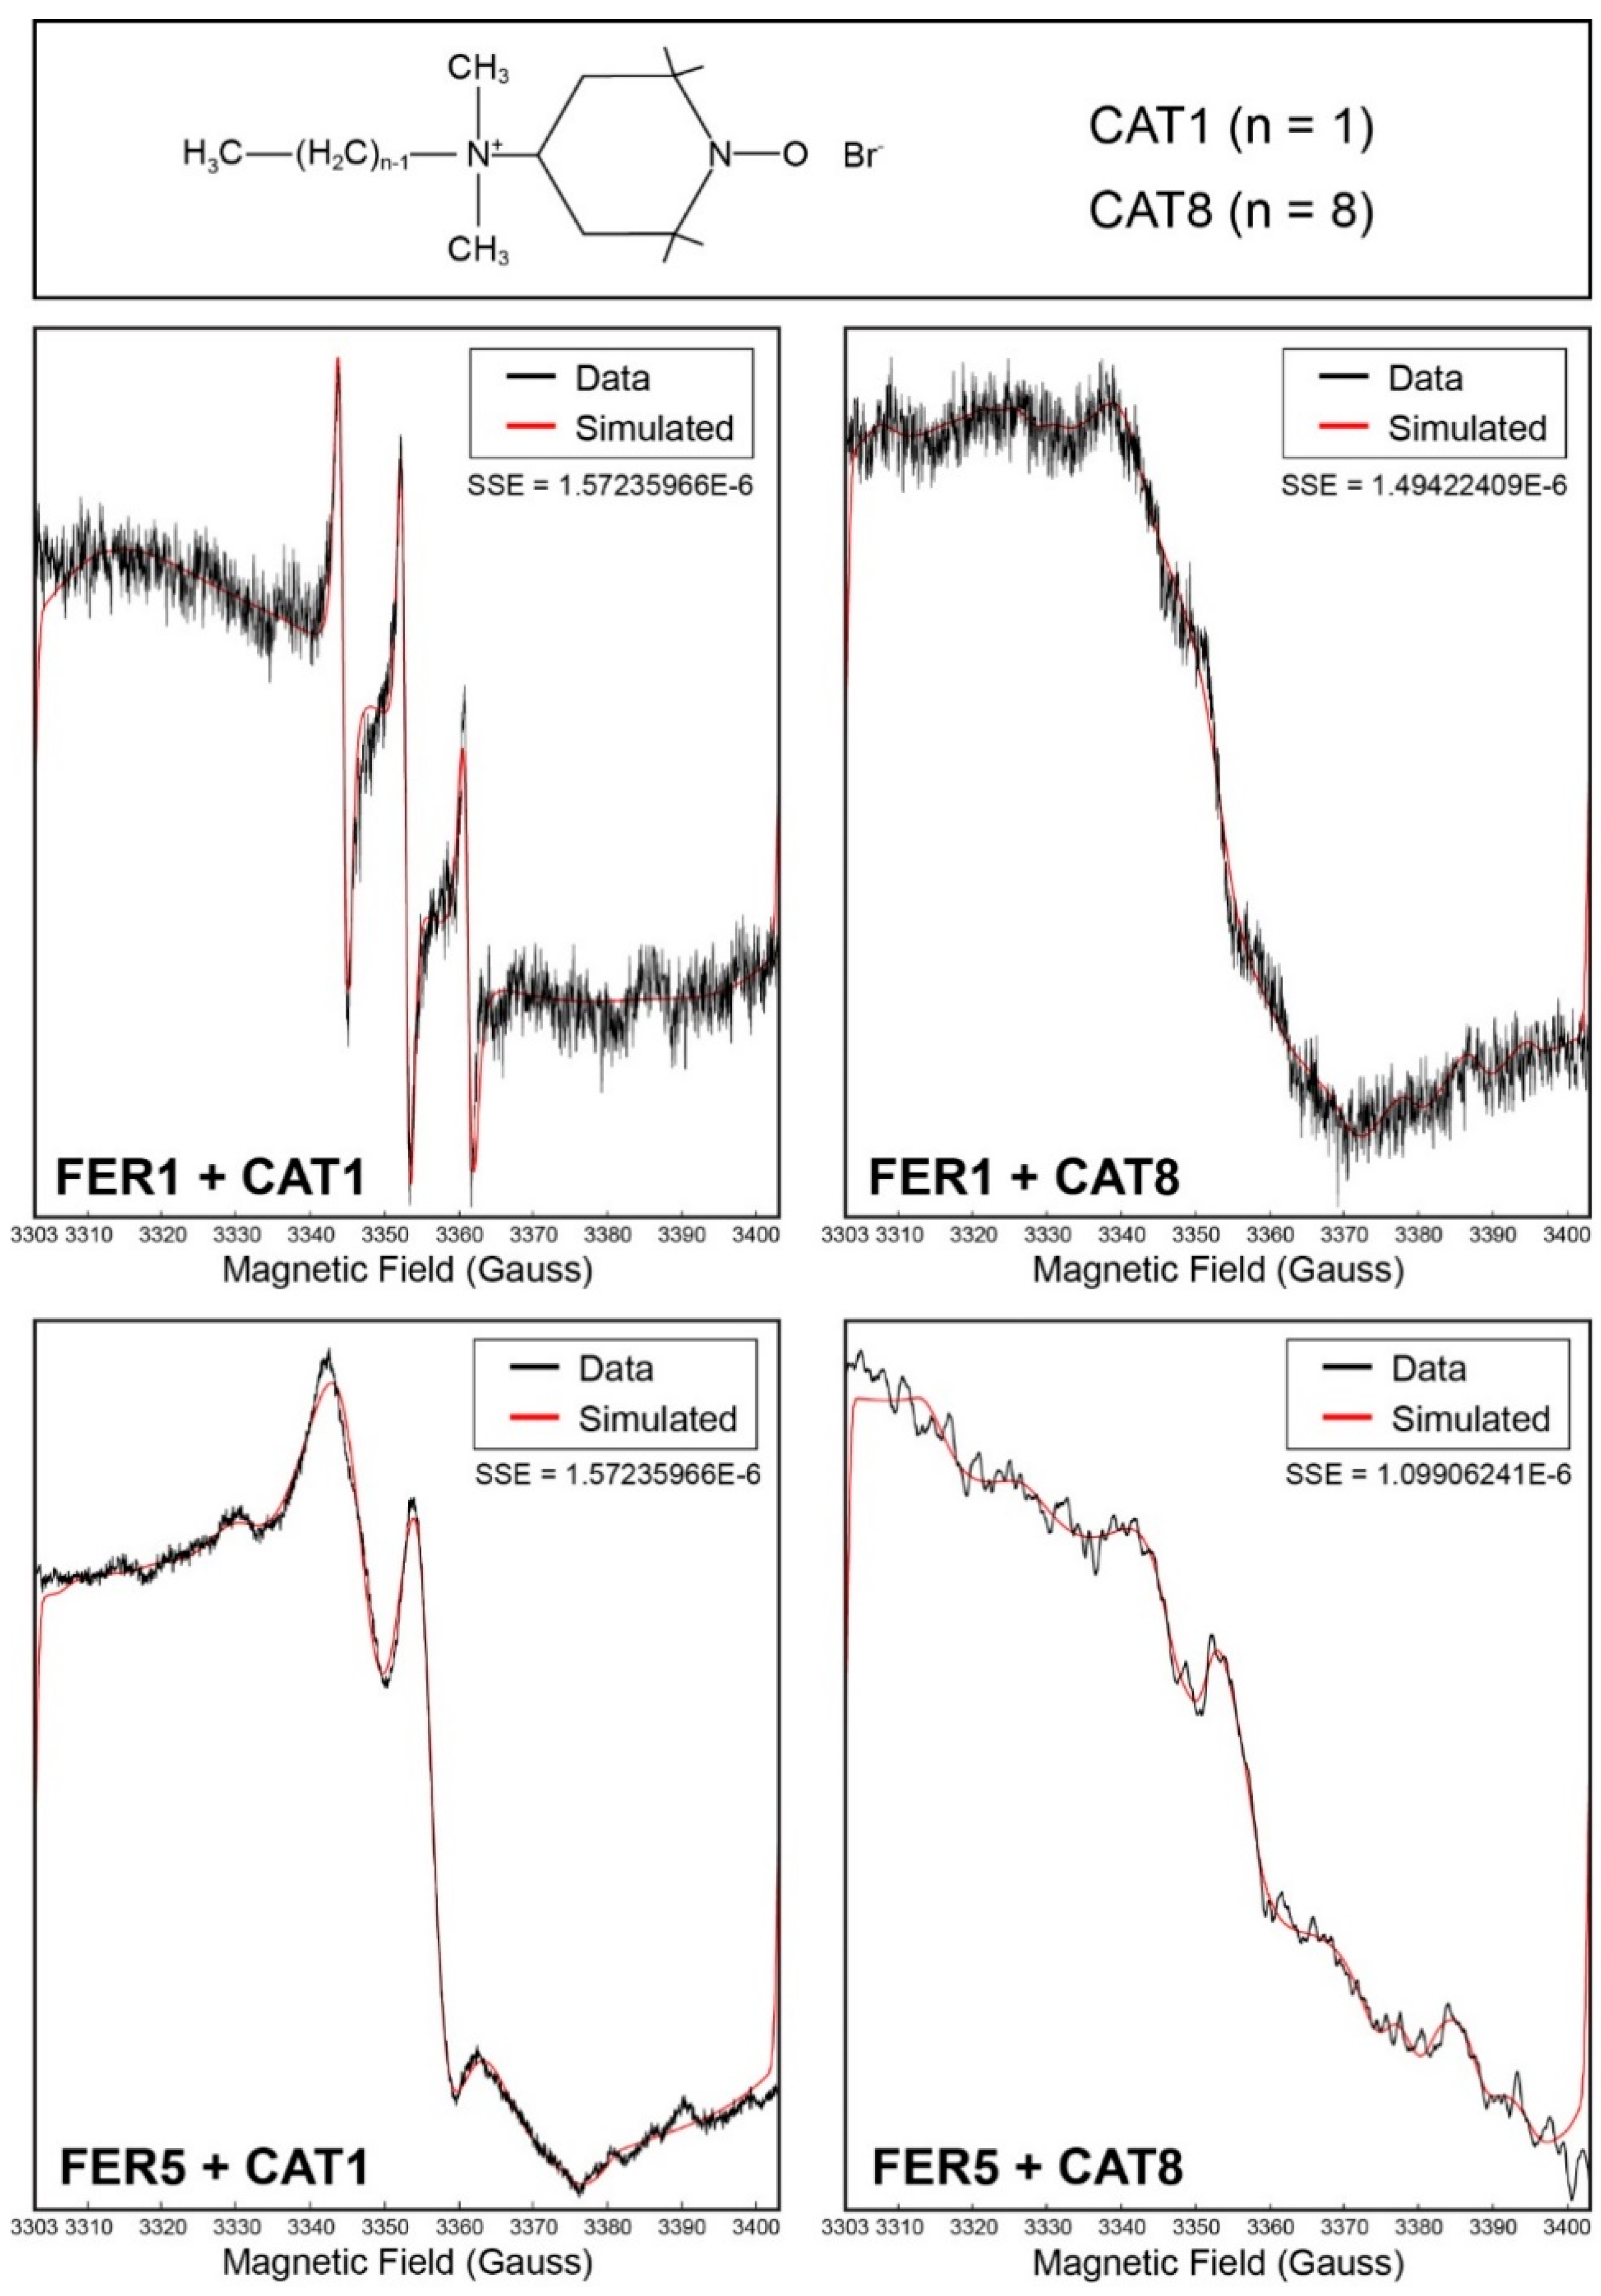
Miscellaneous data of the refinements are listed in Table 4, and relevant structural data in Table 5 and Table 6. As an example, Rietveld plots of sample FER5 are shown in Figure 2. CIF file of FER5 was deposited and is available for download at the journal’s site.
The <T-O> bond distances refined in the 1.601–1.642 Å range suggest the occurrence of some degree of Si,Al ordering. Individual T-O bond distances are slightly spread compared to recent single-crystal refinements [22]. This behavior is justified by the absence of restraints on bond distances. However, it is worth noting that the observed short T3-O4 bond distance (1.564(5) Å) is close to the value of 1.567(13) Å reported by Vaughan [46]. The unit cell volume of FER1 is greater than that of FER5 in agreement with its higher Al content, determined from SEM-EDX. Similar to mordenite, the estimated Al content from the Jones equation [72] (Table 6) is lower than that arising from microchemical data. It has been shown that this equation, as well as other more sophisticated algorithms [78,79], significantly underestimates the Al content because of the shortening of T-O bond distances caused by the apparent symmetry being higher than the true one [78,79]. This behavior is confirmed by the calculated Rcal = Si/(Si + Al) of the sample analyzed by Giacobbe et al. [22], which is 0.921 as compared to 0.809 from the chemical and present data. In fact, Rcal of FER5 was of 39, a value significantly higher than 0.828 from SEM-EDX analyses, which fits into the range reported from the chemical analyses of natural ferrierites (R = 0.78–0.88 [53]).
Aluminum shows the following site-specific occupation preference: T1 > T2 > T3 > T4 sequence (Table 6) in agreement with reference data that show, in some cases, inversion between T2 and T1 [22,49,71]. The extra-framework cations/H2O molecules distribution is similar to that reported by Arletti et al. [71]. The extra-framework site Mg1 forms a distorted octahedral Mg(H2O)62+ complex characterized by two mutually excluding statistically disordered orientations rotated by ca. 40° each other. The site occupancies of the three bonded W sites support the occurrence of this kind of disorder (W1, W2, W3 refined site occupancies: 0.948(7), 0.539(6), 0.543(7), ideal: 1, 0.5, 0.5, respectively). Refined Mg1 site occupancy leads to a value smaller than one, suggesting the occurrence of vacancies.
However, this hypothesis is not supported by microchemical data. An alternate possibility is represented by an apparent transfer of electron density from the Mg1 site to the bonded W sites (W2 and W3 in particular) caused by the adoption of fully ionized O-2 scattering curves to model the H2O sites and/or correlations between site occupancy and displacement parameters. The hypothesis of an electron density transfer seems confirmed by the total refined extra-framework cation s.s. being of 40.1(4) e-, which is smaller than 50.6 e-, determined from SEM-EDX (Table 2). It is worth noting that the same misfit may be observed between the structural result of Giacobbe et al. [22] and the chemical data reported by Gualtieri et al. [20] for the same sample of fibrous ferrierite from British Columbia (Canada). The K1 site is located within the 10-member channel (Figure 3) and is characterized by partial occupancy. The W4, W5, and W6 are all at bonding distances from K1. Hypothesizing the absence of any H2O/cation disorder, owing to mutually excluding short W–W contacts, K1 has favorable eight-fold coordination to four oxygen atoms of the framework (O8) and to four H2O molecules lying at 2 × W5 and 2 × W4 or 2 × W5 and 2 × W6 (Figure 4). The two configurations are characterized by different < VIIIK1-O > (2.813 and 2.966 Å, respectively), possibly correlated to the occurrence of specific cationic species at the K1 site. Finally, the derived H2O content is in excellent agreement with that arising from TGA (Table 2).

3.4. EPR Analysis

The cationic spin probes CAT1, as reported in previous studies [11,14,20], well interact with the surface of the zeolite, whose potential is negative due to the presence of the Si-O- and Al-O- charged sites and the Si-OH polar groups, while CAT8 can monitor the presence of low polarity sites (mainly Si-O-Si and Si-O-Al sites). Some parameters of the EPR spectra of the reference systems are shown in Table 7 and are computed with the Multicomponent program [80], hereafter referred to as “Bn”. Figure 5 shows the experimental (black line) and simulated (red line) spectra of the non-interacting solutions (stock solutions) of CAT1 and CAT8 probes.
By evaluating the variation in adsorption intensity between the Bn and supernatant spectra, it is possible to calculate the amount of probe adsorbed on the surface of the zeolite under examination. This value, expressed as a percentage and reported in the histogram of Figure 6, indicates the level of affinity between the probe and the solid surface. The percentage of the adsorbed probe, calculated considering the decrease in intensity of the double integration between the spectrum of the non-adsorbed solution (Bn) concerning the supernatant, is very high for both probes, suggesting the possibility that ferrierite offers anchoring sites with both hydrophilic and hydrophobic nature.
Figure 7 shows the experimental (black line) and simulated (red line) spectra of the fibrous materials after the adsorption of the CAT1 and CAT8 probes. The obtained parameters (the percentages of the spectral components, the polarity parameter Az, the interaction parameter τ, and the spin–spin interaction parameter W as the line width) [80] are listed in Table 8, with the percentages of the adsorbed probes. The parameters of both the slow motion (interacting) component and the fast motion component where the probe is not affected by the molecular environment are according to Qin and Warncke [81], while the sum of the squares due to the error, SSE, is from Mohr et al. [82].
All EPR spectra have broadbands due to strong spin–spin interactions and impurities; the spectra were simulated considering the line broadening induced by the presence of impurities in the solids and carrying out appropriate subtractions to extrapolate the real parameters of the zeolite-probe interaction. The mobility of two probes was studied in each zeolite, calculating the correlation time (τc) for CAT1 (hydrophilic probe) and CAT8 (surfactant probe).
Figure 7 shows the changes in these parameters in the different samples. The probe had very rapid motion in an aqueous solution (τc 0.029–0.048 ns), and the spectrum had a classical profile of fast-moving nitroxide radicals with three peaks (Figure 5). When this probe was adsorbed on solids, its mobility changed, and the spectrum showed a different line shape due to a more viscous environment. The spectra are characterized by the overlapping of two components attributable to high mobility and a slower system, respectively. The value of τc compared to the reference solution (Bn) of the fast component is explained by adsorption on the hydrophilic zeolite. This adsorption involves hydrogen bonds between groups of silanols and water molecules. These bonds, less energizing than chemical bonds, have left specific mobility to the aqueous phase [83]. In fact, τc can be linked to viscosity with the Stokes–Einstein equation [84,85]:
τc = (4πr3h)/3kT
where r is the radius of the probe, h is the viscosity, k is Boltzmann’s constant, and T is the absolute temperature. Since k, T, and r were constant, τc changes could only be related to the viscosity of the medium, which is different according to the molecular surroundings. As a result, for the CAT1 hydrophilic probe, some motion remained in the particles even when the environment became less polar (decreased Az) and when the liquid turned into a solid material by adding zeolite (interacting component).
The CAT8 probe also had very rapid movement in solution, and the spectrum featured a classic profile of fast-moving nitroxide radicals (Figure 5). After introducing the solid, the spectrum was modified into a slow motion shape [86]. This mobility reduction could be justified by micro-viscosity, which also became higher due to the hydrocarbon tail of CAT8. This result could be due to weak bonds, such as hydrophobic bonds between non-polar molecules, which tend to interact with themselves rather than with the aqueous phase [87].
In the FER1 sample, about 91% of the CAT1 probe was adsorbed by the solid. For the probe adsorbed in the solid, 48.8% have a fast component, with a low correlation time, narrow linewidth, and high polarity, probably attributable to the probe trapped in micro-pools of water inserted in the crystal interstices. The isotropic nitrogen hyperfine coupling measured for the mobile species CAT1 matches the value found in water [88,89]. This is not surprising as water is present in zeolite pores. Thus, the mobile radicals in the pores are in an aqueous environment. Hence, the microdomains with lower viscosity and greater rotational freedom also have stronger polar adsorption sites associated with them. The part of the probe that interacted has high correlation times, indicating a slowdown in motion due to hydrophilic interactions with the silanol and aluminate sites.
FER5 sample shows slightly less adsorption of the probe solution in the solid (about 88%), but it is evident a low percentage of the fast component at the expense of a high percentage of slower motion component and lower polarity highlight a high interaction by adsorption at the surface level, more significant than FER1. The central line broadens and becomes dominant. This broad signal is assigned to aggregations of interacting radicals (the aggregated fraction).
For both samples (FER1 and FER5), the CAT8 probe was shown to have similar interactions. The hydrocarbon chain of CAT8 promotes a hydrophobic interaction with the apolar Si-O-Si groups that causes a decrease in mobility with an increase in the correlation time and an increase in polarity with an increase in the Az parameter. However, the radical group (R2N-O) and the zeolitic surface have opposite charges to induce electrostatic interactions, whose energy is notoriously higher than the energy linked to hydrophobic interactions. Since the surface potential is negative, the probe molecules approach the mineral surface with their positively charged alkyl-amine group (R4N+). When the radical is located near the surface, the hydrophobic chain can partially interact with the surface apolar sites or with the nearby chains, inducing spin–spin interactions and broadening the spectral line (W). The increase in polarity is due to the hydrophilic interactions with the Si-O- sites and can cause a slight shift of the carbon chain in areas with less polarity, crushing charged heads towards the surface of the solid. In fact, a low percentage of the probe is in the supernatant solution, so most of the probe was adsorbed in the solid. The adsorbed probe has a high correlation time. Therefore, slow motion and high polarity indicate a preferential interaction of the hydrocarbon chains with themselves and polar adsorption in surface sites. The broadline suggests that these interactions are also characterized by nearby sites that favor spin–spin interactions between adjacent probes.

4. Discussion

Among the main mechanisms by which an inhaled durable, fibrous mineral particle can induce pathologies for human health are (a) morphological and morphometric features (diameter, length, and aspect ratio); (b) chemical–mineralogical features (fiber type, crystal structure, chemical composition, and surface reactivity); (c) the ability to generate reactive oxygen species (ROS); and (d) the biopersistence. Moreover, these elements are often deeply interconnected with each other, and only a detailed knowledge of all of them allows us to correctly evaluate the potential toxicity of a fibrous particle.
Regarding morphological and morphometric features, the fiber length seems to be the key control factor of macrophage phagocytosis, while the ability of fibers to reach the lower respiratory tract is more dependent on fiber diameter [90,91]. According to the WHO [92], an elongated particle is considered “inhalable” for humans when it has a diameter-length ratio > 1:3, a length > 5 µm, and a diameter < 3 µm. The investigated ferrierite occurs as flattened and very elongated prismatic crystals to highly fibrous habits with very low flexibility. Morphometric measurements reveal a wide range of length (8–120 μm, averages 24.5–21.5 μm) and diameter (0.1–12 μm, averages 0.85–0.9 μm) values. It is important to note that about half of the measured fiber is less than 20 μm in length, and more than 88% (FER1) and 91% (FER5) of the fibers show a width < 3 μm. It follows that FER1 and FER5 samples contain notable amounts of breathable (regulated) fibers according to the WHO [92] counting criteria. Moreover, applying the equation of Gonda and Abd El Khalik [63] to representative ferrierite fibers from the studied samples, we obtained Dae values of 2.59 μm and 2.42 μm for FER1 and FER5, respectively. If we consider that particles with Dae ~ 2–3 μm and <0.2 μm can easily settle in the alveolar space [93], it can be assumed that a significant fraction of ferrierite fibers can penetrate through the respiratory tract and easily reach the alveolar space. Since macrophage’s diameter is in the range of ~10 to 20 μm [31], they cannot wholly engulf the significant fraction of long ferrierite fibers (average length >20 μm), leading to possible incomplete (frustrated) phagocytosis. The consequent activation of the respiratory burst and production of ROS and cytokines is responsible for adverse effects at different cellular levels [5,7,9,94].
Chemical and structural mineralogical features are also of crucial importance in assessing the pathological effects of the mineral fibers, being related to their durability in the human body. The two investigated samples have similar chemical compositions and may be classified as Mg-rich ferrierites. R ranges from 0.81 (FER1) to 0.83 (FER5), the prevailing extra-framework cations are in the Mg > (Ca ≈ K) relationship, and Na content is relatively low (0.30–0.36 apfu). The <T-O> bond distances refined in the 1.601–1.642 Å range suggest the occurrence of some degree of Si,Al ordering, with Al showing a site-specific occupation preference T1 > T2 > T3 > T4, in substantial agreement with literature data [20,22,49,71]. It is well known that the acidity of the zeolite species (considering acid zeolites those with Si/Al ratio >3) influences its bio-persistence in vivo and, consequently, its toxicity. The biopersistence is defined as the ability of fiber (or a particle) to persist in the human body after physicochemical processes, such as dissolution, leaching, breaking, and splitting, surviving to physiological clearance [94,95]. The Si/Al framework ratio plays a crucial role in the dissolution mechanism in an acid environment [96], with a dissolution rate that increases with decreasing Si/Al ratio. For example, there is virtually no dissolution in the pure silica particles, having no aluminum in the structure. On the other hand, in the case of zeolites, a significant dissolution via dealumination can result in stoichiometric framework degradation, silicate precipitation, and partial dissolution of the silicate framework, strongly depending on the initial Si/Al ratio [96,97]. Basic zeolites (Si/Al ratio = 1) show complete dissolution followed by silicate precipitation, while zeolites with a Si/Al ratio of 2 dissolve non-stoichiometrically as the selective removal of aluminum results in partially dissolved silicate particles followed by silicate precipitation. On the contrary, acid zeolites have insufficient aluminum to weaken the structure and show little to null dissolution in an acid environment. The two fibrous ferrierites investigated in this study have very high Si/Al ratios (FER1 4.2 and FER5 4.8), confirming that ferrierite should be considered one of the more bio-durable fibrous zeolites. These values are even more significant than that of erionite (Si/Al ~3.5), whose carcinogenicity has long been established, and are comparable with those of mordenite, for which there is already considerable evidence of potential toxicity [23,24].
The EPR study performed with the CAT1 and CAT8 probes, interacting with the surface groups of the solids, allowed us to evaluate their characteristics and distribution on the fibers. The parameters, such as polarity (Azz), mobility (τc), and values of the row shape discussed reflect the behavior of fast-moving radicals in a polar medium. The signal of the “fast” probe (fast component) remains for CAT1 as a fixed component of the spectra of the adsorbed radicals (interacting component). This indicates that micro-pools of solution remain trapped in the zeolitic porous structure, demonstrating that the absence of solution is only apparent and relative only to the outer surface of the solids. Based on the analyzed spectra and the calculated parameters, the mobility of free radicals decreases in the micro-pools stuck in the porous structure of the zeolites compared to the non-adsorbed solution (Bn) since the rheological properties (viscosity and elasticity) of the solution on the surface of the fibers are influenced by the surface potential. Both the spectral parameters and the percentage relative to the free component (evaluated by the Multicomponent parameter calculation program) vary depending on the different used probes and the various zeolites. Together with the percentage values of adsorption, shown in the histogram in Figure 6, these parameters provide additional information.
FER1 preferentially interacts with CAT8, with polar and non-polar cooperative interactions. The percentage of interaction detected is low for this sample interacting with the CAT1 probe. A high percentage of fast components is present because the solution remains trapped in the porosity and cavity of the fibers, and the probes mildly interact with the surface. For both ferrierite samples, the CAT8 probe parameters show high adsorption. This indicates that the radical chain plays a crucial role in interacting with the surfaces of the fibers, which contain polar sites, and the probe chains are affected by spin–spin interactions. Both CAT1 and CAT8 remain trapped in the porosity of the solid, interacting with relatively close surface sites. In particular, the sites interacting with CAT8 show that the probe remains trapped more efficiently in a porous environment, with the consequent self-aggregation effect.
Observing the behavior of the two ferrierite samples with the same probe (CAT1), we can say that FER5 shows a more significant interaction than FER1. If we consider that the two samples have the same mineralogical characteristics (e.g., morphology, chemical composition, crystal structure), the different interactions with the CAT1 probe are probably due to the presence of Fe-rich phyllosilicate particles on the crystal surfaces of FER1 that could induce a different surface area or a different surface potential. Most of the CAT1 probe that is adsorbed strongly interacts with the surface. The local concentration of spin in the samples is very high due to the strong interactions and signals with high τc value and spectral line width.
The studied ferrierite samples showed that the adsorption percentages of the probes with respect to the stock solution are high. In the case of FER1, the interaction component towards the CAT1 probe is lower than FER5, but the fast component is greater due to the possible entrapment of micro-pools of water. FER1 sample, with higher W values in the interacting component than FER5, suggests that there are nearby interaction sites leading to spin–spin interactions between neighboring probes.
The adsorption and spin interaction of the investigated ferrierite samples has been compared with other natural fibrous zeolites such as erionite, offretite, thomsonite, mesolite, scolecite, ferrierite, and additional ferrierite samples (Figure 8). The percentage of adsorbed probes by the ferrierite samples is the highest among all the zeolites analyzed (Figure 8a). This value is high for CAT1 (~91% and ~88%) and very high for CAT8 (~97% and 91%) for FER1 and FER5 samples, respectively. These percentages are well comparable with that measured for another ferrierite sample (LN, ~85% and ~87–95%), while they are considerably high concerning those of the other fibrous zeolites using CAT1 (50–54% erionite, 43.5% offretite, 18% thomsonite, 10% mesolite, 1.5% scolecite) and CAT8 (85–99% erionite, 96% offretite, 65% thomsonite, 60% mesolite, 0.5% scolecite). Ferrierite and erionite fibers show comparable interaction strengths regarding the polar sites. Still, the less polar sites (Si–O–Si) are better distributed at the ferrierite surface than the erionite one, as evidenced by previous studies [14,20].
Although the adsorption percentages suggest a greater predisposition of some zeolites than others to trap the radical probes, the parameter linked to the interacting component must also be considered (Figure 8b), which can be attributable to a greater interaction strength. Therefore, the complexity of evaluating the EPR parameters can be dissected by differentiating the potential of zeolites to adsorb radical species. Concerning CAT1, it can be highlighted that ferrierite followed by erionite, offretite, thomsonite, mesolite, and scolecite. Differently, CAT8 shows the highest adsorption on fibrous erionite is the zeolite that adsorbs the highest amount of CAT8, followed by ferrierite, offretite, prismatic erionite, thomsonite, mesolite, and scolecite. On the other hand, if we observe the percentage of interacting components, the scenario that appears is significantly different (Figure 8b). Thomsonite and mesolite are the zeolites that shows the highest adsorption of CAT1, followed by ferrierite and offretite, while erionite is the less interacting. Regarding CAT8, this probe interacts in a considerable amount with all the investigated zeolites, even if the interaction values are slightly lower for the erionite samples. However, in this case, the hydrocarbon tails of the probe lead to other interactions which must be considered in the parametric evaluation. If we consider fibrous erionite as a positive carcinogenic standard, the fibrous ferrierite shows significantly higher adsorption capacity and interaction strength, suggesting that the toxicity of this zeolite could be potentially high.
The surface reactivity of a mineral fiber is also conditioned by the presence of iron in the fiber surfaces [7,98,99,100,101,102,103]. Iron favors the formation of the reactive oxygen species (ROS), with cyto- and genotoxic effects through a Fenton-like chain reaction [7,99,100,101,102,103]. Regarding the investigated ferrierite samples, iron has been detected in FER1 and interpreted as iron-rich particles or nanoparticles coating the crystal surface. Of course, this hypothesis should be confirmed by more specific investigations (e.g., TEM, AFM), but in any case, the presence of iron could contribute to increasing the potential toxicity of ferrierite fibers [99,100,101,102,103].

5. Conclusions

A multidisciplinary approach based on morphometric observations, mineralogical characterization, and a chemical analysis of fibrous zeolites, coupled with reactivity investigations using spin probes, provided the following conclusions.
The two investigated samples (FER1 and FER5) contain abundant ferrierite crystals with prismatic to highly fibrous habits and very low flexibility. Morphometric data point out the presence of notably amounts of breathable fibers (average length 24.5–21.5 μm, average diameter 0.85–0.9 µm), with a significant fraction of fibers able to penetrate through the respiratory tract and easily reach the alveolar space (Dae values 2.59 μm and 2.42 μm).
Crystals from the two samples have similar chemical composition: they are Mg-rich ferrierites, R is from 0.81 to 0.83, the prevailing extra-framework cations are in the Mg > (Ca ≈ K) relationship and the Si/Al ratio (4.2–4.8) is higher than that of other fibrous zeolites. The <T-O> bond distances refined in the 1.601–1.642 Å range suggest the occurrence of some degree of Si,Al ordering, with Al showing a site-specific occupation preference T1 > T2 > T3 > T4.
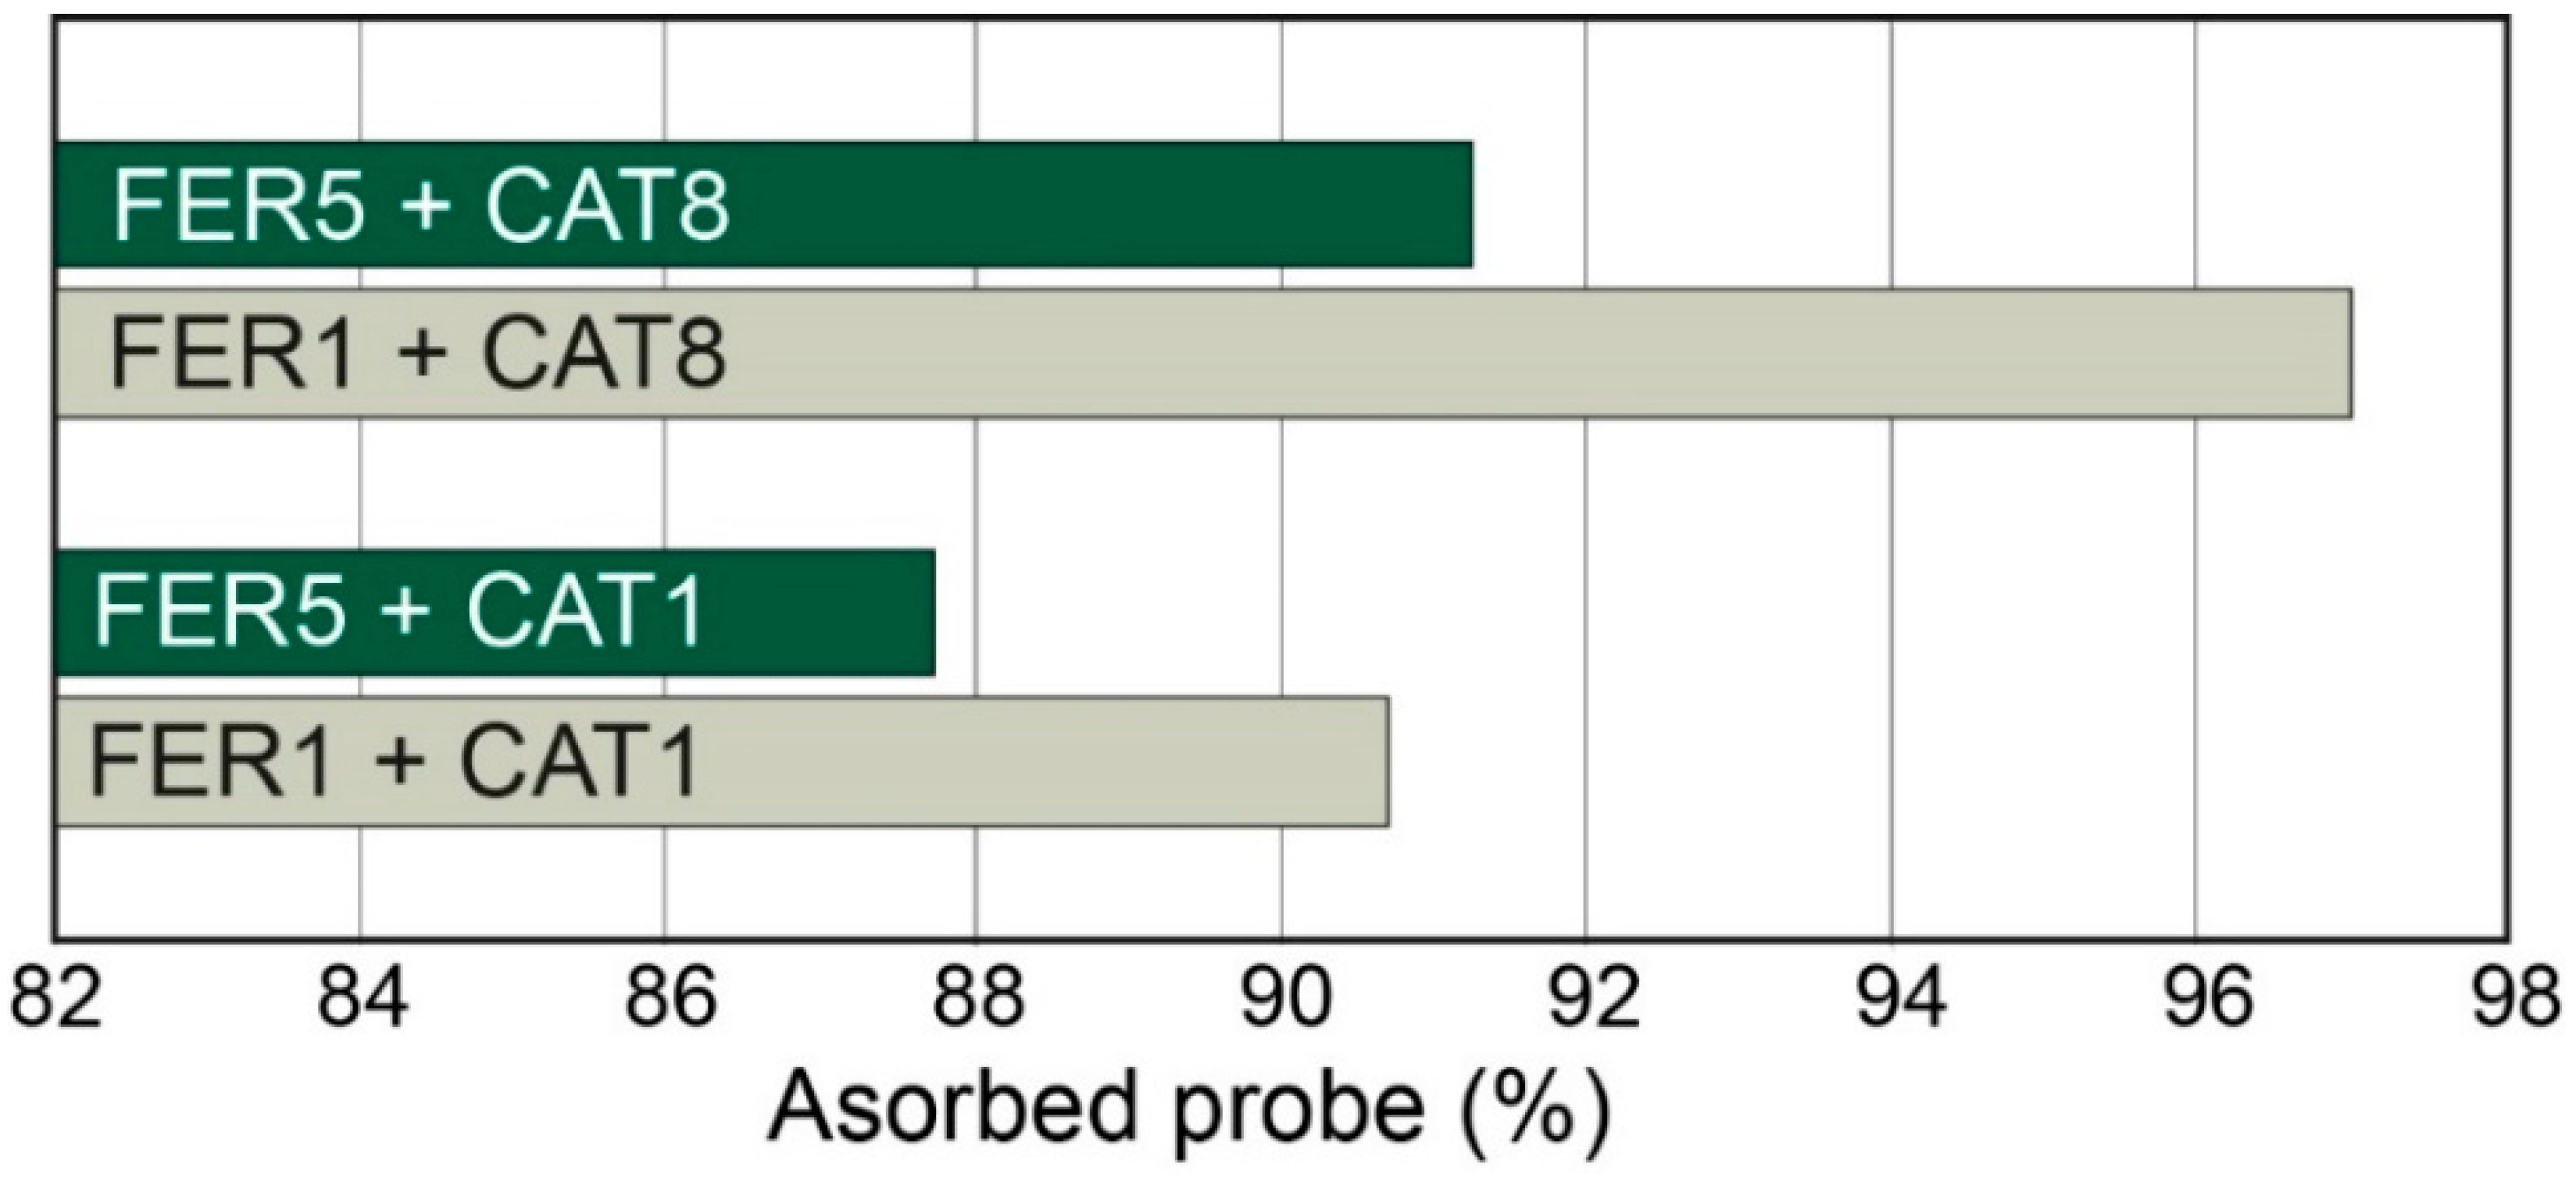
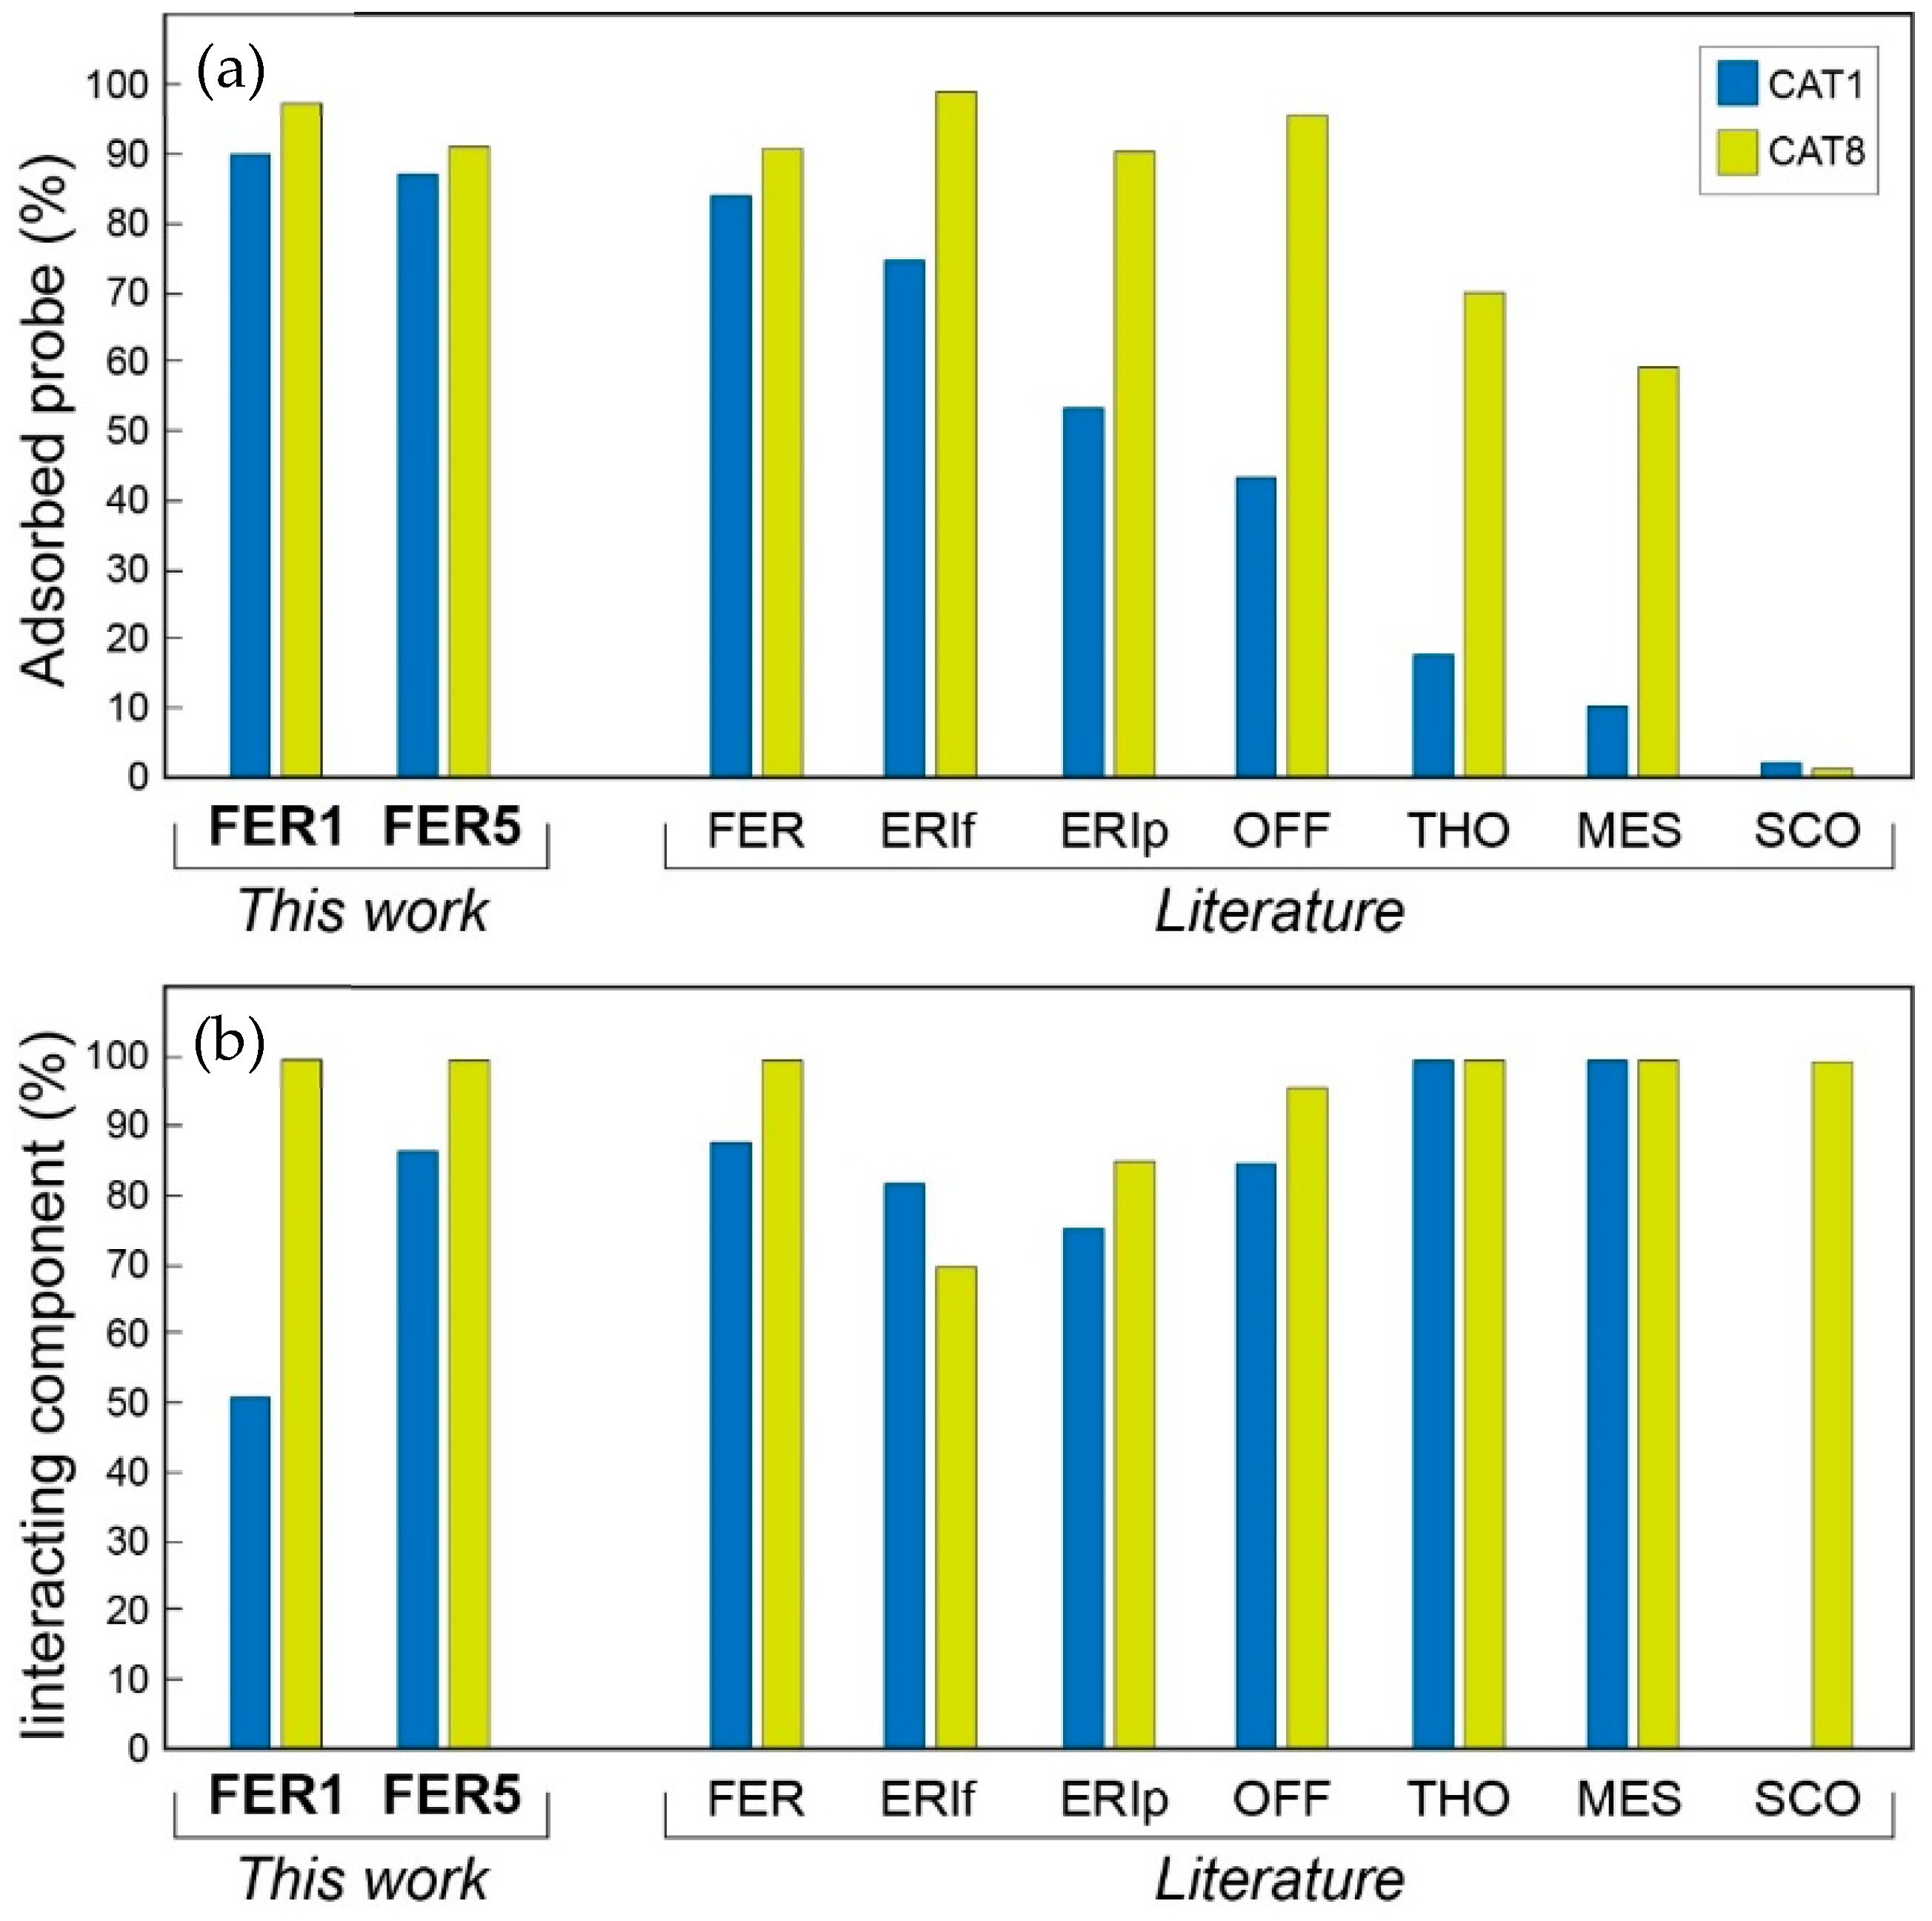
Ferrierite samples show high amounts of adsorbed CAT1 and CAT8 probes. FER1 and FER5 preferentially interact with CAT8, with polar and non-polar (spin–spin) cooperative interactions. In FER1, the percentage of fast components shows that the solution remains trapped in the porosity and cavity of the fibers, and the probes mildly interact with the surface. FER1 has an interaction component towards the CAT1 probe lower than FER5, but the fast component is greater. The adsorption rates of probes in solid samples and the amount of interacting components suggest the high abilities of both zeolites to adsorb and interact with related chemicals.
The set of data collected (morphometry, crystal chemistry, surface properties, and interacting abilities) confirms that fibrous ferrierite shows morphological, mineralogical, and physical–chemical characteristics consistent with a potential health hazard, and a precautionary approach should be applied when this material is handled. Of course, for a definitive and complete understanding of the potential toxicity of fibrous ferrierite, future in vitro and in vivo toxicity tests should be performed and compared to the outcomes of this work, and epidemiological evidence is necessary for an adequate assessment of the environmental hazard.

Supplementary Materials

The following supporting information can be downloaded at: https://0-www-mdpi-com.brum.beds.ac.uk/article/10.3390/min12050626/s1, .cif data.

Author Contributions

M.M.; supervision, conceptualization, investigation, data curation, writing—original draft preparation, writing—review and editing, funding acquisition. P.B., A.P. and M.C.; formal analysis, investigation, data curation, writing—review and editing. F.D.L., L.V., M.A.M. and C.R.; data curation and writing—review and editing. I.F.; formal analysis. M.G.; conceptualization, data curation, writing—review and editing. All authors have read and agreed to the published version of the manuscript.

Funding

This research was conducted under the project “Fibers a Multidisciplinary Mineralogical, Crystal-Chemical and Biological Project to Amend the Paradigm of Toxicity and Cancerogenicity of Mineral Fibers” (PRIN: PROGETTI DI RICERCA DI RILEVANTE INTERESSE NAZIONALE-Bando, 2017-Prot. 20173X8WA4). This work was also funded under the framework of the 2020 research programs of the Department of Pure and Applied Sciences of the University of Urbino Carlo Bo (project “New asbestiform fibers: mineralogical and physical-chemical characterization”, responsible M. Mattioli) and the INAIL-BRIC ID60 Project (responsible M. Mattioli).

Data Availability Statement

Data are contained within the article. The data presented in this study can be seen in the content above.

Acknowledgments

We warmly thank Elena Macedi for her kind assistance during the TGA-DSC analyses. M.M. is deeply grateful to Sergio Pegoraro for making the ferrierite samples available for this study. We are also thankful to Dodie James for her help in revising the English style.

Conflicts of Interest

The authors declare no conflict of interest. The funders had no role in the design of the study; in the collection, analyses, or interpretation of data; in the writing of the manuscript, or in the decision to publish the results.

References

  1. Gualtieri, A.F. Mineral fibre-based building materials and their health hazards. In Toxicity of Building Materials; Woodhead Publishing: Cambridge, UK, 2012; pp. 166–195. [Google Scholar]
  2. Sisko, A.; Boffetta, P. Occupational Cancers; Springer Nature: London, UK, 2020; p. 640. [Google Scholar]
  3. Berry, T.-A.; Belluso, E.; Vigliaturo, R.; Gieré, R.; Emmett, E.A.; Testa, J.R.; Steinhorn, G.; Wallis, S.L. Asbestos and Other Hazardous Fibrous Minerals: Potential Exposure Pathways and Associated Health Risks. Int. J. Environ. Res. Public Health 2022, 19, 4031. [Google Scholar] [CrossRef]
  4. IARC (International Agency for Research on Cancer). Asbestos (chrysotile, amosite, crocidolite, tremolite, actinolite, and anthophyllite). In IARC Monographs on the Evaluation Carcinogenic Risks to Humans; IARC Publication: Lyon, France, 2012; Volume 100C, pp. 219–309. [Google Scholar]
  5. Carbone, M.; Kanodia, S.; Chao, A.; Miller, A.; Wali, A.; Weissman, D.; Adjei, A.; Baumann, F.; Boffetta, P.; Buck, B.; et al. Consensus Report of the 2015 Weinman International Conference on Mesothelioma. J. Thorac. Oncol. 2016, 11, 1246–1262. [Google Scholar] [CrossRef] [Green Version]
  6. Carbone, M.; Yang, H. Molecular pathways: Targeting mechanisms of asbestos and erionite carcinogenesis in mesothelioma. Clin. Cancer Res. 2012, 18, 598–604. [Google Scholar] [CrossRef] [Green Version]
  7. Gualtieri, A.F. Towards a quantitative model to predict the toxicity/pathogenicity potential of mineral fibers. Toxicol. Appl. Pharmacol. 2018, 361, 89–98. [Google Scholar] [CrossRef]
  8. Gualtieri, A. Bridging the gap between toxicity and carcinogenicity of mineral fibres by connecting the fibre crystal-chemical and physical parameters to the key characteristics of cancer. Curr. Res. Toxicol. 2021, 2, 42–52. [Google Scholar] [CrossRef]
  9. Carbone, M.; Adusumilli, P.S.; Alexander, H.R., Jr.; Baas, P.; Bardelli, F.; Bononi, A.; Bueno, R.; Felley-Bosco, E.; Galateu-Salle, F.; Jablons, D.; et al. Mesothelioma: Scientific clues for prevention, diagnosis, and therapy. CA-Cancer J. Clin. 2019, 69, 402–429. [Google Scholar] [CrossRef] [Green Version]
  10. Middendorf, P.; Zumwalde, R.; Castellan, R.; Harper, M.; Wallace, W.; Stayner, L.; Castranova, V.; Hearl, F.; Sullivan, P.; Wallace, W.; et al. Asbestos Fibers and Other Elongate Mineral Particles: State of the Science and Roadmap for Research; NIOSH Current Intelligence Bulletin 62; National Institute for Occupational Safety and Health (NIOSH): Cincinnati, OH, USA, 2011; p. 174.
  11. Mattioli, M.; Giordani, M.; Dogan, M.; Cangiotti, M.; Avella, G.; Giorgi, R.; Dogan, A.U.; Ottaviani, M.F. Morpho-chemical characterization and surface properties of carcinogenic zeolite fibers. J. Hazard. Mater. 2016, 306, 140–148. [Google Scholar] [CrossRef]
  12. Giordani, M.; Mattioli, M.; Dogan, M.; Dogan, A.U. Potential carcinogenic erionite from Lessini Mounts, NE Italy: Morphological, mineralogical and chemical characterization. J. Toxicol. Environ. Health A 2016, 79, 808–824. [Google Scholar] [CrossRef]
  13. Giordani, M.; Mattioli, M.; Ballirano, P.; Pacella, P.; Cenni, M.; Boscardin, M.; Valentini, L. Geological occurrence, mineralogical characterization and risk assessment of potentially carcinogenic erionite in Italy. J. Toxicol. Environ. Health B 2017, 20, 81–103. [Google Scholar] [CrossRef]
  14. Giordani, M.; Mattioli, M.; Cangiotti, M.; Fattori, A.; Ottaviani, M.F.; Betti, M.; Ballirano, P.; Pacella, A.; Di Giuseppe, D.; Scognamiglio, V.; et al. Characterisation of potentially toxic natural fibrous zeolites by means of electron paramagnetic resonance spectroscopy and morphological-mineralogical studies. Chemosphere 2022, 291, 133067. [Google Scholar] [CrossRef]
  15. Ballirano, P.; Andreozzi, G.B.; Dogan, M.; Dogan, A.U. Crystal structure and iron topochemistry of erionite-K from Rome, Oregon, USA. Am. Mineral. 2009, 94, 1262–1270. [Google Scholar] [CrossRef]
  16. Ballirano, P.; Pacella, A.; Bloise, A.; Giordani, M.; Mattioli, M. Thermal stability of woolly erionite-K and considerations about the heat induced behavior of the erionite group. Minerals 2018, 8, 28. [Google Scholar] [CrossRef] [Green Version]
  17. Ballirano, P.; Cametti, G. Dehydration dynamics and thermal stability of erionite-K: Experimental evidence of the “internal ionic exchange” mechanism. Microporous Mesoporous Mater. 2012, 163, 160–168. [Google Scholar] [CrossRef]
  18. Ballirano, P.; Pacella, A. Erionite-Na upon heating: Dehydration dynamics and exchangeable cations mobility. Sci. Rep. 2016, 6, 22786. [Google Scholar] [CrossRef] [Green Version]
  19. Mattioli, M.; Giordani, M.; Arcangeli, P.; Valentini, L.; Boscardin, M.; Pacella, A.; Ballirano, P. Prismatic to asbestiform offretite from Northern Italy: Occurrence, morphology and crystal-chemistry of a new potentially hazardous zeolite. Minerals 2018, 8, 69. [Google Scholar] [CrossRef] [Green Version]
  20. Gualtieri, A.F.; Gandolfi, N.B.; Passaglia, E.; Pollastri, S.; Mattioli, M.; Giordani, M.; Ottaviani, M.F.; Cangiotti, M.; Bloise, A.; Barca, D.; et al. Is fibrous ferrierite a potential health hazard? Characterization and comparison with fibrous erionite. Am. Mineral. 2018, 103, 1044–1055. [Google Scholar] [CrossRef]
  21. Zoboli, A.; Di Giuseppe, D.; Baraldi, C.; Gamberini, M.C.; Malferrari, D.; Urso, G.; Gualtieri, M.L.; Bailey, M.; Gualtieri, A.F. Characterisation of fibrous ferrierite in the rhyolitic tuffs at Lovelock, Nevada, USA. Mineral. Mag. 2019, 83, 577–586. [Google Scholar] [CrossRef]
  22. Giacobbe, C.; Wright, J.; Dejoie, C.; Tafforeau, P.; Berruyer, C.; Vigliaturo, R.; Gieré, R.; Gualtieri, A.F. Depicting the crystal structure of fibrous ferrierite from British Columbia using a combined synchrotron techniques approach. J. Appl. Crystallogr. 2019, 52, 1397–1408. [Google Scholar] [CrossRef]
  23. Di Giuseppe, D. Characterization of Fibrous Mordenite: A First Step for the Evaluation of Its Potential Toxicity. Crystals 2020, 10, 769. [Google Scholar] [CrossRef]
  24. Giordani, M.; Ballirano, P.; Pacella, A.; Meli, M.A.; Roselli, C.; Di Lorenzo, F.; Fagiolini, I.; Mattioli, M. Fibrous mordenite from Northern Italy: Another potentially hazardous zeolite. Minerals 2022, in press. [Google Scholar]
  25. Cardile, V.; Renis, M.; Scifo, C.; Lombardo, L.; Gulino, R.; Mancari, B.; Panico, A. Behaviour of the new asbestos amphibole fluor-edenite in different lung cell systems. Int. J. Biochem. Cell. Biol. 2004, 36, 849–860. [Google Scholar] [CrossRef]
  26. Andreozzi, G.B.; Ballirano, P.; Gianfagna, A.; Mazziotti-Tagliani, S.; Pacella, A. Structural and spectroscopic characterization of a suite of fibrous amphiboles with high environmental and health relevance from Biancavilla (Sicily, Italy). Am. Mineral. 2009, 94, 1333–1340. [Google Scholar] [CrossRef]
  27. Mazziotti-Tagliani, S.; Andreozzi, G.B.; Bruni, B.M.; Gianfagna, A.; Pacella, A.; Paoletti, L. Quantitative chemistry and compositional variability of fibrous amphiboles from Biancavilla (Sicily, Italy). Period. Mineral. 2009, 78, 65–74. [Google Scholar]
  28. Comba, P.; Gianfagna, A.; Paoletti, L. Pleural mesothelioma cases in Biancavilla are related to a new fluoro-edenite fibrous amphibole. Arch. Environ. Health 2003, 58, 229–232. [Google Scholar] [CrossRef]
  29. Erskine, B.G.; Bailey, M. Characterization of asbestiform glaucophane-winchite in the franciscan complex blueschist, northern diablo range, California. Toxicol. Appl. Pharmacol. 2018, 361, 3–13. [Google Scholar] [CrossRef]
  30. Pacella, A.; Ballirano, P. Chemical and structural characterization of fibrous richterite with high environmental and health relevance from Libby, Montana (USA). Period. Mineral. 2016, 85, 169–177. [Google Scholar] [CrossRef]
  31. Rogers, A.J. Exposures estimates of the Wittenoom mining workforce and town residents–implications associated with risk estimation for persons exposed to asbestiform riebeckite. Toxicol. Appl. Pharmacol. 2018, 361, 168–170. [Google Scholar] [CrossRef]
  32. Sullivan, P.A. Vermiculite, respiratory disease, and asbestos exposure in Libby Montana: Update of a cohort mortality study. Environ. Health Perspect. 2007, 115, 579–585. [Google Scholar] [CrossRef] [Green Version]
  33. Di Giuseppe, D.; Harper, M.; Bailey, M.; Erskine, B.; Della Ventura, G.; Ardith, M.; Pasquali, L.; Tomaino, G.; Ray, R.; Mason, H.; et al. Characterization and assessment of the potential toxicity/pathogenicity of fibrous glaucophane. Environ. Res. 2019, 178, 108723. [Google Scholar] [CrossRef]
  34. Gualtieri, A.F.; Zoboli, A.; Filaferro, M.; Benassi, M.; Scarfì, S.; Mirata, S.; Avallone, R.; Vitale, G.; Bailey, M.; Harper, M.; et al. In vitro toxicity of fibrous glaucophane. Toxicology 2021, 454, 152743. [Google Scholar] [CrossRef]
  35. Petriglieri, J.R.; Laporte-Magoni, C.; Salvioli-Mariani, E.; Tomatis, M.; Gazzano, E.; Turci, F.; Cavallo, A.; Fubini, B. Identification and Preliminary Toxicological Assessment of a Non-Regulated Mineral Fiber: Fibrous Antigorite from New Caledonia. Environ. Eng. Geosci. 2020, 26, 89–97. [Google Scholar] [CrossRef]
  36. Turci, F.; Tomatis, M.; Compagnoni, R.; Fubini, B. Role of Associated Mineral Fibres in Chrysotile Asbestos Health Effects: The Case of Balangeroite. Ann. Occup. Hyg. 2009, 53, 491–497. [Google Scholar]
  37. Giordani, M.; Meli, M.A.; Roselli, C.; Betti, M.; Peruzzi, F.; Taussi, M.; Valentini, L.; Fagiolino, I.; Mattioli, M. Could soluble minerals be hazardous to human health? Evidence from fibrous epsomite. Environ. Res. 2022, 206, 112579. [Google Scholar] [CrossRef]
  38. Carbone, M.; Emri, S.; Dogan, A.U.; Steele, I.; Tuncer, M.; Pass, H.I.; Baris, Y.I. A mesothelioma epidemic in Cappadocia: Scientific developments and unexpected social outcomes. Nat. Rev. Cancer 2007, 7, 147–154. [Google Scholar] [CrossRef]
  39. Dogan, A.U.; Baris, Y.I.; Dogan, M.; Emri, S.; Steele, I.; Elmishad, A.G.; Carbone, M. Genetic predisposition to fiber carcinogenesis causes a mesothelioma epidemic in Turkey. Cancer Res. 2006, 66, 5063–5068. [Google Scholar] [CrossRef] [Green Version]
  40. Metintas, M.; Hillerdal, G.; Metintas, S.; Dumortier, P. Endemic malignant mesothelioma: Exposure to erionite is more important than genetic factors. Arch. Environ. Health 2010, 65, 86–93. [Google Scholar] [CrossRef]
  41. IARC (International Agency for Research on Cancer). Some nanomaterials and some fibres. In IARC Monographs on the Evaluation Carcinogic Risks to Humans; IARC Publication: Lyon, France, 2017; Volume 111, pp. 215–240. [Google Scholar]
  42. IARC (International Agency for Research on Cancer). Silica Some Silic. In IARC Monographs on the Evaluation Carcinogenic Risks to Humans; IARC Publication: Lyon, France, 1997; Volume 42, pp. 225–239. [Google Scholar]
  43. Mattioli, M.; Cenni, M.; Passaglia, E. Secondary mineral assemblages as indicators of multi stage alteration processes in basaltic lava flows: Evidence from the Lessini Mountains, Veneto Volcanic Province, Northern Italy. Period. Mineral. 2016, 85, 1–24. [Google Scholar]
  44. Graham, R.P.D. On ferrierite, a new zeolitic mineral, from British Columbia; with notes on some other Canadian minerals. Trans. R. Soc. Can. 1918, 3, 185–201. [Google Scholar]
  45. Coombs, D.S.; Alberti, A.; Armbruster, T.; Artioli, G.; Colella, C.; Galli, E.; Grice, J.D.; Liebau, F.; Mandarino, J.A.; Minato, H.; et al. Recommended nomenclature for zeolite minerals; report of the Subcommittee on Zeolites of the International Mineralogical Association, Commission on New Minerals and Mineral Names. Can. Mineral. 1997, 35, 1571–1606. [Google Scholar]
  46. Baerlocher, C.; McCusker, L.B.; Olson, D.H. Atlas of Zeolite Framework Types, 5th ed.; Elsevier: London, UK, 2001; p. 398. [Google Scholar]
  47. Gottardi, G.; Galli, E. Natural Zeolites; Springer: Berlin/Heidelberg, Germany, 1985; p. 409. [Google Scholar]
  48. Armbruster, T.; Gunter, M.E. Crystal structures of natural zeolites. In Natural Zeolites: Occurrence, Properties, Applications; Bish, D.L., Ming, D.W., Eds.; Reviews in Mineralogy and Geochemistry; Mineralogical Society of America and Geochemical Society: Washington, DC, USA, 2001; Volume 45, pp. 1–68. [Google Scholar]
  49. Vaughan, P.A. The crystal structure of the zeolite ferrierite. Acta Crystallogr. 1966, 21, 983–990. [Google Scholar] [CrossRef]
  50. Gramlich-Meier, R.; Meier, W.M.; Smith, B.K. On faults in the framework structure of the zeolite ferrierite. Z. Kristallogr. 1984, 169, 201–210. [Google Scholar] [CrossRef] [Green Version]
  51. Alberti, A.; Sabelli, C. Statistical and true symmetry of ferrierite: Possible absence of straight T-O-T bridging bonds. Z. Kristallogr. 1987, 178, 249–256. [Google Scholar] [CrossRef]
  52. Gramlich-Meier, R.; Gramlich, V.; Meier, W.M. The crystal structure of the monoclinic variety of ferrierite. Am. Mineral. 1985, 70, 619–623. [Google Scholar]
  53. Alberti, A.; Davoli, P.; Vezzalini, G. The crystal structure refinement of a natural mordenite. Z. Kristallogr. 1986, 175, 249–256. [Google Scholar] [CrossRef]
  54. Passaglia, E.; Sheppard, R.A. The crystal chemistry of zeolites. In Natural Zeolites: Occurrence, Properties, Applications; Bish, D.L., Ming, D.W., Eds.; Reviews in Mineralogy and Geochemistry; Mineralogical Society of America and Geochemical Society: Washington, DC, USA, 2001; Volume 45, pp. 69–116. [Google Scholar]
  55. Rice, S.B.; Papke, K.G.; Vaughan, D.E. Chemical controls on ferrierite crystallization during diagenesis of silicic pyroclastic rocks near Lovelock, Nevada. Am. Mineral. 1992, 77, 314–328. [Google Scholar]
  56. Harper, M.; Dozier, A.; Chouinard, J.; Ray, R. Analysis of erionites from volcaniclastic sedimentary rocks and possible implications for toxicological research. Am. Mineral. 2017, 8, 1718–1726. [Google Scholar] [CrossRef]
  57. De Vecchi, G.P.; Sedea, R. The Paleogene basalt of the Veneto region (NE Italy). Mem. Inst. Geol. Mineral. Univ. Padua 1995, 47, 253–274. [Google Scholar]
  58. Milani, L.; Beccaluva, L.; Coltorti, M. Petrogenesis and evolution of the Euganean magmatic complex, Veneto Region, North-East Italy. Eur. J. Mineral. 1999, 11, 379–399. [Google Scholar] [CrossRef]
  59. Pacella, A.; Ballirano, P.; Cametti, G. Quantitative chemical analysis of erionite fibres using a micro-analytical SEM-EDX method. Eur. J. Mineral. 2016, 28, 257–264. [Google Scholar] [CrossRef]
  60. Campbell, L.S.; Charnock, J.; Dyer, A.; Hillier, S.; Chenery, S.; Stoppa, F.; Henderson, C.M.B.; Walcott, R.; Rumsey, M. Determination of zeolite-group mineral compositions by electron probe microanalysis (EPMA). Mineral. Mag. 2016, 80, 781–807. [Google Scholar] [CrossRef] [Green Version]
  61. Passaglia, E. The crystal chemistry of chabazites. Am. Mineral. 1970, 55, 1278–1301. [Google Scholar]
  62. Heyder, J.; Gebhart, J.; Rudolf, G.; Schiller, C.F.; Stahlhofen, W. Deposition of particles in the human respiratory tract in the size range 0.005–15 µm. J. Aerosol Sci. 1986, 17, 811–825. [Google Scholar] [CrossRef]
  63. Gonda, I.; Abd El Khalik, A.F. On the calculation of aerodynamic diameters of fibers. Aerosol. Sci. Technol. 1985, 4, 233–238. [Google Scholar] [CrossRef] [Green Version]
  64. Bruker AXS. Topas V.4.2: General Profile and Structure Analysis Software for Powder Diffraction Data; Bruker AXS: Karlsruhe, Germany, 2009. [Google Scholar]
  65. Cheary, R.W.; Coelho, A. A fundamental parameters approach to X-ray line-profile fitting. J. Appl. Cryst. 1992, 25, 109–121. [Google Scholar] [CrossRef]
  66. Järvinen, M. Application of symmetrized harmonics expansion to correction of the preferred orientation effect. J. Appl. Cryst. 1993, 26, 525–531. [Google Scholar] [CrossRef]
  67. Sabine, T.M.; Hunter, B.A.; Sabine, W.R.; Ball, C.J. Analytical Expressions for the Transmission Factor and Peak Shift in Absorbing Cylindrical Specimens. J. Appl. Cryst. 1998, 31, 47–51. [Google Scholar] [CrossRef]
  68. Ballirano, P. Effects of the choice of different ionisation level for scattering curves and correction for small preferred orientation in Rietveld refinement: The MgAl2O4 test case. J. Appl. Cryst. 2003, 36, 1056–1061. [Google Scholar] [CrossRef] [Green Version]
  69. Le Page, Y.; Donnay, G. Refinement of the crystal structure of low-quartz. Acta Crystallogr. 1976, B32, 2456–2459. [Google Scholar] [CrossRef]
  70. Pacella, A.; Ballirano, P.; Fantauzzi, M.; Rossi, A.; Nardi, E.; Capitani, G.; Arrizza, L.; Montereali, M.R. Surface and bulk modifications of amphibole asbestos in mimicked Gamble’s solution at acidic pH. Sci. Rep. 2021, 11, 14249. [Google Scholar] [CrossRef]
  71. Arletti, R.; Fantini, R.; Giacobbe, C.; Gieré, R.; Vezzalini, G.; Vigliaturo, R.; Quartieri, S. High-temperature behavior of natural ferrierite: In-situ synchrotron X-ray powder diffraction study. Am. Mineral. 2018, 103, 1741–1748. [Google Scholar] [CrossRef]
  72. Jones, J.B. Al-O and Si-O tetrahedral distances in aluminosilicate framework structures. Acta Crystallogr. 1968, 24, 355–358. [Google Scholar] [CrossRef]
  73. Cangiotti, M.; Battistelli, M.; Salucci, S.; Falcieri, E.; Mattioli, M.; Giordani, M.; Ottaviani, M.F. Electron paramagnetic resonance and transmission electron microscopy study of the interactions between asbestiform zeolite fibers and model membranes. J. Toxicol. Environ. Health A 2017, 80, 171–187. [Google Scholar] [CrossRef]
  74. Cangiotti, M.; Salucci, S.; Battistelli, M.; Falcieri, E.; Mattioli, M.; Giordani, M.; Ottaviani, M.F. EPR, TEM and cell viability study of asbestiform zeolite fibers in cell media. Colloids Surf. B Biointerfaces 2018, 161, 147–155. [Google Scholar] [CrossRef]
  75. Freed, J.H. Spin Labeling: Theory and Application; Berliner, L.J., Ed.; Academic Press: New York, NY, USA, 1976. [Google Scholar]
  76. Altenbach, C.; López, C.J.; Hideg, K.; Hubbell, W.L. Chapter 3: Exploring Structure, Dynamics, and Topology of Nitroxide Spin-Labeled Proteins Using Continuous-Wave Electron Paramagnetic Resonance Spectroscopy. Methods Enzymol. 2015, 564, 59–100. [Google Scholar]
  77. Wise, W.S.; Tschernich, R.W. The chemical compositions and origin of the zeolites offretite, erionite, and levyne. Am. Mineral. 1976, 61, 853–863. [Google Scholar]
  78. Alberti, A.; Gottardi, G.; Lai, T. The determination of (Si,Al) distribution in zeolites. In Guidelines for Mastering the Properties of Molecular Sieves; Barthomeuf, D., Derouane, E.G., Hölderich, W., Eds.; NATO ASI Series, Series B: Physics; Plenum: New York, NY, USA, 1990; Volume 221, pp. 145–156. [Google Scholar]
  79. Alberti, A. Location of Brønsted sites in mordenite. Zeolites 1997, 19, 411–415. [Google Scholar] [CrossRef]
  80. Simoncic, P.; Armbruster, T. Peculiarity and defect structure of the natural and synthetic zeolite mordenite: A single-crystal X-ray study. Am. Mineral. 2004, 89, 421–431. [Google Scholar] [CrossRef]
  81. Qin, P.A.; Warncke, K. Electron Paramagnetic Resonance Investigations of Biological Systems by Using Spin Labels, Spin Probes, and Intrinsic Metal Ions Part B; Elsevier: Amsterdam, The Netherlands; Academic Press: Cambridge, MA, USA, 2015; Volume 564, pp. 2–613. [Google Scholar]
  82. Mohr, D.L.; Wilson, W.J.; Freund, R.J. Statistical Methods, Inferences for Two or More Means (Chapter 6), 4th ed.; Elsevier: Amsterdam, The Netherlands; Academic Press: Cambridge, MA, USA, 2022; pp. 243–299. [Google Scholar]
  83. Budil, D.E.; Lee, S.; Saxena, S.; Freed, J.H. Nonlinear-Least-Squares Analysis of Slow-Motion EPR Spectra in One and Two Dimensions Using a Modified Levenberg-Marquardt Algorithm. J. Magn. Reson. 1996, 120, 155–189. [Google Scholar] [CrossRef] [Green Version]
  84. Lyklema, J. Adsorption at solid-liquid interfaces with particular reference to emulsion systems. Colloids Surf. A Physicochem. Eng. Asp. 1994, 91, 25–38. [Google Scholar] [CrossRef]
  85. Hargreaves, J.; Le Meste, M.; Popineau, Y. ESR Studies of Gluten-Lipid Systems. J. Cereal Sci. 1994, 19, 107–113. [Google Scholar] [CrossRef]
  86. Chambin, O.; Bellone, C.; Champion, D.; Rochat-Gonthier, M.H.; Pourcelot, Y. Dry Adsorbed Emulsion: 1. Characterization of an Intricate Physicochemical Structure. J. Pharm. Sci. 2000, 89, 991–999. [Google Scholar] [CrossRef]
  87. Foucher, C.; Lagrost, L.; Maupoil, V.; Le Meste, M.; Rochette, L.; Gambert, P. Alterations in lipoprotein fluidity by non-esterified fatty acids known to affect the transfer protein activity of the cholesterol ester transfer protein. An electron spin resonance study. Eur. J. Biochem. 1996, 236, 436–442. [Google Scholar] [CrossRef]
  88. Berliner, L.J.; Reuben, J. Biological Magnetic Resonance 8: Spin Labeling Theory and Applications; Plenum: New York, NY, USA, 1989. [Google Scholar]
  89. Batchelor, S.N. Free-radical and singlet-oxygen mobility in cotton probed by EPR spectroscopy. J. Phys. Chem. B 1999, 103, 6700. [Google Scholar] [CrossRef]
  90. Belluso, E.; Cavallo, A.; Halterman, D. Crystal habit of mineral fibres. In Mineral Fibres: Crystal Chemistry, Chemical-Physical Properties, Biological Interaction and Toxicity; Gualtieri, A.F., Ed.; Mineralogical Society: London, UK, 2017; Volume 18, pp. 65–109. [Google Scholar] [CrossRef]
  91. Oberdorster, G.; Castranova, V.; Asgharian, B.; Sayre, P. Inhalation exposure to carbon nanotubes (CNT) and carbon nanofibers (CNF): Methodology and dosimetry. J. Toxicol. Environ. Health B 2015, 18, 121–212. [Google Scholar] [CrossRef] [Green Version]
  92. WHO (World Health Organization). Determination of Airborne Fiber Number Concentrations; World Health Organization: Geneva, Switzerland, 1997; p. 53. [Google Scholar]
  93. Gualtieri, A.F.; Mossman, B.T.; Roggli, V.L. Towards a general model for predicting the toxicity and pathogenicity of minerals fibres. In Mineral Fibres: Crystal Chemistry, Chemical-Physical Properties, Biological Interaction and Toxicity; Gualtieri, A.F., Ed.; Mineralogical Society: London, UK, 2017; Volume 18, pp. 501–526. [Google Scholar]
  94. Gualtieri, A.F.; Lusvardi, G.; Zoboli, A.; Di Giuseppe, D.; Gualtieri, M.L. Biodurability and release of metals during the dissolution of chrysotile, crocidolite and fibrous erionite. Environ. Res. 2019, 171, 550–557. [Google Scholar] [CrossRef]
  95. Utembe, W.; Potgieter, K.; Stefaniak, A.B.; Gulumian, M. Dissolution and biodurability: Important parameters needed for risk assessment of nanomaterials. Part. Fibre Toxicol. 2015, 12, 11. [Google Scholar] [CrossRef] [Green Version]
  96. Hartman, R.L.; Fogler, H.S. Understanding the dissolution of zeolites. Langmuir 2007, 23, 5477–5484. [Google Scholar] [CrossRef]
  97. Giordani, M.; Cametti, G.; Di Lorenzo, F.; Churakov, S.V. Real-time observation of fibrous zeolites reactivity in contact with simulated lung fluids (SLFs) obtained by Atomic Force Microscope (AFM). Minerals 2016, 9, 83. [Google Scholar] [CrossRef] [Green Version]
  98. Aust, A.E.; Cook, P.M.; Dodson, R.F. Morphological and chemical mechanisms of elongated mineral particle toxicities. J. Toxicol. Environ. Health Part B 2011, 14, 40–75. [Google Scholar] [CrossRef] [Green Version]
  99. Turci, F.; Tomatis, M.; Lesci, I.G.; Roveri, R.; Fubini, B. The Iron-Related Molecular Toxicity Mechanism of Synthetic Asbestos Nanofibres: A Model Study for High-Aspect-Ratio Nanoparticles. Chem. Eur. J. 2011, 17, 350–358. [Google Scholar] [CrossRef]
  100. Gualtieri, A.F.; Gandolfi, N.B.; Pollastri, S.; Pollok, K.; Langenhorst, F. Where is iron in erionite? A multidisciplinary study on fibrous erionite-Na from Jersey (Nevada, USA). Sci. Rep. 2016, 6, 37981. [Google Scholar] [CrossRef] [PubMed]
  101. Ballirano, P.; Pacella, A.; Cremisini, C.; Nardi, E.; Fantauzzi, M.; Atzei, D.; Rossi, A.; Cametti, G. Fe(II) segregation at a specific crystallographic site of fibrous erionite: A first step toward the understanding of the mechanisms inducing its carcinogenicity. Microporous Mesoporous Mater. 2015, 211, 49–63. [Google Scholar] [CrossRef]
  102. Pacella, A.; Cremisini, C.; Nardi, E.; Montereali, M.R.; Pettiti, I.; Ballirano, P. The mechanism of iron binding processes in erionite fibres. Sci. Rep. 2017, 7, 1319. [Google Scholar] [CrossRef] [PubMed] [Green Version]
  103. Pacella, A.; Cremisini, C.; Nardi, E.; Montereali, M.R.; Pettiti, I.; Giordani, M.; Mattioli, M.; Ballirano, P. Different erionite species bind iron into the structure: A potential explanation for fibrous erionite toxicity. Minerals 2018, 8, 36. [Google Scholar] [CrossRef] [Green Version]
Figure 1. SEM images of the investigated ferrierite samples. (a,b) General views of the FER1 and FER5 samples, respectively, with the ferrierite crystals, completely covering the surface of the cavities; (c,d) details of the FER1 and FER5 crystals, respectively, with flattened and very elongated prismatic morphologies to fibrous habit; note the highly fibrous character of some ferrierite crystals.
Minerals 12 00626 g001
Figure 2. Conventional Rietveld plots of FER5 sample. Intensity is reported on a logarithmic (natural) scale. Blue continuous line: experimental; red continuous line: calculated; continuous grey line: difference; below: vertical ticks represent the position of calculated Bragg reflections.
Minerals 12 00626 g002
Figure 3. Sketch of the refined structure of the FER5 sample as seen along [001].
Minerals 12 00626 g003
Figure 4. Details of the coordination of the extra-framework site K1.
Minerals 12 00626 g004
Figure 5. Experimental (black line) and simulated (red line) spectra of the non-interacting solutions (stock solutions) of CAT1 and CAT8 probes (named as Bn).
Minerals 12 00626 g005
Figure 6. Amount (%) of adsorbed probes in solid FER1 and FER5 ferrierite samples.
Minerals 12 00626 g006
Figure 7. EPR spectral simulation of CAT1 and CAT8 probes adsorbed in FER1 and FER5 samples. Formula for CAT1 and CAT8 probes is shown at the top of the figure. SSE = sum of squares error.
Minerals 12 00626 g007
Figure 8. Comparison of the adsorbed percentage of probes (a) and interacting component (b) of the studied ferrierite samples (FER1 and FER5) with that of other fibrous zeolites. FER = ferrierite samples (BC, LN); data from Gualtieri et al. [20]. ERIf = fibrous erionite (GF1), ERIp = prismatic erionite (MD8), OFF = offretite (BV12), SC1 = scolecite; data from Mattioli et al. [11]. THO = thomsonite (GF3b), MES = mesolite (GF3a); data from Giordani et al. [14].
Minerals 12 00626 g008
Table 1. Results of SEM dimensional analysis of ferrierite fibers.
WidthFER1FER5
<3 μm88.51%91.28%
3–5 μm9.42%6.31%
>5 μm2.07%2.41%
min0.1 μm0.1 μm
max12 μm8 μm
average0.9 μm0.85 μm
σ1.251.44
Length
<20 μm49.14%56.01%
20–100 μm32.21%38.15%
>100 μm8.65%5.84%
min8 μm10 μm
max120 μm115 μm
average24.5 μm21.5 μm
σ15.2212.51
Table 2. SEM-EDX and EMPA chemical analyses of the fibrous ferrierite samples. The number of analytical points is reported in parentheses. EMPA data of FER1 indicated a FeO content of 1.97 wt.% arising from Fe-rich phyllosilicate particles sticking to the surface. For this reason, iron was not included in the calculation of the crystal-chemical formula.
Oxides (wt.%)FER1FER5
SEM-EDX
(8 points)
EMPA
(8 points)
SEM-EDX
(8 points)
SiO265.31 (42)62.92 (107)67.61 (15)
Al2O313.22 (20)11.59 (50)11.94 (6)
Na2O0.34 (19)0.11 (6)0.42 (23)
K2O1.39 (35)1.60 (11)1.15 (12)
MgO3.35 (20)3.01 (12)2.70 (18)
CaO1.59 (37)0.98 (4)1.38 (24)
BaO-0.09 (9)-
H2O 114.8014.80
Total100.0095.09100.00
Si29.07 (9)29.58 (17)29.80 (6)
Al6.93 (9)6.42 (17)6.20 (6)
Na0.30 (14)0.10 (5)0.36 (21)
K0.79 (17)0.96 (7)0.65 (9)
Mg2.22 (13)2.11 (9)1.77 (10)
Ca0.76 (19)0.49 (2)0.65 (10)
Ba-0.02 (1)-
EF s.s. (e-)60.1 (101)55.4 (18)50.6 (72)
O72.06 (21)71.94 (15)71.83 (15)
H2O21.9723.2222.76
E%−1.562.045.90
R0.807 (3)0.822 (5)0.828 (2)
M/(M + D)0.266 (38)0.288 (15)0.293 (38)
1 From TGA data; EF = extra-framework cations; E% = (Al − [Na + K) + 2 (Mg + Ca + Sr + Ba + Fe2+)]/[(Na + K) + 2 (Mg + Ca + Sr + Ba + Fe2+)]; R = Si/(Si + Al); M = Na + K; D = Ca + Mg + Mn.
Table 3. ICP-AES chemical analyses of selected minor elements (mg/kg) of the FER1 sample.
Elementsmg/kg
Fe15,400
Ba1460
Sr1330
S357
Zn322
Mn345
Pb110
Table 4. Miscellaneous data of the refinements. Statistic indicators as defined in [24]. Data of ferrierite (G19) from Giacobbe et al. [22] are reported for comparison.
FER1FER5G19
Rwp0.0220.027-
Rp0.0150.020-
DWd0.3350.384-
χ23.7613.913-
RBragg0.0090.009-
quartz wt.% 16.09(10)--
a (Å)19.2539(4)19.2242(2)19.2362(2)
b (Å)14.1513(2)14.14518(11)14.1395(1)
c (Å)7.51284(10)7.49840(5)7.5090(1)
V3)2047.01(6)2039.04(3)2042.37(4)
1 The sample contains significant, not quantified, amounts of a 15 Å Fe-bearing phyllosilicate.
Table 5. Average isotropic displacement parameters (Å2) and extra-framework cation and H2O molecule sites population. Isotropic displacement parameters of H2O molecule sites were kept fixed throughout the refinements. Data of ferrierite (G19) from Giacobbe et al. [22] are reported for comparison.
FER5G19
BT1,4 12.251.66
BO1,8 14.244.45
BK1,Mg1 12.52(15)3.02
BW1,6 110.2(2)9.61
occ. K10.267(3)0.2572(0)
occ. Mg10.824(8)1(0)
EF s.s. (e-)40.1(4)43.5(0)
EF s.s. (e-) from chemical data50.664.0 2
occ. W10.948(7)1(0)
occ. W20.539(6)0.50(2)
occ. W30.543(7)0.398(17)
occ. W40.486(6)0.37(4)
occ. W50.451(6)0.35(5)
occ. W60.368(6)-
H2O pfu22.9(3)16.9(10)
H2O pfu from TGA22.822.9
1 Average value. K1 and Mg1 displacement parameters were constrained to be equal. OW displacement parameters were kept fixed to the listed value. Individual Biso may be found in the corresponding .cif files. EF = extra-framework cations. 2 Chemical data from Gualtieri et al. [20].
Table 6. Relevant bond distances (Å). The Al population at the various tetrahedral sites T (% Al) and the corresponding R = Si/(Si + Al) were calculated using the equation of Jones [72]. Data of ferrierite (G19) from Giacobbe et al. [22] are reported for comparison. Due to short, mutually excluding W–W contacts, two different coordination for the Mg(H2O)62+ complex are expected. Similarly, two different configurations for the eight-fold coordinated K1 site are expected, both being bonded to 4 × O8, the first one linked to 2 × W5 and 2 × W4, (a) and the second one to 2 × W5 and 2 × W6 (b).
FER5G19
T1-O4 × 21.639(5)1.619(3)
T1-O3 × 21.645(5)1.622(3)
<T1-O>1.6421.620
% Al at T124.310.7
T2-O31.586(5)1.642(3)
T2-O11.612(2)1.6305(8)
T2-O7 × 21.647(3)1.6342(18)
<T2-O>1.6231.635
% Al at T212.420.2
T3-O41.563(5)1.601(4)
T3-O8 × 21.621(3)1.628(2)
T3-O21.629(3)1.6211(16)
<T3-O>1.6091.619
% Al at T33.110.1
T4-O71.585(3)1.5979(19)
T4-O51.5818(13)1.5921(5)
T4-O81.609(3)1.6085(19)
T4-O61.6287(18)1.6112(10)
<T4-O>1.6011.602
% Al at T400
<T-O>1.6191.619
Alcal pfu2.202.85
Al pfu from chemical data6.206.89
Rcal = Si/(Si + Al)0.9390.921
R from chemical data0.8280.809
K1-W4 × 4 (x2)2.460(10)2.705(19)
K1-W5 × 4 (x2)2.846(11)3.01(8)
K1-O8 × 42.972(6)3.017(15)
K1-W6 × 23.075(15)-
<VIIIK1-Oa>2.8132.937
<VIIIK1-Ob>2.966-
Mg1-W1 × 21.927(10)1.994(3)
Mg1-W2 × 4 (x2)2.193(10)2.064(8)
Mg1-W3 × 4 (x2)2.196(10)2.075(7)
<VIIIMg1-O>2.1052.044
Table 7. EPR parameters for CAT1 and CAT8 probe solutions (Bn).
ParametersBn CAT1Bn CAT8
<A> (G)16.7816.74
W (G)1.851.95
ΔH0 (G)1.951.95
τ (ns)0.0290.048
Table 8. Main parameters calculated by the spectral simulation for CAT1 and CAT8 probes adsorbed in solid samples.
FER1 + CAT1FastInteractingFER5 + CAT1FastInteracting
Az (G)38.7037.90Az38.9037.83
τ (ns)1.535.27τ0.595.78
%48.8551.15%13.4386.57
W (G)1.8524.00W6.327.19
% of adsorption in solid90.7287.81
FER1 + CAT8InteractingFER5 + CAT8Interacting
Az (G)38.49Az38.97
τ (ns)6.75τ5.91
%100%100
W (G)8.20W8.31
% of adsorption in solid97.0091.27
Publisher’s Note: MDPI stays neutral with regard to jurisdictional claims in published maps and institutional affiliations.

