Article

Hyperspectral and Geochemical Analysis of Chlorites at the Gongchangling High-Grade Magnetite Deposit, NE China: Implications for Alteration Processes

School of Resources and Civil Engineering, Northeastern University, Shenyang 110819, China
*
Author to whom correspondence should be addressed.
Submission received: 19 February 2022 / Revised: 5 May 2022 / Accepted: 11 May 2022 / Published: 15 May 2022
(This article belongs to the Special Issue Mapping of Rocks and Minerals Using Hyperspectral Remote Sensing)

Abstract

:
The Gongchangling deposit is a representative banded iron formation (BIF) in China, in which developed several high-grade magnetite ores. The surrounding alteration rocks recorded the genesis information of the high-grade ores. However, the study related to alteration processes remains poor. In this study, we investigate the sub-types and formation temperature of chlorite using hyperspectral imaging and electronic probe microanalysis (EPMA), and deciphered the elemental migration trend during alteration processes by whole-rock geochemistry. The chlorites in the alteration rocks were divided into three sub-types according to the spectral features of the Fe-OH band near 2250 nm. The range of wavelength position is approximately 2250–2255 nm for chlorite-I, 2255–2260 nm for chlorite-II, and 2260–2265 nm for chlorite-III. The variation in Mg# is 0.32–0.44 in chlorite-I, 0.20–0.34 in chlorite-II, and 0.15–0.23 in chlorite-III, which is consistent with the range of wavelength position. The hydrothermal alteration resulted in the enrichment of iron and the depletion of silicon. The results shed new light on the recognition of chlorite sub-types and deciphered the hydrothermal alteration processes of high-grade magnetite ores, which proposed an effective method for mineralogical mapping.

1. Introduction

The Gongchangling iron deposit is a typical deposit so far found in the Anshan-Benxi area in Liaoning Province, China, in which two types of ore have developed, including banded iron formations (BIFs) and high-grade magnetite ores [1]. The high-grade magnetite ores are hosted in a series of alteration rocks and are attributed to Si leaching of the BIFs during hydrothermal alteration [2]. The initial BIFs were deposited at the back-arc basin at 2.55 to 2.53 Ga [3,4], and modified by the superimposed hydrothermal fluids at ~1.86 Ga [1]. The overprinted hydrothermal fluids have leached out Si from BIFs and promoted the local concentration of Fe to form the high-grade magnetite ores [2,5]. Therefore, the alteration rocks can provide more detailed information about the metallogeny and water–rock interaction. However, deciphering the alteration process in the Gongchangling deposit has received relatively little attention.
Chlorite is a ubiquitous phyllosilicate mineral occurring in alteration rocks in the Gongchangling deposit. Chlorites are mainly formed by the displacement and substitution induced by hydrothermal fluids in iron-magnesium minerals (such as biotite, amphibole, and pyroxene) [6,7,8,9]. Some elemental substitutions may change the chemical composition of chlorite during the water–rock reaction process, such as simple Mg-Fe substitution or Tschermak substitution, in which octahedral Mg and Fe substitute for Al concurrently with tetrahedral Si for Al [10]. The extent and magnitude of the chemical changes of chlorite are controlled by physicochemical factors, including temperature, pH, water/rock ratios, and the composition of the hydrothermal fluids and the host rocks [11].
The absorption features in the 2250 nm band of the high-resolution imaging spectrum are mainly induced by the stretching and bending of (Mg,Fe)-OH [12]. These spectra can quickly, accurately, and nondestructively analyze the changes in mineral composition, especially suitable for chlorite, mica, and other water-containing silicate minerals [13,14]. The visible and near-infrared (350–2500 nm) reflectance spectra are sensitive to variation in the chemical composition of chlorite. The elemental substitutions in chlorite can be reflected by spectral shifts within the Fe-OH absorption features near 2250 nm [15]. The wavelength position of the Fe-OH absorption feature shifts systematically toward shorter wavelengths as the Mg# (Mg/Mg + Fe) increases, and the opposite effect, or a shift toward longer wavelengths, takes place when the Fe content increase [16,17].
Our previous study has identified the detailed alteration zonation from proximal to distal for the high-grade iron ore body, based on hyperspectral images of wall rocks [18], but the detailed spectral study for chlorite in the Gongchangling deposit remains poor. As a subsequent study, this study predominately distinguishes the types of chlorites in the Gongchangling deposit based on wavelength positions obtained from HySpex data, revealing the response mechanism of spectral differences with mineralogical and geochemical features of chlorite, and discusses the relationship between the genesis of three types of chlorite and high-grade magnetite ore according to mass balance calculations.

2. Geologic Setting

The Anshan-Benxi area is located on the northern margin of the North China Craton (Figure 1a). The Gongchangling deposit is the representative iron ore in the Anshan-Benxi area, subdivided into No.1, No.2, No.3, and the Dumu mining areas (Figure 1b). The No.2 mining area is the only sizeable sedimentary–metamorphic iron deposit with industrial mining value. The ore reserves in the Anben area are approximately 12.1 Gt, and the proven high-grade magnetite ore reserves in the Gongchangling mining area are approximately 1.64 Gt [19,20]. Unlike other iron deposits in the Anben area, the alteration rocks in the Gongchangling No.2 mining area are well developed and are closely spatially related to the high-grade magnetite orebody. The alteration rocks were primarily composed of chlorite, garnet, and a minor amount of hornblende [1]. The elongated ore-bearing rocks in the No.2 mining area trend NW and are surrounded by large-scale migmatite. The ore-bearing rocks, with strike NW and dip NE, are approximately 4.8 km long and 100–700 m wide, and have undergone migmatization and hydrothermal metasomatism. From the foorwall to the hanging wall of the high-grade magnetite orebodies, the rock sequence are an amphibolite layer, two layers of low-grade orebodies, a biotite granulite layer, high-grade magnetite orebodies, and a silicatite layer (Figure 1c). The amphibolite layer is mainly composed of amphibolite, plagioclase, biotite, chlorite, and quartz. The biotite granulite layer mainly consists of biotite, hornblende, a small amount of plagioclase and quartz. The silicatite layer is mainly composed of quartz, mica, amphibole, actinolite, talc, and chlorite.
The wall rock near the high-grade magnetite ore is strongly altered into garnet chlorite schist or chlorite schist [18]. The alteration strength of the wall rock is positively related to the scale of the high-grade magnetite ore bodies. Usually, the alteration degree of the wall rock is strong where the thick high-grade magnetite ore is developed [21]. The dark green altered rocks adjacent to the high-grade magnetite ore are interspersed in the magnetite orebody as layered, vein-like, and lenticular shapes with clear contact boundaries between ores and rocks. The altered rocks mainly consist of garnet, chlorite, amphibole, and a small amount of epidote, biotite, and magnetite.
Figure 1. (a) Geological sketch map of the North China Craton (NCC), showing the distribution of the Archean greenstone belt and BIFs, adapted with permission from Zhai et al., 2020 Ref. [22]; (b) Geological sketch map of the Gongchangling deposit, illustrating the location of study area, adapted with permission from Li et al., 2014; Zhou et al., 1994 Refs. [19,23]; (c) Geological profile map in the No.2 mining area, exhibiting the location of the sampling profile, adapted with permission from Li et al., 2014; Zhou et al., 1994 Refs. [19,23]. (d) The cartoon graph displays the distribution of the collected samples in this study, adapted with permission from Song et al., 2020 Ref. [18]. The legends of (c) are identical with (d).
Minerals 12 00629 g001

3. Samples and Methods

3.1. Sampling

In this study, nine rock samples were collected from a typical profile located between high-grade magnetite ore and alteration rocks, which simultaneously included ore body and alteration zones. The sampling profile is located in the middle section at the underground mining level −280 m in the No. 2 mining area. Detailed sample information and schematic diagrams of profile sampling are illustrated in Figure 1d. There are two layers of high-grade magnetite ore inclusions in wall rocks with a north–south tendency, and the farther away from the high-grade magnetite ore, the stronger the alteration degree is. The high-grade magnetite ore samples are black, dense, and massive. The altered rock is mainly green to dark green garnet–chloritite, and the outermost alteration zone is light grey plagioclase amphibolite gneiss. The selected sample was cut into two slabs with a size of roughly 4 × 5 cm. One cutting cross-sectional slab is used for HySpex imaging hyperspectral measurement, and the other side is used for optical thin section analysis.

3.2. HySpex Laboratory Hyperspectral Imagery

The hyperspectral imaging data were obtained by HySpex-320 nm at the Planetary Mineralogy and Spectroscopy Laboratory at the University of Hong Kong. The HySpex-320 nm was produced by the Norwegian company Norsk Elektro Optikk (NEO), Oslo, Norway. The system with high acquisition rate is mainly composed of a short-wave infrared (SWIR) sensor, a central computer, and a measurement platform. This camera is equipped with a mercury-cadmium-telluride (MCT) detector array (HgCdTe), each column along a line of 320 pixels. The SWIR sensor produced images with a spectral sampling interval of 5 nm from 1000–2500 nm in 256 bands. The optical device size of the lens is 30 cm × 100 cm × 300 cm. The rock chips were run sequentially through the camera with a constant speed at a distance of about 0.5 m under artificial illumination. Because the hyperspectral images were obtained from the cut surface of the rock chips at a close distance, the spatial resolution is as high as 0.3 mm × 0.3 mm.
During data collection, the white reference panel and a gray calibration panel (both with measured reflectance spectra) were placed in front of the samples for calibration. An average dark current frame was subtracted from frames of each image. Integration time is 10 ms which is the highest precision. The relative reflectance was calculated using the Flat-Field method, which converts the raw data to reflectance by dividing the spectral value of each pixel by the value of the white reference panel to. The Savizky–Golay filtering (S-G) process was utilized in this procedure to decrease the influence of noise. During S-G process, the moving window size of 5 points and 2 polynomial orders is adopted for the hyperspectral images, which can achieve a better smoothing without the attenuation of data features. The obtained data were processed with the spectral angle mapper (SAM) methods [24] by ENVI software to identify crystal minerals. This SAM method determines the similarity of a test spectrum (pixel spectrum) to a reference spectrum (laboratory spectrum) by calculating the angle between them. A lower calculated angle denotes a better match with target spectra. The SAM method can give the position of minerals in the original image, which not only provides mineral identification information but also provides a basis for analyzing minerals occurrence patterns. In this method, we obtained hyperspectral images with high quality, and further extracted the single spectra of three types of chlorites. The single pixel spectra of wavelength position of 2250 nm were then extracted to ascertain the sub-types of chlorite. We selected a relatively clean area of examined samples with only pure sub-types of chlorite to obtain the single pixel spectra, with the extraction position of the single spectra shown in Figure 2a. The secondary absorption feature near 2250–2265 nm is chosen as a dominant criterion, because this absorption feature does not overlap with any features of other silicates commonly existing in altered rocks of the Gongchangling deposit.

3.3. Whole Rock Geochemical Analysis

The major and trace element compositions were determined by X-ray fluorescence (XRF-1800; SHIMADZU, Kyoto, Japan) on fused glasses and inductively coupled plasma mass spectrometry (7500 ce; Agilent, Santa Clara, CA, USA) after acid digestion of samples in Teflon bombs, at Beijing Createch Testing Technology Co., Ltd, Beijing, China. Loss on ignition was measured after heating to 1000 °C for 3 h in a muffle furnace. The XRF analyses’ precision is within ±2% for the oxides greater than 0.5 wt.% and within ± 5% for the oxides greater than 0.1 wt.%. Sample powders (approximately 50 mg) were dissolved in Teflon bombs using an HF + HNO3 mixture for 48 h at approximately 190 °C. The solution was evaporated to incipient dryness, dissolved by concentrated HNO3, and evaporated at 150 °C to dispel the fluorides. The samples were diluted to about 100 g for analysis after being redissolved in 30% HNO3 overnight. An internal standard solution containing the element Rh was used to monitor signal drift during analysis. Analytical results for USGS standards indicated that the uncertainties for most elements were within 5%.

3.4. Electron Probe Microanalysis (EPMA)

We cut the sample into two flat plates along a tangent line, ensuring that the two opposite sides of the two plates have the same mineral assemblage and textures. These two plates are used for imaging spectroscopy and polished thin sections, respectively, ensuring consistency between spectral images and textural phenomena. In fact, the size of the polished thin section is slightly smaller than the sample size of the imaging spectra. We selected the shared phenomena to extract single spectra on the imaging spectroscopy slab and perform EPMA tests on polished thin sections at the corresponding locations. EPMA was conducted with a JEOL JXA-8230 electron probe micro-analyzer at the Key Laboratory of Mineralogy and Metallogeny, Guangzhou Institute of Geochemistry, Chinese Academy of Sciences. The instrument was operated at an accelerating voltage of 15 kV, with a probe current of 20 nA and beam diameter of 1 μm. The count time was 10 s (peak) and 5 s (upper and lower background) for F, Cl, K, and Na; 20 s (peak) and 10 s (upper and lower background) for Si, Al, Fe, Mg, and Ca; and 40 s (peak) and 20 s (upper and lower background) for Ti and Mn. Matrix effects were corrected using ZAF software. The chlorites in altered rocks, samples G02, G05, G06, and G07, were tested with 13–20 points in each sample and 71 points in total. Chlorite analyses were recalculated on the basis of 28 oxygen atoms per formula unit, and Fe2+/Fe3+ and OH were calculated with assuming full site occupancy according to electricity price equilibrium method [25].

4. Result

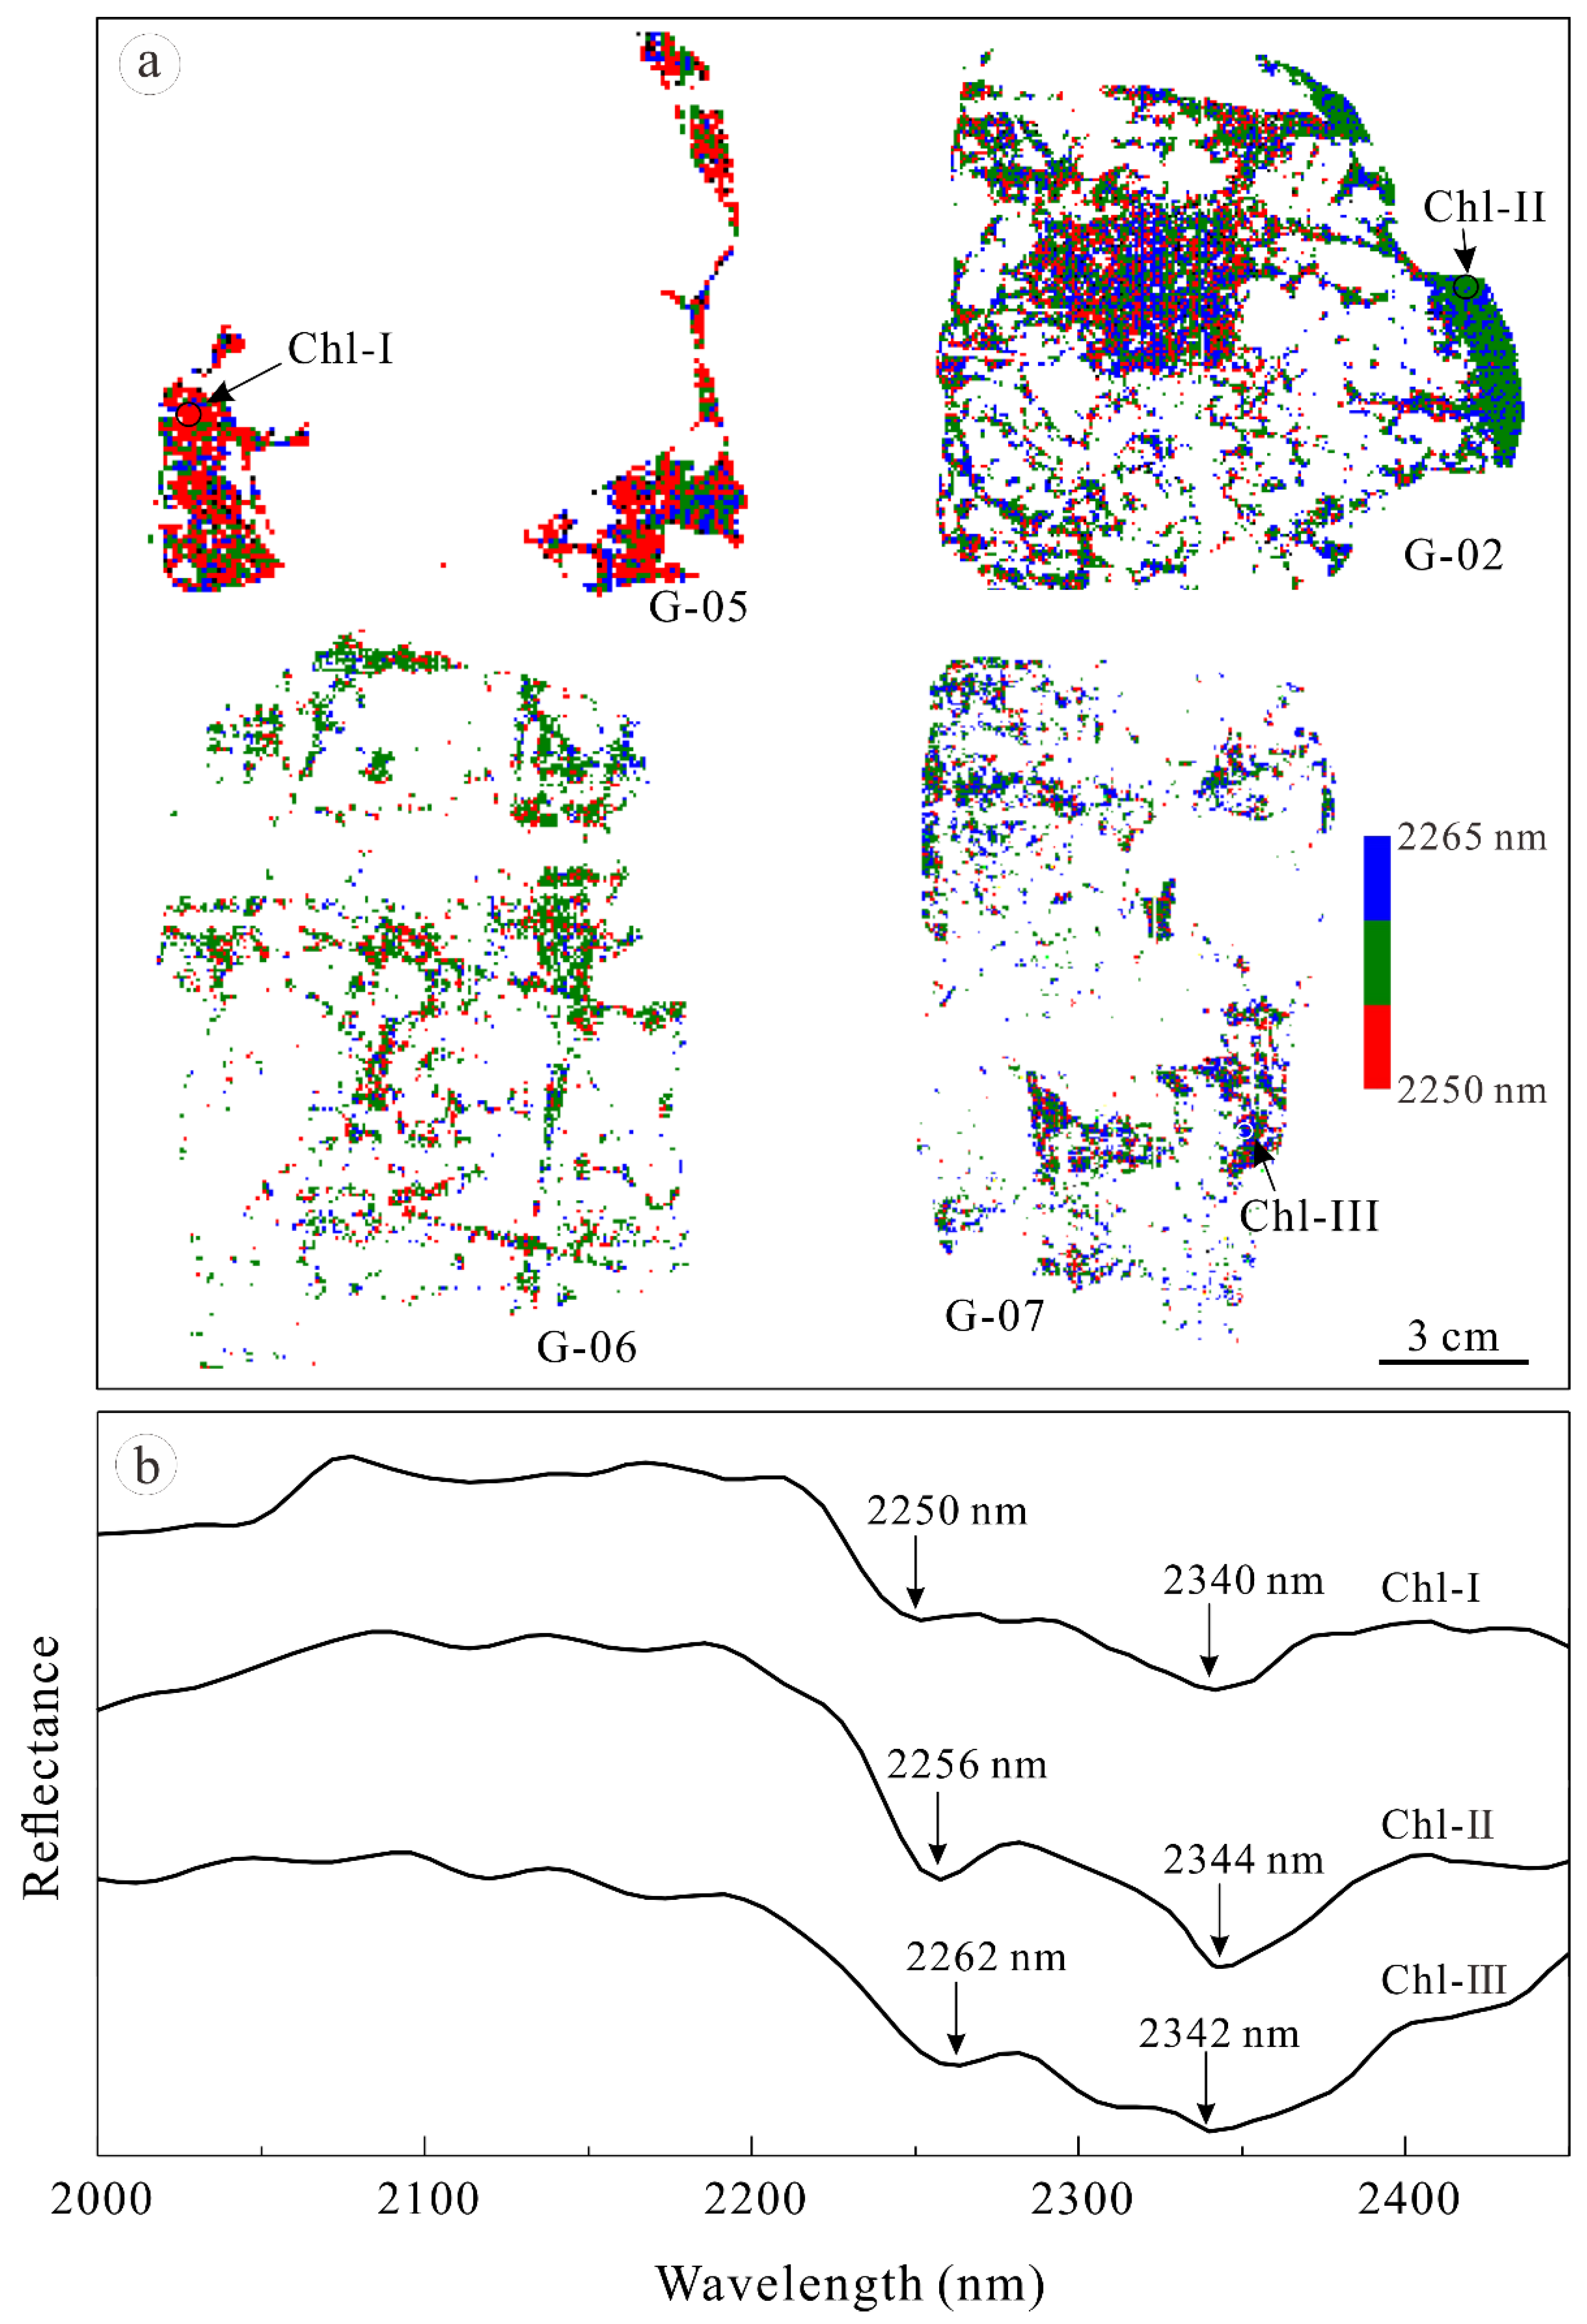
4.1. Hyperspectral Characteristics of Chlorites

This study is conducted based on our previous research about spectral alteration zonation [18]. The hyperspectral images of chlorite exhibited three occurrence forms in altered rocks, including massive, disseminated, and vein-like shapes. The massive chlorite distributed around the other minerals with sharp and straight boundaries primarily occurred in the sample of G05. The disseminated and vein-like chlorites, developing in G02, G06, and G07, replaced other silicates and infilled micro-fissures in samples with curved boundaries (Figure 2a).
The chlorite in the alteration zone at the Gongchangling deposit was divided into three sub-types on the basis of the spectral wavelength position of Fe-OH (Figure 2b). The wavelength position of chlorite-I is approximately 2250–2255 nm. The chlorite-II is identified by the wavelength position of 2255–2260 nm, and chlorite-III defined by the wavelength position of 2260–2265 nm. Chlorite-I primary hosted in the sample G05 which was closed to the high-grade magnetite iron ores. Chlorite-III mainly distributed in G07 which was located distal from orebodies. Chlorite-II occurred in G02 and G06. The G02 represented the middle location between two layers of high-grade ores, and G06 was located at the middle site between G05 and G07.

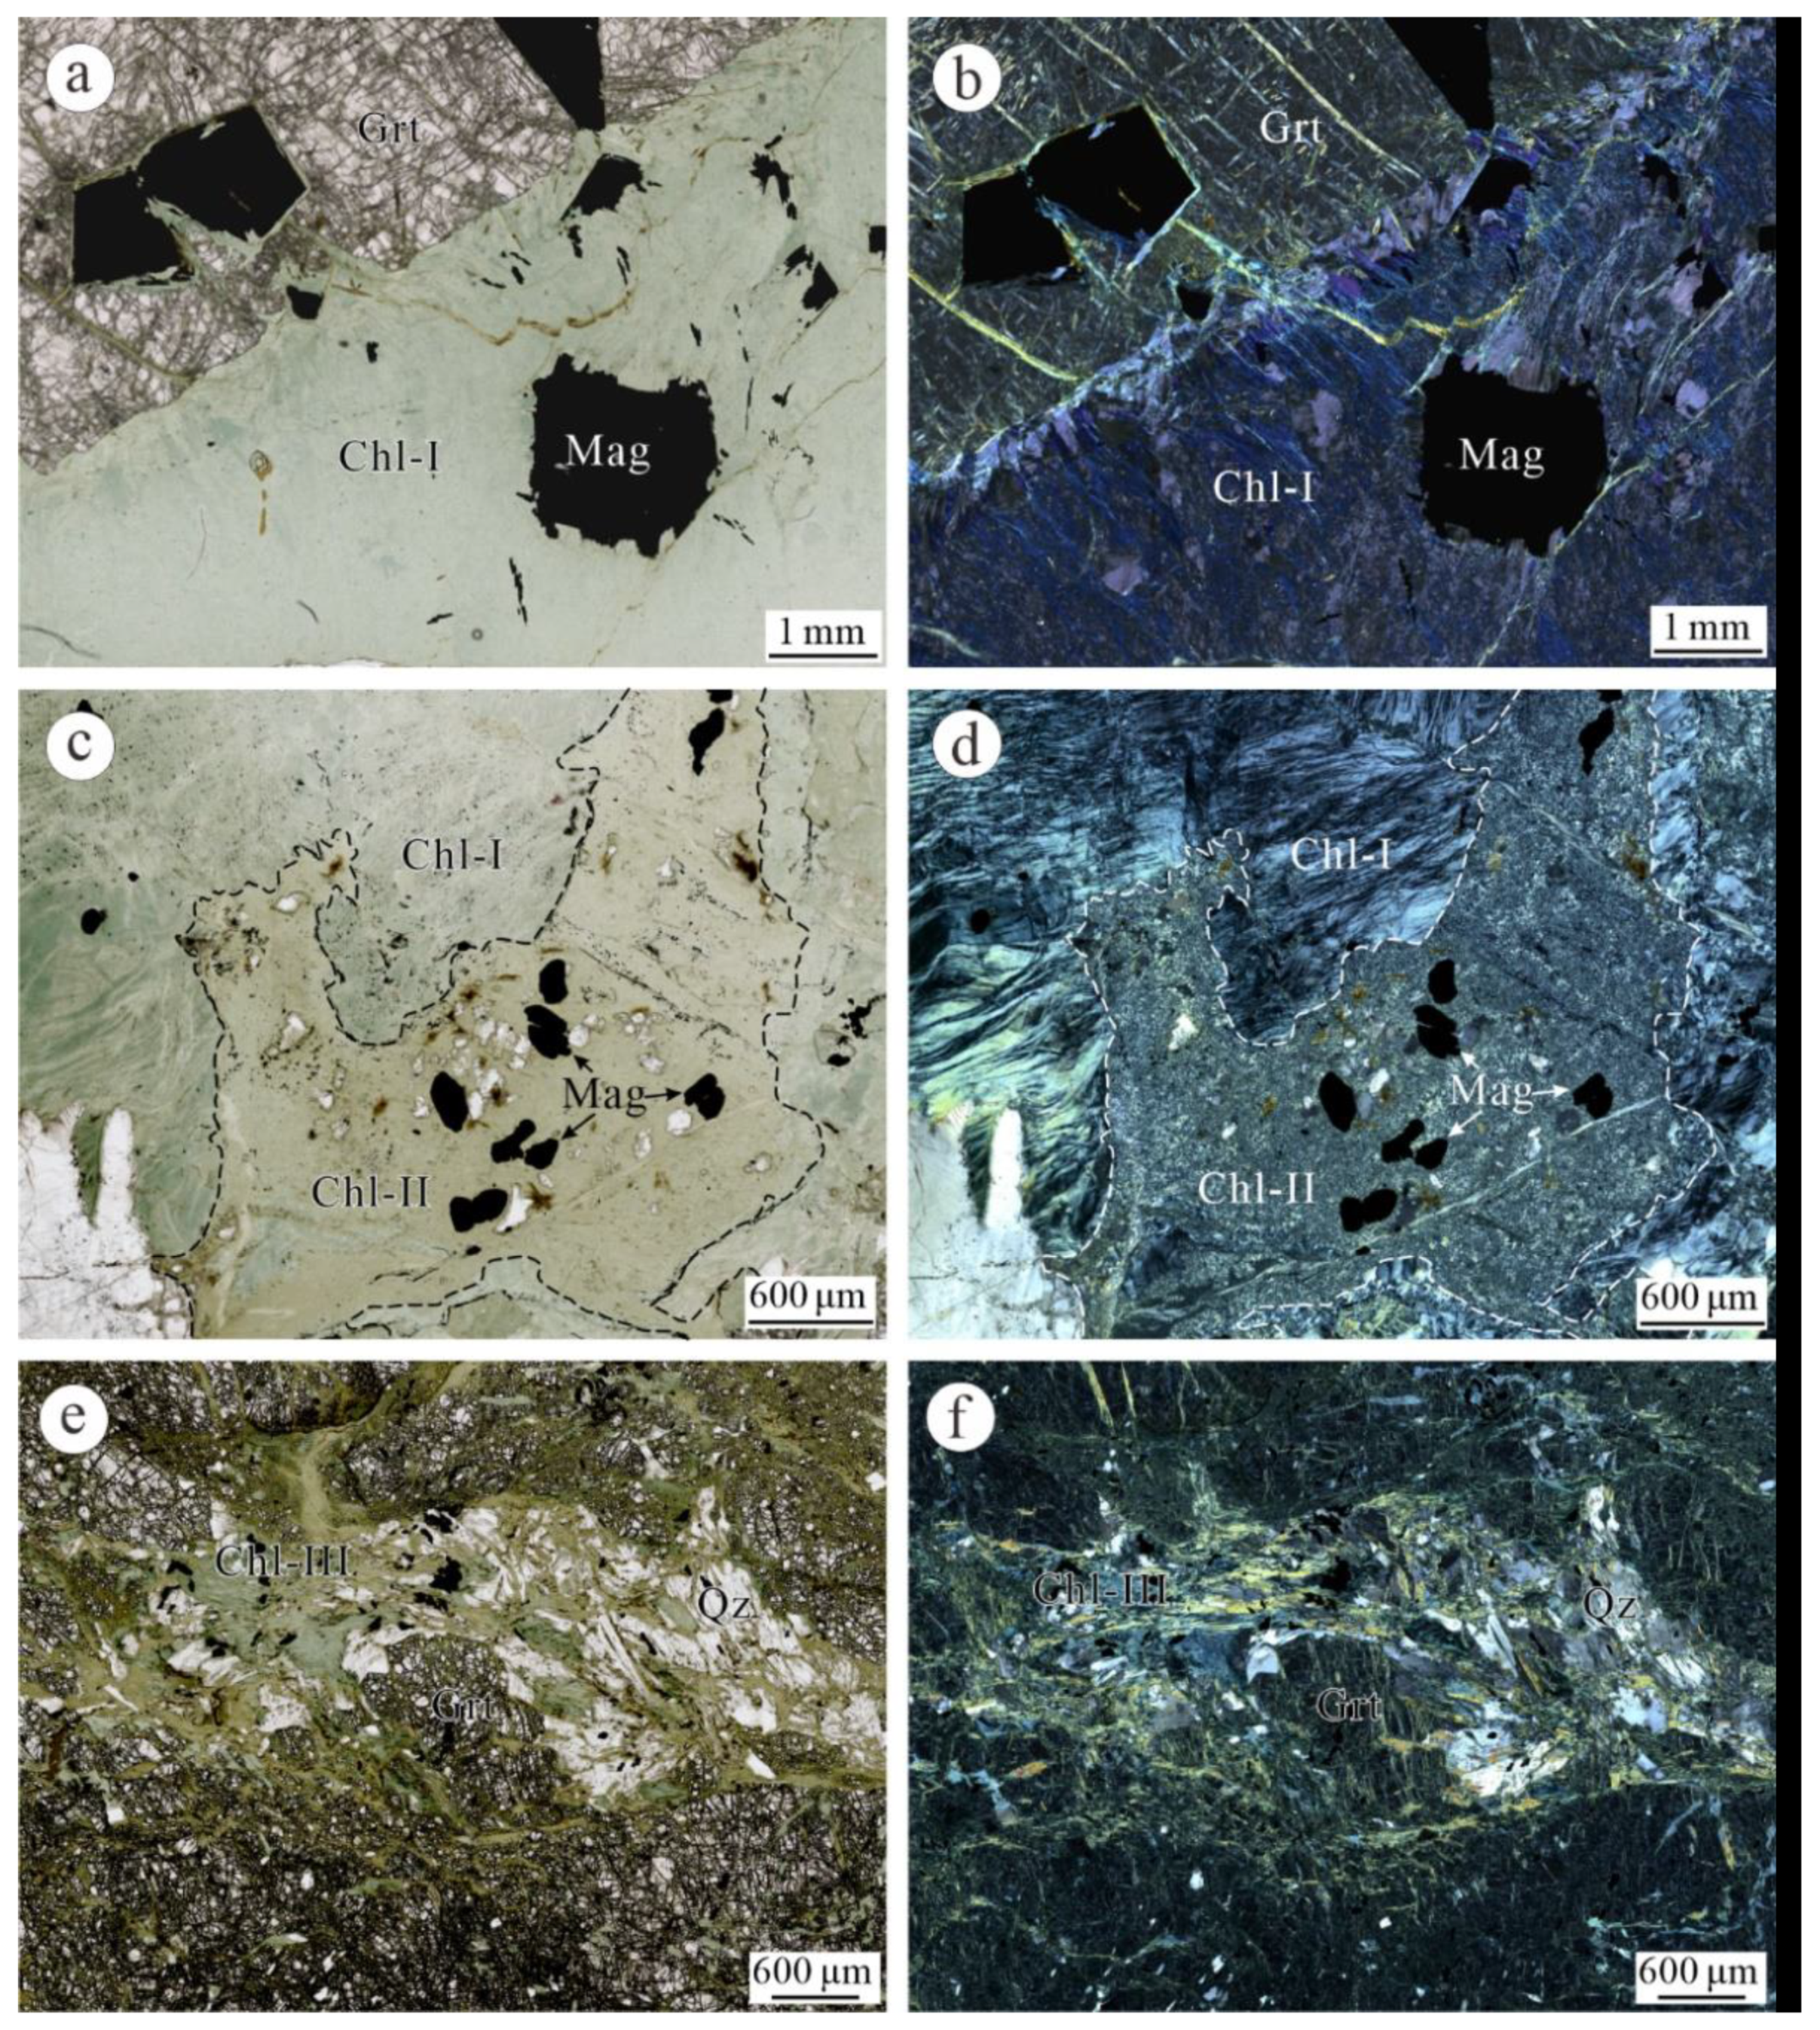
4.2. Microscopy Observation of Chlorite

The chlorite-I occurred as a flaky texture and coexisted with coarse grains of garnet and euhedral magnetite (Figure 3a). The type of chlorite always exhibited low-order blue or grey interference colors but displayed low-order purple interference colors when contacted with garnet and magnetite (Figure 3b,d). The chlorite-II was infilled in chlorite-I with a curve contact boundary (Figure 3c,d). It occurred as the assemblage of fine grains and coexisted with anhedral magnetite (Figure 3c,d). The chlorite-III infilled fissures in garnets and replaced it. This type of chlorite coexisted with lath-shaped quartz, exhibiting a complex texture (Figure 3e,f).

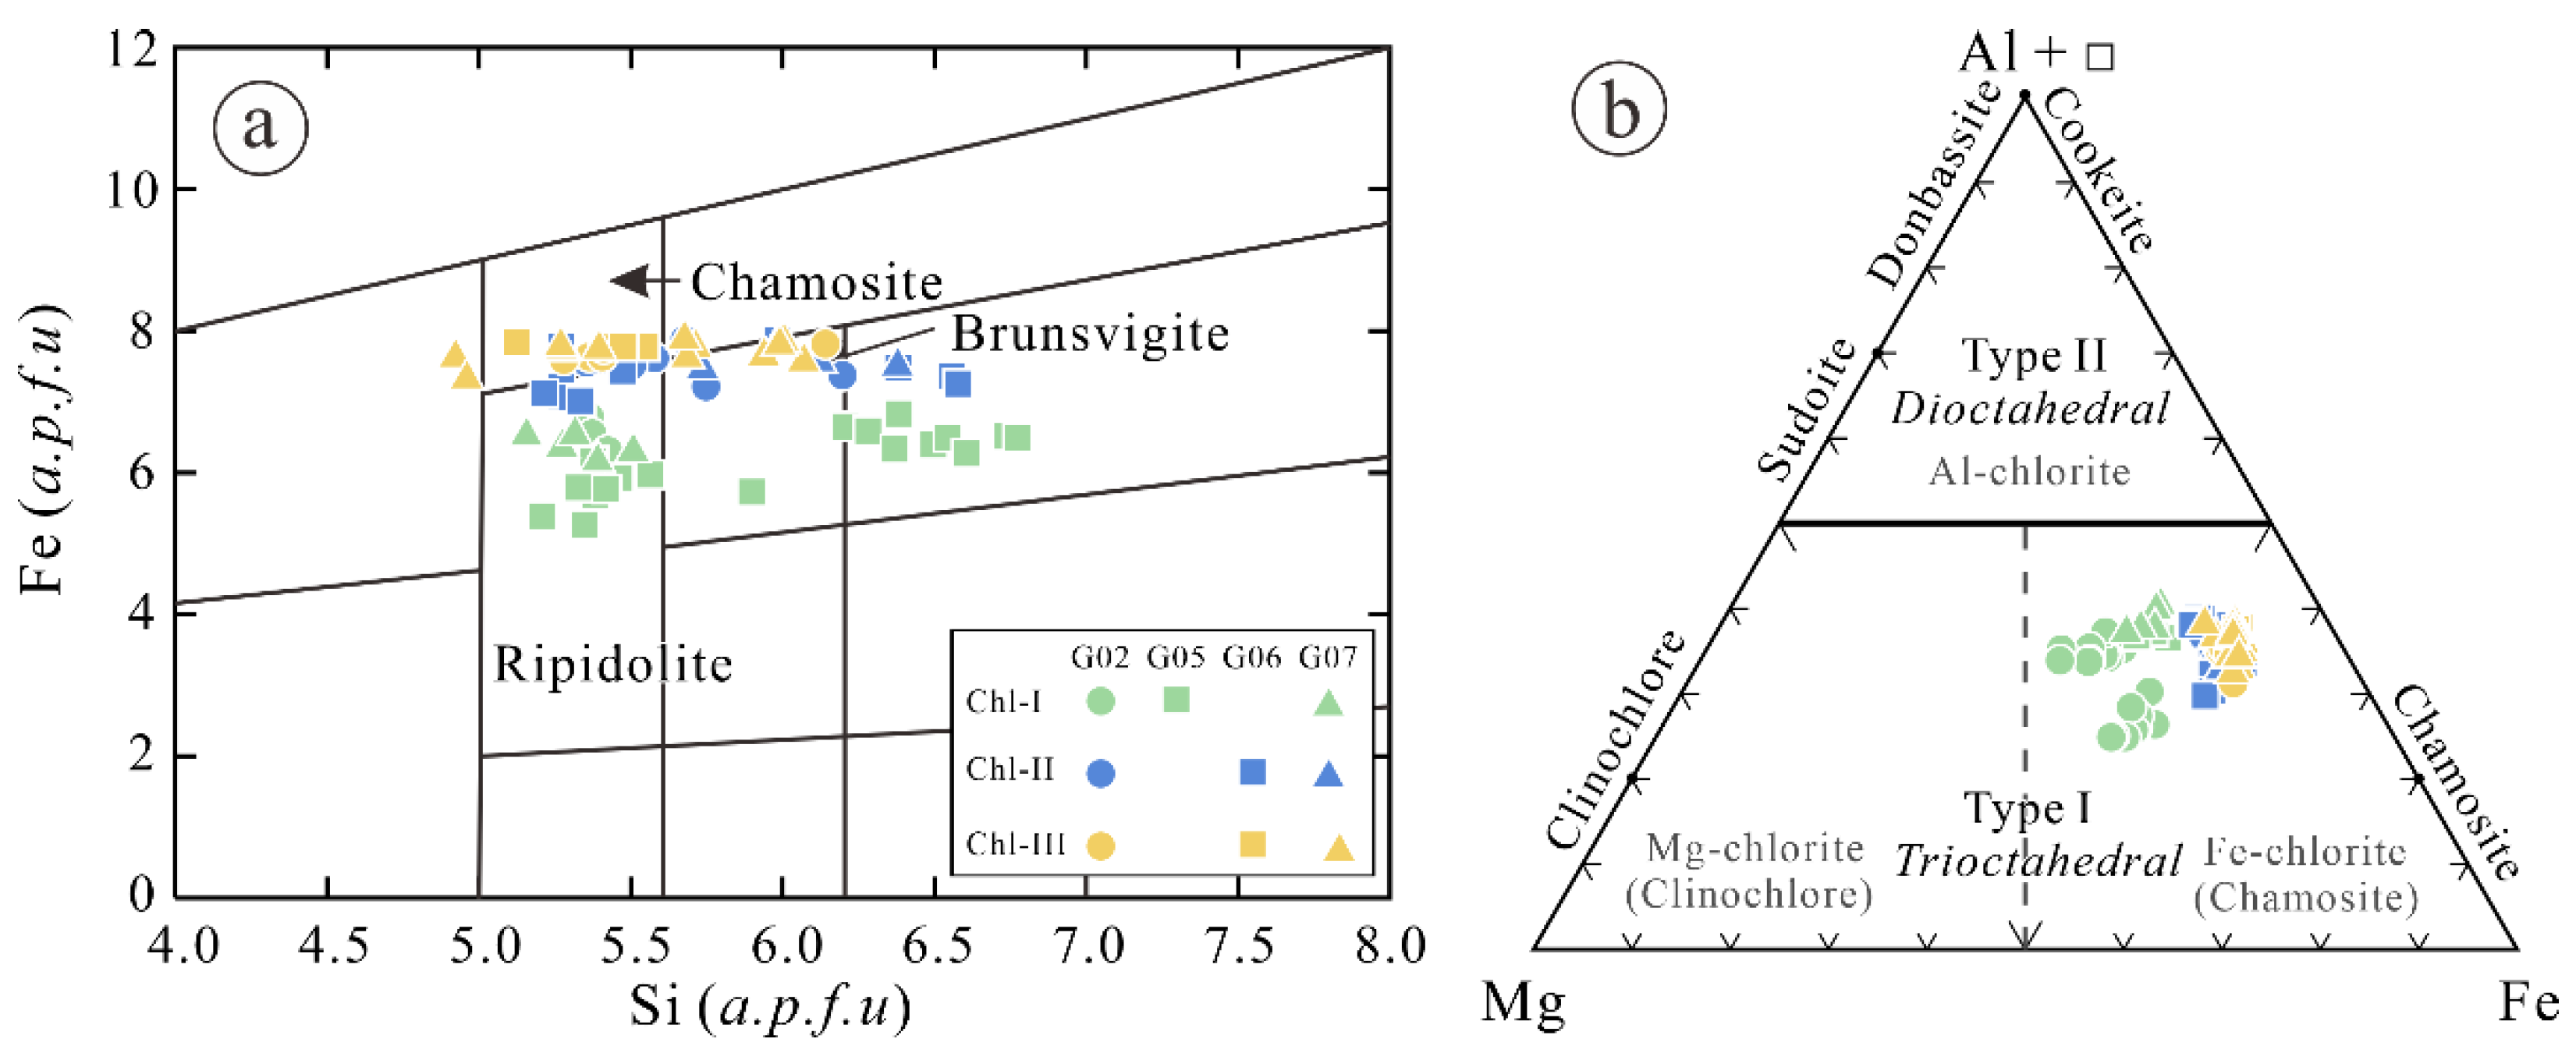
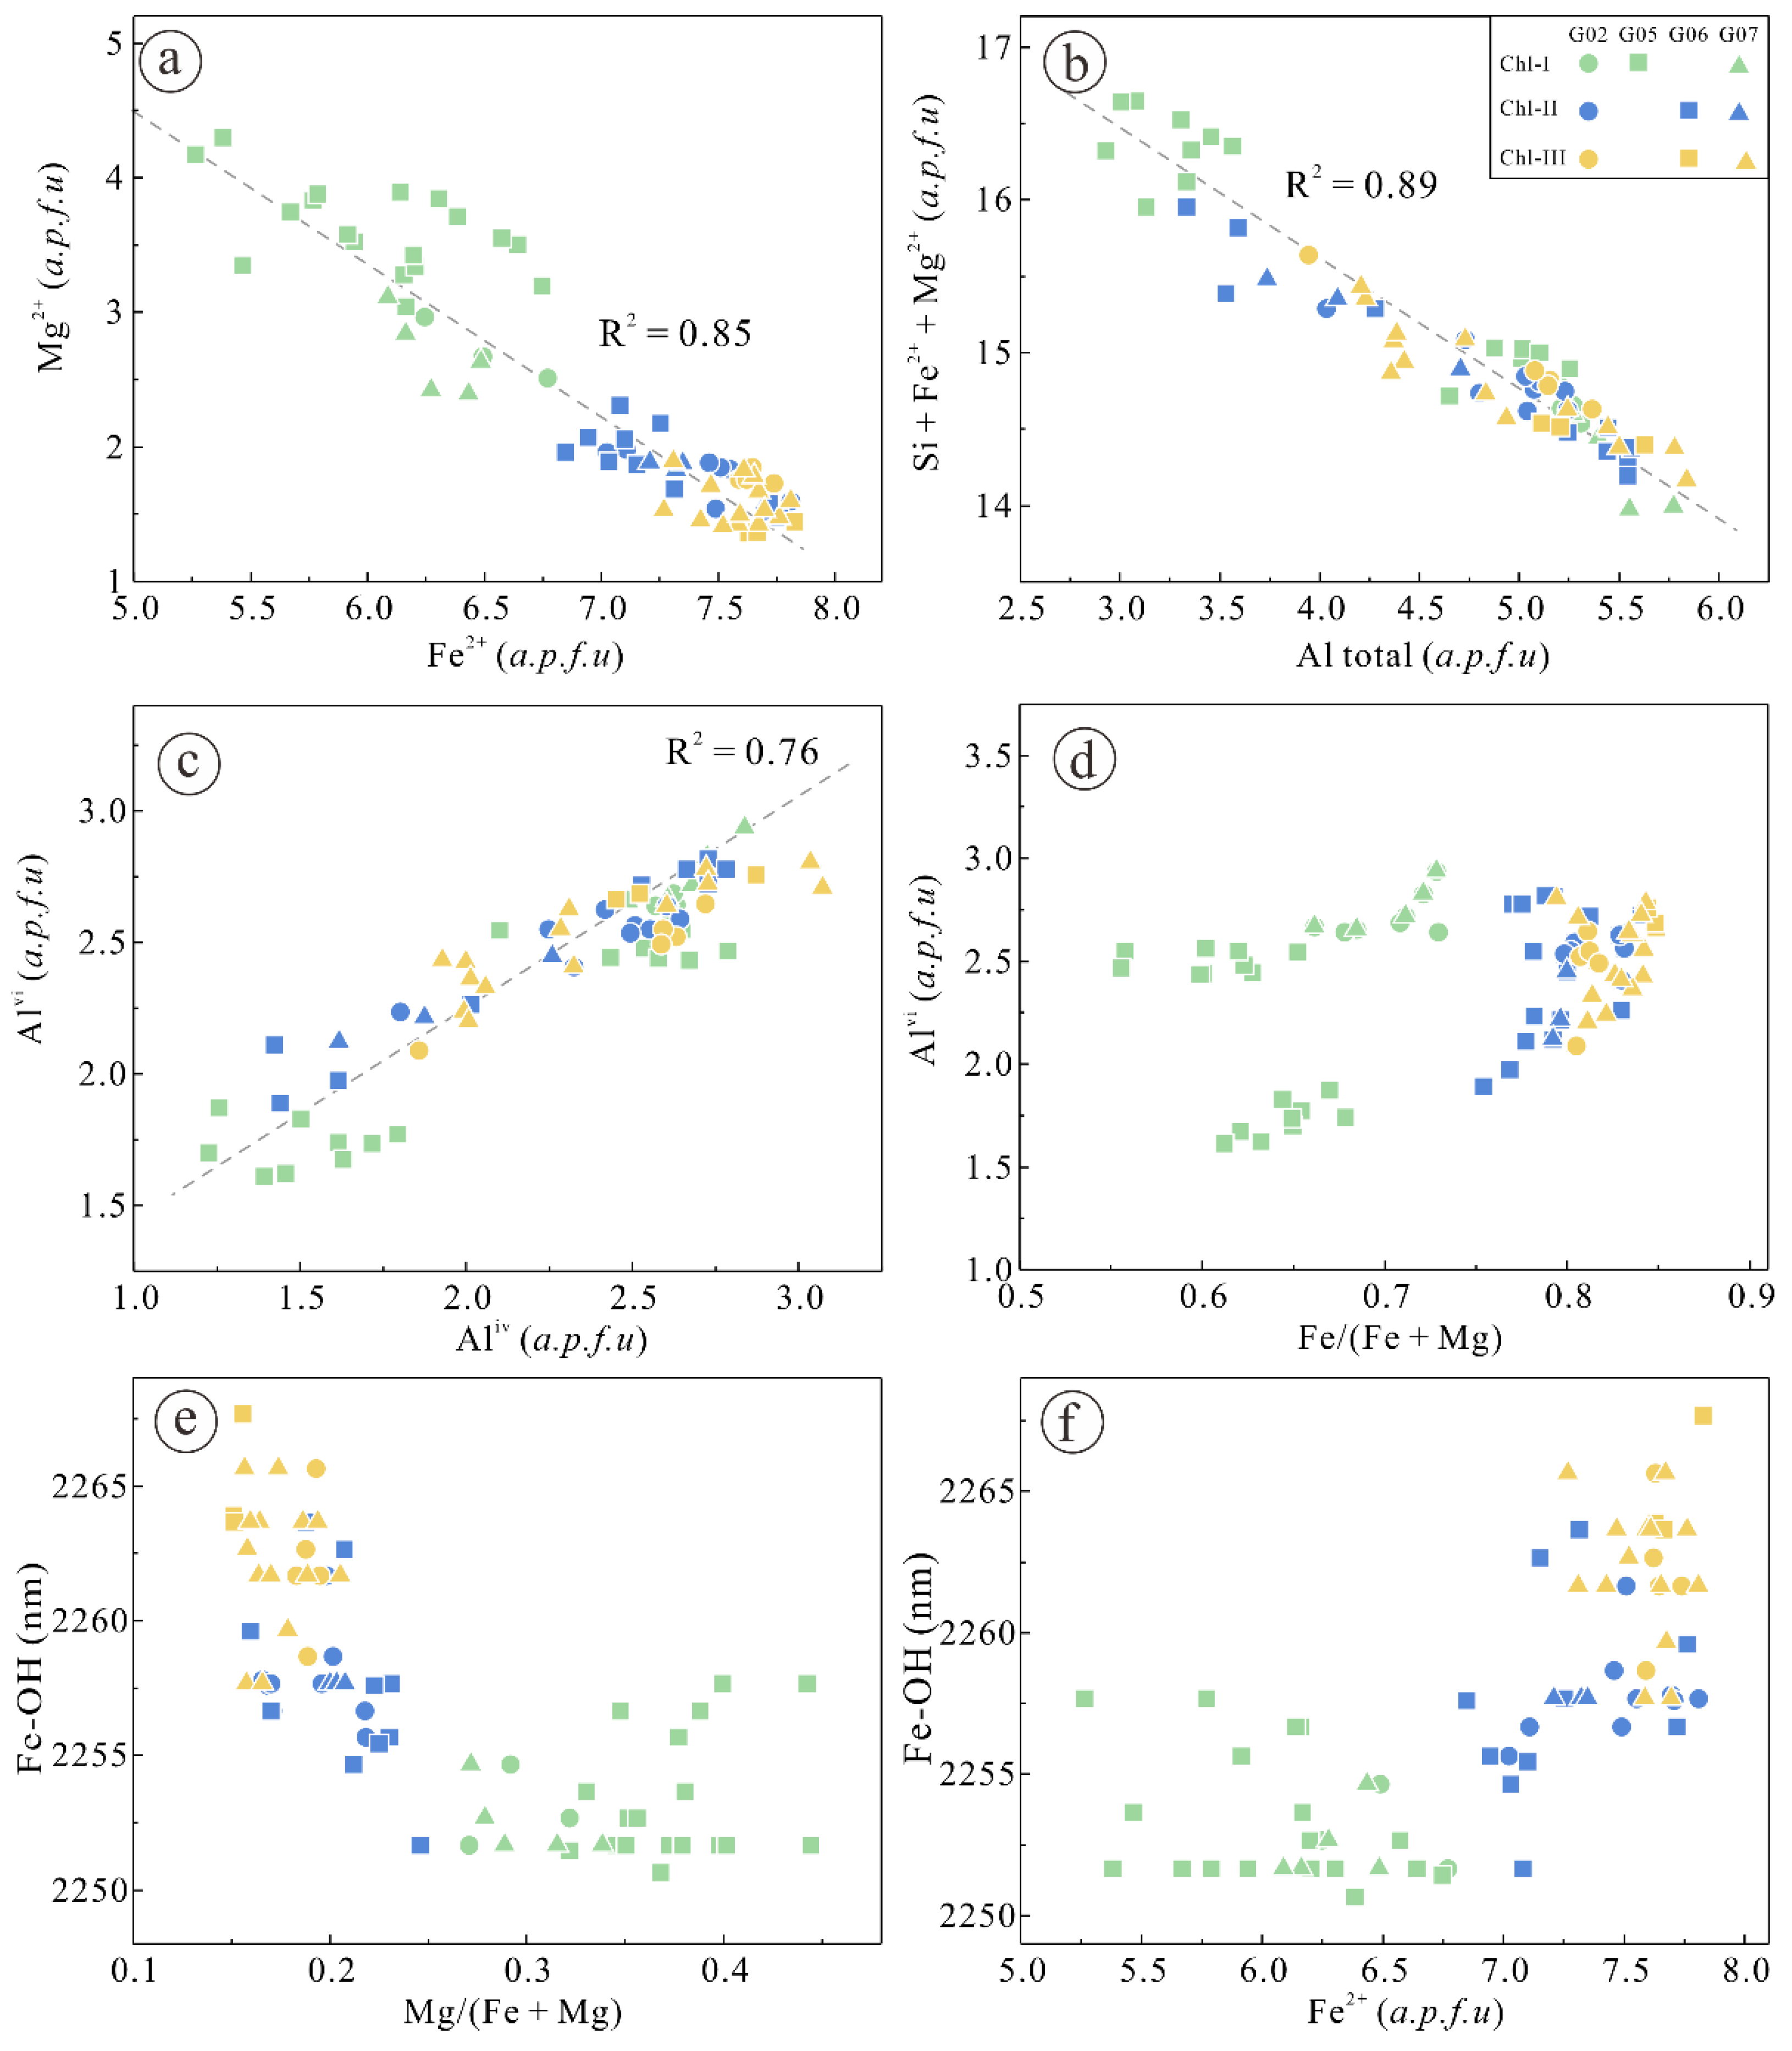
4.3. EPMA of Chlorite

According to the judgment index proposed by Foster [8], the value of (CaO + Na2O + K2O) of chlorites in this study are all <0.5 wt.%, suggesting they are uncontaminated, and the electronic probe data are all valid. Valid EPMA geochemical data for the chlorite are listed in Supplementary Table S1. As shown in Figure 5b, all chlorites are trioctahedral chlorites, and they are all rich in iron. Among them, Chlorite-I is Fe-Mg chlorite containing the highest Mg content while Chlorite-III is Fe-chlorite with the lowest Mg content. The Mg component in Chlorite-II is between Chlorite-I and -III. In the Fe-Si (atomic number) diagram of chlorite (Figure 4a, the atomic number of Fe and Si is converted to 28 oxygen atoms), the measured chlorites are mainly divided into three categories: chamosite, ripidolite, and brunsvigite. Each sample is composed of more than one type of chlorite. On the whole, there is a distinct chemical composition difference between G05 and other chlorites. G02 and G06 are similar, and the two have higher Fe content than G07, but the difference is weak.
Chlorite-I is in the high-grade magnetite ore, with various SiO2 (18.52–30.81wt.%), Al2O3 (11.22–21.86 wt.%), FeOT (28.58–35.75 wt.%), MgO (7.16–13.18 wt.%) contents. Chlorite II is closer to the iron ore in space. The content of SiO2 is 21.35–26.94wt.%, Al2O3 (14.50–21.33 wt.%), FeOT (32.76–41.21 wt.%), MgO (3.90–8.66 wt.%) and only one point of SiO2 at 36.97 wt.%. Chlorite-III chlorite varies SiO2 (22.40–28.55wt.%), Al2O3 (12.23–21.70 wt.%), FeOT (32.17–39.17 wt.%), MgO (5.30–9.34 wt.%) contents.
Among the three types of chlorites in the Gongchangling deposit, Fe2+ and Mg2+ at the octahedral position exhibit an apparent negative correlation (Figure 5a), R2 = 0.85. The scatterplot of Si + Fe2+ + Mg2+ vs. Altotal also shows a negative correlation (Figure 5b), R2 = 0.89, resulting from the Tschermark substitution, which is consistent with the positive correlation between Alvi and Aliv (Figure 5c). 3(Mg2+, Fe2+) ⇔ □ + 2Alvi also accounts for a large part of the substitution. In contrast, a weak correlation is displayed by Aliv Fe/(Fe + Mg) (Figure 5d), implying the R2+ makes little difference on Aliv. The wavelength position of Fe-OH displayed a slight correlation with Mg#{Mg/(Mg + Fe)} (Figure 5e) and Fe2+ (Figure 5f).

4.4. Whole Rock Geochemistry

4.4.1. Major Elements

Whole rock geochemical analysis of magnetite rich ore and altered surrounding rocks is conducted to gain the change tendency of the chemical components, as shown in Table 1 for the test data of the major elements. They are characterized by great variations in SiO2 (29.60–58.56%), with an average of 41.29%, Fe2O3T (10.75–44.40%), with an average of 32.01%, and Al2O3 (13.99–19.17%), with an average of 17.08%.
The value of CaO + K2O + Na2O ranged from 0.23 to 0.46 wt.% in alteration rocks and were 7.40–10.69 wt.% in plagioclase amphibolite gneiss. CaO, K2O, and Na2O have active chemical properties, so the content of these oxides in the strongly altered rock is significantly less than that of plagioclase amphibolite gneiss. The difference in the major element composition between the altered rock and outer plagioclase amphibolite gneiss is mainly the contents of SiO2, Al2O3, MgO, TFe2O3. The content of MgO in altered rocks ranged from 2.30–7.63 wt.%, which is significantly lower than that of plagioclase amphibolite gneiss with the content of 6.87–7.12 wt.%. The content of Al2O3 and TFe2O3 in altered rocks were from 17.88–19.17 wt.% and 37.05–38.94 wt.%, respectively, which is significantly higher than that of plagioclase amphibolite gneiss with 13.99–14.63 wt.% Al2O3 and 10.09–10.57 TFe2O3 wt.%.

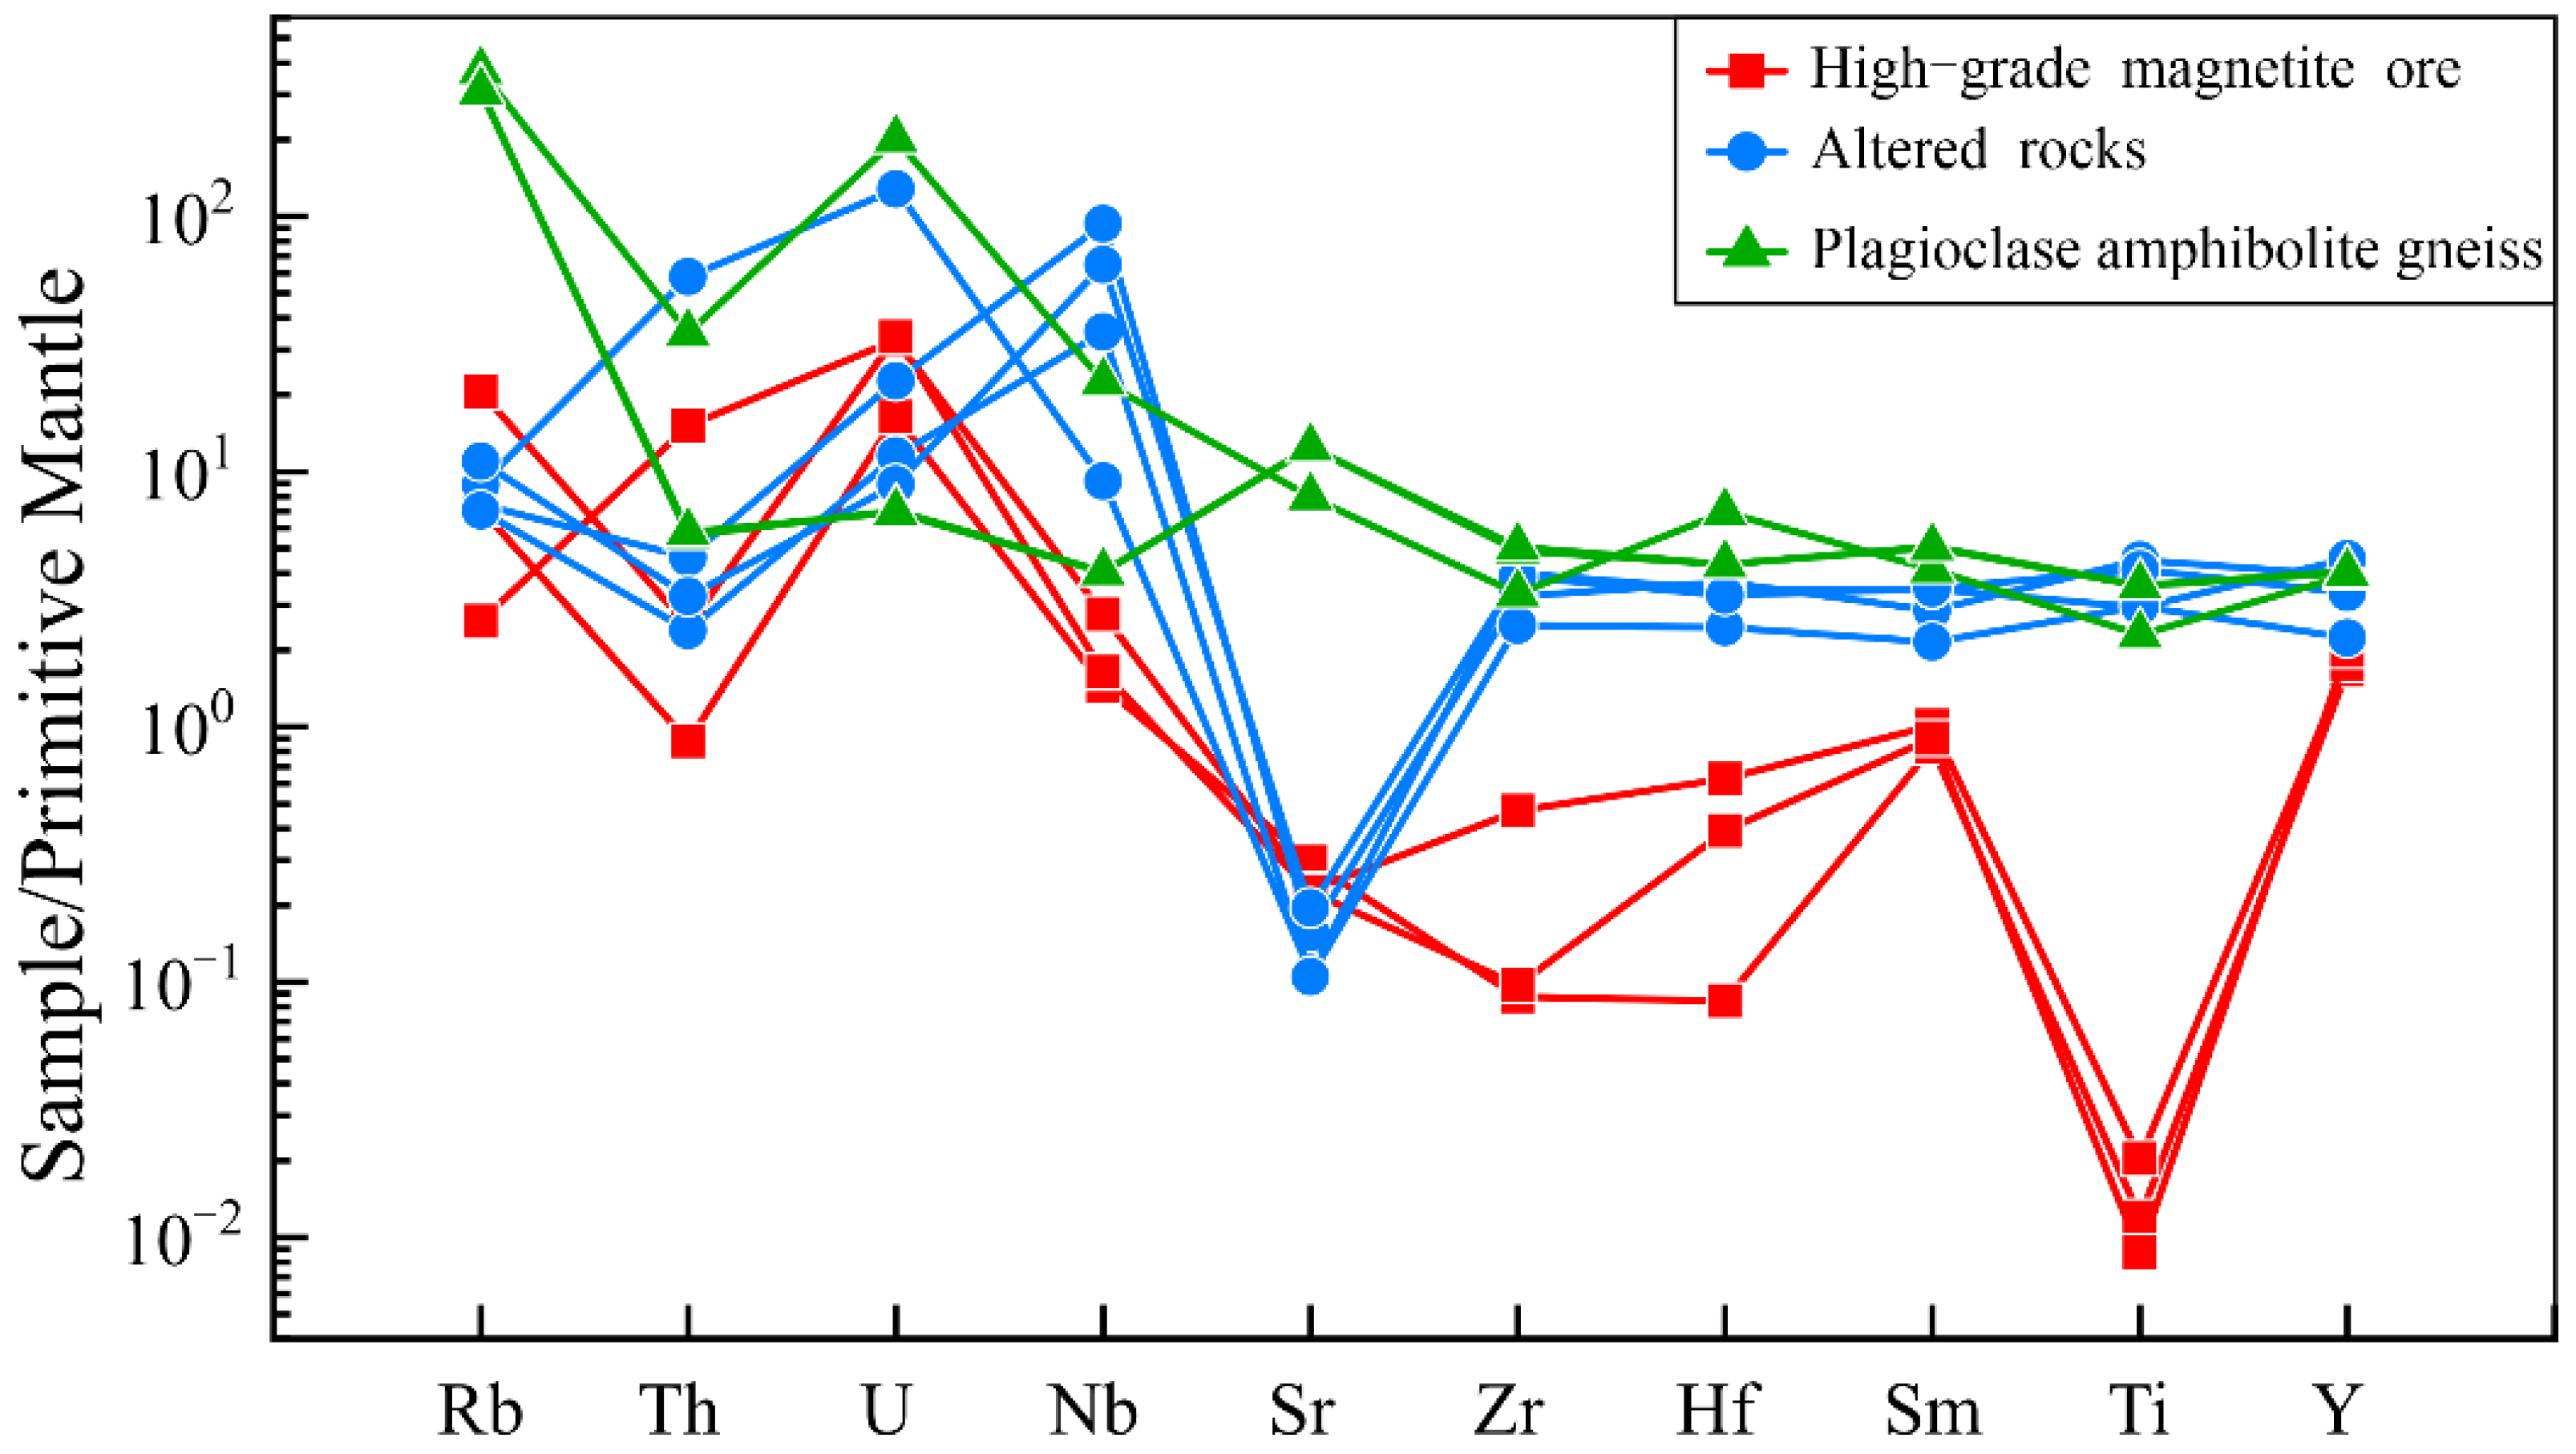
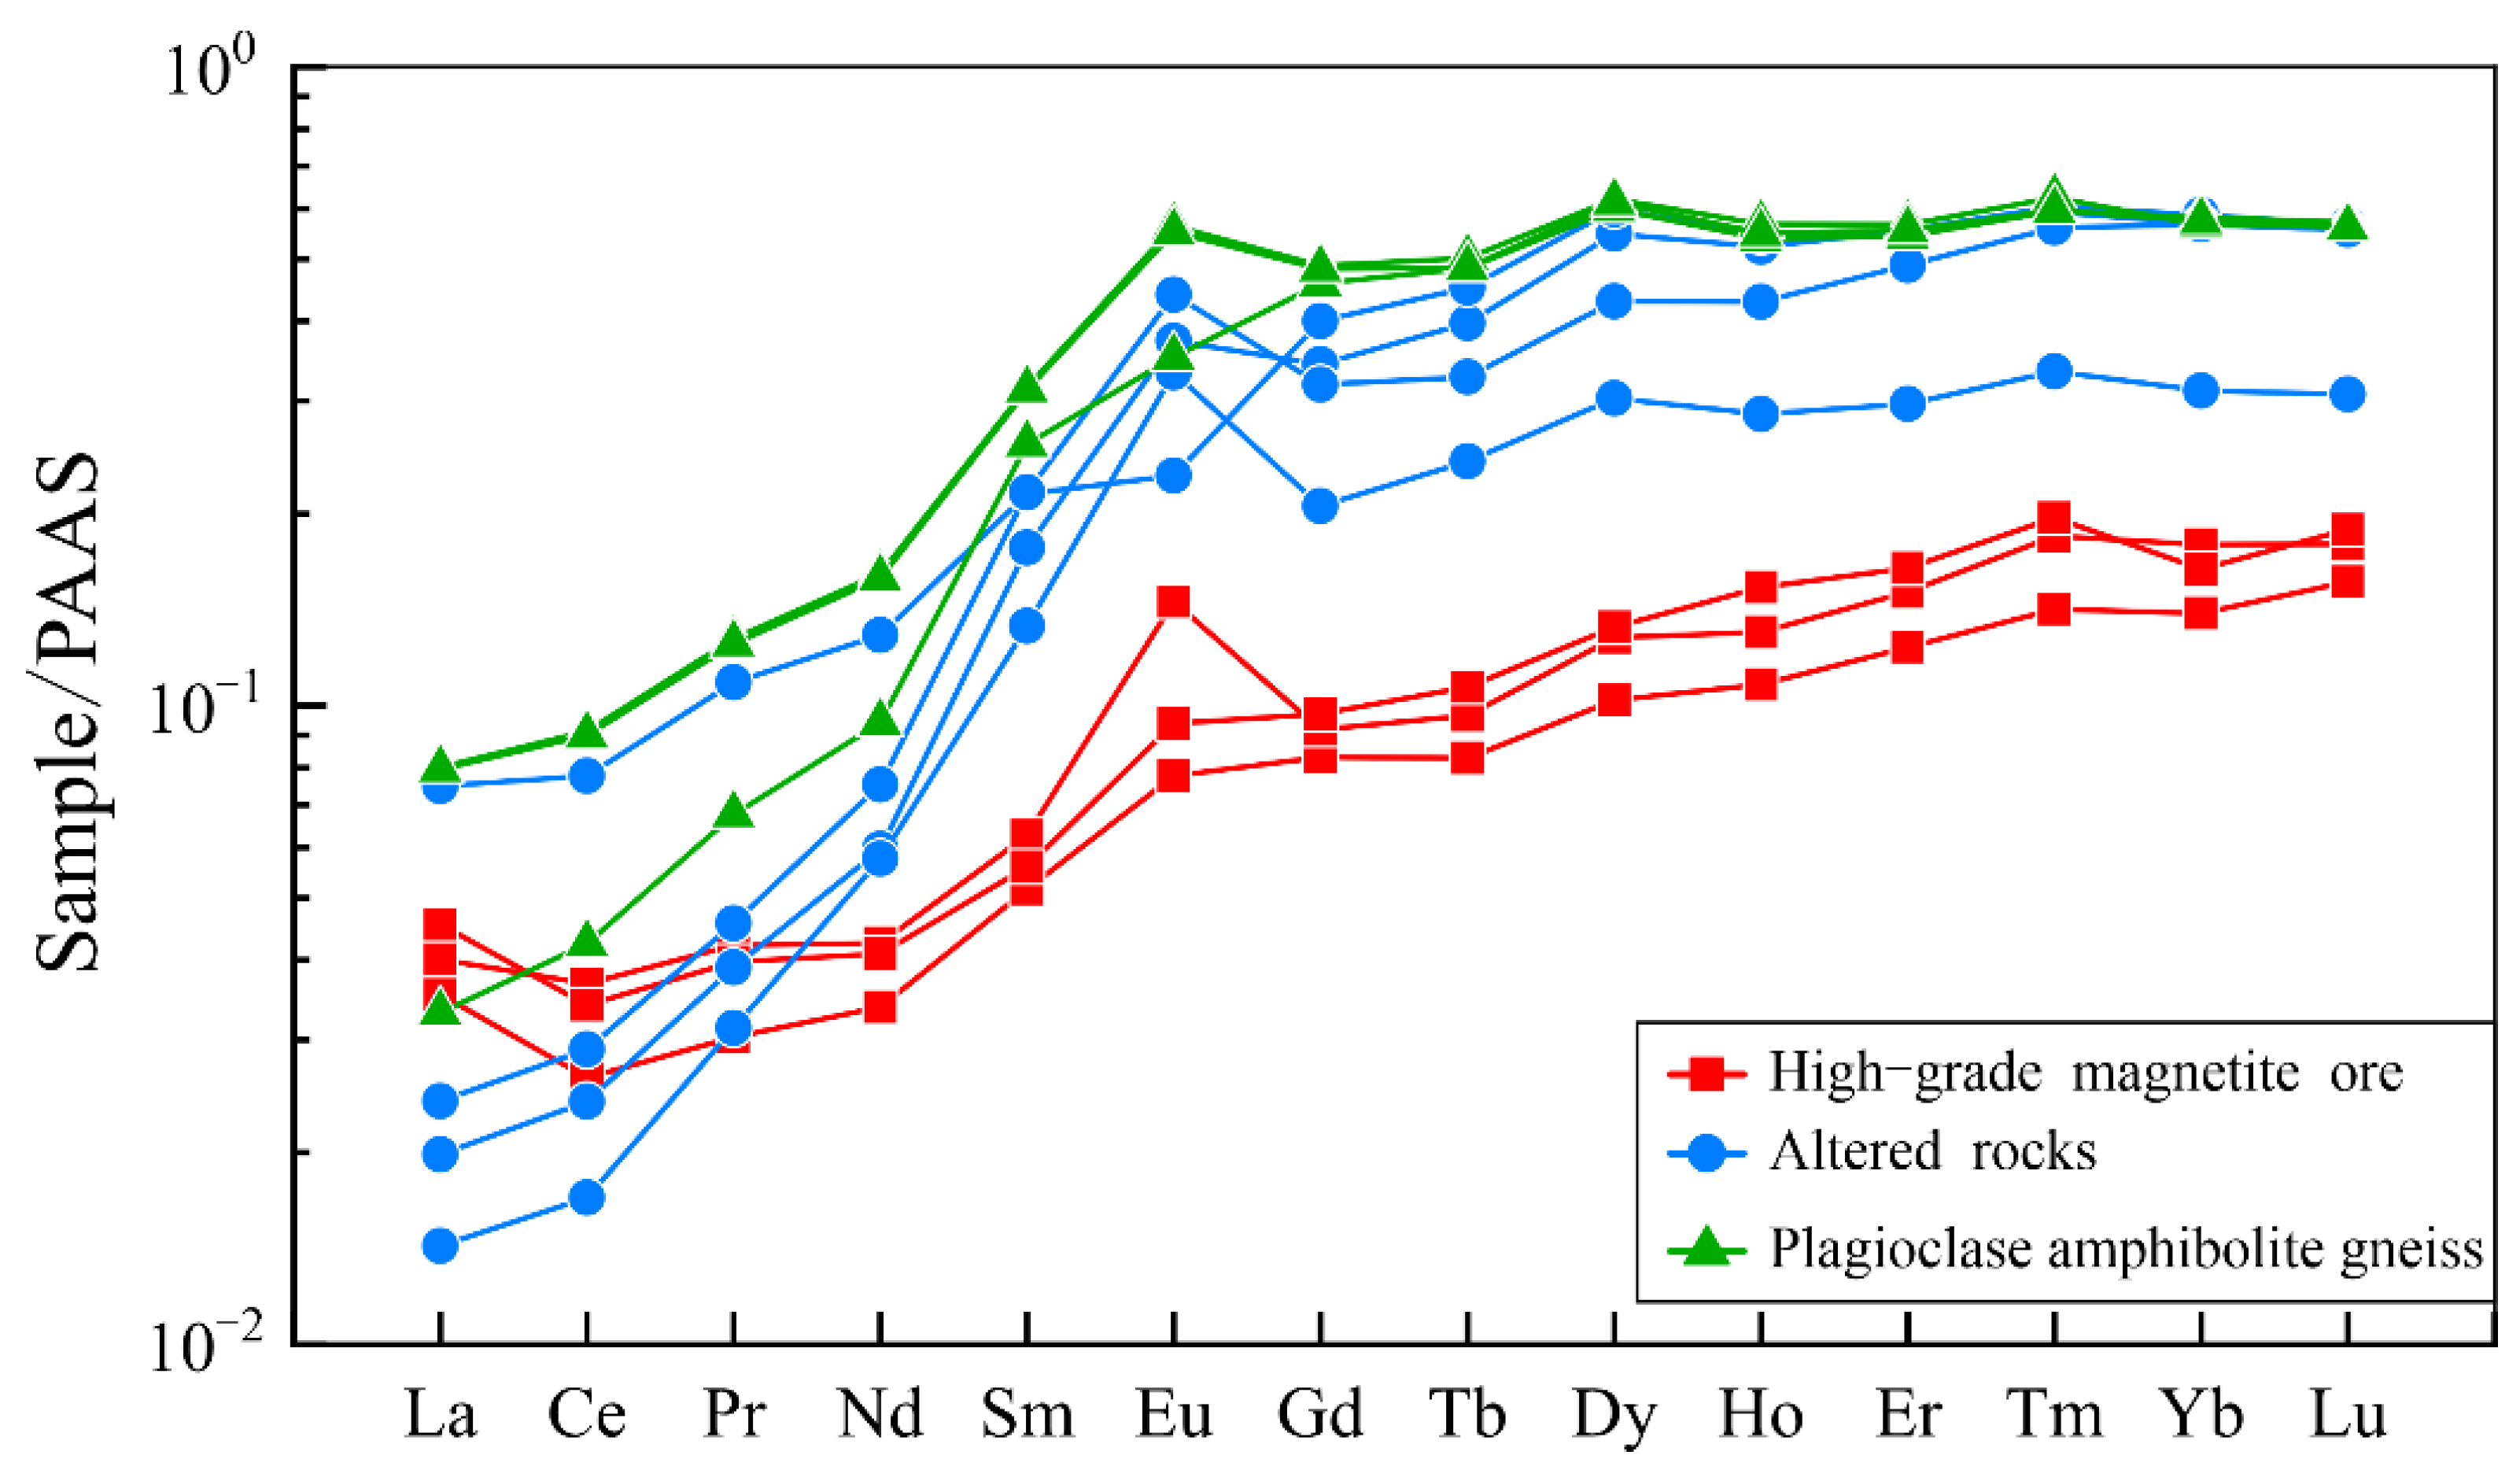
4.4.2. Trace and Rare Earth Elements

The trace element standardization curve, with primitive mantle, of magnetite-rich ore and altered rock has a slight dip to the right (Figure 6). The content of compatible elements Sc, Co, Ni, and Cu in altered rock is relatively high, and it is similar to the content of these elements in amphibolite (Table 2). Elements Li, Ti, and V in magnetite-rich ore are strongly depleted, and Ti, Mn, and V are strongly enriched in altered rock and amphibolite. The large ion lithophile elements (also known as “low field strength elements”) Zr and Sr are depleted, and Rb enriched in magnetite-rich ore, while Rb and Sr are enriched in amphibolite.
The rare earth element analysis results of magnetite-rich ore and altered rock are shown in Table 3, and the distribution curve of rare earth elements standardized by PAAS is shown in Figure 7. The curve shows a left-leaning characteristic as a whole. Light rare earth elements are relatively depleted, while heavy rare earth elements are relatively enriched. La, Ce, and Nd are relatively enriched in magnetite-rich ore, and the overall Eu is a positive anomaly in all samples. Ce, Nd, and Dy are relatively enriched in altered rocks. There is a La positive anomaly, Y positive anomaly in magnetite-rich ore with Y/Ho = 44.06–52.49; a La negative anomaly, Y positive anomaly in altered rock, with Y/Ho = 25.53–44.06; the plagioclase ∑REE average value is 8.31 × 10⁻⁶ in magnetite-rich ore, 16.19 × 10⁻⁶ in altered rock, and 25.52 × 10⁻⁶ in amphibolite.

5. Discussion

5.1. The Spectral Implication for Alteration Processes

In the Gonghcangling deposit, the chlorite in altered rocks was divided into three categories according to the wavelength position. The wavelength position of the chlorite-I is approximately 2250–2255 nm. The chlorite-II is identified by the wavelength position of 2255–2260 nm, and chlorite-III defined the wavelength position of 2260–2265 nm. This spectral classification is similar to the results by Yang et al. (2005), who documented Mg-Fe chlorite associated with the Fe-OH absorption feature wavelengths between 2256 and 2262 nm [28].
In chlorite, Fe2+ and Mg2+ are located in octahedral layers, and -OH in chlorite occupied the vertexes of octahedral [29]. The Fe substitution for Mg in chlorites indirectly weakens the surplus negative charge of the oxygen and leads to an increase in the O-OH distance, and further decreases the frequency of the OH stretching band [30], which is the main reason for the Fe-OH wavelength position shift. The Mg# of chlorite in the Gongchangling deposit exhibited variation ranges with 0.32–0.44 in chlorite-I, 0.20–0.34 in chlorite-II, and 0.15–0.23 in chlorite-III. This variation conformed to the range of wavelength positions of Fe-OH.
The content of Fe and Mg depends on many factors during the hydrothermal alteration processes, such as the water/rock ratio [31], the geochemical composition of hydrothermal fluids [32], and fluid temperature [33]. In the Gongchangling deposit, the superimposed hydrothermal fluids were dominantly alkaline, which could dissolve much more silica than iron, thus promoting the hydrothermal replacement processes by leaching quartz and local concentration of magnetite to form the high-grade iron ores. [2,34]. The leached silica reacted with adjacent plagioclase amphibolites, forming chloritization [35]. Therefore, the chemical composition of fluids, wall rocks and mineral types were identical, indicating that the water/rock ratio and/or fluid temperature may determine the chemical composition of chlorite.
In the Gongchangling deposit, the Fe-Mg chlorite was mainly enriched in the sample of G05, whereas the Fe-chlorite primary occurred in the G07. The chlorite containing intermediate Mg content between Fe-Mg chlorite and Fe-chlorite is mainly hosted in the G06, located at the middle site between G05 and G07. According to the spectral images, the wavelength position shifts towards the longer wavelengths with the increase in distance from the high-grade ores. The result reflects that the wavelength position of Fe-OH in chlorite in the Gongchangling deposit is probably related to water/rock ratio.

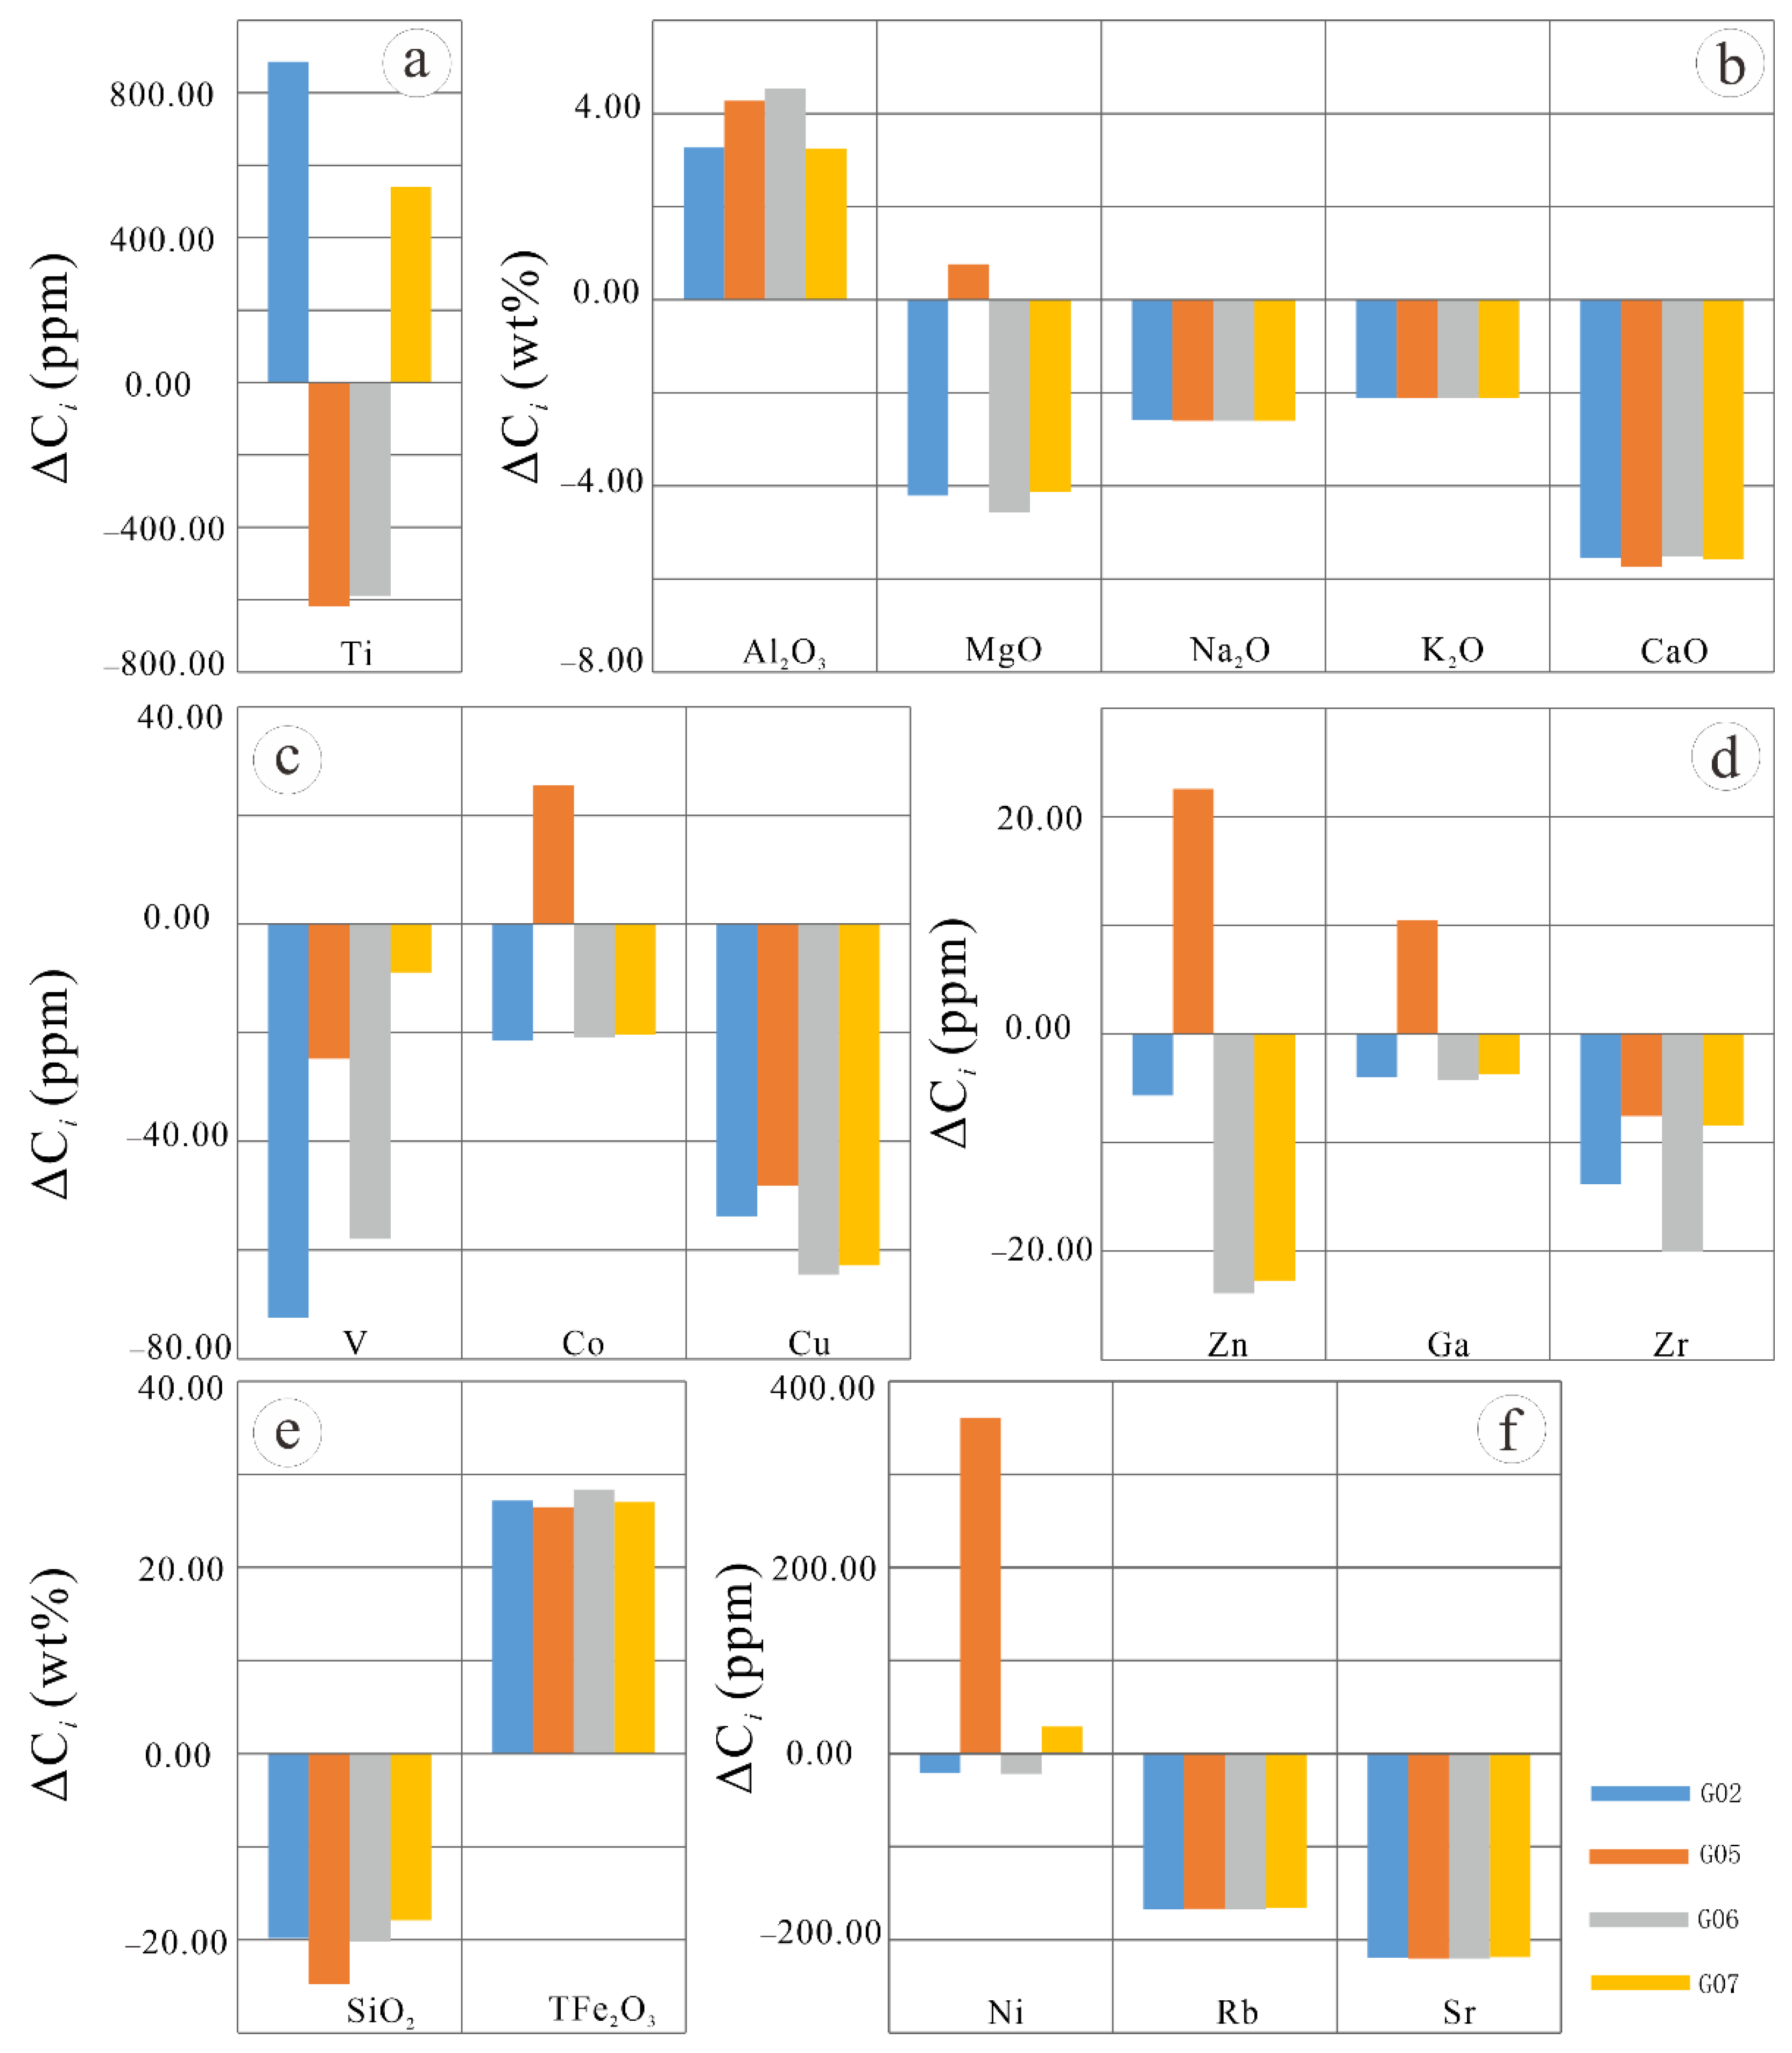
5.2. The Elemental Migration and Concentration during Alteration Processes

In the process of alteration, the transfer of specific components represents the corresponding geological process. In this study, the mass balance calculation method based on whole-rock geochemistry is applied to understand the gain and loss behaviors of specific chemical components [36,37,38]. According to observation under microscope, we assumed the amphibolite G09 was the unaltered rock. The gains and losses (△Ci) of altered rocks, G05, G02, G06, and G07, are calculated on the basis of unaltered rock G09. The enrichment of major compositions of Al2O3 and TFe2O3, and the depletion of SiO2 (Figure 8b,e) suggested mineralization with the loss of silicon and concentration of iron during the hydrothermal alteration process. Alkali metal elements such as K, Na, Ca, Mg (Figure 8b), with high active properties, are obviously depleted during hydrothermal alteration. The elemental group of Rb, Sr, Ni, V, Ti and Co are easily leached out from bearing-rocks by fluids. These elements are thus always enriched in continental crust, while being depleted in a submarine environment [39]. In our study, these elements all displayed the loss trend in alteration rocks (Figure 8a,c,f). We inferred that the alteration processes were occurring in a submarine environment and were related to submarine hydrothermal fluids, which is also proved by the loss of Zr (Figure 8d). The migration of Cu and Zn indicated that the later fluid is alkaline. It is worthy to note that the G05, hosting Chlorite-II, obviously enriched Co, Ni, Zn, Ga (Figure 8c,d,f), which may result from the purification in the enrichment process of iron ore.

6. Conclusions

  • Hyperspectral imaging is a reliable and diagnostic method to divide the sub-types of chlorite. Based on the Fe-OH band near 2250 nm, three wavelength position ranges of chlorite were identified in the Gongchangling deposit, including 2250–2255 nm for chlorite-I, 2255–2260 nm for chlorite-II, and 2260–2265 nm for chlorite-III. The chlorite-I defined a high Mg content, while chlorite-III presented high Fe content. The Mg and Fe content in chlorite-II has an intermediate value between chlorite-I and chlorite-II.
  • The Fe-Mg chlorite enriched in alteration rocks was close to the iron ores, whereas Fe chlorite primarily occurred in rocks distal from high-grade iron ores. The chlorite with intermediate Mg and Fe content is dominantly distributed in the intermediate. This distribution pattern was probably determined by the water/rock ratio and temperature of fluid.
  • The formation of high-grade magnate ores was attributed to the concentration of iron and the loss of silicon during submarine magmatic hydrothermal alteration processes.

Supplementary Materials

The following are available online at https://0-www-mdpi-com.brum.beds.ac.uk/article/10.3390/min12050629/s1, Table S1: EPMA data of chlorite in the Gongchangling deposit.

Author Contributions

Conceptualization and writing—original draft preparation, E.W.; Writing—review and editing and supervision, K.S.; methodology and software, Y.Y. and J.F.; validation, S.M. and D.H. All authors have read and agreed to the published version of the manuscript.

Funding

This research was funded by the National Key Research and Development Program of China (grant 2016YFC0801603) and the Fundamental Research Funds for the Central Universities: (grant N2123029, N2123030).

Acknowledgments

We thank DiMap for access to the HySpex instruments used in the PSML, and we are also deeply indebted to the Gongchangling iron deposit, Anshan Iron and Steel Group, for their kind help in field investigation and sampling.

Conflicts of Interest

The authors declare no conflict of interest.

References

  1. Li, L.-X.; Zi, J.-W.; Li, H.-M.; Rasmussen, B.; Wilde, S.A.; Sheppard, S.; Ma, Y.-B.; Meng, J.; Song, Z. High-Grade Magnetite Mineralization at 1.86 Ga in Neoarchean Banded Iron Formations, Gongchangling, China: In Situ U-Pb Geochronology of Metamorphic-Hydrothermal Zircon and Monazite. Econ. Geol. 2019, 114, 1159–1175. [Google Scholar] [CrossRef]
  2. Wang, E.-D.; Xia, J.-M.; Fu, J.-F.; Jia, S.-S.; Men, Y.-K. Formation mechanism of Gongchangling high-grade magnetite deposit hosted in Archean BIF, Anshan-Benxi area, Northeastern China. Ore Geol. Rev. 2014, 57, 308–321. [Google Scholar] [CrossRef]
  3. Han, C.; Xiao, W.; Su, B.-X.; Sakyi, P.A.; Chen, Z.; Zhang, X.; Ao, S.; Zhang, J.; Wan, B.; Zhang, Z.; et al. Formation age and genesis of the Gongchangling Neoarchean banded iron deposit in eastern Liaoning Province: Constraints from geochemistry and SHRIMP zircon U–Pb dating. Precambrian Res. 2014, 254, 306–322. [Google Scholar] [CrossRef]
  4. Li, L.; Li, H.-M.; Liu, M.-J.; Yang, X.-Q.; Meng, J. Timing of deposition and tectonothermal events of banded iron formations in the Anshan–Benxi area, Liaoning Province, China: Evidence from SHRIMP U-Pb zircon geochronology of the wall rocks. J. Asian Earth Sci. 2016, 129, 276–293. [Google Scholar] [CrossRef]
  5. Zheng, Z.; Lan, H. Discussion on geological characteristics and genesis of Gongchangling Rich iron ore deposit. Mod. Mine 2009, 25, 67–70. (In Chinese) [Google Scholar]
  6. Hillier, S.; Velde, B. Octahedral occupancy and the chemical composition of diagenetic (low-temperature) chlorites. Clay Miner. 2018, 26, 149–168. [Google Scholar] [CrossRef]
  7. Inoue, A.; Kurokawa, K.; Hatta, T. Application of Chlorite Geothermometry to Hydrothermal Alteration in Toyoha Geothermal System, Southwestern Hokkaido, Japan. Resour. Geol. 2010, 60, 52–70. [Google Scholar] [CrossRef]
  8. Foster, M.D. Interpretation of the composition and a classification of the chlorites. U.S. Gov. Print. Off. 1962, 414, 1–33. [Google Scholar] [CrossRef] [Green Version]
  9. Lauf, R.J. Collector’s Guide to the Chlorite Group. Rocks Miner. 2010, 85, 318–325. [Google Scholar] [CrossRef]
  10. Miyashiro, A.; Shido, F. Tschermak Substitution in Low- and Middle-grade Pelitic Schists. J. Pet. 1985, 26, 449–487. [Google Scholar] [CrossRef]
  11. Laakso, K.; Rivard, B.; Peter, J.M.; White, H.P.; Maloley, M.; Harris, J.; Rogge, D. Application of Airborne, Laboratory, and Field Hyperspectral Methods to Mineral Exploration in the Canadian Arctic: Recognition and Characterization of Volcanogenic Massive Sulfide-Associated Hydrothermal Alteration in the Izok Lake Deposit Area, Nunavut, Canada. Econ. Geol. 2015, 110, 925–941. [Google Scholar] [CrossRef]
  12. Hunt, G.R. Spectra of altered rocks in the visible and near infrared. Econ. Geol. 1979, 74, 1613–1629. [Google Scholar] [CrossRef]
  13. Bourdelle, F.; Parra, T.; Beyssac, O.; Chopin, C.; Vidal, O. Clay minerals as geo-thermometer: A comparative study based on high spatial resolution analyses of illite and chlorite in Gulf Coast sandstones (Texas, U.S.A.). Am. Miner. 2013, 98, 914–926. [Google Scholar] [CrossRef]
  14. Bishop, J.L.; Lane, M.D.; Dyar, M.D.; Brown, A.J. Reflectance and emission spectroscopy study of four groups of phyllosilicates: Smectites, kaolinite-serpentines, chlorites and micas. Clay Miner. 2008, 43, 35–54. [Google Scholar] [CrossRef]
  15. Clark, R.N.; Swayze, G.A.; Wise, R.A.; Livo, K.E.; Hoefen, T.M.; Kokaly, R.F.; Sutley, S.J. USGS Digital Spectral Library splib06a; Data Series 231; USGS: Reston, VA, USA, 2007.
  16. Post, J.L.; Noble, P.N. The Near-Infrared Combination Band Frequencies of Dioctahedral Smectites, Micas, and Illites. Clays Clay Miner. 1993, 41, 639–644. [Google Scholar] [CrossRef]
  17. Duke, E.F. Near infrared spectra of muscovite, Tschermak substitution, and metamorphic reaction progress: Implications for remote sensing. Geology 1994, 22, 621–624. [Google Scholar] [CrossRef]
  18. Song, K.; Wang, E.; Yao, Y.; Fu, J.; Hao, D.; You, X. Spectral Alteration Zonation Based on Close Range HySpex-320 m Imaging Spectroscopy: A Case Study in the Gongchangling High-Grade Iron Ore Deposit, Liaoning Province, NE China. Appl. Sci. 2020, 10, 8369. [Google Scholar] [CrossRef]
  19. Li, H.; Zhang, Z.; Li, L.; Zhang, Z.; Chen, J.; Yao, T. Types and general characteristics of the BIF-related iron deposits in China. Ore Geol. Rev. 2014, 57, 264–287. [Google Scholar] [CrossRef]
  20. Li, H.-M.; Li, L.-X.; Yang, X.-Q.; Cheng, Y.-B. Types and geological characteristics of iron deposits in China. J. Asian Earth Sci. 2015, 103, 2–22. [Google Scholar] [CrossRef]
  21. Li, H.-M.; Yang, X.-Q.; Li, L.-X.; Zhang, Z.-C.; Liu, M.-J.; Yao, T.; Chen, J. Desilicification and iron activation–reprecipitation in the high-grade magnetite ores in BIFs of the Anshan-Benxi area, China: Evidence from geology, geochemistry and stable isotopic characteristics. J. Asian Earth Sci. 2015, 113, 998–1016. [Google Scholar] [CrossRef]
  22. Zhai, M.; Zhu, X.; Zhou, Y.; Zhao, L.; Zhou, L. Continental crustal evolution and synchronous metallogeny through time in the North China Craton. J. Asian Earth Sci. 2020, 194, 104169. [Google Scholar] [CrossRef]
  23. Zhou, S. Geology of BIF Iron Deposits in Anshan-Benxi; Geological Publishing House: Beijing, China, 1994; pp. 1–278. (In Chinese) [Google Scholar]
  24. Boardman, J.W. Inversion of high spectral resolution data. In Imaging Spectroscopy of the Terrestrial Environment; The International Society for Optical Engineering: Bellingham, DC, USA, 1990; Volume 1298, pp. 222–233. [Google Scholar]
  25. Deer, W.A.; Howie, R.A.; Zussman, J. An Introduction to the Rock-Forming Minerals, 2nd ed.; Mineralogical Society of Great Britain and Ireland: London, UK, 2013; ISBN 058-2300-940. [Google Scholar]
  26. Hey, M.H. A new review of the chlorites. Miner. Mag. J. Miner. Soc. 2018, 30, 277–292. [Google Scholar] [CrossRef]
  27. Zane, A.; Weiss, Z. A procedure for classifying rock-forming chlorites based on microprobe data. Rend. Lincei 1998, 9, 51–56. [Google Scholar] [CrossRef]
  28. Yang, K.; Lian, C.; Huntington, J.F.; Peng, Q.; Wang, Q. Infrared spectral reflectance characterization of the hydrothermal alteration at the Tuwu Cu–Au deposit, Xinjiang, China. Miner. Depos. 2005, 40, 324–336. [Google Scholar] [CrossRef]
  29. Eggleston, R.A.; Bailey, S.W. Structural Aspects of Dioctahedral Chlorite. Am. Mineral. 1967, 52, 673–689. [Google Scholar]
  30. Shirzu, H. Infrared Spectra of Trioctahedral Chlorites in Relation to Chemical Composition. Clay Sci. 1985, 6, 167–176. [Google Scholar] [CrossRef]
  31. Zang, W.; Fyfe, W.S. Chloritization of the hydrothermally altered bedrock at the Igarapé Bahia gold deposit, Carajás, Brazil. Miner. Depos. 1995, 30, 30–38. [Google Scholar] [CrossRef]
  32. Parry, W.T.; Downey, L.M. Geochemistry of hydrothermal chlorite replacing igneous biotite. Clays Clay Miner. 1982, 30, 81–90. [Google Scholar] [CrossRef]
  33. Kogure, T.; Banfield, J.F. New insights into the mechanism for chloritization of biotite using polytype analysis. Am. Miner. 2000, 85, 1202–1208. [Google Scholar] [CrossRef]
  34. Evans, K.; McCuaig, T.C.; Leach, D.; Angerer, T.; Hagemann, S. Banded iron formation to iron ore: A record of the evolution of Earth environments? Geology 2013, 41, 99–102. [Google Scholar] [CrossRef]
  35. Wang, K.; Yao, P. China’s Iron Deposit Review; Metallurgy Press House: Beijing, China, 1992; pp. 1–584. (In Chinese) [Google Scholar]
  36. López-Moro, F.J. EASYGRESGRANT—A Microsoft Excel spreadsheet to quantify volume changes and to perform mass-balance modeling in metasomatic systems. Comput. Geosci. 2012, 39, 191–196. [Google Scholar] [CrossRef]
  37. Dong, K.; Chen, S.; Graham, I.; Zhao, J.; Fu, P.; Xu, Y.; Tian, G.; Qin, W.; Chen, J. Geochemical behavior during mineralization and alteration events in the Baiyinchang volcanic-hosted massive sulfide deposits, Gansu Province, China. Ore Geol. Rev. 2017, 91, 559–572. [Google Scholar] [CrossRef]
  38. Grant, J.A. The isocon diagram; a simple solution to Gresens’ equation for metasomatic alteration. Econ. Geol. 1986, 81, 1976–1982. [Google Scholar] [CrossRef]
  39. Klein, C. Some Precambrian banded iron-formations (BIFs) from around the world: Their age, geologic setting, mineralogy, metamorphism, geochemistry, and origins. Am. Miner. 2005, 90, 1473–1499. [Google Scholar] [CrossRef]
Figure 2. Result of mapping mineralogy from Hyspex hyperspectral images. (a) Map of chlorite spectral wavelength position at 2250 nm by Fe-OH, the circles point out the location of single spectrum in (b). (b) The single spectrum of three types of chlorites in the Gongchangling deposit.
Minerals 12 00629 g002
Figure 3. The textures of different chlorite. The photos are collected under microscopy with plane-polarized light (images on the left) and cross-polarized light (images on the right). (a,b) Chlorite-I with abnormal interference color of purple exhibiting straight cantact boundary with garnet; (c,d) Chlorite-II infilled in the fissures of lamellar chlorite (Chl-I) and some anhedral fine grained magnetites were included in it; (e,f) Chlorite-III and anhedral quartz dissolved and replaced garnet.
Minerals 12 00629 g003
Figure 4. Chlorite classification diagrams in the Gongchangling alteration rocks. (a): Si vs. Fe (a.p.f.u) after [26] (b): (Al + □)–Mg–Fe, reprinted with permission from Zane et al., 1998 Ref. [27].
Minerals 12 00629 g004
Figure 5. Correlation scatter plots for the chlorite. (a) Fe2+ vs. Mg2+ (a.p.f.u); (b) Al(total) vs. Si + Fe2+ + Mg2+ (a.p.f.u); (c) Aliv vs. Alvi (a.p.f.u); and (d) Fe/(Fe + Mg) vs. Aliv (a.p.f.u); (e) Fe(total) vs. Pos2250; and (f) Fe/(Fe + Mg) vs. Pos2250.
Minerals 12 00629 g005
Figure 6. Primitive mantle-normalized trace elements patterns of Gongchangling No. 2 Mining Area.
Minerals 12 00629 g006
Figure 7. PAAS-normalized rare earth element patterns in Gongchangling No. 2 Mining Area.
Minerals 12 00629 g007
Figure 8. The results image of the mass balance calculation. (a) The gains and losses of Ti in altered rocks; (b) The gains and losses of major components in altered rocks; (c) The gains and losses of V, Co, and Cu in altered rocks; (d) The gains and losses of Zn, Ga, and Zr in altered rocks; (e) The gains and losses of SiO2 and TFe2O3 in altered rocks; (f) The gains and losses of Ni, Rb, and Sr in altered rocks.
Minerals 12 00629 g008
Table 1. Contents of major elements and related parameters of Gongchangling high-grade magnetite ore, altered wall rock, and amphibolite.
SampleSiO2Al2O3MgONa2OK2OP2O5TiO2CaOTFe2O3MnOLOITOTAL
G011.790.200.100.020.040.010.030.55102.040.05−2.61102.24
G0234.5717.902.660.040.030.030.740.3640.380.181.6398.52
G033.901.050.300.020.020.010.040.7196.0670.08−1.63101.18
G041.880.470.140.030.080.010.030.12101.400.03−2.19102.00
G0529.6018.917.630.030.030.020.480.1741.50 0.134.07102.57
G0634.1619.172.300.030.030.030.500.4044.09 0.15−0.56100.30
G0736.4717.882.740.030.030.030.690.3444.40 0.15−0.17102.59
G0858.5613.997.122.081.790.100.363.5310.75 0.102.87101.26
G0954.3714.636.872.632.140.100.545.9110.92 0.182.00100.30
Notes: high-grade magnetite ore: G01, G03, G04; altered wall rock: G02, G05, G06, G07; amphibolite: G08, G09.
Table 2. Trace element content of Gongchangling magnetite rich ore, altered wall rock and amphibolite.
SampleLiBeScTiVMnCoNiCuZnGaRbSrYZrNbMoSnHfTaWTlPbThU
G010.67 0.65 0.32 11.462.34 523.96 4.14 9.78 5.15 23.94 2.013.915.28 5.67 0.73 0.810.8516.08 0.02 0.09 3.79 0.01 0.43 0.06 0.30
G0267.18 2.54 49.47 4321.15148.11 1616.99 23.00 54.77 13.96 53.16 9.534.092.77 13.35 26.95 52.470.243.84 1.00 52.19 1.17 0.04 4.45 0.29 0.41
G031.40 0.67 1.13 19.502.24 782.05 8.02 20.90 5.61 12.75 1.361.434.07 6.01 3.90 1.550.570.49 0.17 0.48 1.32 0.01 0.46 0.97 0.59
G041.00 0.29 0.78 8.374.85 301.92 22.63 22.24 1.75 45.24 3.3311.294.03 6.76 0.81 0.92 1.12 7.39 0.11 1.55 2.22 0.18 2.38 0.16 0.61
G0531.44 1.06 28.74 2817.45195.84 1184.03 69.98 436.67 19.57 81.38 23.994.871.93 15.44 33.23 5.13 0.50 1.85 0.93 10.79 1.00 0.04 2.43 3.71 2.30
G0655.39 2.01 36.28 2846.37162.66 1361.11 23.67 54.05 3.20 34.93 9.293.871.87 7.57 20.74 19.69 0.37 3.70 0.66 18.24 0.82 0.04 1.25 0.15 0.21
G0743.95 3.40 50.77 3975.05211.70 1338.82 24.14 104.77 4.86 36.10 9.836.033.48 11.40 32.33 36.14 0.52 4.59 0.88 14.05 0.94 0.05 0.83 0.21 0.16
G0882.20 14.78 18.32 2199.87138.56 784.08 29.26 99.31 18.73 53.23 12.38204.83141.51 13.31 27.53 12.56 1.02 1.33 1.87 93.55 0.96 0.62 34.64 2.23 3.62
G09-164.25 5.95 32.75 3435.09220.63 1438.52 44.49 75.75 67.71 58.82 13.53171.53221.95 13.79 40.79 2.27 0.15 1.18 1.17 0.20 0.65 0.51 21.93 0.36 0.13
G09-263.10 5.73 32.66 3427.05218.69 1431.96 44.13 75.95 69.43 58.23 13.39169.89220.57 13.63 42.00 2.27 0.10 1.14 1.17 0.15 0.60 0.50 21.34 0.37 0.12
Notes: high-grade magnetite ore: G01, G03, G04; altered wall rock: G02, G05, G06, G07; amphibolite: G08, G09.
Table 3. Rare earth element content of Gongchangling magnetite rich ore, altered wall rock, and amphibolite.
SampleLaCePrNdSmEuGdTbDyHoErTmYbLu
G011.34 2.09 0.27 1.08 0.29 0.09 0.39 0.06 0.45 0.11 0.36 0.06 0.39 0.07
G020.75 1.92 0.35 1.91 0.99 0.41 1.61 0.31 2.41 0.52 1.61 0.24 1.64 0.24
G031.52 2.94 0.38 1.36 0.35 0.16 0.43 0.07 0.56 0.13 0.44 0.07 0.50 0.08
G041.73 2.72 0.35 1.31 0.31 0.10 0.46 0.08 0.58 0.15 0.48 0.08 0.46 0.08
G052.85 6.21 0.97 4.13 1.20 0.25 1.88 0.35 2.64 0.55 1.60 0.24 1.59 0.24
G060.54 1.36 0.28 1.84 0.75 0.37 0.97 0.19 1.33 0.29 0.86 0.13 0.87 0.13
G070.91 2.32 0.41 2.41 1.21 0.48 1.50 0.25 1.89 0.43 1.42 0.22 1.59 0.24
G081.26 3.39 0.60 3.01 1.44 0.39 2.16 0.37 2.64 0.54 1.58 0.24 1.63 0.25
G09-13.04 7.29 1.13 5.15 1.76 0.62 2.30 0.39 2.74 0.57 1.64 0.25 1.58 0.24
G09-23.02 7.20 1.11 5.07 1.75 0.61 2.27 0.37 2.70 0.55 1.61 0.24 1.61 0.24
Notes: high-grade magnetite ore: G01, G03, G04; altered wall rock: G02, G05, G06, G07; amphibolite: G08, G09.
Publisher’s Note: MDPI stays neutral with regard to jurisdictional claims in published maps and institutional affiliations.

