Diarylheptanoid Glycosides of Morella salicifolia Bark


1
Department of Pharmaceutical Biology, Faculty of Chemistry and Pharmacy, Universität Regensburg, Universitätsstraße 31, D-93053 Regensburg, Germany
2
Department of Food Biotechnology and Nutritional Sciences, Nelson Mandela African Institution of Science and Technology, P.O. Box 447 Arusha, Tanzania
3
Institute of Pharmaceutical Biology and Phytochemistry (IPBP), Westfälische Wilhelms-Universität Münster, PharmaCampus—Corrensstraße 48, D-48149 Münster, Germany
*
Authors to whom correspondence should be addressed.
Molecules 2017, 22(12), 2266; https://0-doi-org.brum.beds.ac.uk/10.3390/molecules22122266
Submission received: 26 October 2017
/
Revised: 2 December 2017
/
Accepted: 4 December 2017
/
Published: 19 December 2017
(This article belongs to the Section Natural Products Chemistry)
Abstract
:A methanolic extract of Morella salicifolia bark was fractionated by various chromatographic techniques yielding six previously unknown cyclic diarylheptanoids, namely, 7-hydroxymyricanol 5-O-β-d-glucopyranoside (1), juglanin B 3-O-β-d-glucopyranoside (2), 16-hydroxyjuglanin B 17-O-β-d-glucopyranoside (3), myricanone 5-O-β-d-gluco-pranosyl-(1→6)-β-d-glucopyranoside (4), neomyricanone 5-O-β-d-glucopranosyl-(1→6)-β-d-glucopyranoside (5), and myricanone 17-O-α-l-arabino-furanosyl-(1→6)-β-d-glucopyranoside (6), respectively, together with 10 known cyclic diarylheptanoids. The structural diversity of the diarylheptanoid pattern in M. salicifolia resulted from varying glycosidation at C-3, C-5, and C-17 as well as from substitution at C-11 with hydroxy, carbonyl or sulfate groups, respectively. Structure elucidation of the isolated compounds was achieved on the basis of one- and two-dimensional nuclear magnetic resonance (NMR) as well as high-resolution electrospray ionisation mass spectrometry (HR-ESI-MS) analyses. The absolute configuration of the glycosides was confirmed after hydrolysis and synthesis of O-(S)-methyl butyrated (SMB) sugar derivatives by comparison of their 1H-NMR data with those of reference sugars. Additionally, absolute configuration of diarylheptanoid aglycones at C-11 was determined by electronic circular dichroism (ECD) spectra simulation and comparison with experimental CD spectra after hydrolysis.
1. Introduction
Morella salicifolia (Hochst. ex A. Rich.) Verdc. & Polhill belongs to the family Myricaceae in the order Fagales. It was formerly named Myrica salicifolia Hochst. ex A. Rich. until the genus Myrica was divided into two genera: Myrica and Morella. M. salicifolia now belongs to the genus Morella, with the new accepted name Morella salicifolia (Hochst. ex A. Rich.) Verdc. & Polhill. (syn. Myrica salicifolia Hochst. ex A. Rich.) [1]. M. salicifolia is reported to be spread in many mountainous ranges in Tanzania above 1200 m and prefers shallow soil, heath, and rocky areas [2]. The species is distributed mainly in Tanzania, Kenya, Uganda, Rwanda, Burundi, Ethiopia, Democratic Republic of the Congo, Yemen, and Saudi Arabia [2,3]. Traditional medicinal use of M. salicifolia has been previously reported in Tanzania where it is used for the treatment of cough, toothache, decoction, tonic, stomach troubles, skin diseases [4], headaches [5], and opportunistic diseases of human immunodeficiency virus/acquired immune deficiency syndrome such as tuberculosis, chronic diarrhoea, cryptococcal meningitis, and herpes simplex [6]. Further, traditional medicinal uses of M. salicifolia have been reported in other countries such as Ethiopia where it is used for the treatment of skin diseases [7], pain, inflammation, and respiratory disorders [8,9]. In Uganda, M. salicifolia has been used for the treatment of male sexual impotence and erectile dysfunction [10].
Despite the many traditional uses of M. salicifolia, literature describing its phytochemical and pharmacological investigation is scarce. A preliminary phytochemical screening of the methanolic extracts of the stem bark and leaves showed the presence of polyphenols, unsaturated sterols/triterpenes, saponins, glycosides, and carbohydrates [11]. Moreover, results from previously conducted biological activity studies on M. salicifolia showed that a methanolic extract of M. salicifolia stem bark was effective against Bacillus cereus, Neisseria gonorrhoeae, Shigella dysenteriae, and Staphylococcus aureus [11,12]. In vivo testing of a methanolic extract of M. salicifolia in mice showed potent analgesic and antipyretic activity at a concentration of 100 mg/kg [13].
To date, no study has reported the isolation of individual compounds from M. salicifolia. Therefore, the aim of this work was the isolation and structure elucidation of secondary metabolites from crude methanolic extract of M. salicifolia bark to explore the documented activity and traditional usage of the drug in future studies.
2. Results
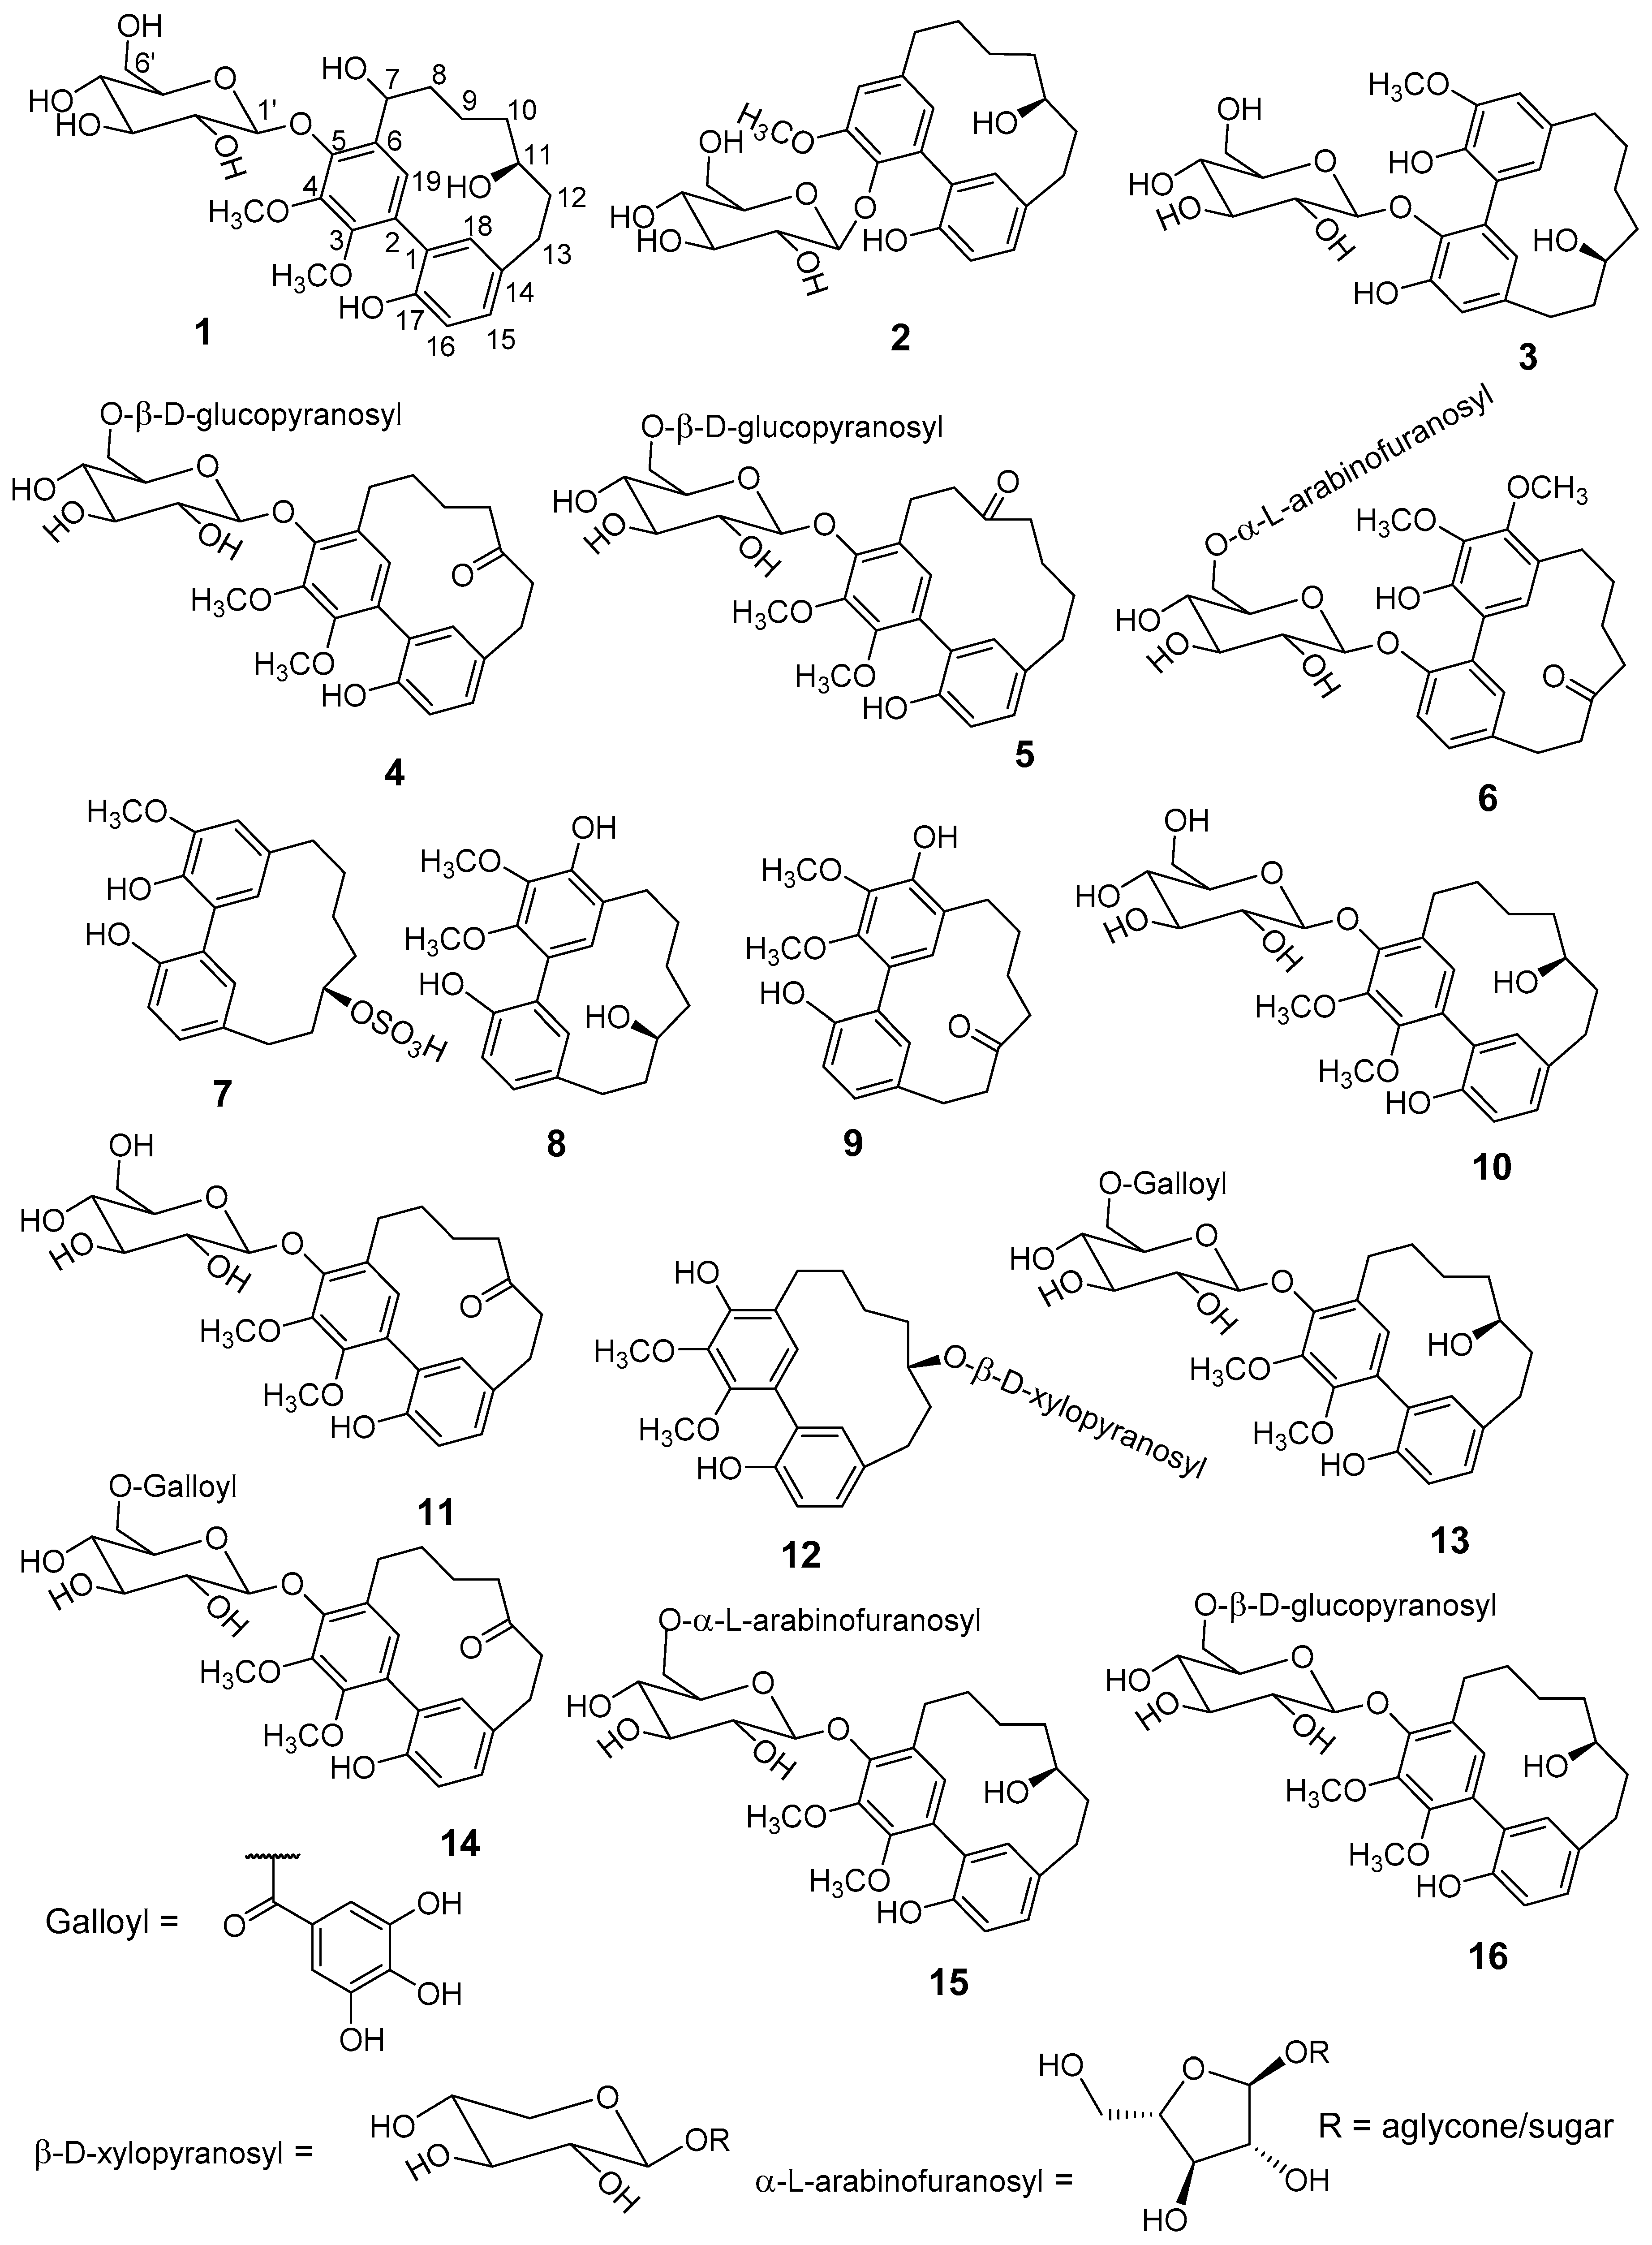
Fractionation of a methanolic extract of M. salicifolia bark resulted in the isolation of 6 unknown (1–6) and 10 known (7–16) cyclic diarylheptanoids of the sub-group meta-meta cyclophane (Figure 1). The known diarylheptanoids were juglanin B-sulfate (7) [14,15], myricanol (8) [16,17,18,19], myricanone (9) [16,19], myricanol 5-O-β-d-glucopyranoside (10) [20], myricanone 5-O-β-d-glucopyranoside (11) [21], myricanol 11-O-β-d-xylopyranoside (12) [22], myricanol 5-O-β-d-(6’-O-galloyl)-glucopyranoside (13) [23], myricanone 5-O-β-d-(6’-O-galloyl)-glucopyranoside (14) [15], myricanol 5-O-α-l-arabinofuranosyl-(1→6)-β-d-glucopyranoside (15) [24], and myricanol gentiobiosidse: myricanol 5-O-β-d-glucopranosyl-(1→6)-β-d-glucopyranoside (16) [23], respectively. Structure elucidation was done by comprehensive one- and two-dimensional nuclear magnetic resonance (NMR), as well as high-resolution electrospray ionisation mass spectrometry (HR-ESI-MS), sugar hydrolyses, circular dichroism (CD)-analyses, and comparison with published data.
The HR-ESI-MS of compound 1 exhibited ions at m/z 535.2185 [M − H]− and 1071.4445 [2M − H]− which are consistent with the molecular formula C27H36O11. The ultraviolet (UV) spectrum (MeOH) of 1 showed absorption maxima at 213, 250, and 295 nm, which are typical for cyclic biphenyl-type diarylheptanoids [22,25]. The 1H-NMR spectrum of 1 was similar to published data on compound 10 [20] showing four aromatic protons resonating at δH 7.02 (1H, dd, J = 2.2, 8.2, H-15), δH 6.77 (1H, d, J = 8.2, H-16), and δH 6.87 (2H, s, H-18, H-19). Two aromatic methoxy groups were observed as one singlet at δH 3.95 (6H, H3-20 and H3-21) and were placed at C-3 and C-4 due to the [1H-13C]-heteronuclear multiple bond correlations (HMBC). Five high-field shifted methylene groups were observed as multiplets between δH 1.12 and 2.88 and assigned with the help of [1H-1H]-correlated spectroscopy (COSY) and [1H-13C]-HMBC experiments to H-8 (δH 2.13, m and δH 1.97, m), H-9 (δH 1.52, m and δH 1.15, m), H-10 (δH 1.79, m and δH 1.52, m), H-12 (δH 2.13, m and δH 1.63, m), and H-13 (δH 2.84, m). Two methane groups bearing a hydroxy group resonated at δH 3.84 (m) and 4.92 (dd, J = 3.6, 11.4) and were assigned to H-11 and H-7 following a proton coupling network from the COSY and HMBC long-range correlations. Sugar protons typical of a glucose resonating between δH 3.32 and 3.80 were assigned to H-2′–H-6′ based on the COSY experiment. The anomeric proton of the glucose moiety was observed at δH 5.05 (H-1′, J = 7.4 Hz), suggesting β-configuration. The position of the glycosidic linkage was elucidated from the HMBC long-range correlation between H-1′ and C-5 (δC 150.0). From obtained the UV, NMR (Table 1 and Table 2), and HR-MS data, compound 1 was concluded to be a hitherto undescribed diarylheptanoid, 7-hydroxymyricanol 5-O-β-d-glucopyranoside, and was named salicimeckol.
Compound 2, as a second previously unknown cyclic diarylheptanoid monoglycoside, was identified as juglanin B 3-O-β-d-glucopyranoside and named salicireneol A. HR-ESI-MS showed ions at m/z 489.2137 [M − H]− and m/z 979.4324 [2M − H]− corresponding to a molecular formula of C26H34O9. Structure elucidation was done in analogy to compound 1 by extensive 1D and 2D NMR measurements. Accordingly, the 1H- and 13C-NMR data for 2 are in agreement with published data of juglanin B [26,27] complemented by additional sugar signals (Table 1 and Table 2).
The molecular mass of compound 3 was deduced from HR-ESI-MS ions at m/z 505.2078 [M − H]− and 551.2137 [M + HCOO]− calculated for the molecular formula of C26H34O10. The 1H-NMR of 3 showed four aromatic protons, at δH 7.04 (H-5, brs), δH 6.87 (H-19, brs), δH 6.64 (H-18, brs), and δH 5.66 (H-15, brs). Furthermore, signals attributed to six aliphatic methylene groups were detected between δH 0.90 and 2.78 and were assigned to positions H-7–H-10, H-12, and H-13 (Table 1). One methoxy group resonated at δH 3.80 (s, 3H) and was assigned to H3-20 by [1H-1H]-rotating-frame nuclear Overhauser effect correlation spectroscopy (ROESY) and HMBC correlations. The anomeric proton of a β-glucopyranosyl moiety was observed at δH 5.00 (H-1’, d, J = 7.6 Hz) and the glycosidic linkage of 3 was elucidated by an HMBC experiment showing a long-range correlation to C-17 (δC 144.7 ppm, Table 2). The position of the hydroxy group at C-11 was deduced from COSY due to lacking long-range correlation signals of H-11 (δH 3.05, m) in the HMBC experiment. Therefore, compound 3 is 16-hydroxyjuglanin B 17-O-β-d-glucopyranoside, a hitherto unknown compound and named salicireneol B.
HR-ESI-MS of 4 and 5 showed ions at m/z 679.2682 [M − H]− and m/z 679.2622 [M − H]− with the common molecular formula of C33H44O15 and calculated mass of 680 Da. The 1H-NMR of 4 showed signals at δH 3.94 and 3.80 (both s, 3H), which were assigned to the two methoxy groups H3-20 and H3-21. Four aromatic protons were assigned to H-15 (7.05, dd, J = 2.1, 8.2), H-16 (6.80, d, J = 8.2), H-18 (6.64, brs), and H-19 (6.57, s) of the aglycone (Table 1). The carbonyl groups at δC 217.2 ppm were assigned to position C-11 as deduced from the HMBC experiment due to long-range correlations between H-9 (δH 1.70, m, 2H), H-10 (δH 2.78, m, 1H and δH 2.65, m, 1H), H-12 (δH 2.91, m, 2H), H-13 (δH 2.78, m, 1H), and the carbonyl carbon. Further confirmation was achieved from the COSY experiment due to observed cross peaks between H-7 (δH 2.91, m, 1H and δH 2.78, m, 1H) and H-8 (1.89, m, 2H), H-8 and H-9 (1.70, m, 2H), H-9 and H-10 (δH 2.78, m, 1H and δH 2.65, m, 1H), and H-12 (δH 2.91, m, 2H) and H-13 (δH 2.78, m, 1H). The anomeric protons of two glucosyl moieties resonated at δH 4.99 (d, J = 7.2 Hz, H-1’) and δH 4.28 (d, J = 7.8 Hz, H-1”). Long-range correlations were observed between the anomeric proton H-1’ and C-5 (δC 149.8 ppm) of the aglycone and the anomeric proton H-1” to C-6’ of the glucose. Therefore, two sugar groups were attached to C-5 of the aglycone and they were confirmed to be two d-glucose molecules. Hence, the structure of 4 was confirmed to be the hitherto unknown myricanone 5-O-β-d-glucopranosyl-(1→6)-β-d-glucopyranoside and was given the name saliciclaireone A.
The carbon data of 5 was found to be similar to the published data of neomyricanone 5-O-β-d-glucopyranoside [22], except that 5 was found to have two 1→6 connected glucose moieties attached to C-5. Extensive one- and two-dimensional NMR revealed that compound 5 is neomyricanone 5-O-β-d-glucopranosyl-(1→6)-β-d-glucopyranoside, a hitherto undescribed compound which was thus named saliciclaireone B. The summarized 1D-NMR data for 4 and 5 were depicted in Table 1 and Table 2, respectively.
The HR-ESI-MS of 6 showed a pseudomolecular ion at m/z 649.2509 [M − H]− in the negative mode, consistent with the molecular formula of C32H41O14. The 1H-NMR spectrum shows 2 methoxy groups at δH 3.81 and 3.93 ppm (both s, H3-21 and H3-20), 4 aromatic protons, and 6 methylene groups. A carbonyl group resonating at δC 216.1 was assigned to C-11 based on the HMBC experiment showing long-range correlations to δH 2.80/2.61 (H-10), δH 2.93/2.79 (H-12), and δH 2.95 ppm (H-13, 2H). Two anomeric protons observed at δH 4.97 (H-1’, d, J = 7.2) and δH (4.83 H-1” brs), indicated the presence of two sugar moieties with a β-d and α-l-configuration. The positions of glycosidic linkages were elucidated from the HMBC experiment. Long-range correlation was observed between H-1’ (δH 4.97) and C-17 (δC 152.7) of the aglycone as well as H-1” (δH 4.83) and C-6’ (δC 68.0) of the glucose. Therefore, it was concluded that the two sugar groups are attached to C-17 of the aglycone. The NMR signals of the aglycone were similar to those of myricanone (compound 12).
The attached glycosides were confirmed for β-d-glucopyranoside and α-l-arabinofuranoside as described in section of absolute configuration of isolated diarylheptanoids. The furan ring of the α-l-arabinose was concluded based on its carbon chemical shifts as described by Beier and Mundy [28]. Based on the obtained data, compound 6 was identified to be myricanone 17-O-α-l-arabinofuranosyl-(1→6)-β-d-glucopyranoside and was named saliciclaireone C. The 1D-NMR data of compound 6 are summarized in Table 1 and Table 2. 1H-NMR of compounds 1–6 can be found in the Supplementary Materials.
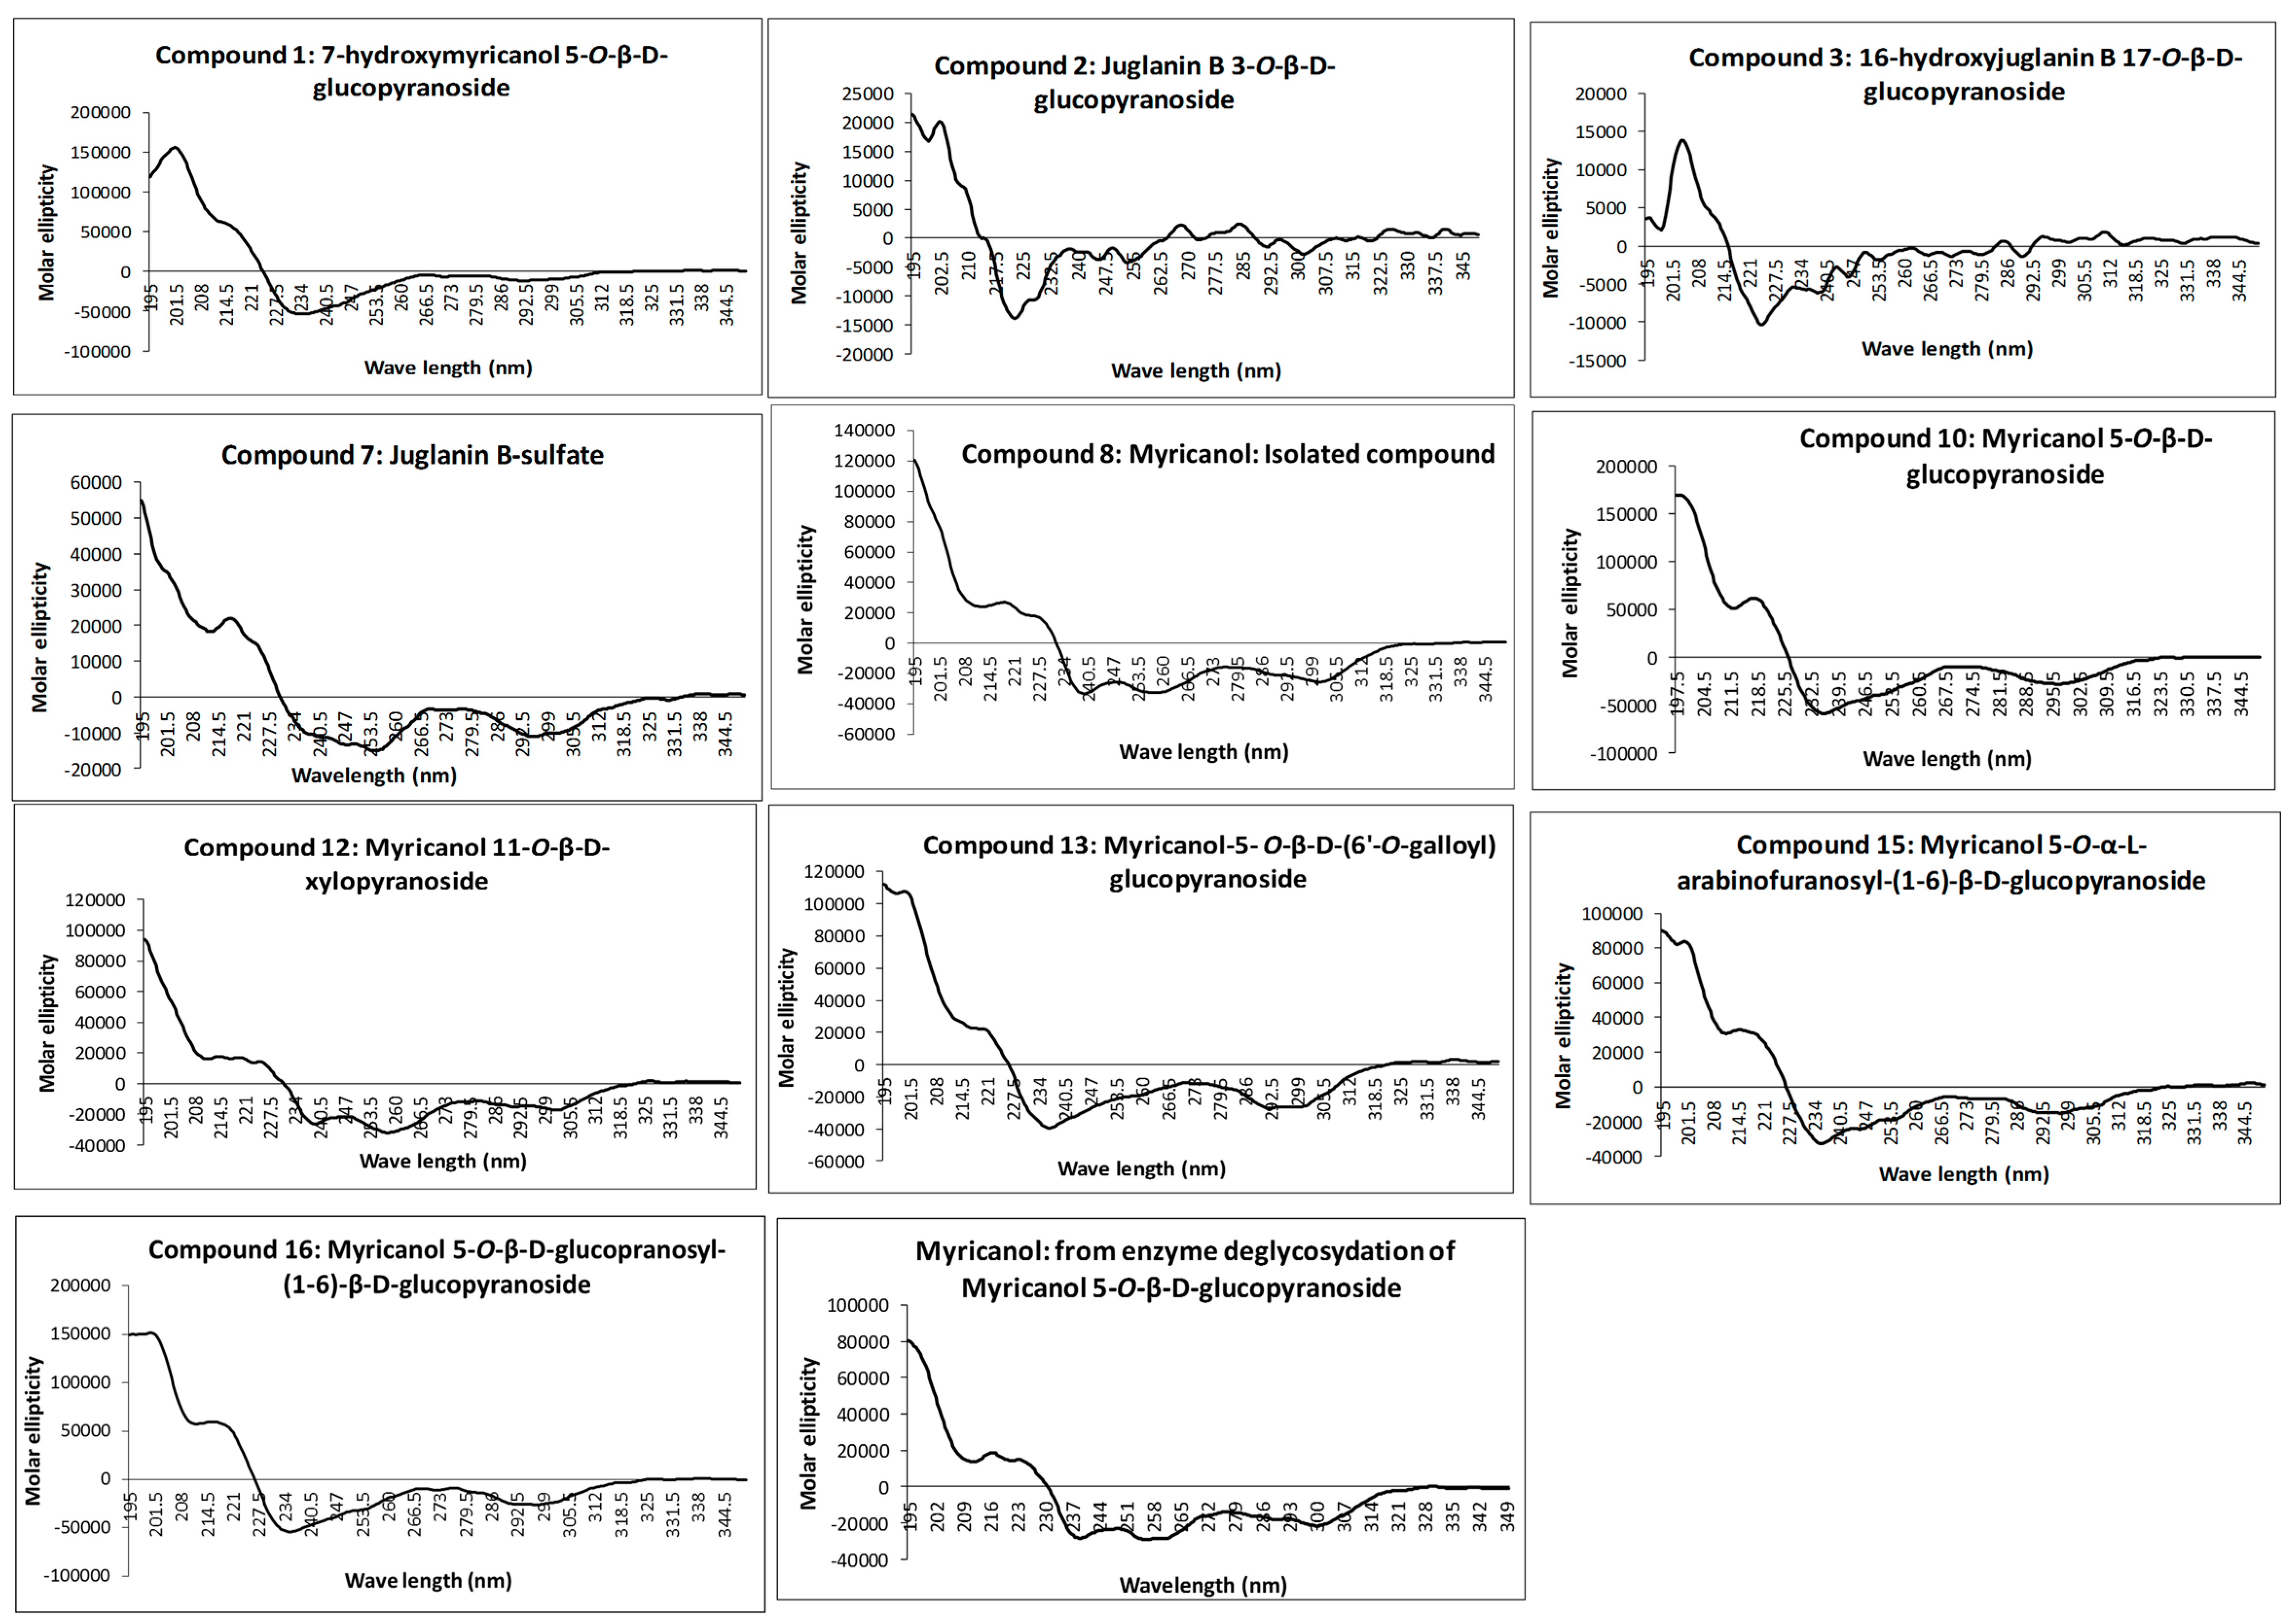
The absolute configuration at C-11 was determined as 11R for all isolated diarylheptanoids by measurement of the CD spectra of the aglycone and comparison with electronic CD spectra simulation. Recorded experimental CD spectra of the isolated diarylheptanoids and the aglycone obtained from enzyme hydrolysis were found to be very similar (Figure 2) and it was hence concluded that the attached glycosides and sulfate moieties had no influence on conformation of the aglycone and its chromophore. Therefore, CD spectra simulation was performed using myricanol as a model compound. The myricanol structure contains one chiral center at C-11, which is axially dissymmetric due to the twisted biphenyl. Thus, the structure of myricanol can occur as two pairs of enantiomers i.e., (R,Ra), (S,Sa), and (R,Sa), (S,Ra), where “a” stands for the chirality of the axially dissymmetric biphenylic system [18,29].
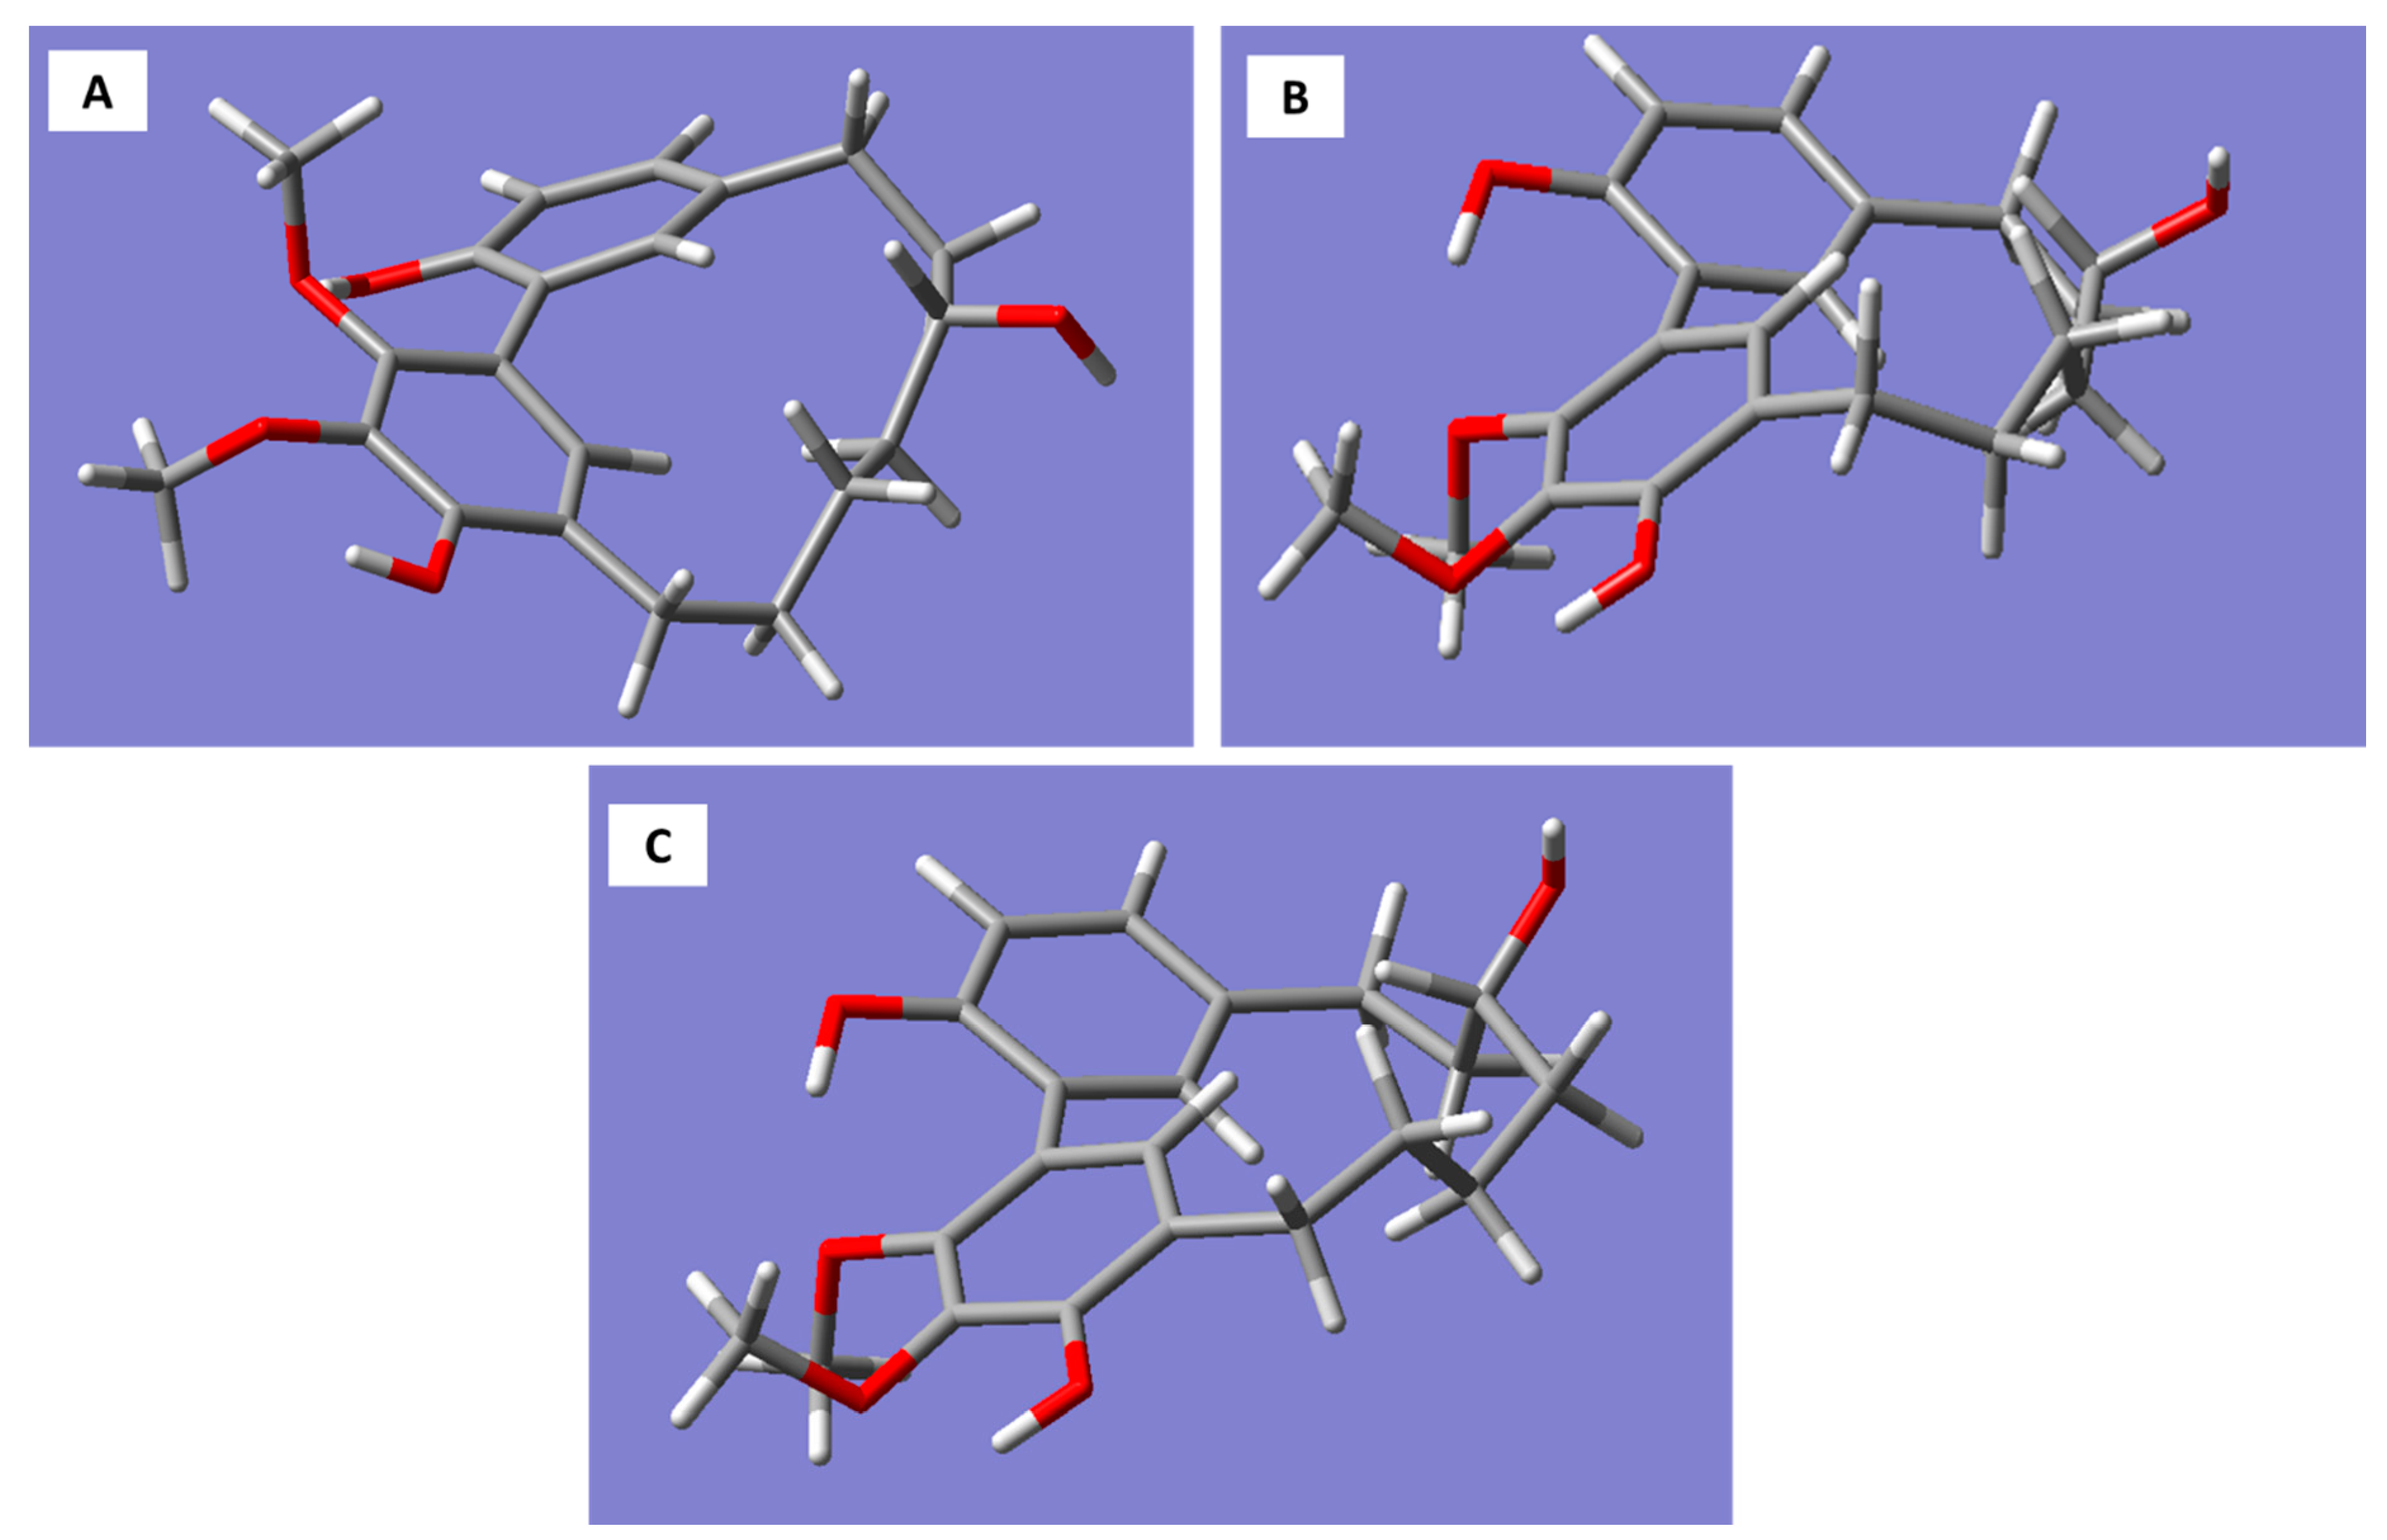
Molecular models generated for the R-enantiomer of myricanol resulted in three conformations corresponding to the 11R,Ra, 11R,Sa (a), and 11R,Sa (b) forms (Figure 3A–C).
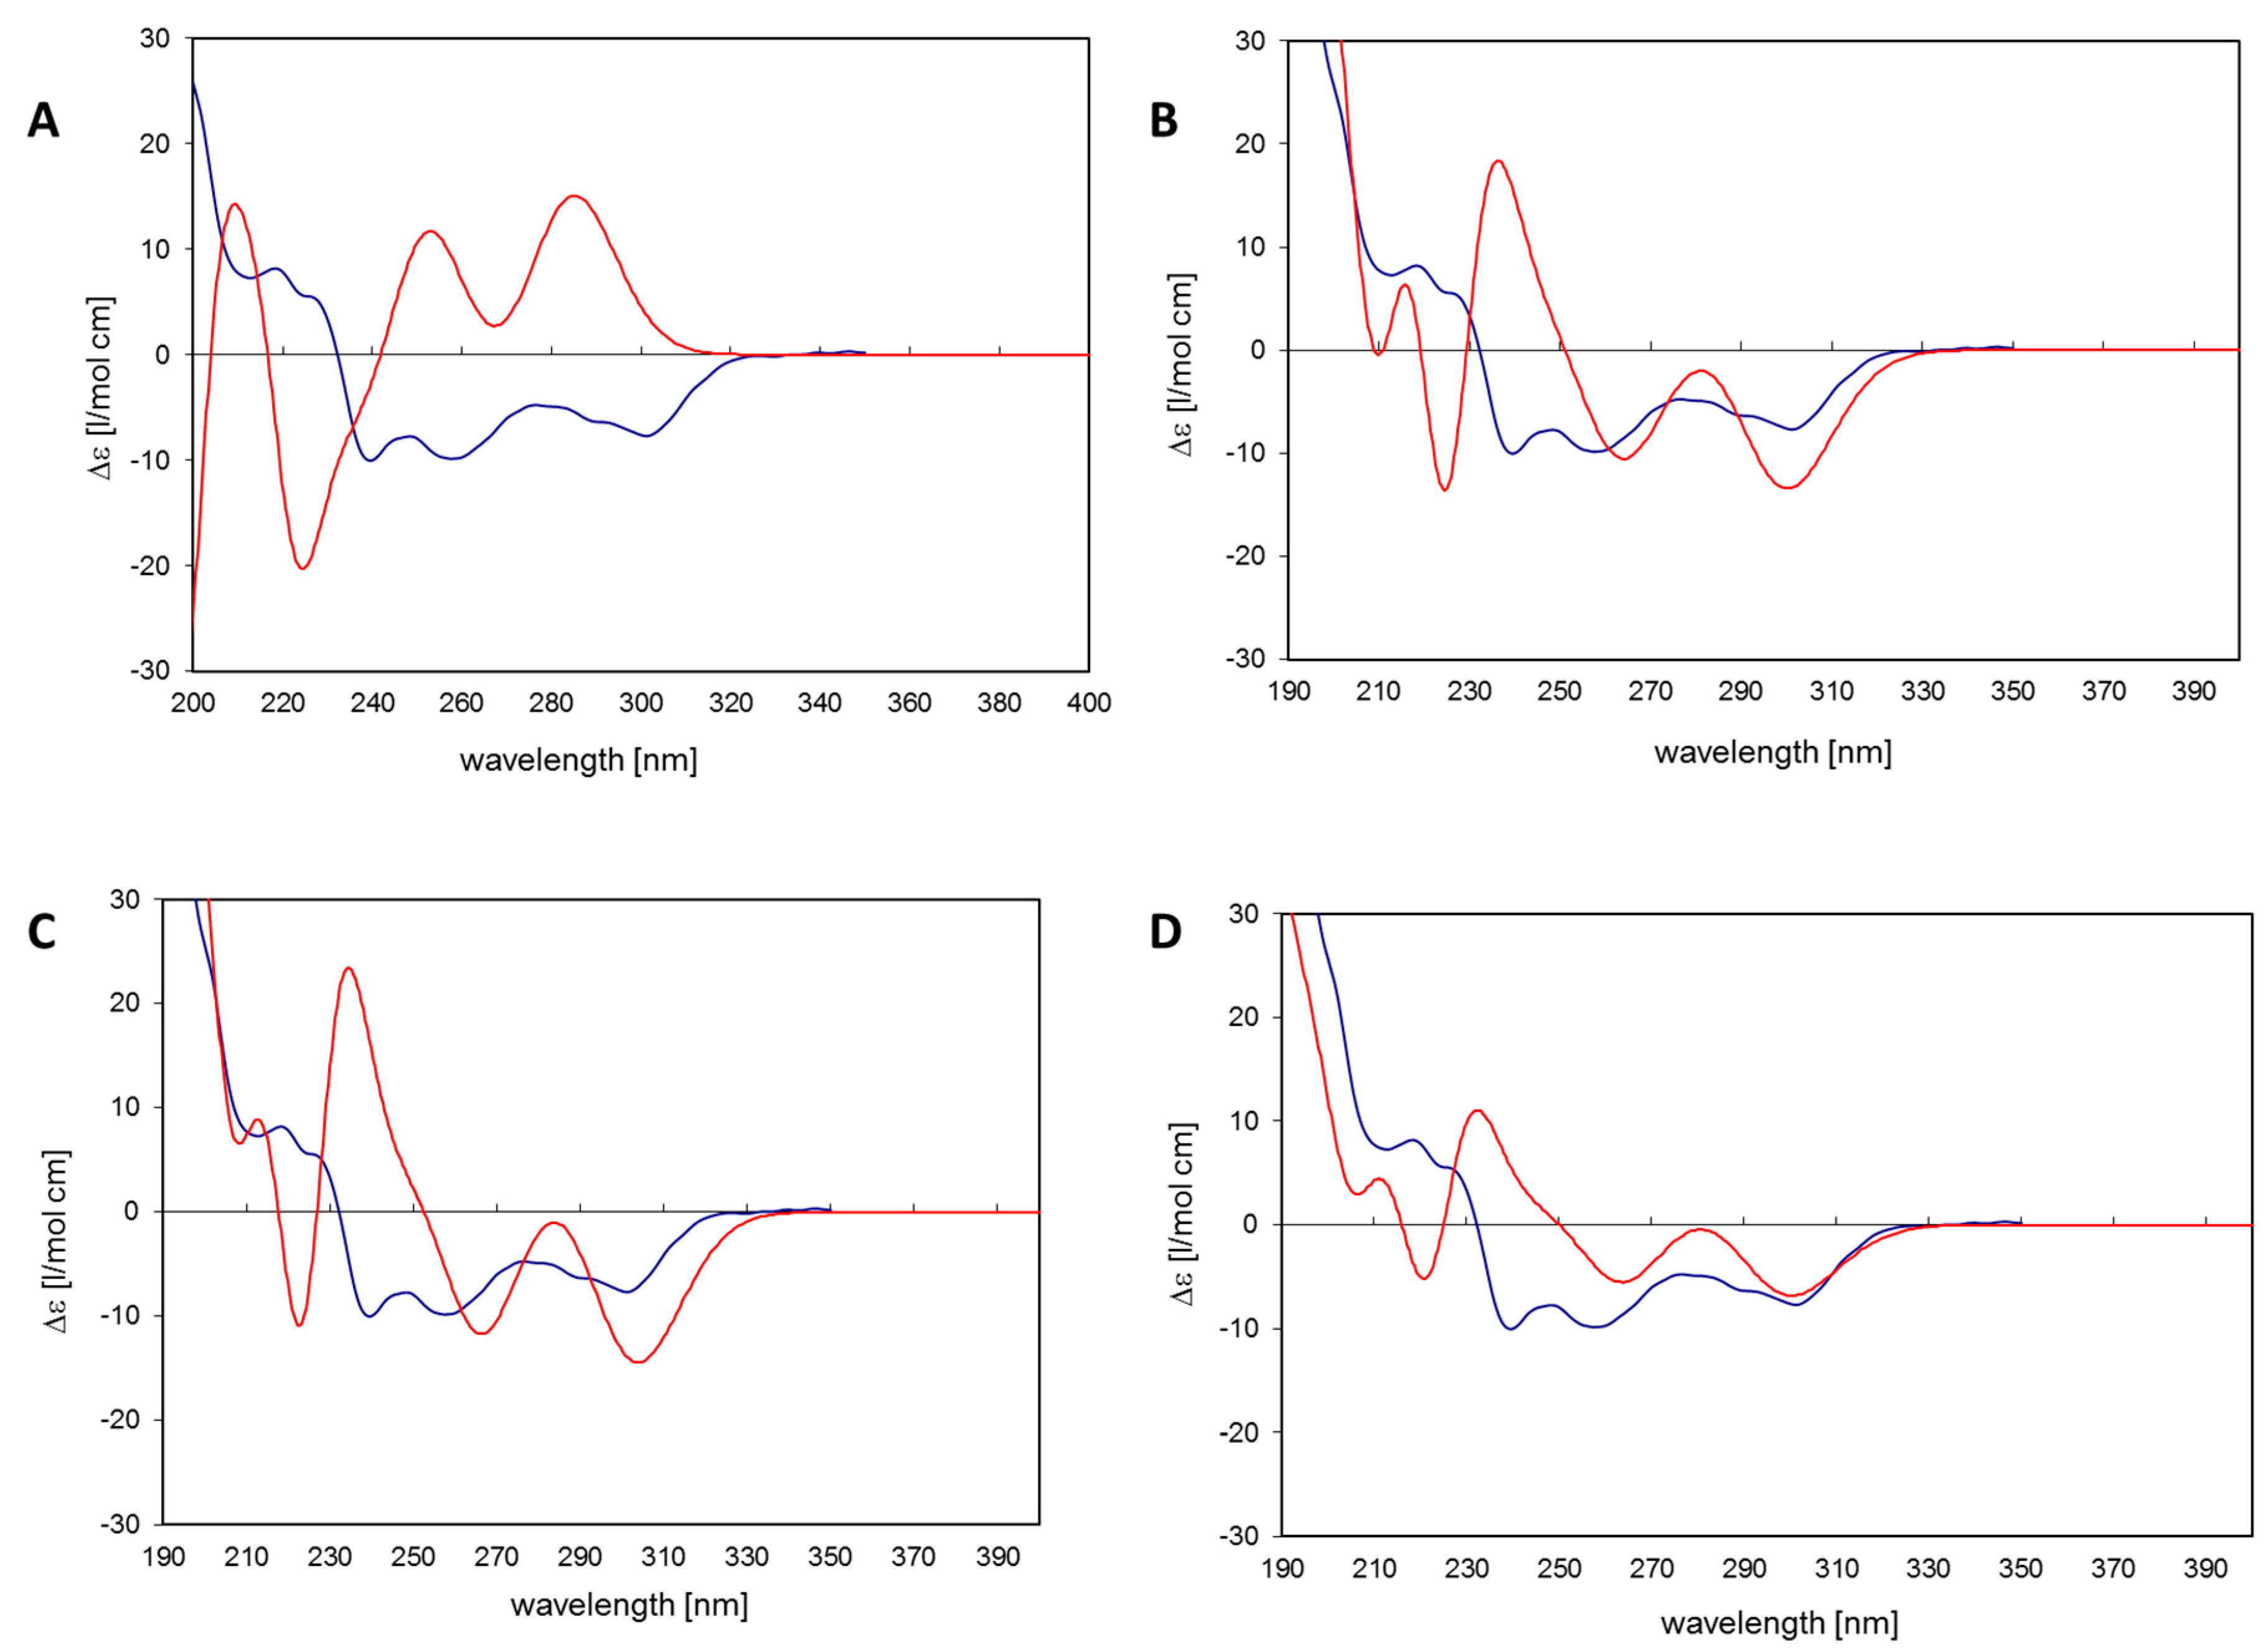
The 11R,Sa (b) conformation corresponds to the X-ray structure of myricanol determined by Begley et al. [19]. The simulated CD spectrum of the energetically most favorable 11R,Sa-myricanol (conformer C, Figure 3C) was found to be similar to the experimentally determined spectrum (Figure 4C). The major cotton effects are of equal sign, indicating that the compound indeed has the 11R,Sa-configuration, as would also be expected based on its reported crystal structure. The spectrum would appear exactly the opposite if the 11S,Ra-enantiomer was present. The spectrum for the much less favorable 11R,Ra-atropisomer (conformer 1, Figure 3A) shows almost entirely the opposite sign (Figure 4A). Since its internal energy is predicted to be more than 2 kcal/mol higher than that of conformer C, it would only represent an insignificant fraction in the conformational equilibrium. The two different conformers of 11R,Sa myricanol (2 and 3, Figure 3B,C) show similar signs with the experimental spectrum (Figure 4B,C) which supports the presence of the 11R,Sa-configuration. The Boltzmann distribution calculated on the basis of the B3LYP/6-31D(d,p) energies of the three conformers would correspond to an even lower amount of conformer 2 (0.3%). Therefore, an averaged spectrum was generated for the theoretical equilibrium mixture corresponding to 97% R,Sa and 3% R,Ra-myricanol and compared with the experimental CD spectrum of myricanol (Figure 4D), presenting a very good match with the experimental spectrum. A slight inconsistency observed in the 230 nm range (Figure 4B–D) can be explained by an exchange of two electronic transitions very close to each other, at 217 and 223 nm. However, this does not change the general picture of the main bands at long and short wavelength being of the same sign. According to these calculations, natural myricanol was concluded to be 11R and very predominantly Sa-configured. This corresponds to the X-ray structure and matches the CD data of myricanol reported in literature [19,30]. It should hence be clear that in the case of the 11S-configured compound, the Ra-atropisomer (i.e., 11S,Ra, representing the enantiomer of the depicted structure) would be the energetically most favorable form and the cotton effects in the CD spectrum would show exactly opposite sign. It is possible that a very small amount of the Ra-atropisomer is present in the conformational equilibrium. Finally, a confirmation of 11R-configuration of diarylheptanoids (1–3, 7, 8, 10, 12, 13, 15, and 16) was demonstrated by their very similar experimental CD spectra (Figure 2) showing congruency to that of myricanol. Experimental CD spectrum of myricanol in comparison to averaged CD spectrum for the S,Sa (87%) and S,Ra form (13%) can be find in the Supplementary Materials.
3. Discussion
A systematic investigation of the diarylheptanoid pattern of Morella salicifolia revealed the presence of 16 cyclic diarylheptanoids (meta, meta-bridged biphenyls), among them six previously unknown compounds. The secondary metabolite pattern of M. salicifolia demonstrated the close taxonomic relationship of the new genera Morella and Myrica resulting from the taxonomic reorganization of the former postulated genus Myrica [1]. The taxonomic relationship was deduced from comparison of isolated known compounds (7–16) to the same compounds also reported from Myrica species [31,32,33]. This makes it probable that cyclic diarylheptanoids are characteristic constituents of both Morella and Myrica species.
Additionally, a comparison of experimental data with simulation of electronic circular dichroism (ECD) data revealed that there is no effect of an attached glycoside or sulfate group on the natural aglycone absolute configuration. The obtained absolute configuration of natural myricanol in this study matches very well to that achieved by X-ray in the group of Begley [19]. However, in this study the established CD calculation of myricanol was further used as a reference and a non-destructive method to determine the absolute configuration of isolated diarylheptanoids containing glycosides or sulfate groups. The method used is reliable as the obtained results are in agreement with the published crystal structure. It should also be noted that this method was used to determine the absolute configuration of the meta,meta-bridged biphenyls with chiral center at position 11. There was no sample to prove if the same method can also be applied for the cyclic diarylheptanoids of the meta,para- diphenyl ether type as well as for the ones without chiral center at position 11.
4. Materials and Methods
4.1. General Experimental Procedures
Optical rotations were measured in methanol (MeOH for spectroscopy, Merck, Darmstadt, Germany) at 25 °C on a Unipol L 1000 polarimeter (Schmidt and Haensch, Berlin, Germany). CD spectra were recorded on a Jasco J-710 spectrometer (Jasco, Groß-Umstadt, Germany) at a wavelength range of 195–350 nm. UV spectra (MeOH for spectroscopy, Merck, Darmstadt, Germany) were measured using a Cary 50 Scan UV spectrophotometer (Varian, Darmstadt, Germany) equipped with Cary WinUV 3.00 software (Varian, Darmstadt, Germany). The 1D-1H, 1D-13C, [1H-13C]-heteronuclear single quantum coherence (HSQC), [1H-13C]-HMBC, [1H-1H]-COSY and [1H-1H]-ROESY NMR experiments were recorded on a Bruker AVANCE 600 spectrometer (600.25 MHz for 1H- and 150.93 MHz for 13C-NMR (Bruker, Ettlingen, Germany), and referenced to tetramethylsilane (TMS). Samples were dissolved in methanol-d4 (99.8%, Sigma-Aldrich, Taufkirchen, Germany), acetone-d6 (99.8%), or pyridine-d5 (99.5%, both Deutero, Kastellaun, Germany). Low-resolution (LR)-ESI-MS was measured using the TSQ 7000 spectrometer (Thermo Quest, Finnigan, Egelsbach, Germany) and high-resolution (HR)-ESI-MS was measured using the Q-TOF 6540 UHD mass spectrometer (Agilent Technologies, Santa Clara, CA, USA).
MeOH and acetonitril of HPLC grade (Merck, Darmstadt, Germany) were used for chromatography. For extraction and analysis of MeOH, dichloromethane (DCM) and EtOAc of analytical grade (Acros Organics, Morris Plains, NJ, USA) were used. Open column chromatography was performed using Sephadex® LH-20 (25–100 µm, 265 g, 90 × 4.76 cm, GE Healthcare GmbH, München, Germany) and fraction control was done by analytical thin layer chromatography (TLC, silica gel 60 F254 aluminium sheets, 20 × 20 cm). The standard mobile phase used for all TLC analyses was ethylacetate/water/acetic acid/formic acid (100 + 26 + 11 + 11). Detection was done at visible light (VIS), and UV 254 and 366 nm before and after spraying a plate with anisaldehyde-sulfuric acid and heating a TLC sheet at 105 °C for 3–10 min.
Centrifugal partition chromatography (CPC) was performed using SPOT centrifugal partition chromatography (Armen Instrument, Saint-Avé, France) with EtOAc (for analysis, Acros Organics) and water as solvent system. Two modes were used; ascending mode, whereby EtOAc was a mobile phase, and descending mode, whereby water was as a mobile phase: rotation = 800 rpm, flow rate 5 mL/min, volume collected in a test tube = 10 mL. Changing from ascending to descending mode was done when no more spots were detected on a TLC sheet when visualized under 254 nm. Final purification of isolated compounds was achieved on semi preparative HPLC using the ProStar HPLC (Varian, Darmstadt, Germany) coupled with the Purospher STAR RP18 column (Eclipse XDB-C18, 250 × 1.4 mm, 5 µm).
4.2. Plant Material
The bark of Morella salicifolia (Hochst. ex A. Rich.) Verdc. & Polhill was collected in February 2013 at the Monduli mountain ranges in the Arusha region, Tanzania. Identification of the plant was done by Mr. Daniel Sitoni (a senior botanist from the Tanzania National Herbarium (TNH)). Specimen was stored at the TNH with voucher number CK 7792. The collected bark material was spread on a clean cotton cloth under direct sunlight with a temperature between 30 and 35 °C until it was completely dried.
4.3. Extraction and Isolation Procedure
Dried pulverized M. salicifolia bark (390.1 g) was mixed with 400 g of sea sand, packed in a column, and macerated overnight with 1 L of dichloromethane (DCM). After maceration, bulk extraction of M. salicifolia bark was performed using four different solvents with increasing polarity, approximately 4 L each. The solvents used for the extraction were DCM, EtOAc, MeOH 100%, and MeOH 50% (v/v). The extraction resulted in respective DCM (7.7 g), EtOAc (1.1 g), MeOH (162.1 g) and MeOH 50% (25.9 g) extracts after evaporation using a rotary vacuum evaporator at 40 °C for complete dryness, mixing with water, and complete freezing at −20 °C followed by lyophilization has been done. The dried powder crude extracts were stored at 4 °C in the refrigerator.
MeOH extract (162.1 g) was subjected to Sephadex® LH-20 column chromatography with a 12-g crude portion of extract in each run, aimed at separating tannins from non-tannin compounds (0–1240 mL). Two eluents were used, ethanol 70% (v/v) and acetone 70% (v/v). Seven fractions (S1–S7) were obtained. Fractions S1–S6 were eluted with ethanol 70%. Fraction S7, which comprised proanthocyanidins polymers, was retained in the column and could not be eluted with ethanol 70%. Its elution was achieved by acetone 70%. For isolation of diarylheptanoids, fraction S2 (15.7 g, 450–560 mL) was fractionated by means of flash chromatography with the RP-18 pre-packed column eluted with water (A) and MeOH (B), flow rate of 40 mL/min, and a gradient of 20–40% B (10 min) → 40–100% B (20 min) → 100% B (30 min). Seven fractions (F1–F7) were obtained. The gradient starting at polar conditions resulted in elution of most of the sugars at the beginning of the chromatography (fraction F1), and hence their separation from other compounds.
F5 (1.44 g, 851–920 mL) was fractionated by CPC (EtOAC/water system, flow = 5 mL/min, 800 rpm) and resulted in nine fractions (F5.C1–F5.C9). F5.C1 (79.5 mg, 101–160 mL) was subjected to semi-preparative HPLC eluted with water (A) and MeOH (B), flow rate 3 mL/min, gradient 50–70% B (20 min) → 70–100% B (0.1 min) → 100% B. Three peaks were eluted, whereby two peaks resulted from the isolation of compounds 14 (3.1 mg, tR = ~12 min), and 10 (6.5 mg, tR = ~13.3 min). The third peak at tR = ~14 min (42.9 mg) was not pure, and was hence subjected to a subsequent purification step with flash chromatography (column: silica gel Reveleris Flash Cartridges, 20 µm, 12 g) eluted with CHCl3 (A) and MeOH (B), flow rate: 15 mL/ min, gradient: 5% B (40 min) → 5–100% B (25 min) → 100% B (15 min), and resulted in isolation of compounds 11 (10.2 mg, tR = 6 min) and 13 (13.3 mg, tR =9 min). Similarly, separation and purification of F5.C3 (21.8 mg, 281–480 mL) using preparative HPLC with the same procedure as for purification of F5.C1 led to the isolation of compounds 3 (0.7 mg, tR = ~7.5 min), 2 (0.6 mg, tR = ~5.8 min), and 10 (1.81 mg). Further separation and purification of F5.C4 (22.7 mg, 481–810 mL) by preparative HPLC eluted with water + 0.02% trifluoroacetic acid (TFA) (A), and MeCH + 0.02% TFA (B), flow rate: 2 mL/min, gradient: 25–35% B (30 min) → 35–65% B (1 min) → 65% B (4 min), resulted in compound 6 (0.9 mg, tR = ~24.2 min).
Furthermore, purification of F5.C5, (15.5 mg, 811–1330 mL) by RP-18 (semi preparative), eluted with H2O (A) and MeOH (B), flow rate: 3 mL/min, gradient: 50–60% B (15 min) → 60–100% B (1 min) → 100% B (4 min), led to isolation of compound 1 (2.5 mg, tR = ~10.5 min) and 15 (2.2 mg, tR = ~14 min). F5.C7 (39.5 mg, 1140–1160 mL) and F5.C8 (11.0 mg, 1161–1200 mL) were separated using the same procedure as for F5.C5 and resulted in compounds 7 (1.0 mg, tR = ~6.3 min), 16 (2.6 mg, tR = ~11.9 min) and 4 (1.0 mg, tR = ~10.5 min) for F5.C7. F5.C8 resulted in the reisolation of 3 (1.8 mg, tR = ~12 min) and 4 (4.2 mg, tR = ~10.5 min) and compound 5 (0.9 mg, tR = ~17.1 min).
F6 (from S2) was fractionated using flash chromatography (column: silica gel Reveleris Flash Cartridges, 20 µm, 12 g), eluted with CHCl3 (A) and MeOH (B), flow: 15 mL/min, gradient: 5–12% B (30 min) → 12–60% B (1 min) → 60–100% B (9 min) → 100% B (10 min), and resulted in the 10 subfractions F6.1–F6.10. Subfraction F6.3 (43.4 mg, 21–40 mL) was subjected to preparative RP-18 (semi-preparative) HPLC, eluted with H2O (A) and MeOH (B), flow rate 2 mL/min, gradient: 75–80% B (15 min) → 80–100% B (1 min) → 100% B (3 min), and led to the isolation of compounds 8 (30.5 mg, tR = ~10.5 min) and 9 (6.6 mg, tR = ~11.8 min). F6.5 (1.8 mg, 96–140 mL) was further purified using RP-18 semi-preparative HPLC eluted with water (A) and MeOH (B), flow 2 mL/min, gradient: 70% B (15 min) → 70–100% B (1 min) → 100% B (4 min), and resulted in the isolation of compound 12 (0.7 mg, tR = ~11 min).
Salicimeckol (1). White, amorphous powder; −56 (c 0.1, MeOH); UV λmax (MeOH) (log Ɛ) 213 (3.90), 250 (3.88), and 295 (3.67) nm; for 1H- and 13C-NMR data see Table 1 and Table 2; HR-ESI-MS m/z 535.2185 [M − H]− (calculated for C27H35O11 535.2185).
Salicireneol A (2). White, amorphous powder; −49.0 (c 0.1, MeOH); UV λmax (MeOH) (log Ɛ) 214 (4.3), 254 (4.02), and 285 (3.91) nm; for 1H- and 13C-NMR data see Table 1 and Table 2; HR-ESI-MS m/z 489.2137 [M − H]− (calculated for C26H33O9 489.2130).
Salicireneol B (3). White, amorphous powder; −33.6 (c 0.1, MeOH); UV λmax (MeOH) (log Ɛ) 216 (4.11), 253 (4.0), and 298 (4.04) nm; for 1H- and 13C-NMR data see Table 1 and Table 2; HR-ESI-MS m/z 505.2078 [M − H]− (calculated for C26H33O10 505.2079).
Saliciclaireone A (4). White, amorphous powder; −51.6 (c 0.1, MeOH); UV λmax (MeOH) (log Ɛ) 214 (4.21), 250 (4.10), and 300 (4.04) nm; for 1H- and 13C-NMR data see Table 1 and Table 2; HR-ESI-MS m/z 679.2682 [M − H]− (calculated for C33H43O15 679.2607).
4.4. Determination of Absolute Configuration of Glycosides
Determination of the glycosides and their absolute configuration was achieved by recording the 1H-NMR spectra of the per-O-(S)-2-methylbutyrate (SMB) derivatives and comparison with the 1H-NMR of the SMB derivatives of reference sugars [34]. The reference sugars used in this study were d- and l-glucose, d- and l-arabinose, and d- and l-xylose. A quantity of 1 mg glycoside was hydrolyzed using 200 µL of 2 M trifluoroacetic acid (TFA) at 121 °C for 90 min in a Wheaton vials sealed with Teflon-lined screw cap. After hydrolysis, the solvent was evaporated to complete dryness under nitrogen stream. Then, 100 µL of (S)-(+)-2-methylbutyric anhydride and 100 µL of pyridine were added to the mixture and incubated at 121 °C for 4 h. The mixture was dried under nitrogen stream for about 8 h and 300 µL of toluene was added to the residue and evaporated. The residue was dissolved in 1 mL of DCM and extracted three times with 2 mL of 2 M Na2CO3 solution and once with 2 mL H2O. The DCM phase containing the SMB derivatives was concentrated using nitrogen stream, then completely dried by the addition of 300 µL of 2-propanol and evaporation. Preparation of samples for NMR measurement was done by dissolving each of the obtained SMB derivatives in 0.6 mL of deuterated acetone. The mixture was transferred to the NMR tube and their 1H-NMR spectra were recorded at 300 MHz, 298 K. The same procedure was applied to reference monosaccharides with the exception of hydrolysis reaction. Absolute configuration and type of glycoside was confirmed by comparing chemical shifts and coupling constants of anomeric proton resonances of the SMB derivative to that of reference monosaccharides SMB derivative. For compounds with two sugar substitutions, 1H-NMR of SMB derivatives were compared to a 1H-NMR of the SMB derivative of a mixture of the two concerning reference sugars.
4.5. Enzymatic Deglycosidation of Cyclic Diarylheptanoid Glycosides
Enzymatic hydrolysis was done using β-glucosidase (almond) to obtain the aglycone by deglycosidation of cyclic diarylheptanoid glycosides [20] with an exception for compounds 12 and 15. The enzyme hydrolysis was conducted as follows: 21.0 mg (0.040 mmol) of a compound was dissolved in 3.0 mL of 0.2 M acetate buffer (0.2 M acetic acid + 0.2 M sodium acetate, pH 4.4). The solution was treated with 40 mg of β-glucosidase and stirred. The mixture was incubated while stirring in the ultrasonic water bath at 38 °C for 2 days. After incubation, the reaction mixture was mixed with 10 mL of absolute EtOH and evaporated to dryness by using a vacuum rotary evaporator at 40 °C. The residues were dissolved in CHCl3/H2O (1 + 1), thoroughly mixed, left to settle and finally the two phases were separated. The obtained upper and lower phase were dried and separately purified by semi-preparative HPLC method eluted with water (A) and MeOH (B), flow rate: 2 mL/min, gradient: 60% B (10 min) 60–100% B (1 min) → 100% B (4 min). The collected peaks from HPLC purification of the upper and lower phase were dried under nitrogen stream and subjected to 1H-NMR measurement. Prior to 1H-NMR measurement, the samples were dissolved in 0.6 mL deuterated methanol, filled in the NMR tubes followed by measurement at 300 MHz, 298 K. The recorded 1H-NMR spectra data of the obtained peaks were compared with the existing data to identify which peak stands particularly for the aglycone.
4.6. Circular dichroism Spectra: Measurement and Simulation
A quantity of 0.6 mg of the isolated compounds and the obtained aglycone from enzymatic deglycosydation were dissolved in 10 mL methanol, and their CD spectra were recorded. Recorded CD spectra data were used during electronic CD spectra simulation using time-dependent density functional theory (TDDFT) quantum mechanics.
Molecular models of the 11R-enantiomer of myricanol were generated with the software package Molecular Operating Environment (MOE, CCG, Montréal, Canada). After a low-mode-dynamics conformational search (default settings), three conformations were obtained within an energy window of 3 kcal/mol of which conformer 1 corresponded to the 11R,Ra and conformers 2 and 3 to two slightly different 11R,Sa forms. The 3D structures were exported to the software Gaussian 03W and completely energy-minimized using the B3LYP density functional and the 6-31D (d,p) basis set. According to these calculations, conformer 3 was the energetically most favorable form: conformer 1 had a value of 2.01, and conformer 2 was even 3.31 kcal/mol higher in energy. The Boltzmann distribution calculated with these energy differences indicates that conformer 3 would strongly dominate (97%) in a conformational equilibrium, while only 2.7% and 0.3% would be contributed by conformers 1 (11R,Ra) and 2 (11R,Sa), respectively. The geometry of the most favorable conformer 3 is in very good agreement with the crystal structure of myricanol, as published by Begley et al. [19]. Electronic CD spectra were simulated for all three conformers by performing a time-dependent DFT (TDDFT) calculation for the first 30 electronic transitions of each of the three conformers using the same basis set as mentioned above. The resulting transition vectors (R, length) were used to simulate the CD spectra for each form by multiplying them with Gaussian functions of width of 0.1 eV and summing the resulting curves up over the whole energy/wavelength scale. Furthermore, an averaged spectrum was generated for the theoretical equilibrium mixture corresponding to 97% R,Sa (conformer 3) and 3% R,Ra-myricanol (conformer 1). The resulting spectra were compared with the experimental CD spectrum of myricanol and the obtained results were used to confirm the absolute configuration of the aglycone myricanol and other isolated diarylheptanoids.
Supplementary Materials
Supplementary materials are available online.
Acknowledgments
This research was financially supported by MoEVT, DAAD, and NM-AIST, who gave a grant to E. M. Fritz Kastner is kindly acknowledged for performing the NMR-experiments. Thanks are given to Josef Kiermaier and Wolfgang Söllner for acquiring the HR-ESI-MS data (all Zentrale Analytik, Fakultät Chemie und Pharmazie, Universität Regensburg). Guido Jürgenliemk is acknowledged for fruitful discussions (Pharmazeutische Biologie, Universität Regensburg).
Author Contributions
E.M. isolated compounds and performed structure elucidation; T.J.S. performed the ECD simulations; and B.K. and J.H. designed the project. All authors read and approved the manuscript.
Conflicts of Interest
The authors declare no conflict of interest.
References
- Herbert, J. Systematic and Biogeography of Myricaceae; University of St Andrews: St Andrews, UK, 2005. [Google Scholar]
- Mbuya, L.P.; Msanga, H.P.; Ruffo, C.K.; Birnie, A.; Tengnas, B. Useful Trees and Shrubs for Tanzania. Identification, Propagation and Management for Agricultural and Pastoral Communities; SIDA Regional Conservation Unit, RSCU: Stockholm, Sweden, 1994. [Google Scholar]
- Kokwaro, J. Medicinal Plants of East Africa; Kenya literature Bureau: Nairobi, Kenya, 1976. [Google Scholar]
- Hedberg, I.; Hedberg, O.; Madati, P.J.; Mshigeni, K.E.; Mshiu, E.N.; Samuelsson, G. Inventory of plants used in traditional medicine in Tanzania. II. Plants of the families Dilleniaceae–Opiliaceae. J. Ethnopharmacol. 1983, 9, 106–112. [Google Scholar] [CrossRef]
- Schlage, C.; Mabula, C.; Mahunnah, R.L.A.; Heinrich, M. Medicinal plants of the Washambaa (Tanzania): Documentation and ethnopharmacological evaluation. Plant Biol. 2000, 2, 83–92. [Google Scholar] [CrossRef]
- Kisangau, D.P.; Lyaruu, H.V.M.; Hosea, K.M.; Cosam, C.J. Use of traditional medicines in the management of HIV/AIDS opportunistic infections in Tanzania: A case in the Bukoba Rural District. J. Ethnobiol. Ethnomed. 2007, 3, 1–8. [Google Scholar] [CrossRef] [PubMed] [Green Version]
- Getahun, A. Some Common Medicinal and Poisonous Plants Used in Ethiopian Folk Medicine; Registrated in the Data Bank Prelude; Amare Getahun: Addis Ababa, Ethiopia, 1976. [Google Scholar]
- Teklay, A.; Abera, B.; Giday, M. An ethnobotanical study of medicinal plants used in Kilte Awulaelo District, Tigray Region of Ethiopia. J. Ethnobiol. Ethnomed. 2013, 9, 1–23. [Google Scholar] [CrossRef] [PubMed]
- Kefalew, A.; Asfaw, Z.; Kelbessa, E. Ethnobotany of medicinal plants in Ada’a District, East Shewa Zone of Oromia Regional State, Ethiopia. J. Ethnobiol. Ethnomed. 2015, 11, 25. [Google Scholar] [CrossRef] [PubMed]
- Kamatenesi-Mugisha, M.; Oryem-Origa, H. Traditional herbal remedies used in the management of sexual impotence and erectile dysfunction in Western Uganda. Afr. Health Sci. 2005, 5, 40–49. [Google Scholar] [PubMed]
- Geyid, A.; Abebe, D.; Debella, A.; Makonnen, Z.; Aberra, F.; Teka, F.; Kebede, T.; Urga, K.; Yersaw, K.; Biza, T.; et al. Screening of some medicinal plants of Ethiopia for their anti-microbial properties and chemical profiles. J. Ethnopharmacol. 2005, 97, 421–427. [Google Scholar] [CrossRef] [PubMed]
- Kilonzo, M.; Ndakidemi, P.A.; Chacha, M. In vitro antifungal and cytotoxicity activities of selected Tanzanian medicinal plants. Trop. J. Pharm. Res. 2016, 15, 2121–2130. [Google Scholar] [CrossRef]
- Njung’e, K.; Muriuki, G.; Mwangi, J.W.; Kuria, K.A.M. Analgesic and antipyretic effects of Myrica salicifolia (Myricaceae). Phytother. Res. 2002, 16 (Suppl. 1), 73–74. [Google Scholar] [CrossRef] [PubMed]
- Kim, H.H.; Oh, M.H.; Park, K.J.; Heo, J.H.; Lee, M.W. Anti-inflammatory activity of sulfate-containing phenolic compounds isolated from the leaves of Myrica rubra. Fitoterapia 2014, 92, 188–193. [Google Scholar] [CrossRef] [PubMed]
- Yoshimura, M.; Yamakami, S.; Amakura, Y.; Yoshida, T. Diarylheptanoid sulfates and related compounds from Myrica rubra bark. J. Nat. Prod. 2012, 75, 1798–1802. [Google Scholar] [CrossRef] [PubMed]
- Sun, D.; Zhao, Z.; Wong, H.; Foo, L.Y. Tannins and other phenolics from Myrica esculenta bark. Phytochemistry 1988, 27, 579–583. [Google Scholar]
- Jones, J.R.; Lebar, M.D.; Jinwal, U.K.; Abisambra, J.F.; Koren, J.; Blair, L.; O’Leary, J.C.; Davey, Z.; Trotter, J.; Johnson, A.G.; et al. The diarylheptanoid (+)-aR, 11S-myricanol and two flavones from bayberry (Myrica cerifera) destabilize the microtubule-associated protein tau. J. Nat. Prod. 2011, 74, 38–44. [Google Scholar] [CrossRef] [PubMed]
- Joshi, B.S.; Pelletier, S.W.; Newton, M.G.; Lee, D.; McGaughey, G.B.; Puar, M.S. Extensive 1D, 2D NMR spectra of some [7.0] metacyclophanes and X-ray analysis of (+/−)-myricanol. J. Nat. Prod. 1996, 59, 759–764. [Google Scholar] [CrossRef]
- Begley, M.J.; Campbel, R.V.M.; Crombie, L.; Tuck, B.; Whiting, D.A. Constitution and absolute configuration of meta-meta-bridged, strained biphenyls from Myrica nagi; X-ray analysis of 16-bromomyricanol. J. Chem. Soc. 1971, 3634–3642. [Google Scholar] [CrossRef]
- Matsuda, H.; Morikawa, T.; Tao, J.; Ueda, K.; Yoshikawa, M. Bioactive constituents of Chinese Natural Medicines. VII.1: Inhibitors of degranulation in RBL-2H3 cells and absolute stereo structures of three new diarylheptanoid glycosides from the bark of Myrica rubra. Chem. Pharm. Bull. 2002, 50, 208–215. [Google Scholar] [CrossRef] [PubMed]
- Tene, M.; Wabo, H.K.; Kamnaing, P.; Tsopmo, A.; Tane, P.; Ayafor, J.F.; Sterner, O. Diarylheptanoids from Myrica arborea. Phytochemistry 2000, 54, 975–978. [Google Scholar] [CrossRef]
- Tao, J.; Morikawa, T.; Toguchida, I.; Ando, S.; Matsuda, H.; Yoshikawa, M. Inhibitors of nitric oxide production from the bark of Myrica rubra: Structures of new biphenyl type diarylheptanoid glycosides and taraxerane type triterpene. Bioorg. Med. Chem. 2002, 10, 4005–4012. [Google Scholar] [CrossRef]
- Yaguchi, Y.; Sakurai, N.; Nagai, M.; Inoue, T. Constituents of Myrica rubra. III.1: Structures of two glycosides of myricanol. Chem. Pharm. Bull. 1988, 36, 1419–1424. [Google Scholar] [CrossRef]
- Sakurai, N.; Yaguchi, Y.; Hirakawa, T.; Nagai, M.; Inoue, T. Two myricanol glycosides from Myrica rubra and revision of the structure of isomyricanone. Phytochemistry 1991, 30, 3077–3079. [Google Scholar] [CrossRef]
- Inoue, T. Constituents of Acer nikoense and Myrica rubra. On diarylheptanoids. Yakugaku Zasshi 1993, 113, 181–197. [Google Scholar] [CrossRef] [PubMed]
- Liu, J.X.; Di, D.L.; Wei, X.N.; Han, Y. Cytotoxicity diarylheptanoids from pericarps of walnuts (Juglans regia). Planta Med. 2008, 74, 754–759. [Google Scholar] [CrossRef] [PubMed]
- Yang, H.; Sung, S.H.; Kim, J.; Kim, Y.C. Neuroprotective diarylheptanoids from the leaves and twigs of Juglans sinensis against glutamate-induced toxicity in HT22 cells. Planta Med. 2011, 77, 841–845. [Google Scholar] [CrossRef] [PubMed]
- Beier, R.C.; Mundy, B.P. Assignment of anomeric configuration and identification of carbohydrate residues by 13C NMR: Arabino- and ribopyranosides and furanosides. J. Carbohydr. Chem. 1984, 3, 253–266. [Google Scholar] [CrossRef]
- Eliel, E.L.; Wilen, S.H.; Mander, L.N. Stereochemistry of Organic Compounds; John Wiley and Sons: New York, NY, USA, 1994; pp. 1120–1121. [Google Scholar]
- Takaeda, Y.; Fujita, T.; Shingu, T.; Ogimi, C. Studies on the bacterial gall of Myrica rubra: Isolation of a new [7,0]-metacyclophan from the gall and dl-Β-phenyllactic acid from the culture of gall-forming bacteria. Chem. Pharm. Bull. 1987, 35, 2569–2573. [Google Scholar] [CrossRef]
- Inoue, T.; Arai, Y.; Nagai, M. Diarylheptanoids in the bark of Myrica rubra Sieb. et Zucc. Yakugaku Zasshi 1984, 104, 37–41. [Google Scholar] [CrossRef] [PubMed]
- Silva, B.J.C.; Seca, A.M.L.; Barreto, M.C.; Pinto, D.C.G.A. Recent breakthroughs in the antioxidant and anti-inflammatory effects of Morella and Myrica species. Int. J. Mol. Sci. 2015, 16, 17160–17180. [Google Scholar] [CrossRef] [PubMed]
- Tene, M.; Tane, P.; Connolly, J.D. Triterpenoids and diarylheptanoids from Myrica arborea. Biochem. Syst. Ecol. 2009, 36, 872–874. [Google Scholar] [CrossRef]
- York, W.S.; Hantus, S.; Albersheim, P.; Darvill, A.G. Determination of the absolute configuration of monosaccharides by NMR spectroscopy of their per-O-(S)-2-methylbutyrate derivatives. Carbohydr. Res. 1997, 300, 199–206. [Google Scholar] [CrossRef]
Sample Availability: Samples of the compounds 1–16 are available from the authors. |
Figure 1.
Structures of the isolated diarylheptanoids from methanolic extract of Morella salicifolia bark. Compounds 1–6 (new) and 7–16 (known).
Figure 1.
Structures of the isolated diarylheptanoids from methanolic extract of Morella salicifolia bark. Compounds 1–6 (new) and 7–16 (known).

Figure 2.
Recorded experimental circular dichroism (CD) spectra of isolated diarylheptanoids (molar ellipticity vs. wavelength. (nm)).
Figure 2.
Recorded experimental circular dichroism (CD) spectra of isolated diarylheptanoids (molar ellipticity vs. wavelength. (nm)).

Figure 3.
Three-dimensional structures of the conformations of R-myricanol. (A) 11R,Ra myricanol. RB3LYP/6-31G(d,p) energy: –1192.01521911 a.u. Energy difference from lowest conformer: 2.01 kcal/mol; (B) 11R,Sa myricanol (a). RB3LYP/6-31G(d,p) energy: −1192.01342066 a.u. Energy difference from the lowest conformer: 3.31 kcal/mol; (C) 11R,Sa myricanol (b). Conformation corresponds to the X-ray crystal structure [19]. RB3LYP/6-31G(d,p) energy: –1192.01842217 a.u. Energy difference from the lowest conformer: 0.000 kcal/mol.

Figure 4.
(A) Conformer 1: 11R,Ra myricanol. Blue: Experimental CD spectrum of myricanol. Red: CD spectrum simulated for conformer 1 by time-dependent density functional theory (TDDFT): RB3LYP/6-31G(d,p), nstates = 30. No shift, no scaling of calculated spectrum; (B) Conformer 2: 11R,Sa-myricanol (a). Blue: Experimental CD spectrum of myricanol. Red: CD spectrum simulated for conformer 2 by TDDFT: RB3LYP/6-31G(d,p), nstates = 30. No shift, no scaling of calculated spectrum; (C) Conformer 3: 11R,Sa-myricanol (b), conformation corresponds to the X-ray structure. Blue: Experimental CD spectrum of myricanol. Red: CD spectrum simulated for conformer 3 by TDDFT: RB3LYP/6-31G(d,p), nstates = 30. No shift, no scaling of calculated spectrum. (D) Blue: Experimental CD spectrum of myricanol. Red: Averaged CD spectrum for the R,Sa (97%) and R,Ra form (3%). TDDFT: RB3LYP/6-31G(d,p), nstates = 30. Calculated spectrum was red-shifted by −0.15 eV and scaled by factor 0.5.


Table 1.
1H-Nuclear magnetic resonance (NMR) data of 1–6 (600 MHz, methanol-d4, 298 K, δ ppm, mult, J, Hz).
Table 1.
1H-Nuclear magnetic resonance (NMR) data of 1–6 (600 MHz, methanol-d4, 298 K, δ ppm, mult, J, Hz).
| Number | 1 | 2 | 3 | 4 | 5 | 6 |
|---|---|---|---|---|---|---|
| 5 | 6.85 brs | 7.04 brs | ||||
| 7 | 4.92 dd (3.6, 11.4) | 2.98 m 2.54 m | 2.78 m 2.64 m | 2.91 m * 2.78 m * | 3.19 m 2.97 m | 2.73 m 2.96 m |
| 8 | 2.13 m 1.97 m | 1.97 m 1.83 m * | 1.74 m 1.59 m | 1.89 m * 1.89 m * | 2.87 m * 2.87 m * | 1.90 m * 1.90 m * |
| 9 | 1.52 m * 1.15 m | 1.61 m 1.43 m | 1.27 m * 1.03 m | 1.70 m * 1.70 m * | 1.74 m * 1.74 m * | |
| 10 | 1.79 m 1.53 m * | 1.83 m * 1.52 m | 1.27 m * 0.90 m | 2.78 m * 2.65 m * | 2.75 m * 2.64 m * | 2.80 m * 2.61 m |
| 11 | 3.84 m | 3.91 m | 3.05 m | 1.74 m * (2H) | ||
| 12 | 2.13 m 1.63 m | 2.23 m 1.63 m | 1.43 m (2H) | 2.91 m * (2H) | 1.97 m * (2H) | 2.79 m * 2.93 m * |
| 13 | 2.84 m * 2.84 m * | 2.85 m 2.01 m | 2.64 m * 2.60 m * | 2.78 m * | 2.75 m * 2.64 m * | 2.95 m * 2.95 m * |
| 15 | 7.02 dd (2.2, 8.2) | 7.04 dd (2.3, 8.2) | 5.66 brs | 7.05 dd (2.1, 8.2) | 7.00 dd (2.2, 8.2) | 7.03 dd (2.9, 8.7) |
| 16 | 6.77 d (8.2) | 6.78 d (8.2) | 6.80 d (8.2) | 6.82 d (8.2) | 6.78 d (8.2) | |
| 18 | 6.87 brs | 7.07 brs | 6.64 brs | 6.64 brs | 6.87 d (1.9) | 6.67 d (2.3) |
| 19 | 6.87 s | 6.76 brs | 6.87 brs | 6.57 s | 6.42 s | 6.58 s |
| 20 | 3.95 s | 3.88 s | 3.80 s | 3.94 s | 3.84 s | 3.93 s |
| 21 | 3.95 s | 3.80 s | 3.95 s | 3.81 s | ||
| 1’ | 5.05 d (7.4) | 4.99 d (7.3) | 5.00 d (7.6) | 4.99 d (7.2) | 4.88 d (7.6) | 4.97 d (7.2) |
| 2’ | 3.50 m * | 3.38 m * | 3.54 m * | 3.50 m * | 3.52 m * | 3.44 m * |
| 3’ | 3.39 m * | 3.20 m * | 3.49 m * | 3.50 m * | 3.39 m * | 3.43 m * |
| 4’ | 3.47 m * | 3.07 m | 3.42 m * | 3.50 m * | 3.53 m * | 3.44 m * |
| 5’ | 3.32 m * | 3.29 m * | 3.42 m * | 3.41 m | 3.46 m | 3.38 m |
| 6’ | 3.80 dd (2.4, 11.8) 3.64 dd (5.7, 11.8) | 3.45 m * 3.45 m * | 3.89 brd (12.3) 3.71 (dd, 4.0, 1.8) | 4.08 dd (1.8, 11.5) 3.78 m | 4.11 dd (2.2, 11.2) 3.79 m | 3.96 dd (2.1, 11.0) 3.56 m * |
| 1” | 4.28 d (7.8) | 4.25 m | 4.83 brs | |||
| 2” | 3.18 m | 3.24 m * | 3.91 m | |||
| 3” | 3.30 m * | 3.22 m * | 3.78 m * | |||
| 4” | 3.25 m * | 3.27 m * | 3.83 m * | |||
| 5” | 3.25 m * | 3.27 m * | 3.67 dd (3.2, 11.7) 3.58 m * | |||
| 6” | 3.84 m 3.63 dd (5.2, 11.9) | 3.81 dd (2.5, 11.9) dd (5.4, 11.9) |
* Overlapping signals.
Table 2.
13C-NMR data of 1–6 (150 MHz, methanol-d4, 298 K, δ ppm).
| Number | 1 | 2 | 3 | 4 | 5 | 6 |
|---|---|---|---|---|---|---|
| 1 | 126.8 | 128.0 | 126.2 | 126.7 | 125.4 | 126.5 |
| 2 | 120.2 | 128.2 | 131.5 | 129.4 | 129.6 | 129.6 |
| 3 | 147.0 | 140.9 | 144.8 | 146.6 | 148.3 | 146.5 |
| 4 | 152.2 | 152.7 | 154.0 | 149.2 | 146.3 | 148.9 |
| 5 | 150.0 | 113.6 | 115.3 | 149.8 | 148.7 | 149.9 |
| 6 | 131.0 | 131.8 | 137.9 | 131.8 | 131.9 | 127.6 |
| 7 | 66.7 | 31.6 | 36.2 | 28.4 | 23.6 | 28.2 |
| 8 | 35.6 | 27.5 | 31.2 | 25.7 | 41.8 | 25.6 |
| 9 | 21.8 | 23.8 | 23.4 | 22.9 | 215.8 | 22.9 |
| 10 | 40.0 | 40.2 | 39.5 | 46.2 | 44.6 | 45.8 |
| 11 | 68.9 | 69.1 | 72.2 | 217.2 | 22.7 | 216.1 |
| 12 | 35.5 | 35.5 | 37.4 | 43.1 | 26.2 | 42.7 |
| 13 | 27.7 | 27.9 | 29.3 | 29.1 | 31.8 | 28.7 |
| 14 | 131.3 | 132.0 | 136.3 | 133.2 | 132.1 | 132.8 |
| 15 | 131.0 | 130.6 | 115.2 | 130.2 | 130.9 | 129.8 |
| 16 | 117.1 | 117.2 | 151.6 | 117.5 | 117.4 | 117.1 |
| 17 | 153.1 | 152.1 | 144.7 | 152.8 | 152.2 | 152.7 |
| 18 | 135.8 | 135.0 | 122.7 | 133.9 | 133.7 | 133.8 |
| 19 | 130.8 | 127.6 | 124.2 | 130.0 | 129.5 | 129.7 |
| 20 | 61.1 | 56.6 | 56.4 | 62.3 | 62.1 | 61.8 |
| 21 | 61.9 | 61.8 | 62.2 | 61.6 | ||
| 1’ | 104.8 | 104.8 | 102.9 | 105.0 | 105.2 | 104.9 |
| 2’ | 75.5 | 75.3 | 74.7 | 75.4 | 74.8 | 75.3 |
| 3’ | 71.4 | 71.1 | 77.8 | 77.0 | 76.3 | 77.5 |
| 4’ | 77.7 | 77.5 | 71.1 | 71.0 | 70.5 | 75.3 |
| 5’ | 78.5 | 78.6 | 78.0 | 77.5 | 77.0 | 76.6 |
| 6’ | 62.1 | 62.6 | 62.3 | 69.5 | 69.3 | 68.0 |
| 1” | 104.4 | 103.8 | 109.6 | |||
| 2” | 75.0 | 74.3 | 82.8 | |||
| 3” | 77.7 | 77.0 | 78.6 | |||
| 4” | 71.4 | 70.8 | 85.6 | |||
| 5” | 77.7 | 77.2 | 62.7 | |||
| 6” | 62.6 | 62.2 |
© 2017 by the authors. Licensee MDPI, Basel, Switzerland. This article is an open access article distributed under the terms and conditions of the Creative Commons Attribution (CC BY) license (http://creativecommons.org/licenses/by/4.0/).
Share and Cite
MDPI and ACS Style
Makule, E.; Schmidt, T.J.; Heilmann, J.; Kraus, B. Diarylheptanoid Glycosides of Morella salicifolia Bark. Molecules 2017, 22, 2266. https://0-doi-org.brum.beds.ac.uk/10.3390/molecules22122266
AMA Style
Makule E, Schmidt TJ, Heilmann J, Kraus B. Diarylheptanoid Glycosides of Morella salicifolia Bark. Molecules. 2017; 22(12):2266. https://0-doi-org.brum.beds.ac.uk/10.3390/molecules22122266
Chicago/Turabian StyleMakule, Edna, Thomas J. Schmidt, Jörg Heilmann, and Birgit Kraus. 2017. "Diarylheptanoid Glycosides of Morella salicifolia Bark" Molecules 22, no. 12: 2266. https://0-doi-org.brum.beds.ac.uk/10.3390/molecules22122266