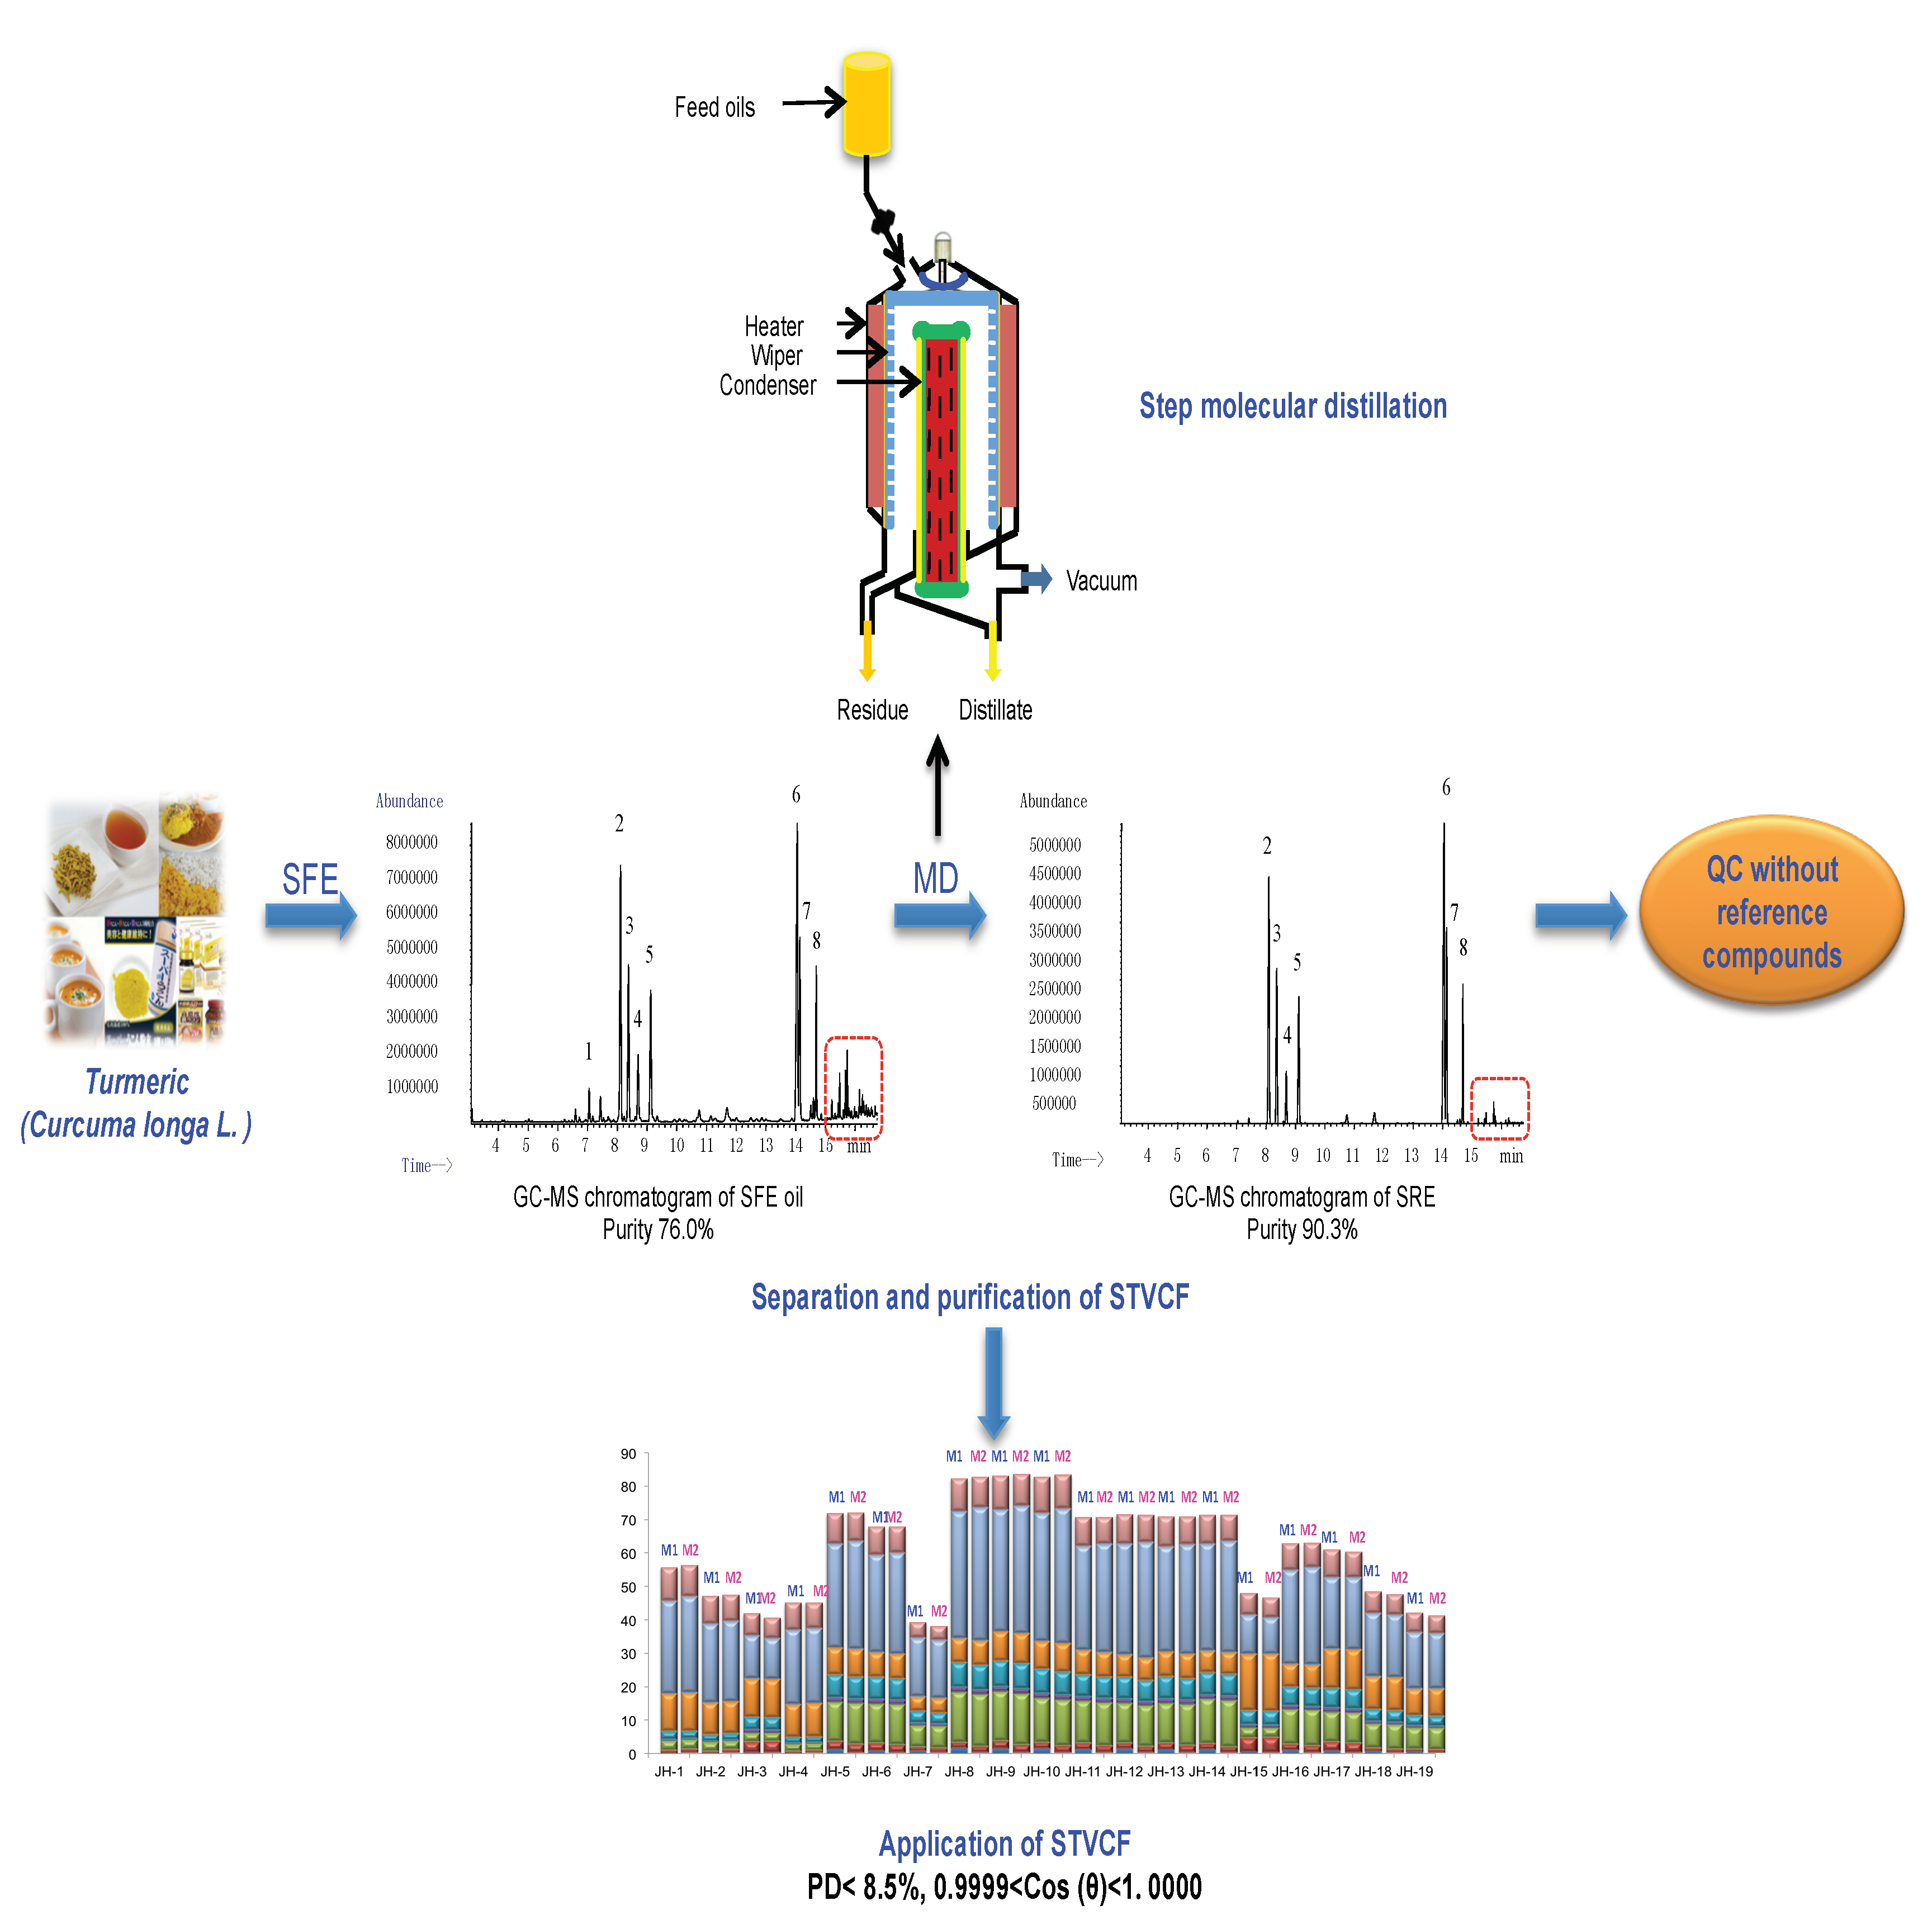
Preparation and Application of Standardized Typical Volatile Components Fraction from Turmeric (Curcuma longa L.) by Supercritical Fluid Extraction and Step Molecular Distillation


Abstract
:
1. Introduction
2. Results and Discussion
2.1. Conditions for Supercritical Fluid Extraction (SFE) of Essential Oil
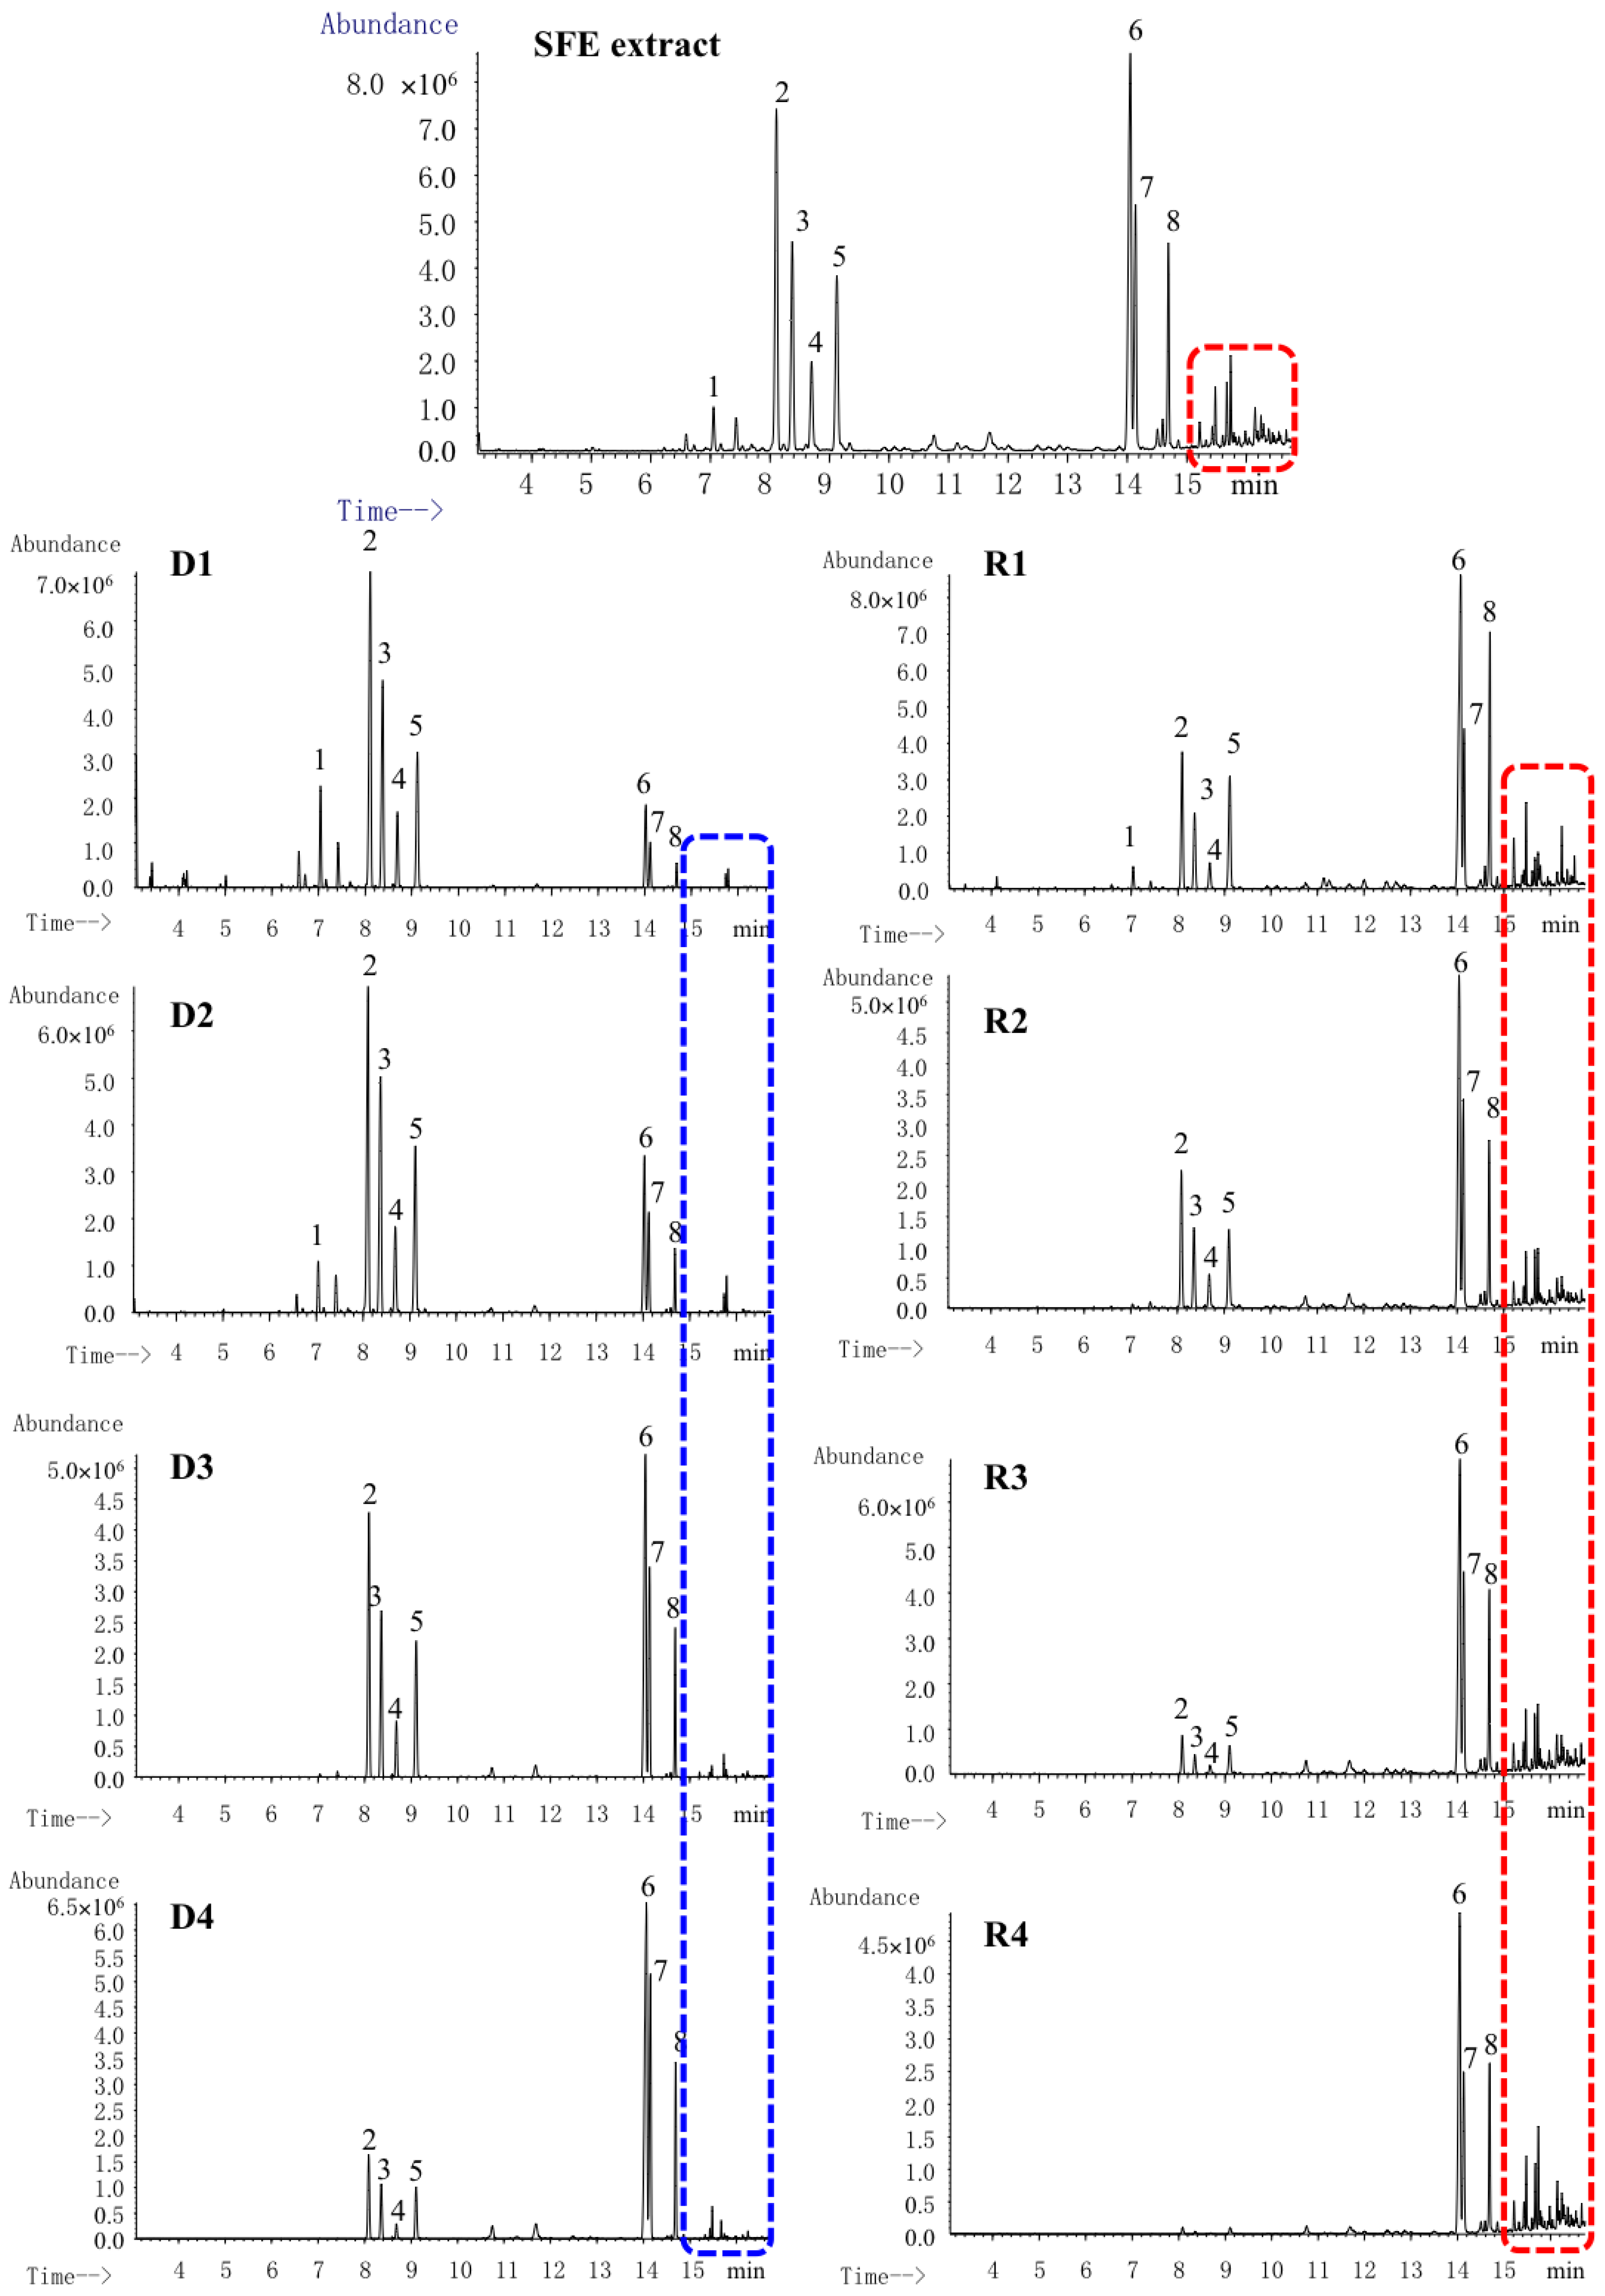
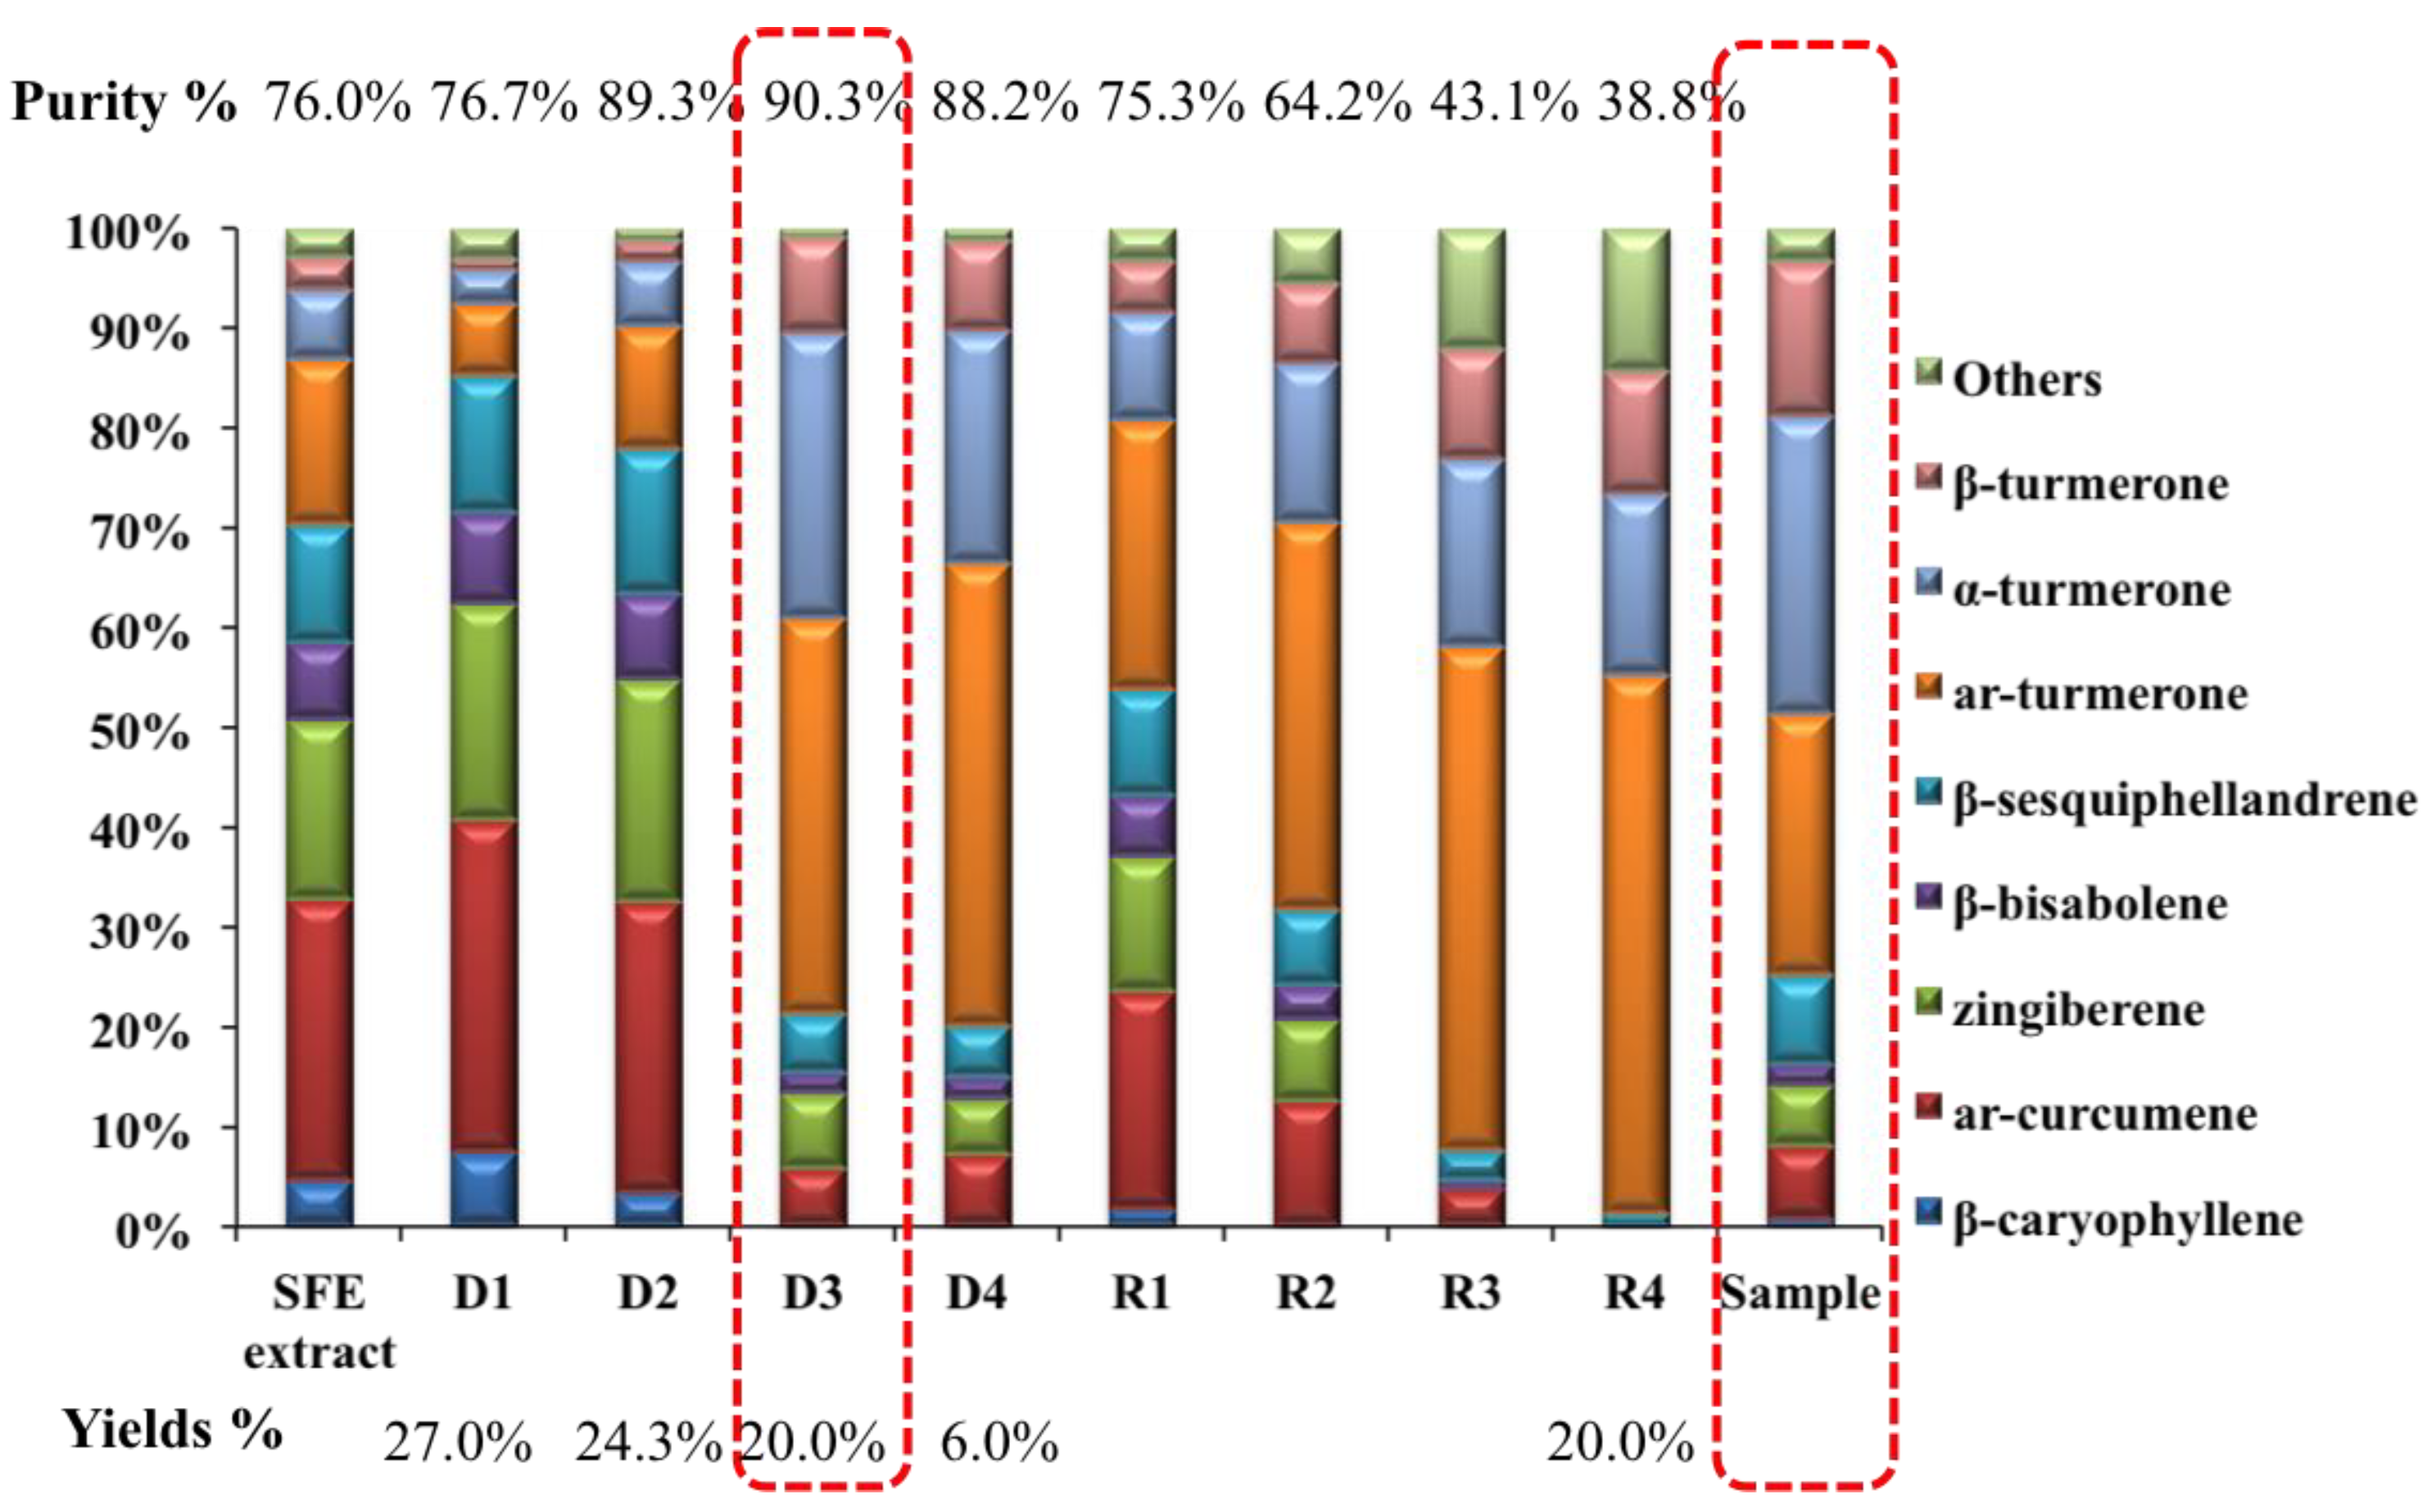
2.2. Optimization of Molecular Distillation for Purification of Standardized Typical Volatile Components
2.3. Method Validation
2.4. Quantification of Investigated Components in C. longa and Method Assessment
3. Materials and Methods
3.1. Chemicals and Materials
3.2. Supercritical Fluid Extraction of Essential Oil
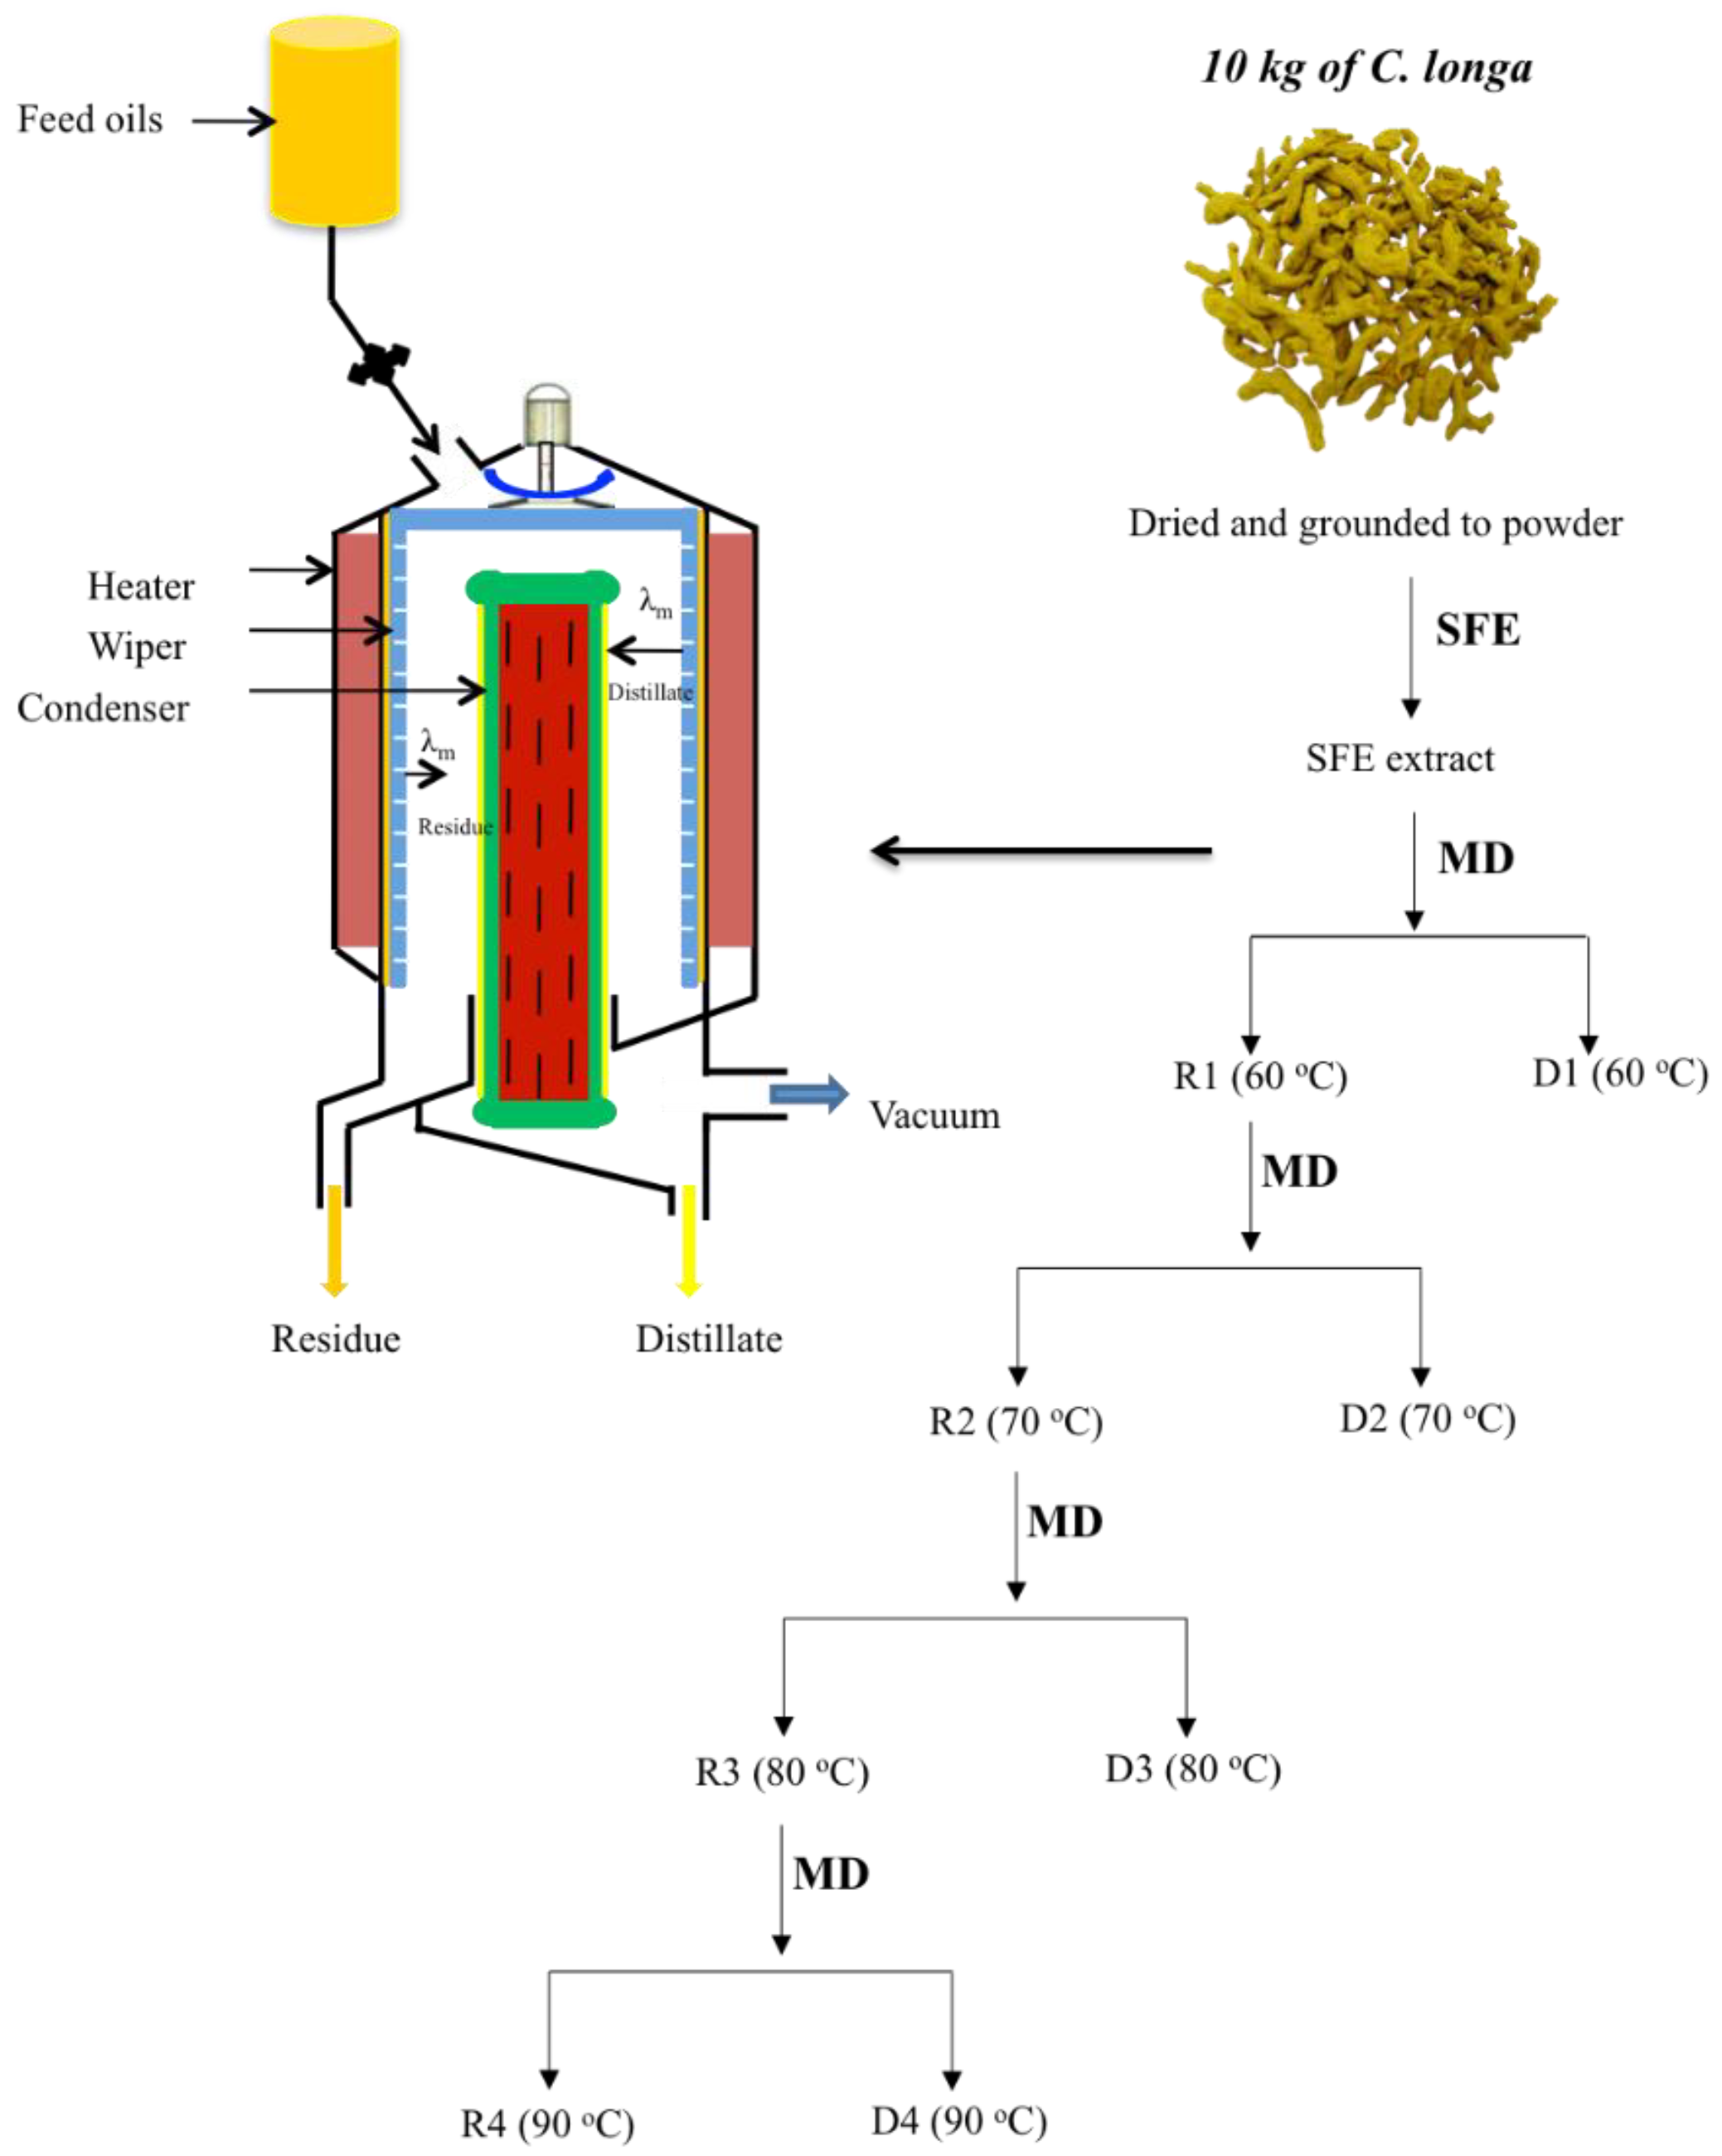
3.3. Preparation of Standardized Typical Volatile Components Fraction by Step Molecular Distillation (MD)
3.4. Sample Preparation
3.5. GC-MS Analysis
3.6. Calibration Curves, Limit of Detection (LOD), and Limit of Quantification (LOQ)
3.7. Precision, Repeatability, Stability, and Accuracy
4. Conclusions
Supplementary Materials
Author Contributions
Funding
Conflicts of Interest
References
- Shimizu, T. Health claims on functional foods: The Japanese regulations and an international comparison. Nutr. Res. Rev. 2003, 16, 241–252. [Google Scholar] [CrossRef] [PubMed]
- Yadav, D.; Yadav, S.K.; Khar, R.K.; Mujeeb, M.; Akhtar, M. Turmeric (Curcuma longa L.): A promising spice for phytochemical and pharmacological activities. Int. J. Green Pharm. 2013, 7, 85–89. [Google Scholar] [CrossRef]
- Xu, J.; Ji, F.; Kang, J.; Wang, H.; Li, S.; Jin, D.Q.; Zhang, Q.; Sun, H.; Guo, Y. Absolute Configurations and NO Inhibitory Activities of Terpenoids from Curcuma longa. J. Agric. Food Chem. 2015, 63, 5805–5812. [Google Scholar] [CrossRef] [PubMed]
- National Health Commission of the People’s Republic of China. List of Items Can Be Used as Medicine and Food Dual Purposes. Available online: http://www.nhfpc.gov.cn/sps/s3585/201411/67ac54fb05ed46929adc63f2db31d4bf.shtml (accessed on 6 June 2018).
- United States Pharmacopeia 34, Dietary Supplements, Turmeric; The United States Pharmacopeia Convention: Rockville, MD, USA, 2011.
- Ling, J.J.; Wei, B.; Lv, G.P.; Ji, H.; Li, S.P. Anti-hyperlipidaemic and antioxidant effects of turmeric oil in hyperlipidaemic rats. Food Chem. 2012, 130, 229–235. [Google Scholar] [CrossRef]
- Naz, S.; Ilyas, S.; Jabeen, S.; Parveen, Z. Composition and antibacterial activity of the essential oil from the rhizome of turmeric (Curcuma longa L.). Asian J. Chem. 2011, 23, 1639–1642. [Google Scholar]
- Li, S.Y.; Li, S.P. Antioxidant activities of essential oil of Curcuma longa and Curcuma wenyujin. Int. J. Essent. Oil Ther. 2009, 3, 31–34. [Google Scholar]
- Braga, M.E.; Leal, P.F.; Carvalho, J.E.; Meireles, M.A. Comparison of yield, composition, and antioxidant activity of turmeric (Curcuma longa L.) extracts obtained using various techniques. J. Agric. Food Chem. 2003, 51. [Google Scholar] [CrossRef] [PubMed]
- Funk, J.L.; Frye, J.B.; Oyarzo, J.N.; Zhang, H.; Timmermann, B.N. Anti-arthritic effects and toxicity of the essential oils of turmeric (Curcuma longa L.). J. Agric. Food Chem. 2010, 58, 842–849. [Google Scholar] [CrossRef] [PubMed]
- Nishiyama, T.; Mae, T.; Kishida, H.; Tsukagawa, M.; Mimaki, Y.; Kuroda, M.; Sashida, Y.; Takahashi, K.; Kawada, T.; Nakagawa, K.; et al. Curcuminoids and sesquiterpenoids in turmeric (Curcuma longa L.) suppress an increase in blood glucose level in type 2 diabetic KK-Ay mice. J. Agric. Food Chem. 2005, 53, 959–963. [Google Scholar] [CrossRef] [PubMed]
- Wright, L.E.; Frye, J.B.; Timmermann, B.N.; Funk, J.L. Protection of trabecular bone in ovariectomized rats by turmeric (Curcuma longa L.) is dependent on extract composition. J. Agric. Food Chem. 2010, 58, 9498–9504. [Google Scholar] [CrossRef] [PubMed]
- Li, S.; Yuan, W.; Deng, G.; Wang, P.; Yang, P.; Aggarwal, B.B. Chemical Composition and Product Quality Control of Turmeric (Curcuma longa L.). Pharm. Crop. 2011, 2, 28–54. [Google Scholar] [CrossRef]
- Zhao, J.; Ma, S.C.; Li, S.P. Advanced strategies for quality control of Chinese medicines. J. Pharm. Biomed. Anal. 2018, 147, 473–478. [Google Scholar] [CrossRef] [PubMed]
- Majchrzak, T.; Wojnowski, W.; Dymerski, T.; Gebicki, J.; Namiesnik, J. Electronic noses in classification and quality control of edible oils: A review. Food Chem. 2018, 246, 192–201. [Google Scholar] [CrossRef] [PubMed]
- Yan, J.; Chen, G.; Tong, S.; Feng, Y.; Sheng, L.; Lou, J. Preparative isolation and purification of germacrone and curdione from the essential oil of the rhizomes of Curcuma wenyujin by high-speed counter-current chromatography. J. Chromatogr. A 2005, 1070, 207–210. [Google Scholar] [CrossRef] [PubMed]
- Dang, Y.Y.; Li, X.C.; Zhang, Q.W.; Li, S.P.; Wang, Y.T. Preparative isolation and purification of six volatile compounds from essential oil of Curcuma wenyujin using high-performance centrifugal partition chromatography. J. Sep. Sci. 2010, 33, 1658–1664. [Google Scholar] [CrossRef] [PubMed]
- Gao, X.H.; Zhang, Q.W.; Li, S.P. Preparative separation of three components from essential oil of the Curcuma longa using high performance centrifugal partition chromatography. Asian Chem. Lett. 2008, 12, 81–86. [Google Scholar]
- Yang, F.Q.; Wang, H.K.; Chen, H.; Chen, J.D.; Xia, Z.N. Fractionation of Volatile Constituents from Curcuma Rhizome by Preparative Gas Chromatography. J. Autom. Methods Manag. 2011, 2011, 942467. [Google Scholar] [CrossRef]
- Chen, Q.; Hu, X.; Wang, Y.; Gan, Z.; Jiang, S.; Liu, P.; Dai, Y.; Ni, Y. Enrichment of cuminaldehyde and p-mentha-1,4-dien-7-al in cumin (Cuminum cyminum L.) oil by molecular distillation. Sep. Purif. Technol. 2012, 98, 136–144. [Google Scholar] [CrossRef]
- Tenllado, D.; Reglero, G.; Torres, C.F. A combined procedure of supercritical fluid extraction and molecular distillation for the purification of alkylglycerols from shark liver oil. Sep. Purif. Technol. 2011, 83, 74–81. [Google Scholar] [CrossRef] [Green Version]
- Ruben, O.; Valeria, N.; Ruben, G.N. Antioxidant activity of fractions from oregano essential oils obtained by molecular distillation. Food Chem. 2014, 156, 212–219. [Google Scholar] [CrossRef]
- Machado, B.A.S.; Pereira, C.G.; Nunes, S.B.; Padilha, F.F.; Umsza-Guez, M.A. Supercritical Fluid Extraction Using CO2: Main Applications and Future Perspectives. Sep. Sci. Technol. 2013, 48, 2741–2760. [Google Scholar] [CrossRef]
- Sovova, H. Modeling the supercritical fluid extraction of essential oils from plant materials. J. Chromatogr. A 2012, 1250, 27–33. [Google Scholar] [CrossRef] [PubMed]
- Fornari, T.; Vicente, G.; Vázquez, E.; García-Risco, M.R.; Reglero, G. Isolation of essential oil from different plants and herbs by supercritical fluid extraction. J. Chromatogr. A 2012, 1250, 34–48. [Google Scholar] [CrossRef] [PubMed] [Green Version]
- Hamburger, M.; Adler, S.; Baumann, D.; Forg, A.; Weinreich, B. Preparative purification of the major anti-inflammatory triterpenoid esters from marigold (Calendula officinalis). Fitoterapia 2003, 74, 328–338. [Google Scholar] [CrossRef]
- Danielski, L.; Campos, L.M.A.S.; Bresciani, L.F.V.; Hense, H.; Yunes, R.A.; Ferreira, S.R.S. Marigold (Calendula officinalis L.) oleoresin: Solubility in SC-CO2 and composition profile. Chem. Eng. Process. 2007, 46, 99–106. [Google Scholar] [CrossRef]
- Menaker, A.; Kravets, M.; Koel, M.; Orav, A. Identification and characterization of supercritical fluid extracts from herbs. C. R. Chim. 2004, 7, 629–633. [Google Scholar] [CrossRef]
- Hamburger, M.; Baumann, D.; Adler, S. Supercritical carbon dioxide extraction of selected medicinal plants—Effects of high pressure and added ethanol on yield of extracted substances. Phytochem. Anal. 2004, 15, 46–54. [Google Scholar] [CrossRef] [PubMed]
- Reverchon, E. Supercritical fluid extraction and fractionation of essential oils and related products. J. Supercrit. Fluids 1997, 10, 1–37. [Google Scholar] [CrossRef]
- Chen, F.; Wang, Z.F.; Zhao, G.H.; Liao, X.J.; Cai, T.Y.; Guo, L.Y.; Hu, X.S. Purification process of octacosanol extracts from rice bran wax by molecular distillation. J. Food Eng. 2007, 79, 63–68. [Google Scholar] [CrossRef]
- Qin, N.Y.; Yang, F.Q.; Wang, Y.T.; Li, S.P. Quantitative determination of eight components in rhizome (Jianghuang) and tuberous root (Yujin) of Curcuma longa using pressurized liquid extraction and gas chromatography-mass spectrometry. J. Pharm. Biomed. 2007, 43, 486–492. [Google Scholar] [CrossRef] [PubMed]
- Wang, Z.M.; Gao, H.M.; Fu, X.T.; Wang, W.H. Multi-components quantitation by one marker new method for quality evaluation of Chinese herbal medicine. Zhongguo Zhongyao Zazhi 2006, 31, 1925–1928. [Google Scholar] [PubMed]
- Li, S.P.; Qiao, C.F.; Chen, Y.W.; Zhao, J.; Cui, X.M.; Zhang, Q.W.; Liu, X.M.; Hu, D.J. A novel strategy with standardized reference extract qualification and single compound quantitative evaluation for quality control of Panax notoginseng used as a functional food. J. Chromatogr. A 2013, 1313, 302–307. [Google Scholar] [CrossRef] [PubMed]
- Hiserodt, R.; Hartman, T.G.; Ho, C.T.; Rosen, R.T. Characterization of powdered turmeric by liquid chromatography mass spectrometry and gas chromatography mass spectrometry. J. Chromatogr. A 1996, 740, 51–63. [Google Scholar] [CrossRef]
- Hong, C.H.; Kim, Y.; Lee, S.K. Sesquiterpenoids from the rhizome of Curcuma zedoaria. Arch. Pharm. Res. 2001, 24, 424–426. [Google Scholar] [CrossRef] [PubMed]
- Cong, P.Z. Organic Mass Spectrometry; Medicinal Technologies Publishing House of China: Beijing, China, 2003. [Google Scholar]
- Takigawa, H.; Kubota, H.; Sonohara, H.; Okuda, M.; Tanaka, S.; Fujikura, Y.; Ito, S. Novel Allylic Oxidation of Alpha-Cedrene to Sec-Cedrenol by a Rhodococcus Strain. Appl. Environ. Microb. 1993, 59, 1336–1341. [Google Scholar]
Sample Availability: Samples of the compounds used in this study are available from the authors. |


| Analyte | RT (min) | SFE Extract | D1 | D2 | D3 | D4 | R1 | R2 | R3 | R4 |
|---|---|---|---|---|---|---|---|---|---|---|
| β-caryophyllene | 7.030 | 35.7 | 59.2 | 29.7 | − a | − | 12.7 | + b | − | − |
| ar-curcumene | 8.076 | 221.2 | 263.1 | 264.3 | 53.4 | 63.6 | 171.2 | 85.7 | 18.7 | + |
| zingiberene | 8.352 | 139.9 | 171.1 | 201.4 | 67.8 | 49.6 | 103.6 | 54.5 | + | − |
| β-bisabolene | 8.675 | 61.3 | 71.9 | 78.2 | 19.5 | 19.7 | 48.3 | 24.5 | 4.0 | − |
| β-sesquiphellandrene | 9.104 | 93.8 | 108.3 | 130.9 | 53.0 | 46.6 | 83.5 | 51.3 | 14.3 | 6.2 |
| ar-turmerone | 14.080 | 128.2 | 57.4 | 111.3 | 360.9 | 413.3 | 209.1 | 263.4 | 248.3 | 244.2 |
| α-turmerone | 14.180 | 54.8 | 26.7 | 57.6 | 261.1 | 208.0 | 84.4 | 108.4 | 92.6 | 82.3 |
| β-turmerone | 14.715 | 25.2 | 9.1 | 19.9 | 87.4 | 80.9 | 40.5 | 53.9 | 53.4 | 55.1 |
| Purity | 76.0% | 76.7% | 89.3% | 90.3% | 88.2% | 75.3% | 64.2% | 43.1% | 38.8% |
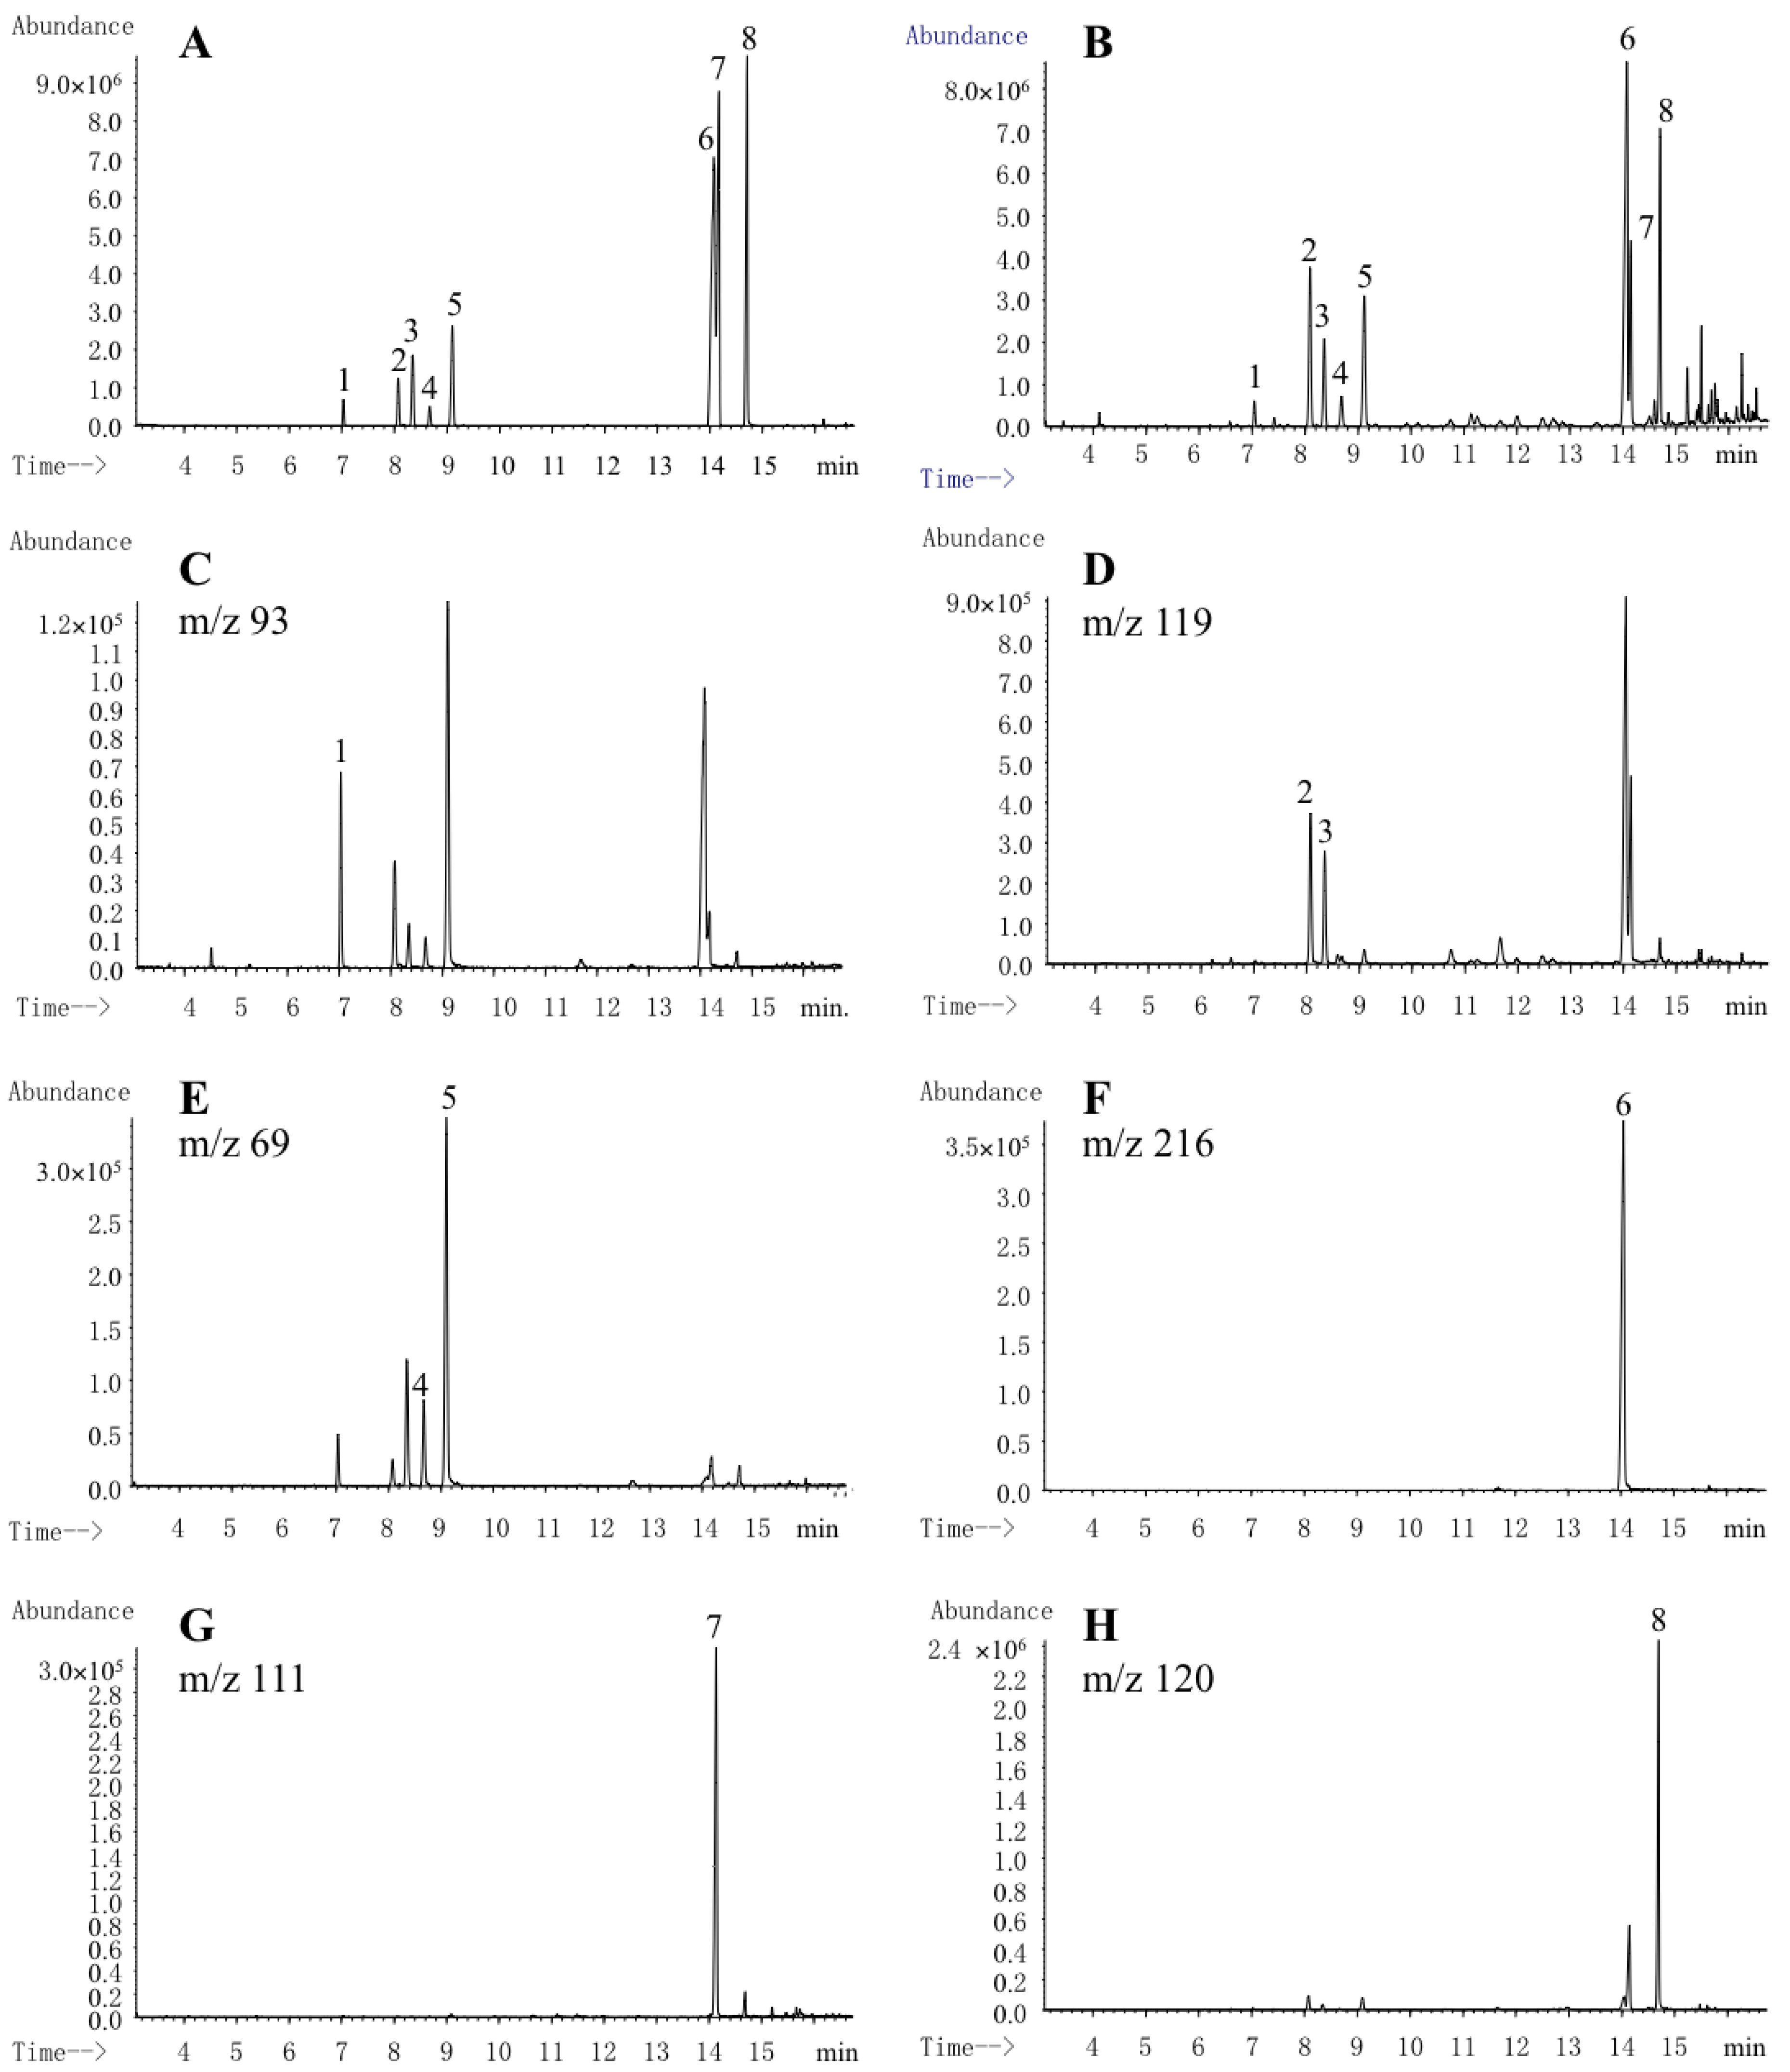
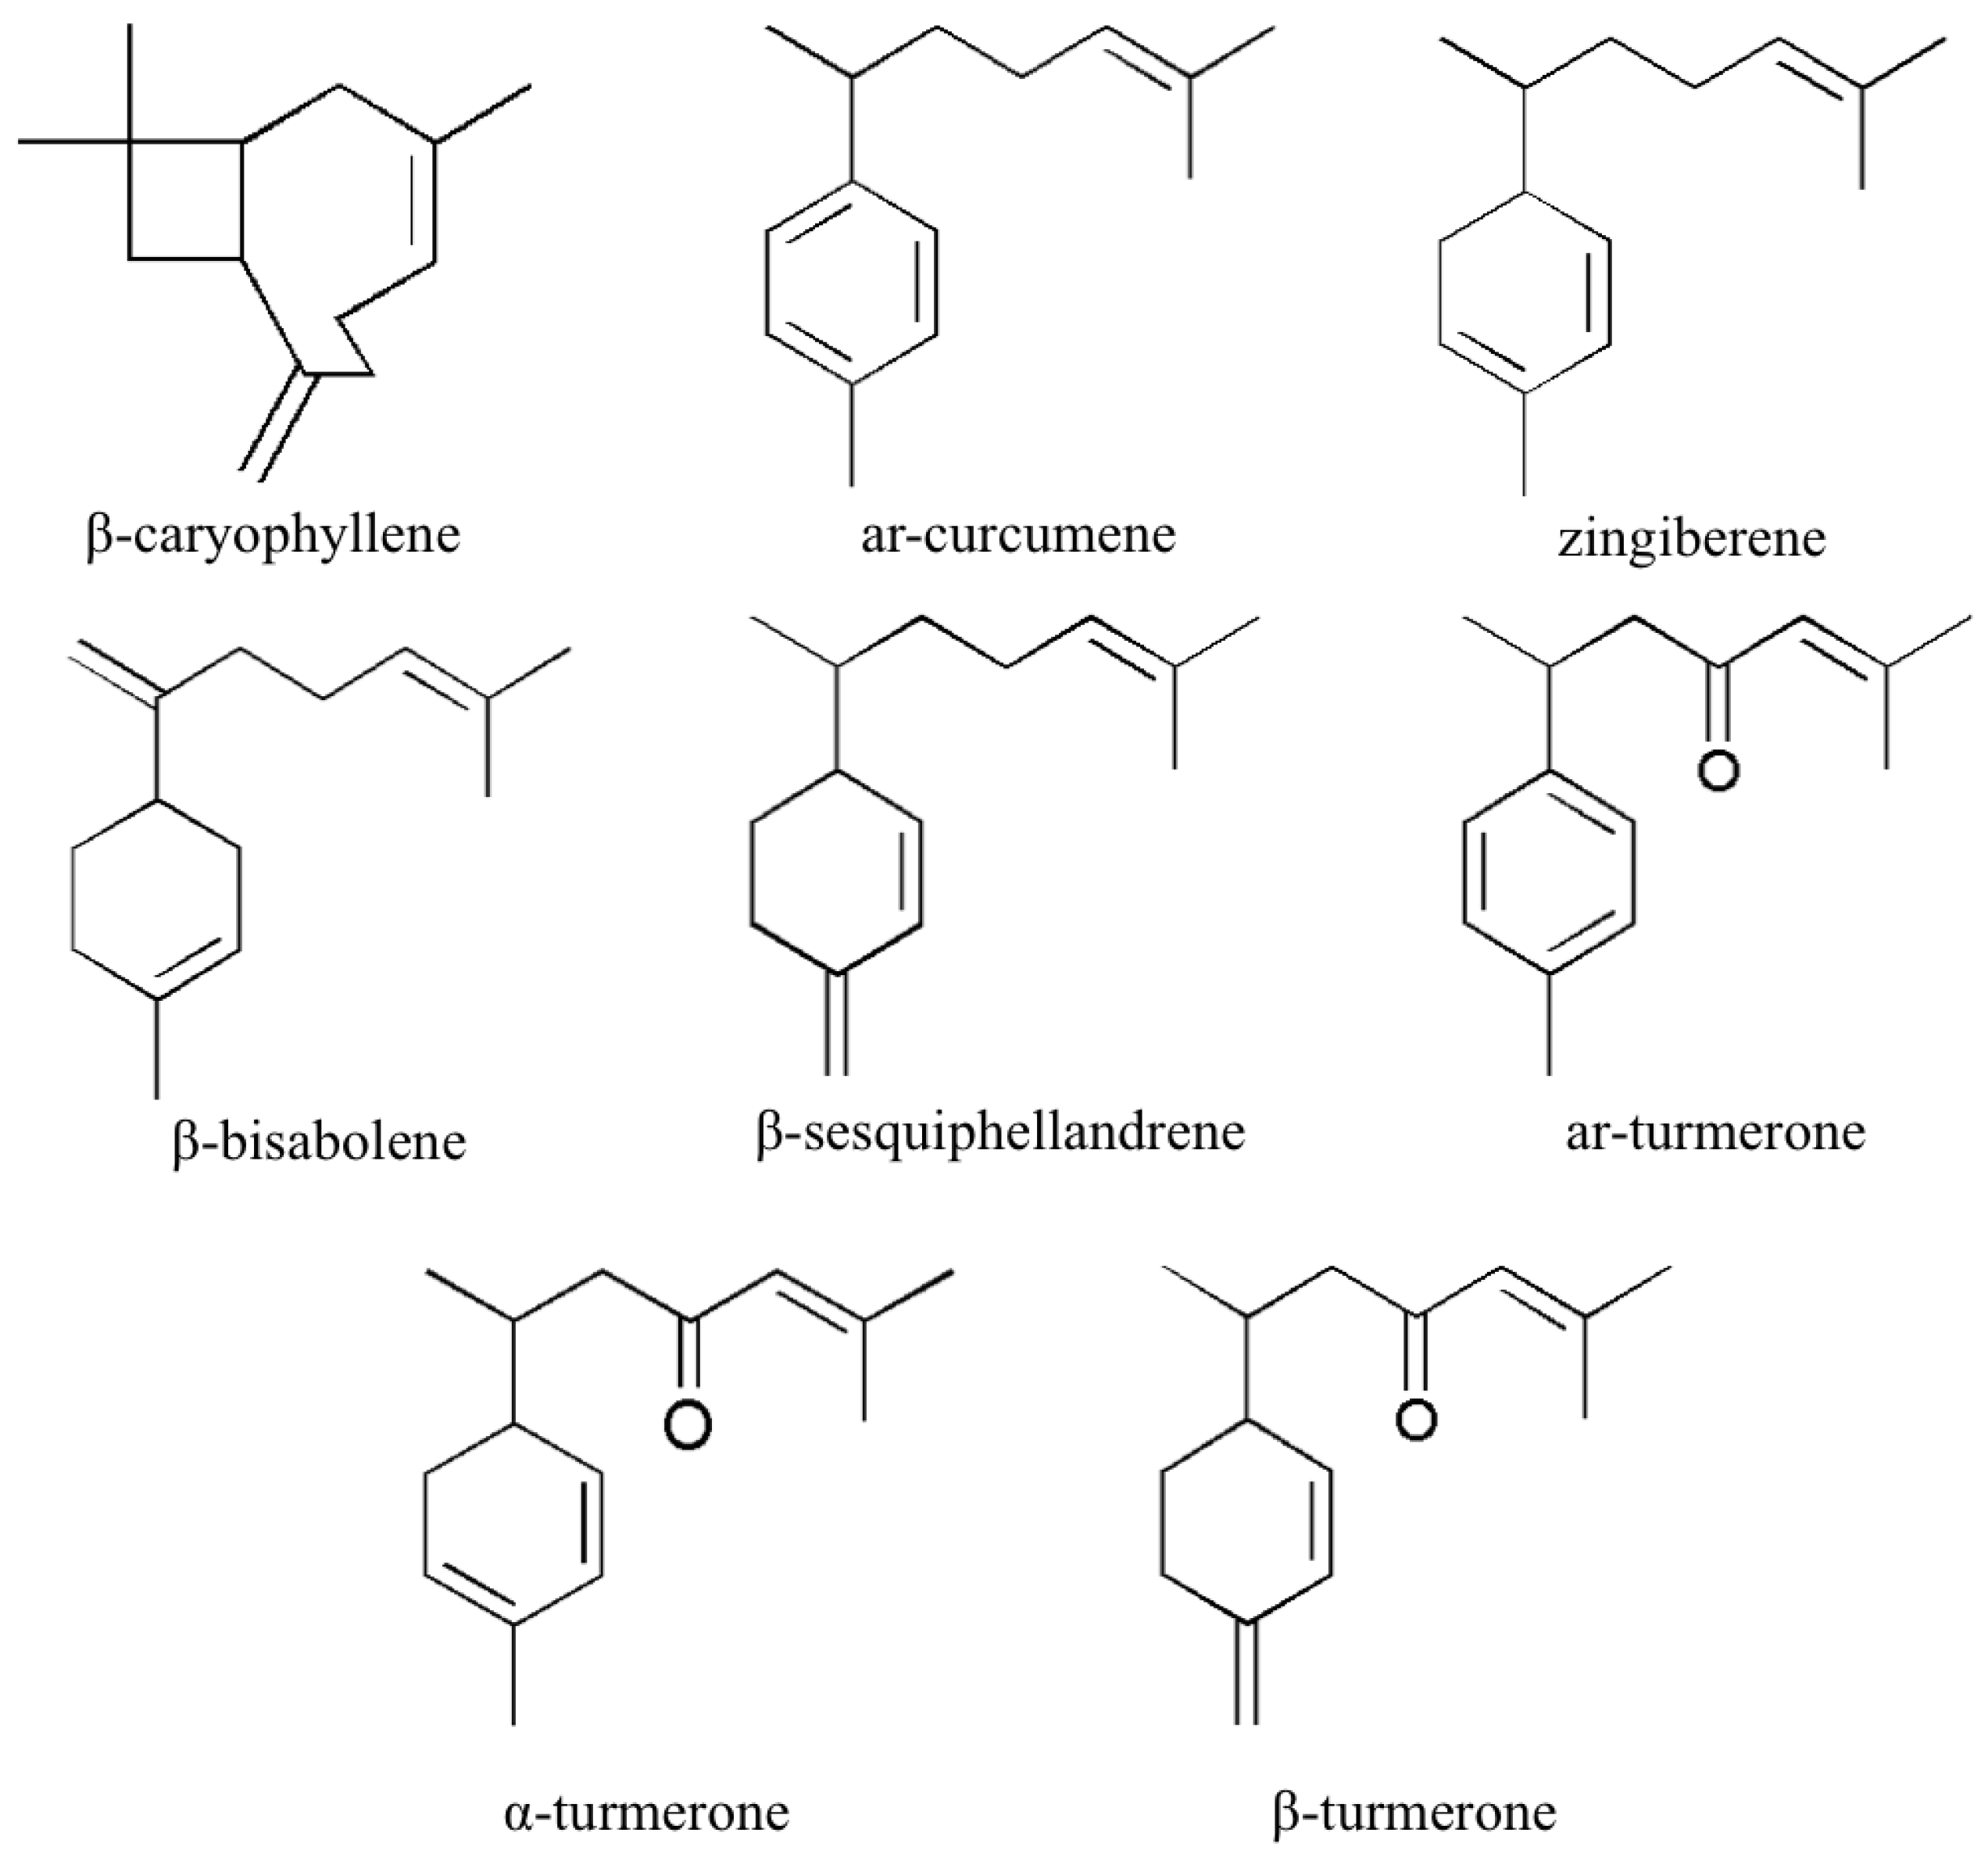
| Compound | EIC | Mass Data |
|---|---|---|
| β-caryophyllene | 93 | 204(M+, 12), 161(38), 133(95), 119(35), 105(54), 93(100), 91(88), 79(81), 69(79), 55(36), 41(77) |
| ar-curcumene | 119 | 202(M+, 31), 145(25), 132(98), 131(26), 120(27), 119(100), 117(23), 105(47), 91(24), 41(22) |
| zingiberene | 119 | 204(M+, 11), 119(100), 93(82), 91(35), 77(23), 69(26), 56(10), 55(9), 41(19) |
| β-bisabolene | 69 | 204(M+, 29), 161(23), 135(13), 121(7), 119(69), 109(28), 93(81), 79(37), 69(100), 67(39), 41(71) |
| β-sesquiphellandrene | 69 | 204(M+, 27), 161(49), 133(36), 120(36), 93(64), 91(55), 77(37), 69(100) |
| ar-turmerone | 216 | 216(M+, 30), 201(20), 132(20), 120(7), 119(72), 117(14), 115(8), 105(11), 91(14), 83(100), 55(15) |
| α-turmerone | 111 | 218(M+, 4), 120(55), 119(50), 111(27), 105(97), 93(19), 91(32), 85(15), 83(100), 77(23), 55(23) |
| β-turmerone | 120 | 218(M+, 2), 121(10), 120(100), 105(15), 93(3), 92(6), 91(13), 83(25), 79(4), 77(7), 55(9) |
| Analytes | Linear Regression Data | LOD (ng) | LOQ (ng) | ||
|---|---|---|---|---|---|
| Regressive Equation | Test Range (ng) | R2 | |||
| β-caryophyllene | y = 9890.2 x + 2434.0 | 0.77–49.06 | 0.9993 | 0.21 | 0.37 |
| ar-curcumene | y = 23935.5 x + 466.0 | 0.59–28.52 | 0.9992 | 0.13 | 0.28 |
| zingiberene | y = 17561.3 x − 17360.2 | 2.21–106.01 | 0.9991 | 0.82 | 1.87 |
| β-bisabolene | y = 14340.6 x − 5571.0 | 0.71–22.76 | 0.9995 | 0.16 | 0.30 |
| β-sesquiphellandrene | y = 10306.9 x − 9855.2 | 1.20–28.83 | 0.9991 | 0.27 | 0.58 |
| ar-turmerone | y = 8418.0 x − 663.8 | 1.45–46.49 | 0.9992 | 0.32 | 0.89 |
| α-turmerone | y = 4553.1 x − 212.3 | 8.89–106.68 | 0.9994 | 0.85 | 1.92 |
| β-turmerone | y = 38206.5 x − 95098.8 | 1.26–120.68 | 0.9990 | 0.28 | 0.53 |
| Analyte | Recovery (%, RSD, n = 6) | Precision (RSD, %, n = 6) | Repeatability (RSD, %, n = 3) | Stability (RSD, %, n = 6) | ||||||
|---|---|---|---|---|---|---|---|---|---|---|
| Intra-day | Inter-day | Low | Middle | High | Sample Solution | STVCF Solution | ||||
| 24 h | 48 h | 24 h | 48 h | |||||||
| β-caryophyllene | 98.3 (2.3) | 1.2 | 1.5 | 4.6 | 1.9 | 3.4 | 1.2 | 1.8 | − a | − |
| ar-curcumene | 100.5 (2.8) | 1.4 | 1.4 | 4.4 | 1.5 | 2.7 | 1.6 | 2.1 | 2.8 | 2.9 |
| zingiberene | 100.9 (2.8) | 1.6 | 1.7 | 4.1 | 3.0 | 2.8 | 0.5 | 2.5 | 1.0 | 2.1 |
| β-bisabolene | 99.9 (3.2) | 0.9 | 1.5 | 3.1 | 1.9 | 4.4 | 0.3 | 3.0 | 2.5 | 2.7 |
| β-sesquiphellandrene | 100.7 (3.3) | 1.1 | 1.3 | 4.4 | 2.1 | 2.5 | 0.7 | 2.0 | 1.5 | 2.6 |
| ar-turmerone | 99.9 (4.0) | 1.8 | 2.1 | 4.9 | 3.8 | 3.8 | 1.2 | 2.6 | 1.4 | 3.4 |
| α-turmerone | 100.3 (4.2) | 1.9 | 1.8 | 4.8 | 3.3 | 4.9 | 0.8 | 1.2 | 1.7 | 4.1 |
| β-turmerone | 101.1 (4.7) | 1.7 | 2.2 | 4.7 | 4.0 | 4.4 | 0.9 | 3.0 | 0.2 | 3.7 |
| Samples | β-caryophyllene | ar-curcumene | zingiberene | β-bisabolene | β-sesquiphelland-rene | ar-turmerone | α-turmerone | β-turmerone | Total | ||||||||||||||||
|---|---|---|---|---|---|---|---|---|---|---|---|---|---|---|---|---|---|---|---|---|---|---|---|---|---|
| M1 | M2 | PD (%) | M1 | M2 | PD (%) | M1 | M2 | PD (%) | M1 | M2 | PD (%) | M1 | M2 | PD (%) | M1 | M2 | PD (%) | M1 | M2 | PD (%) | M1 | M2 | PD (%) | ||
| JH-1 | + a | − b | - | 0.9 | 1.0 | 4.7 | 2.9 | 2.8 | 4.2 | 0.4 | 0.4 | 1.4 | 2.4 | 2.2 | 6.1 | 11.3 | 11.6 | 2.3 | 27.8 | 28.8 | 3.4 | 10.0 | 9.4 | 6.2 | 55.7 |
| JH-2 | + | − | - | 0.7 | 0.8 | 5.0 | 2.7 | 2.6 | 4.9 | 0.3 | 0.3 | 2.5 | 2.0 | 1.9 | 7.2 | 9.5 | 9.7 | 2.1 | 23.6 | 24.1 | 2.1 | 8.4 | 7.9 | 6.6 | 47.2 |
| JH-3 | 0.3 | − | - | 3.1 | 3.3 | 3.9 | 2.7 | 2.5 | 5.1 | 1.0 | 0.9 | 1.6 | 3.8 | 3.7 | 4.0 | 11.4 | 11.6 | 2.3 | 13.0 | 12.3 | 5.6 | 6.7 | 6.2 | 7.2 | 41.9 |
| JH-4 | + | − | - | 0.7 | 0.7 | 5.1 | 2.1 | 2.0 | 7.9 | 0.3 | 0.3 | 3.2 | 1.8 | 1.7 | 7.8 | 9.8 | 10.0 | 2.2 | 22.2 | 22.6 | 1.5 | 8.3 | 7.7 | 6.6 | 45.2 |
| JH-5 | 1.2 | − | - | 2.4 | 2.5 | 4.0 | 11.8 | 12.2 | 3.3 | 1.3 | 1.3 | 2.1 | 6.8 | 6.7 | 2.5 | 8.1 | 8.3 | 2.0 | 31.1 | 32.5 | 4.3 | 9.1 | 8.5 | 6.4 | 71.8 |
| JH-6 | 0.8 | − | - | 2.3 | 2.3 | 4.1 | 11.7 | 12.1 | 3.3 | 1.4 | 1.3 | 2.2 | 6.7 | 6.5 | 2.5 | 7.3 | 7.4 | 1.9 | 29.2 | 30.3 | 3.8 | 8.4 | 7.9 | 6.6 | 67.6 |
| JH-7 | 0.8 | − | - | 1.2 | 1.3 | 4.4 | 6.4 | 6.5 | 1.3 | 0.7 | 0.7 | 0.8 | 3.5 | 3.3 | 4.3 | 4.4 | 4.5 | 1.2 | 17.6 | 17.4 | 1.1 | 4.7 | 4.3 | 8.5 | 39.4 |
| JH-8 | 1.6 | − | - | 1.7 | 1.8 | 4.2 | 15.0 | 15.6 | 3.8 | 1.5 | 1.4 | 2.3 | 7.5 | 7.4 | 2.3 | 7.2 | 7.3 | 1.9 | 37.9 | 40.0 | 5.4 | 9.9 | 9.3 | 6.2 | 82.2 |
| JH-9 | 1.5 | − | - | 2.3 | 2.3 | 4.1 | 14.7 | 15.3 | 3.7 | 1.5 | 1.5 | 2.4 | 7.7 | 7.6 | 2.3 | 8.8 | 9.0 | 2.1 | 36.4 | 38.4 | 5.2 | 10.2 | 9.6 | 6.1 | 83.2 |
| JH-10 | 1.4 | − | - | 1.9 | 2.0 | 4.1 | 13.3 | 13.8 | 3.5 | 1.4 | 1.4 | 2.2 | 7.2 | 7.0 | 2.4 | 8.4 | 8.6 | 2.0 | 38.3 | 40.5 | 5.5 | 10.8 | 10.2 | 6.0 | 82.8 |
| JH-11 | 1.2 | − | - | 1.9 | 1.9 | 4.2 | 12.6 | 13.0 | 3.4 | 1.3 | 1.3 | 2.1 | 6.5 | 6.4 | 2.6 | 7.4 | 7.5 | 1.9 | 31.1 | 32.5 | 4.3 | 8.7 | 8.1 | 6.5 | 70.7 |
| JH-12 | 1.4 | − | - | 1.8 | 1.8 | 4.2 | 11.9 | 12.3 | 3.3 | 1.2 | 1.2 | 2.0 | 6.5 | 6.3 | 2.6 | 6.7 | 6.8 | 1.8 | 33.2 | 34.8 | 4.7 | 8.8 | 8.2 | 6.5 | 71.5 |
| JH-13 | 1.1 | − | - | 2.1 | 2.1 | 4.1 | 11.9 | 12.3 | 3.3 | 1.3 | 1.3 | 2.1 | 6.7 | 6.5 | 2.5 | 7.3 | 7.4 | 1.9 | 31.5 | 32.9 | 4.3 | 9.0 | 8.4 | 6.4 | 70.8 |
| JH-14 | 1.2 | − | - | 1.7 | 1.7 | 4.2 | 13.4 | 13.9 | 3.6 | 1.3 | 1.3 | 2.1 | 6.7 | 6.5 | 2.5 | 6.5 | 6.6 | 1.8 | 31.9 | 33.4 | 4.4 | 8.6 | 8.0 | 6.5 | 71.3 |
| JH-15 | 0.5 | − | - | 4.2 | 4.4 | 3.8 | 3.0 | 2.9 | 3.7 | 0.9 | 0.9 | 1.4 | 4.3 | 4.1 | 3.6 | 16.9 | 17.3 | 2.5 | 6.1 | 4.6 | 8.1 | 6.5 | 6.0 | 7.3 | 42.4 |
| JH-16 | 0.9 | − | - | 1.9 | 2.0 | 4.1 | 10.4 | 10.7 | 3.0 | 1.1 | 1.1 | 1.9 | 5.6 | 5.5 | 2.9 | 6.9 | 7.1 | 1.8 | 28.1 | 29.1 | 3.5 | 8.0 | 7.5 | 6.7 | 63.0 |
| JH-17 | 0.8 | − | - | 2.7 | 2.8 | 4.0 | 8.9 | 9.1 | 2.5 | 1.2 | 1.1 | 1.9 | 5.9 | 5.8 | 2.8 | 11.8 | 12.1 | 2.3 | 21.3 | 21.6 | 1.1 | 8.4 | 7.8 | 6.6 | 61.0 |
| JH-18 | 0.6 | − | - | 1.0 | 1.0 | 4.7 | 7.3 | 7.4 | 1.8 | 0.7 | 0.7 | 0.7 | 3.6 | 3.4 | 4.2 | 9.8 | 10.0 | 2.2 | 18.9 | 18.8 | 0.2 | 6.6 | 6.2 | 7.2 | 48.5 |
| JH-19 | 0.5 | − | - | 0.8 | 0.8 | 4.9 | 6.4 | 6.5 | 1.3 | 0.6 | 0.6 | 0.3 | 3.0 | 2.9 | 4.9 | 8.1 | 8.3 | 2.0 | 16.8 | 16.6 | 1.6 | 5.9 | 5.5 | 7.6 | 42.2 |
| Cos (θ) | − | 1.000 | 0.9999 | 1.000 | 1.000 | 1.000 | 0.9998 | 1.000 | |||||||||||||||||
© 2018 by the authors. Licensee MDPI, Basel, Switzerland. This article is an open access article distributed under the terms and conditions of the Creative Commons Attribution (CC BY) license (http://creativecommons.org/licenses/by/4.0/).
Share and Cite
Lv, G.-P.; Hu, D.-J.; Zhou, Y.-Q.; Zhang, Q.-W.; Zhao, J.; Li, S.-P. Preparation and Application of Standardized Typical Volatile Components Fraction from Turmeric (Curcuma longa L.) by Supercritical Fluid Extraction and Step Molecular Distillation. Molecules 2018, 23, 1831. https://0-doi-org.brum.beds.ac.uk/10.3390/molecules23071831
Lv G-P, Hu D-J, Zhou Y-Q, Zhang Q-W, Zhao J, Li S-P. Preparation and Application of Standardized Typical Volatile Components Fraction from Turmeric (Curcuma longa L.) by Supercritical Fluid Extraction and Step Molecular Distillation. Molecules. 2018; 23(7):1831. https://0-doi-org.brum.beds.ac.uk/10.3390/molecules23071831
Chicago/Turabian StyleLv, Guang-Ping, De-Jun Hu, Yan-Qing Zhou, Qing-Wen Zhang, Jing Zhao, and Shao-Ping Li. 2018. "Preparation and Application of Standardized Typical Volatile Components Fraction from Turmeric (Curcuma longa L.) by Supercritical Fluid Extraction and Step Molecular Distillation" Molecules 23, no. 7: 1831. https://0-doi-org.brum.beds.ac.uk/10.3390/molecules23071831