Formation of Prenylated Chalcone Xanthohumol Cocrystals: Single Crystal X-ray Diffraction, Vibrational Spectroscopic Study Coupled with Multivariate Analysis


Abstract
:
1. Introduction
2. Results and Discussion
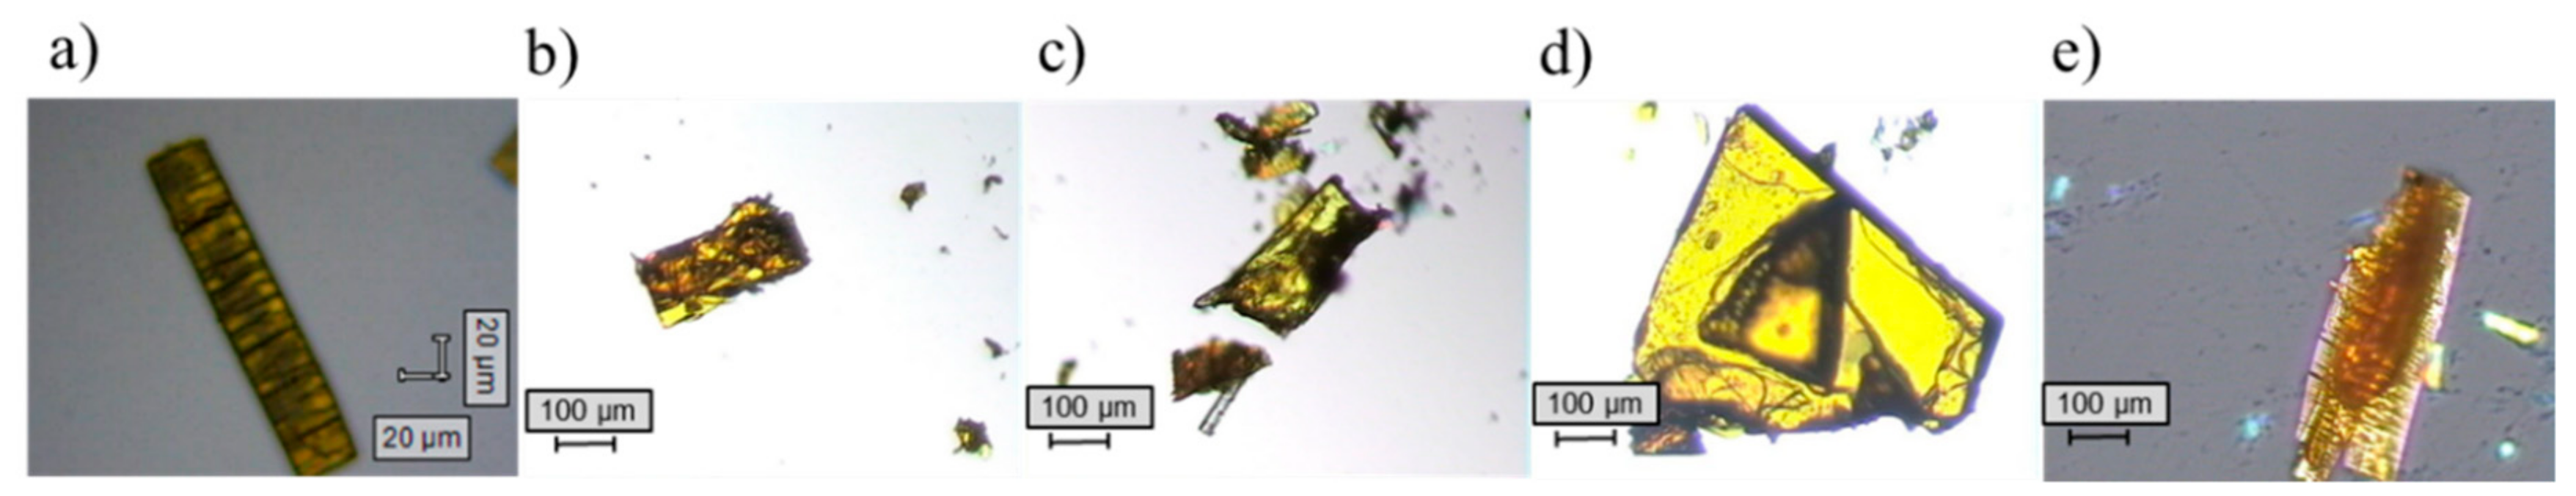
2.1. Single Crystal X-ray Diffraction
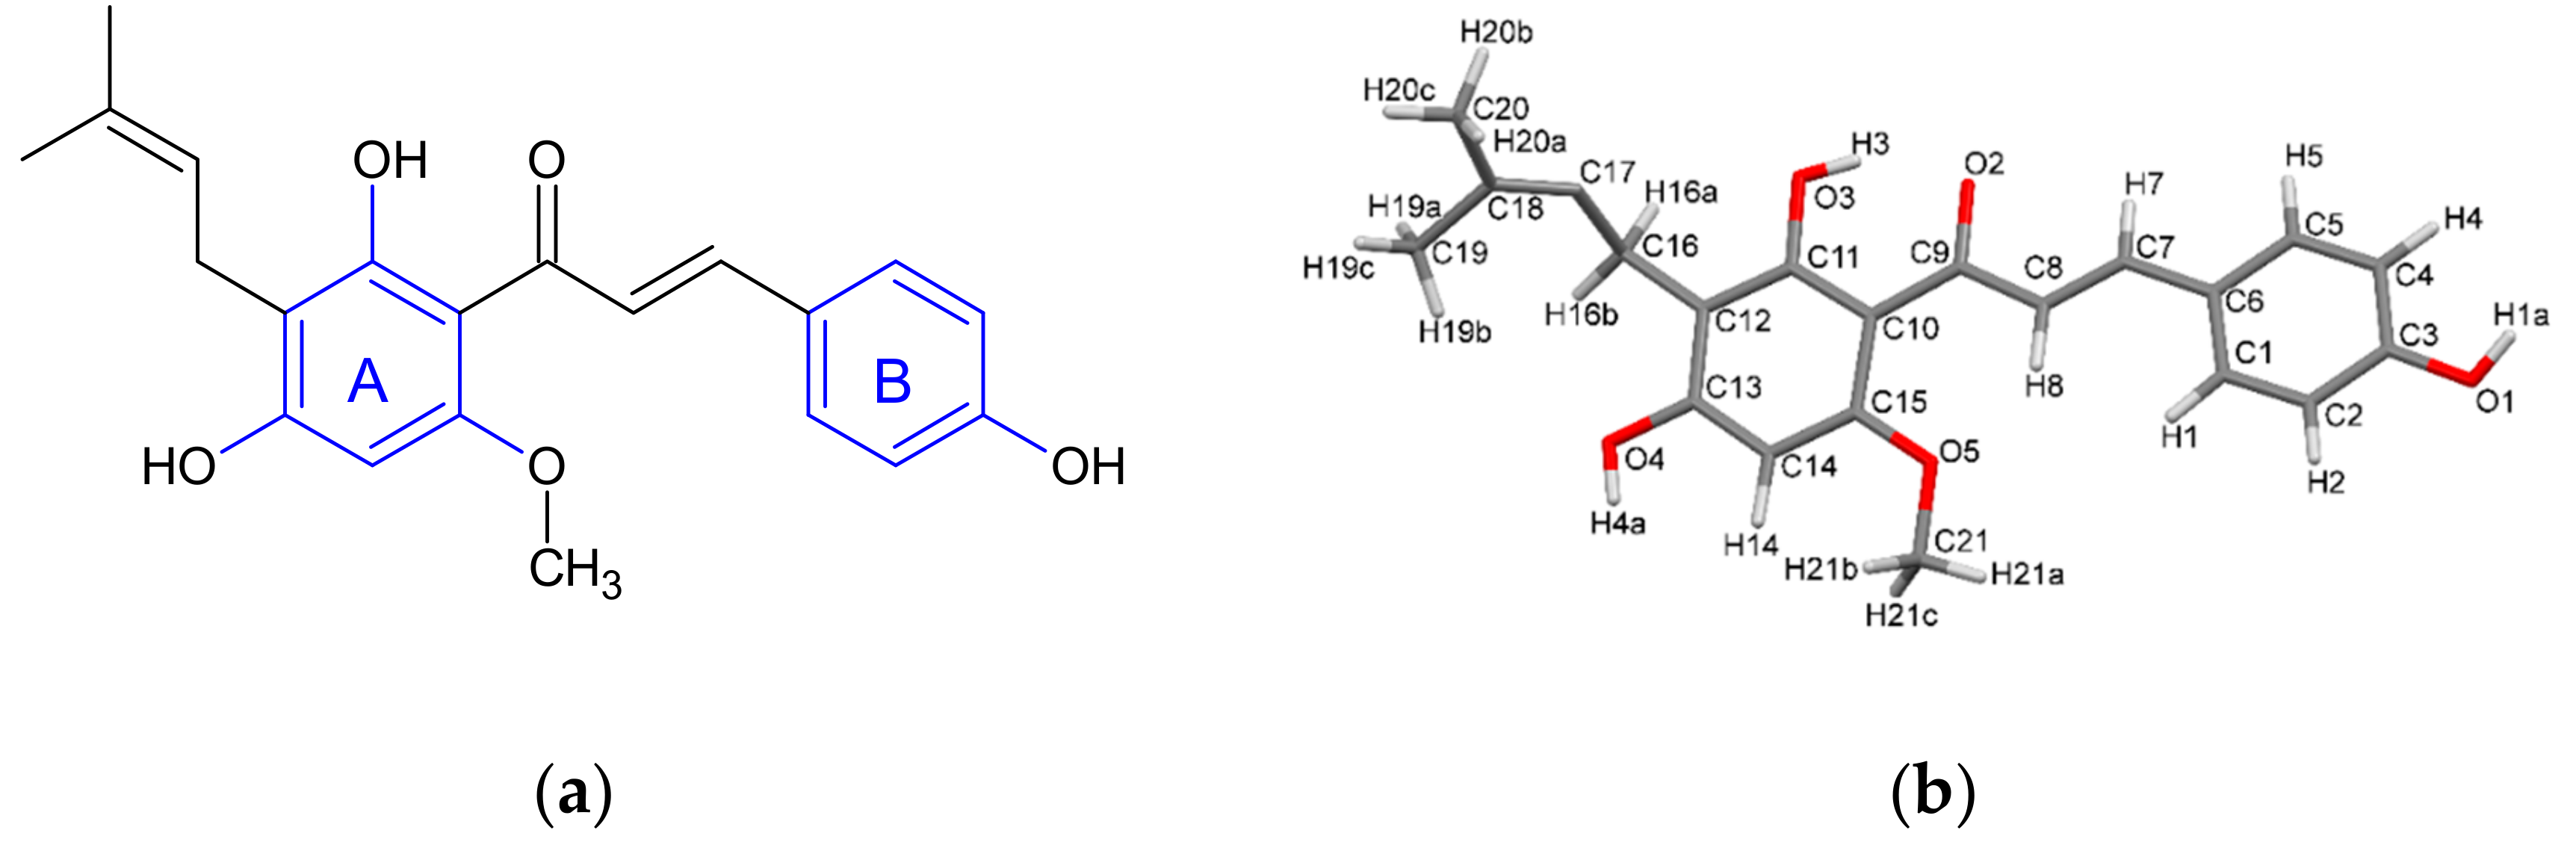
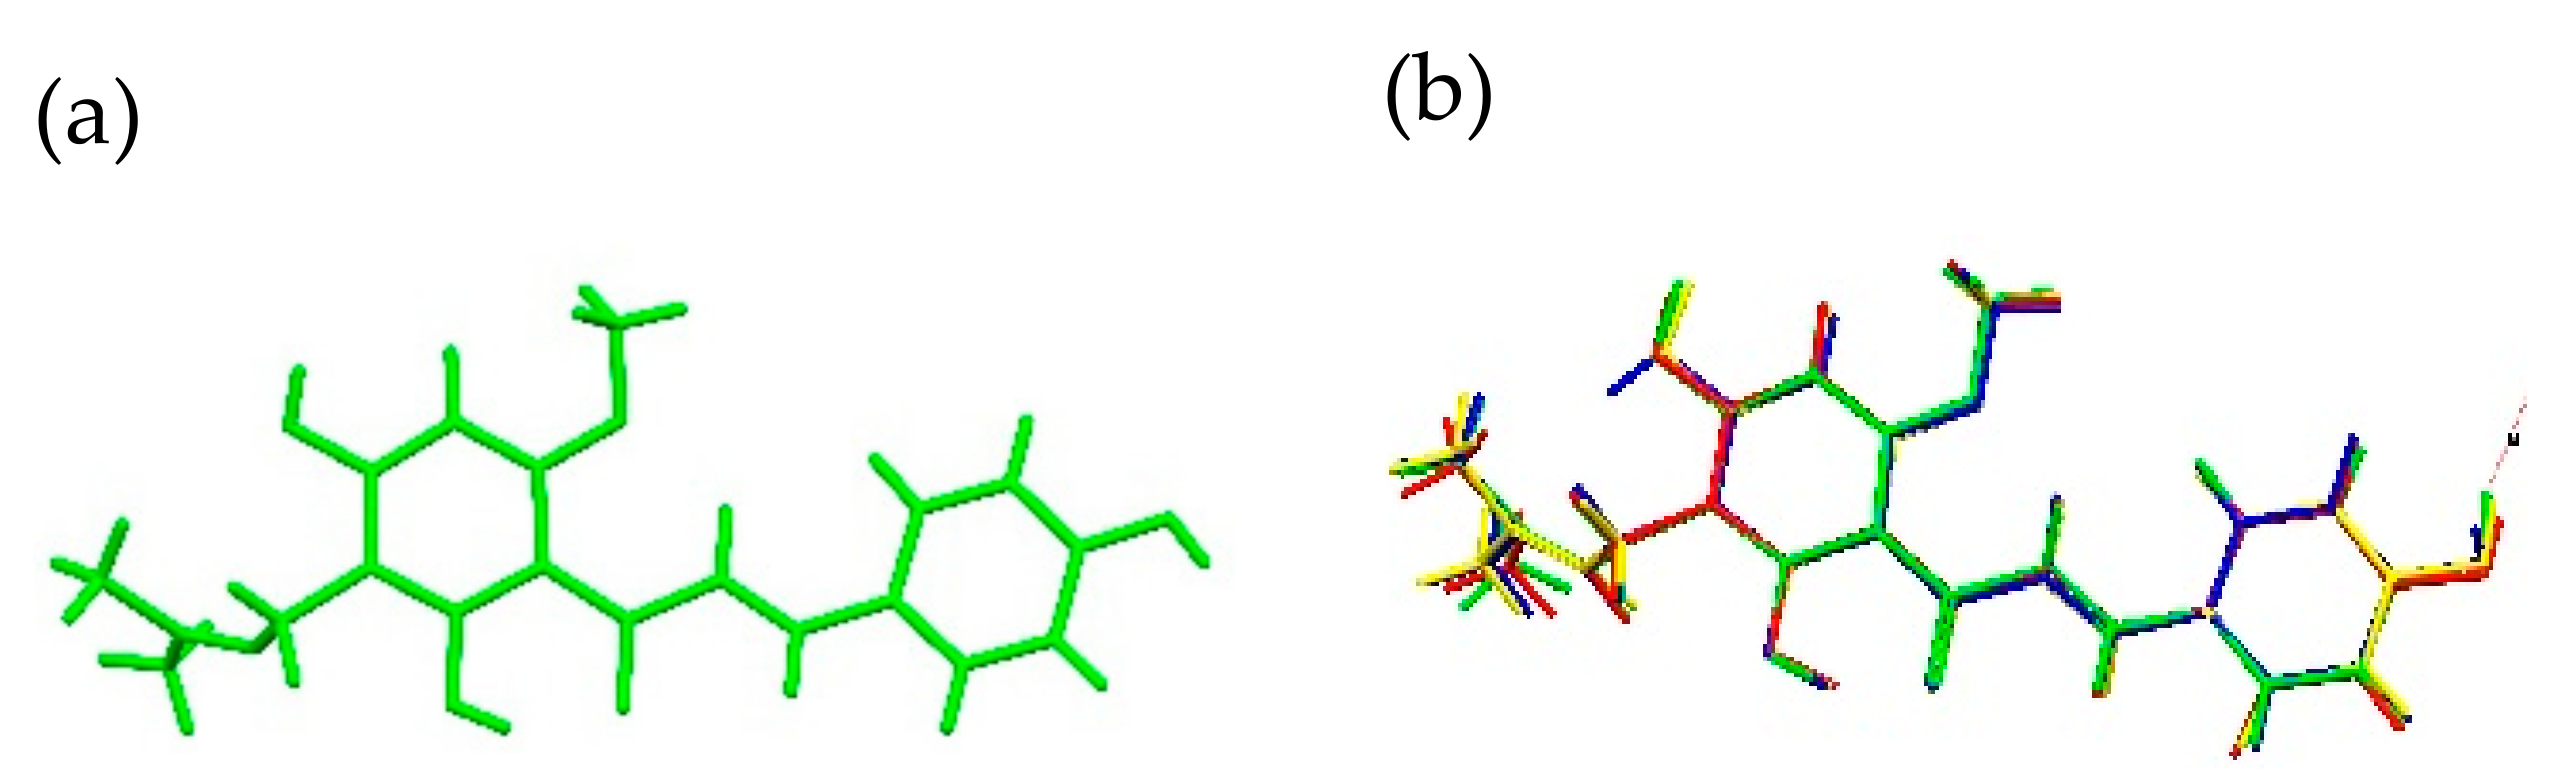
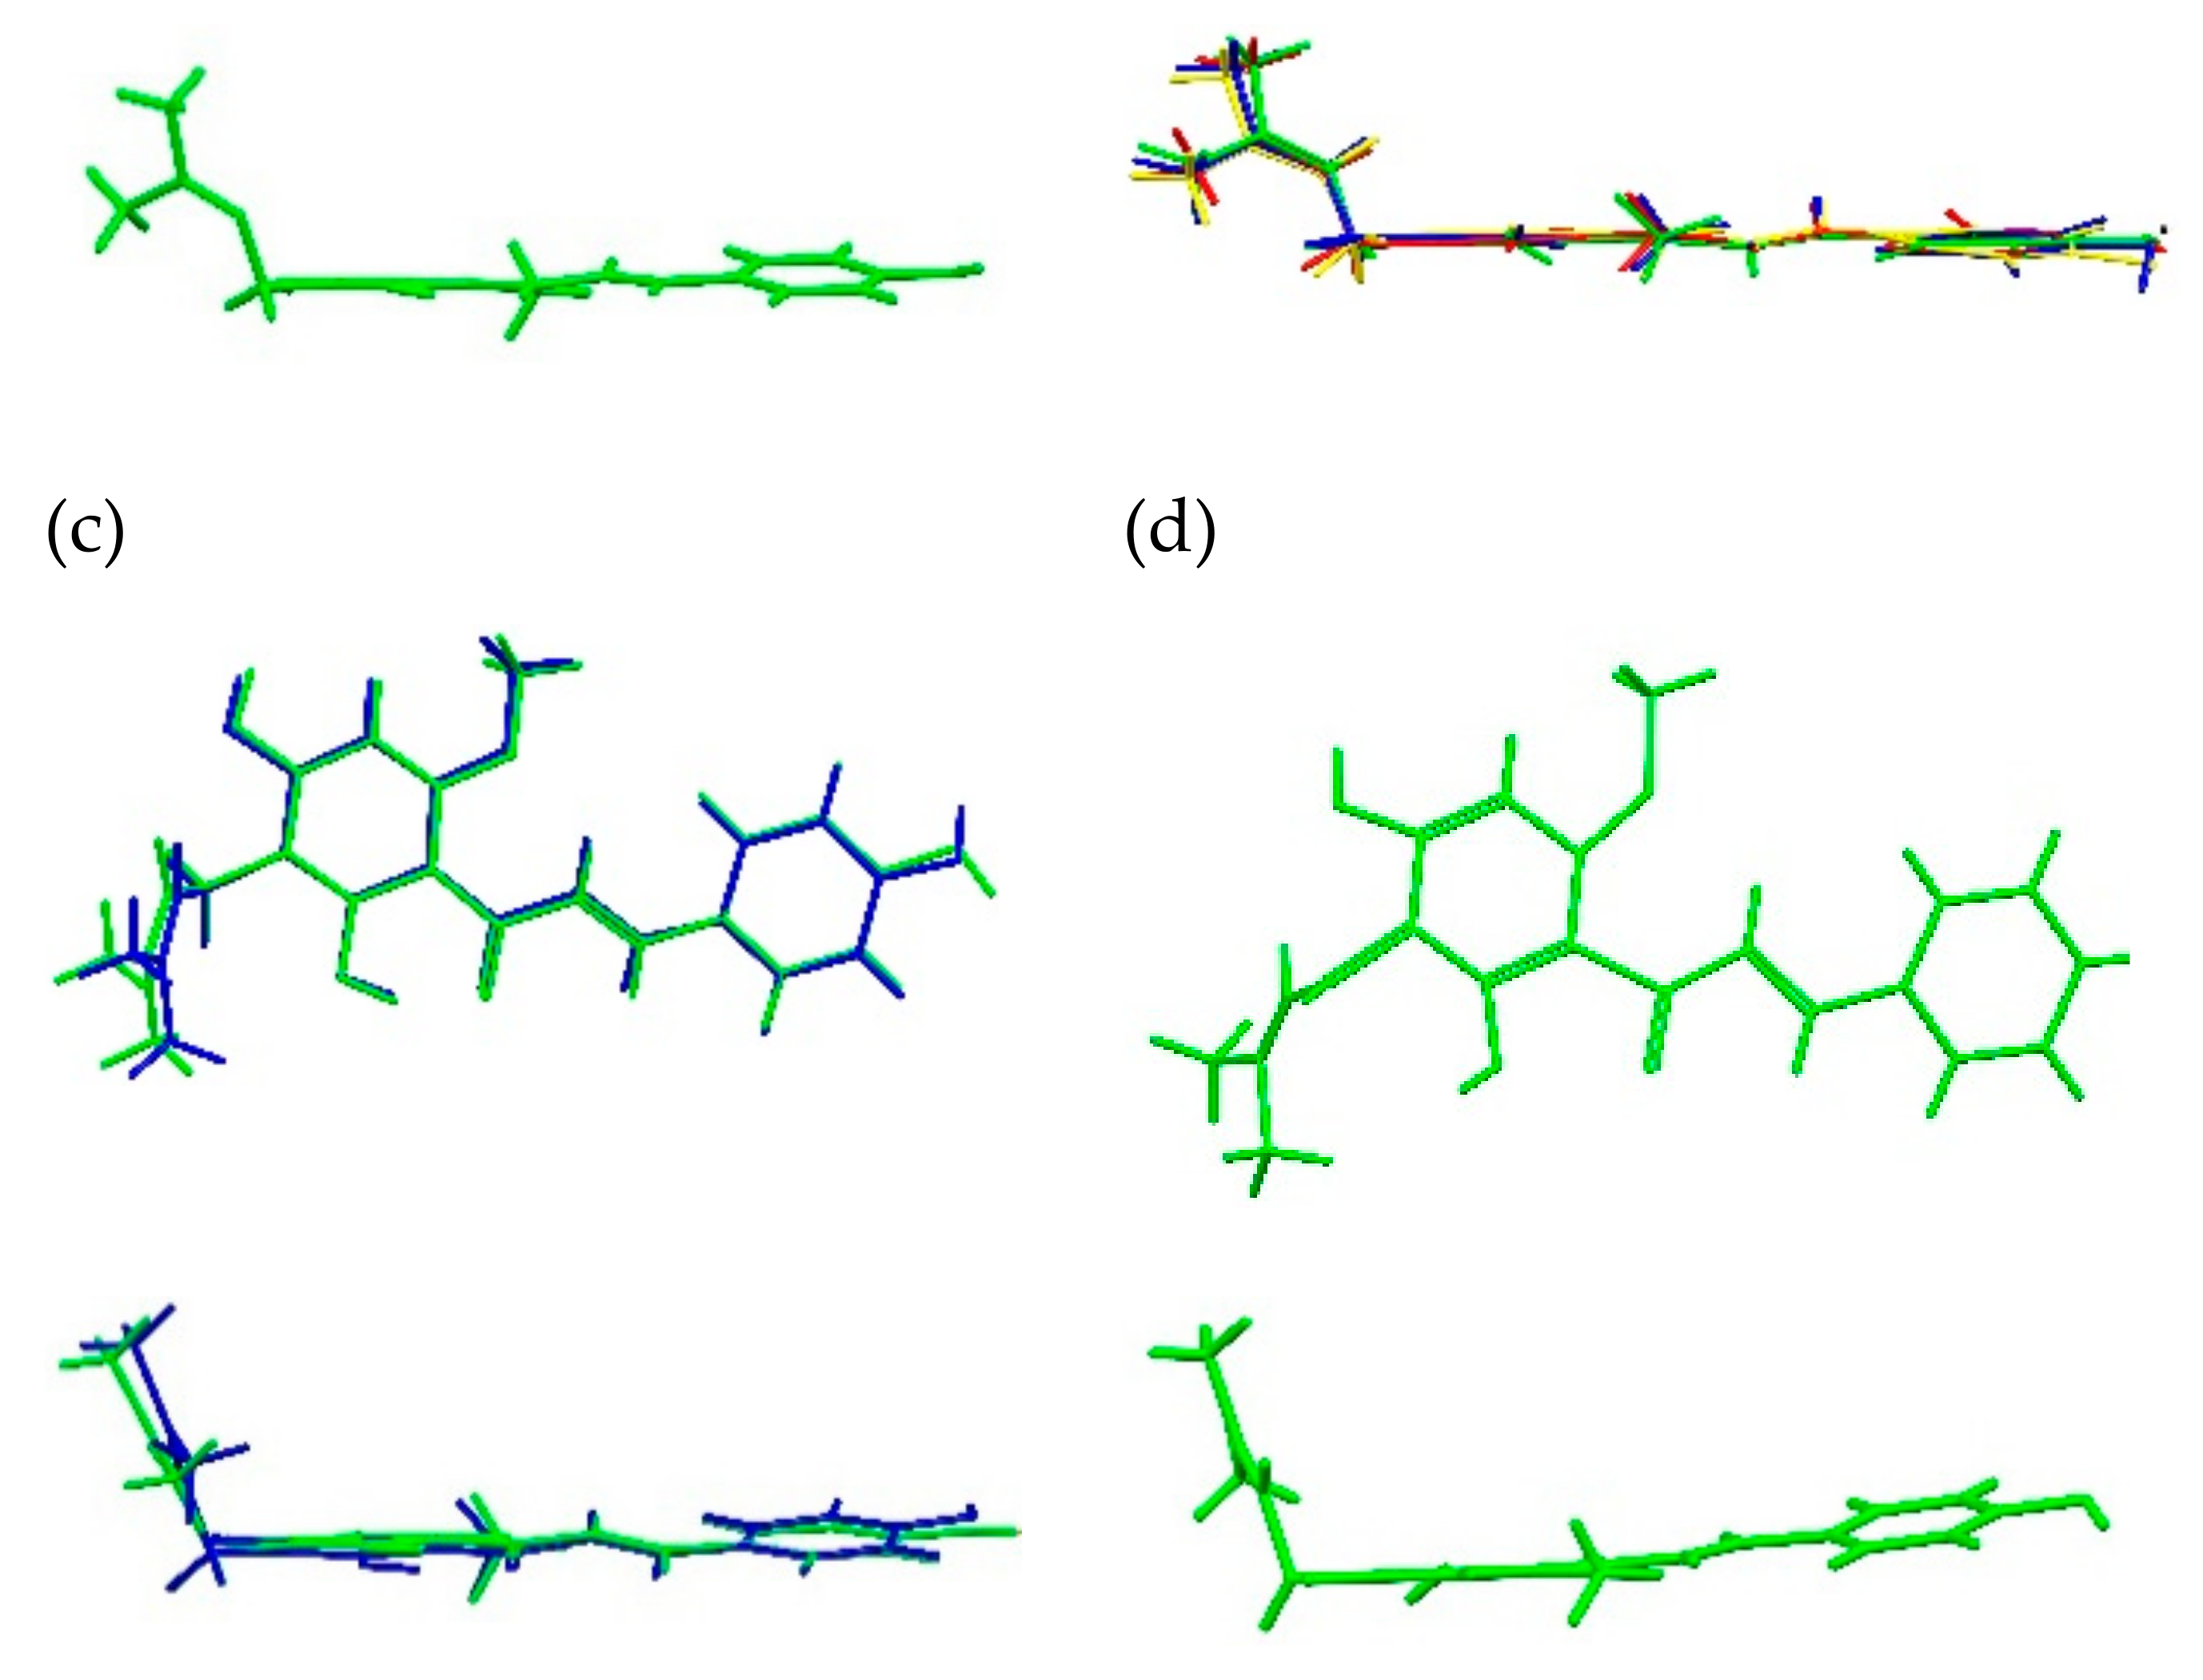
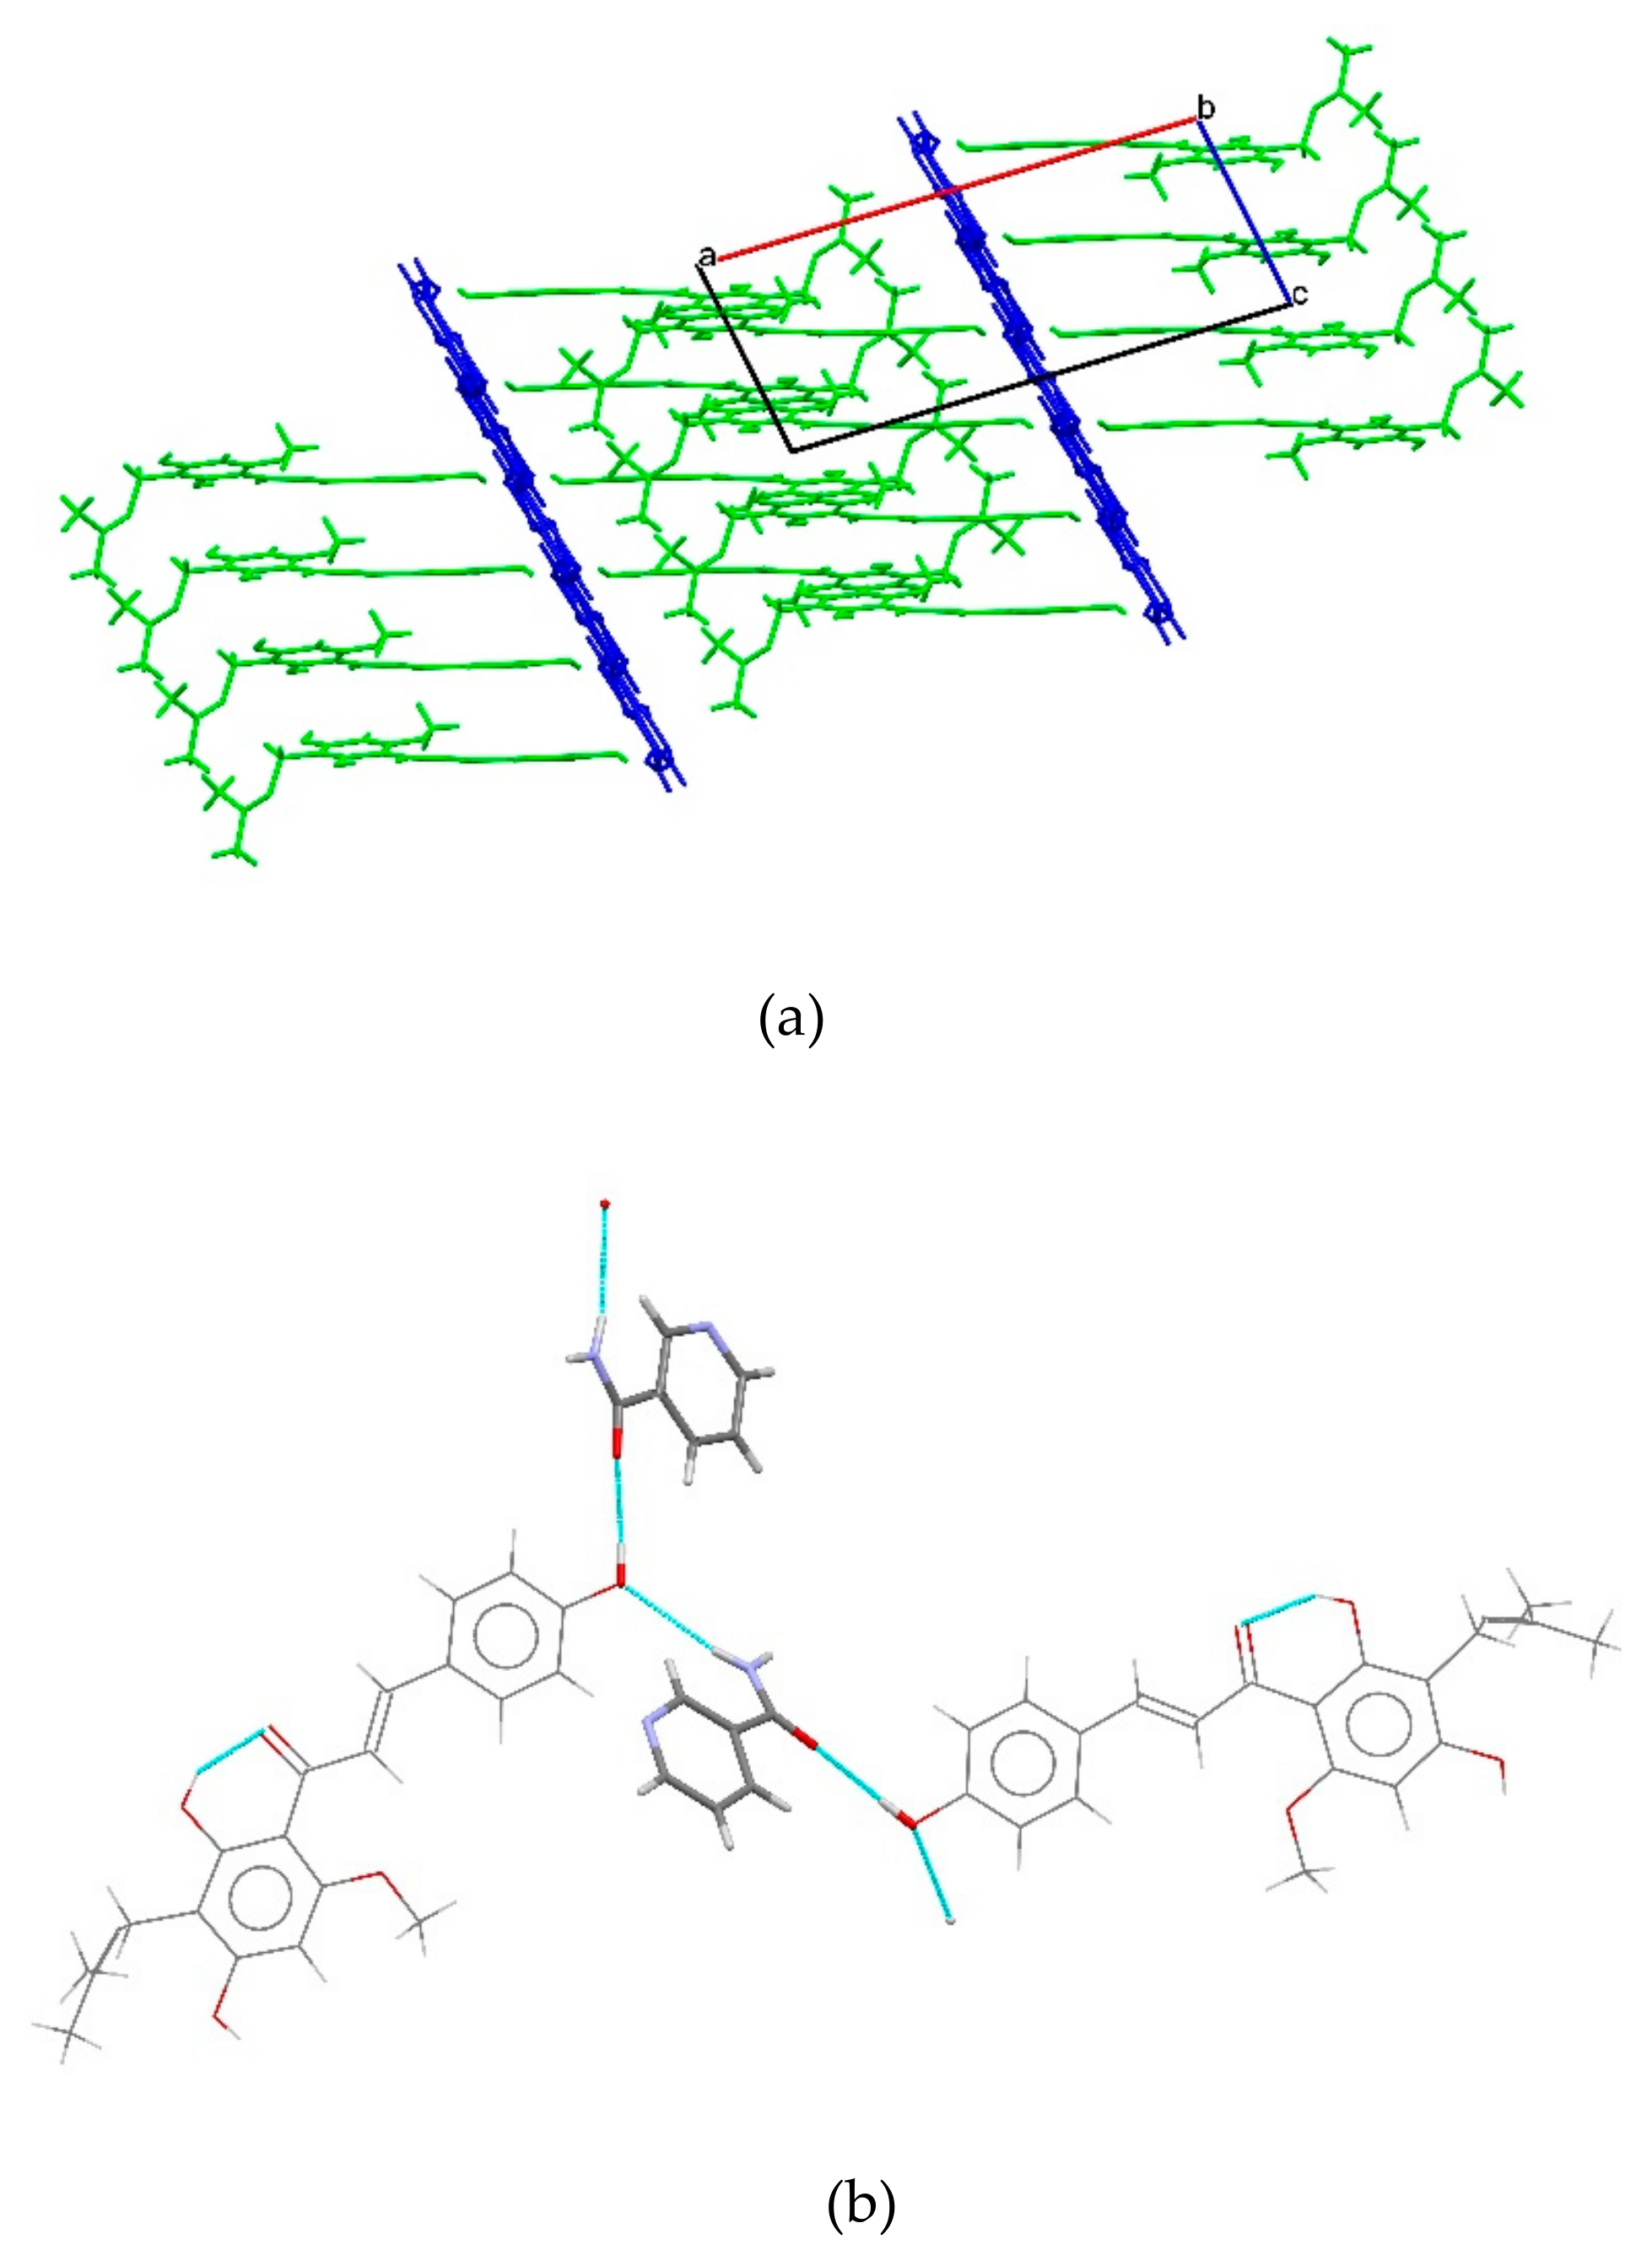
2.1.1. XN Molecule in Cocrystals
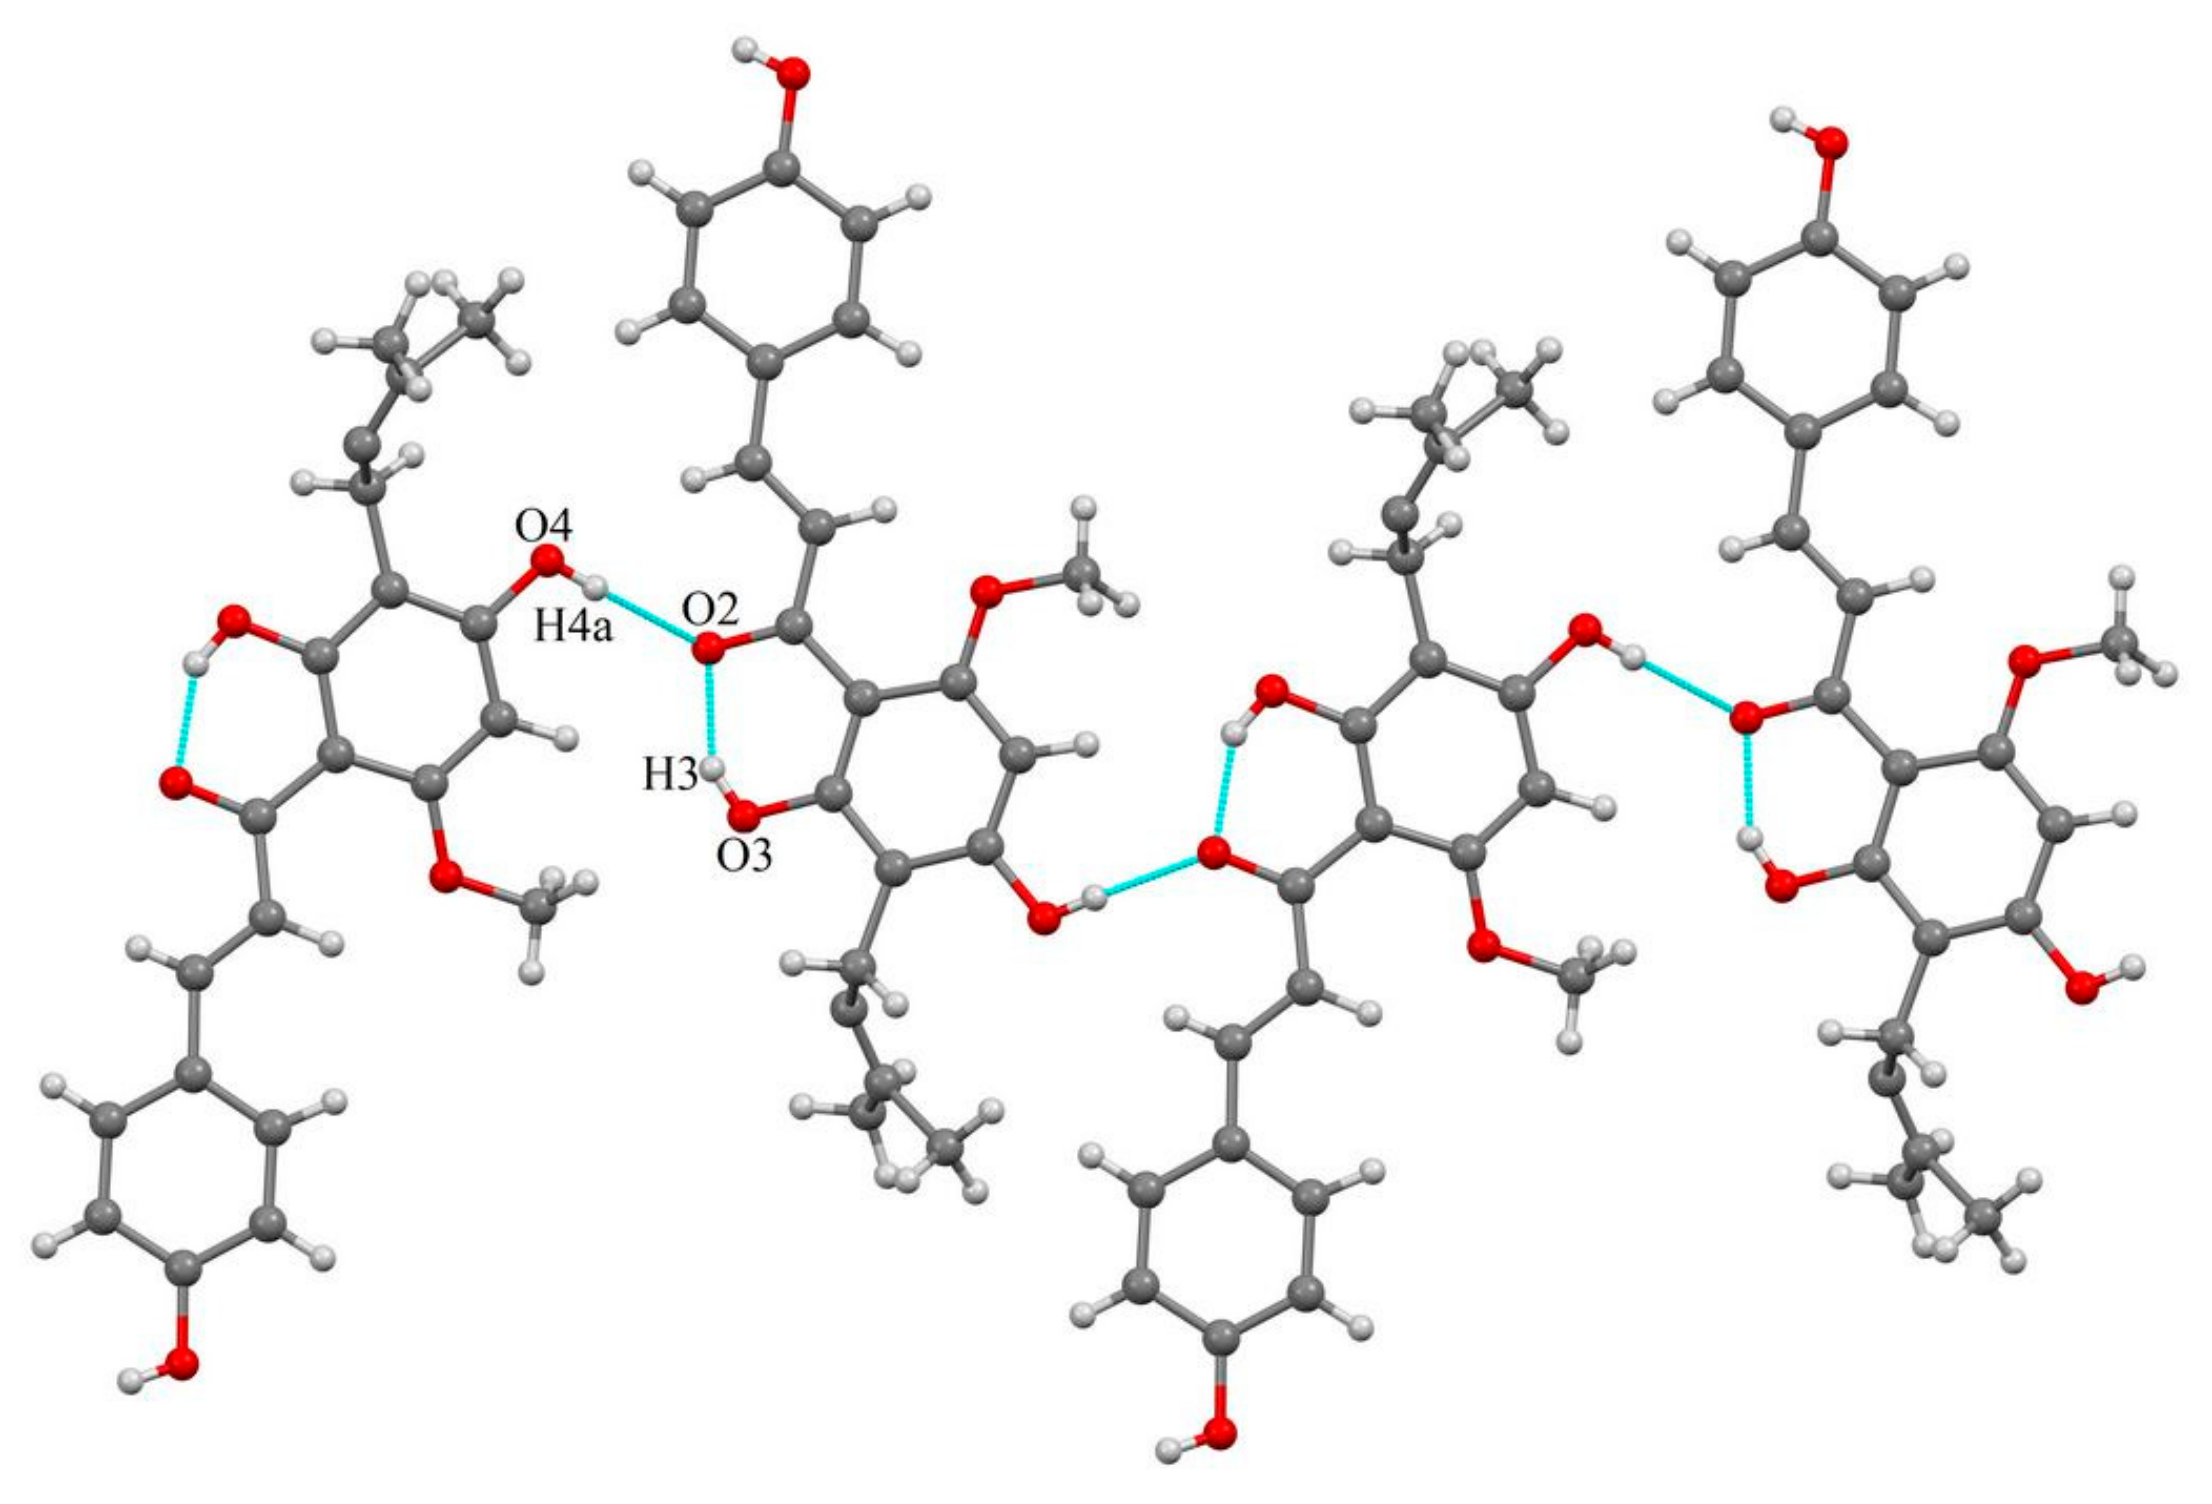
2.1.2. Host-Coformer Interactions
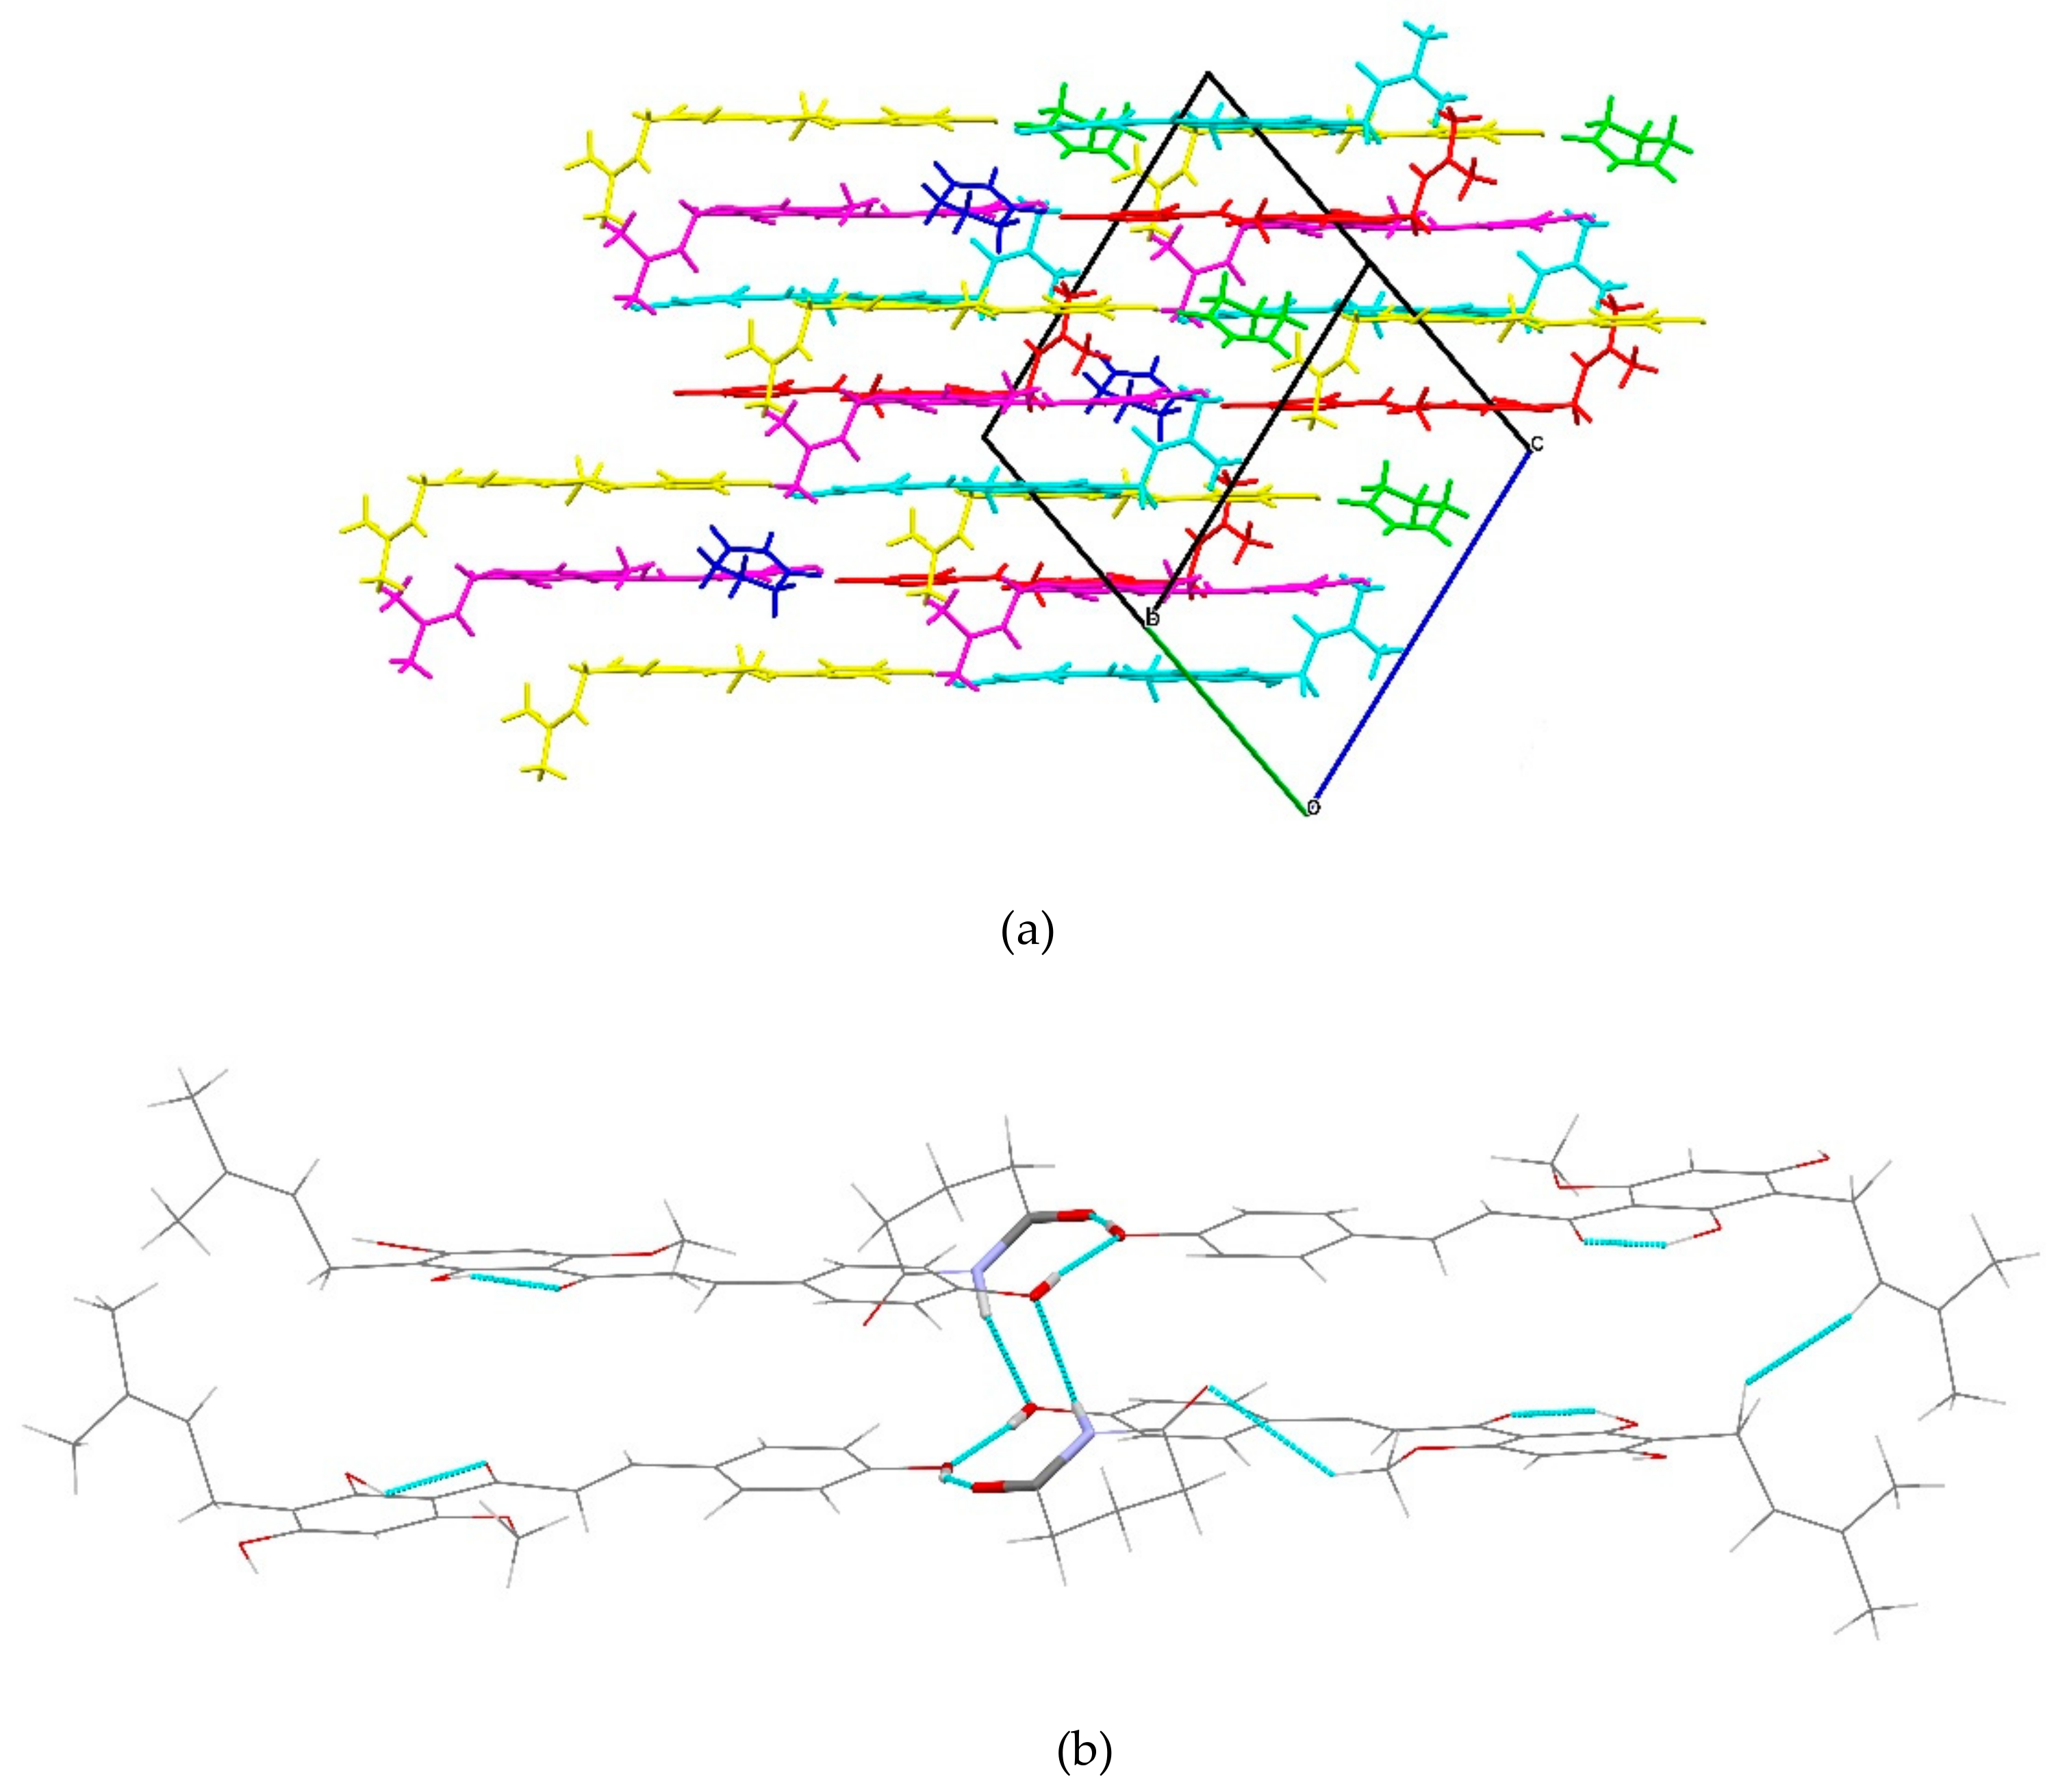
2.1.3. XN−NIC (1:1)
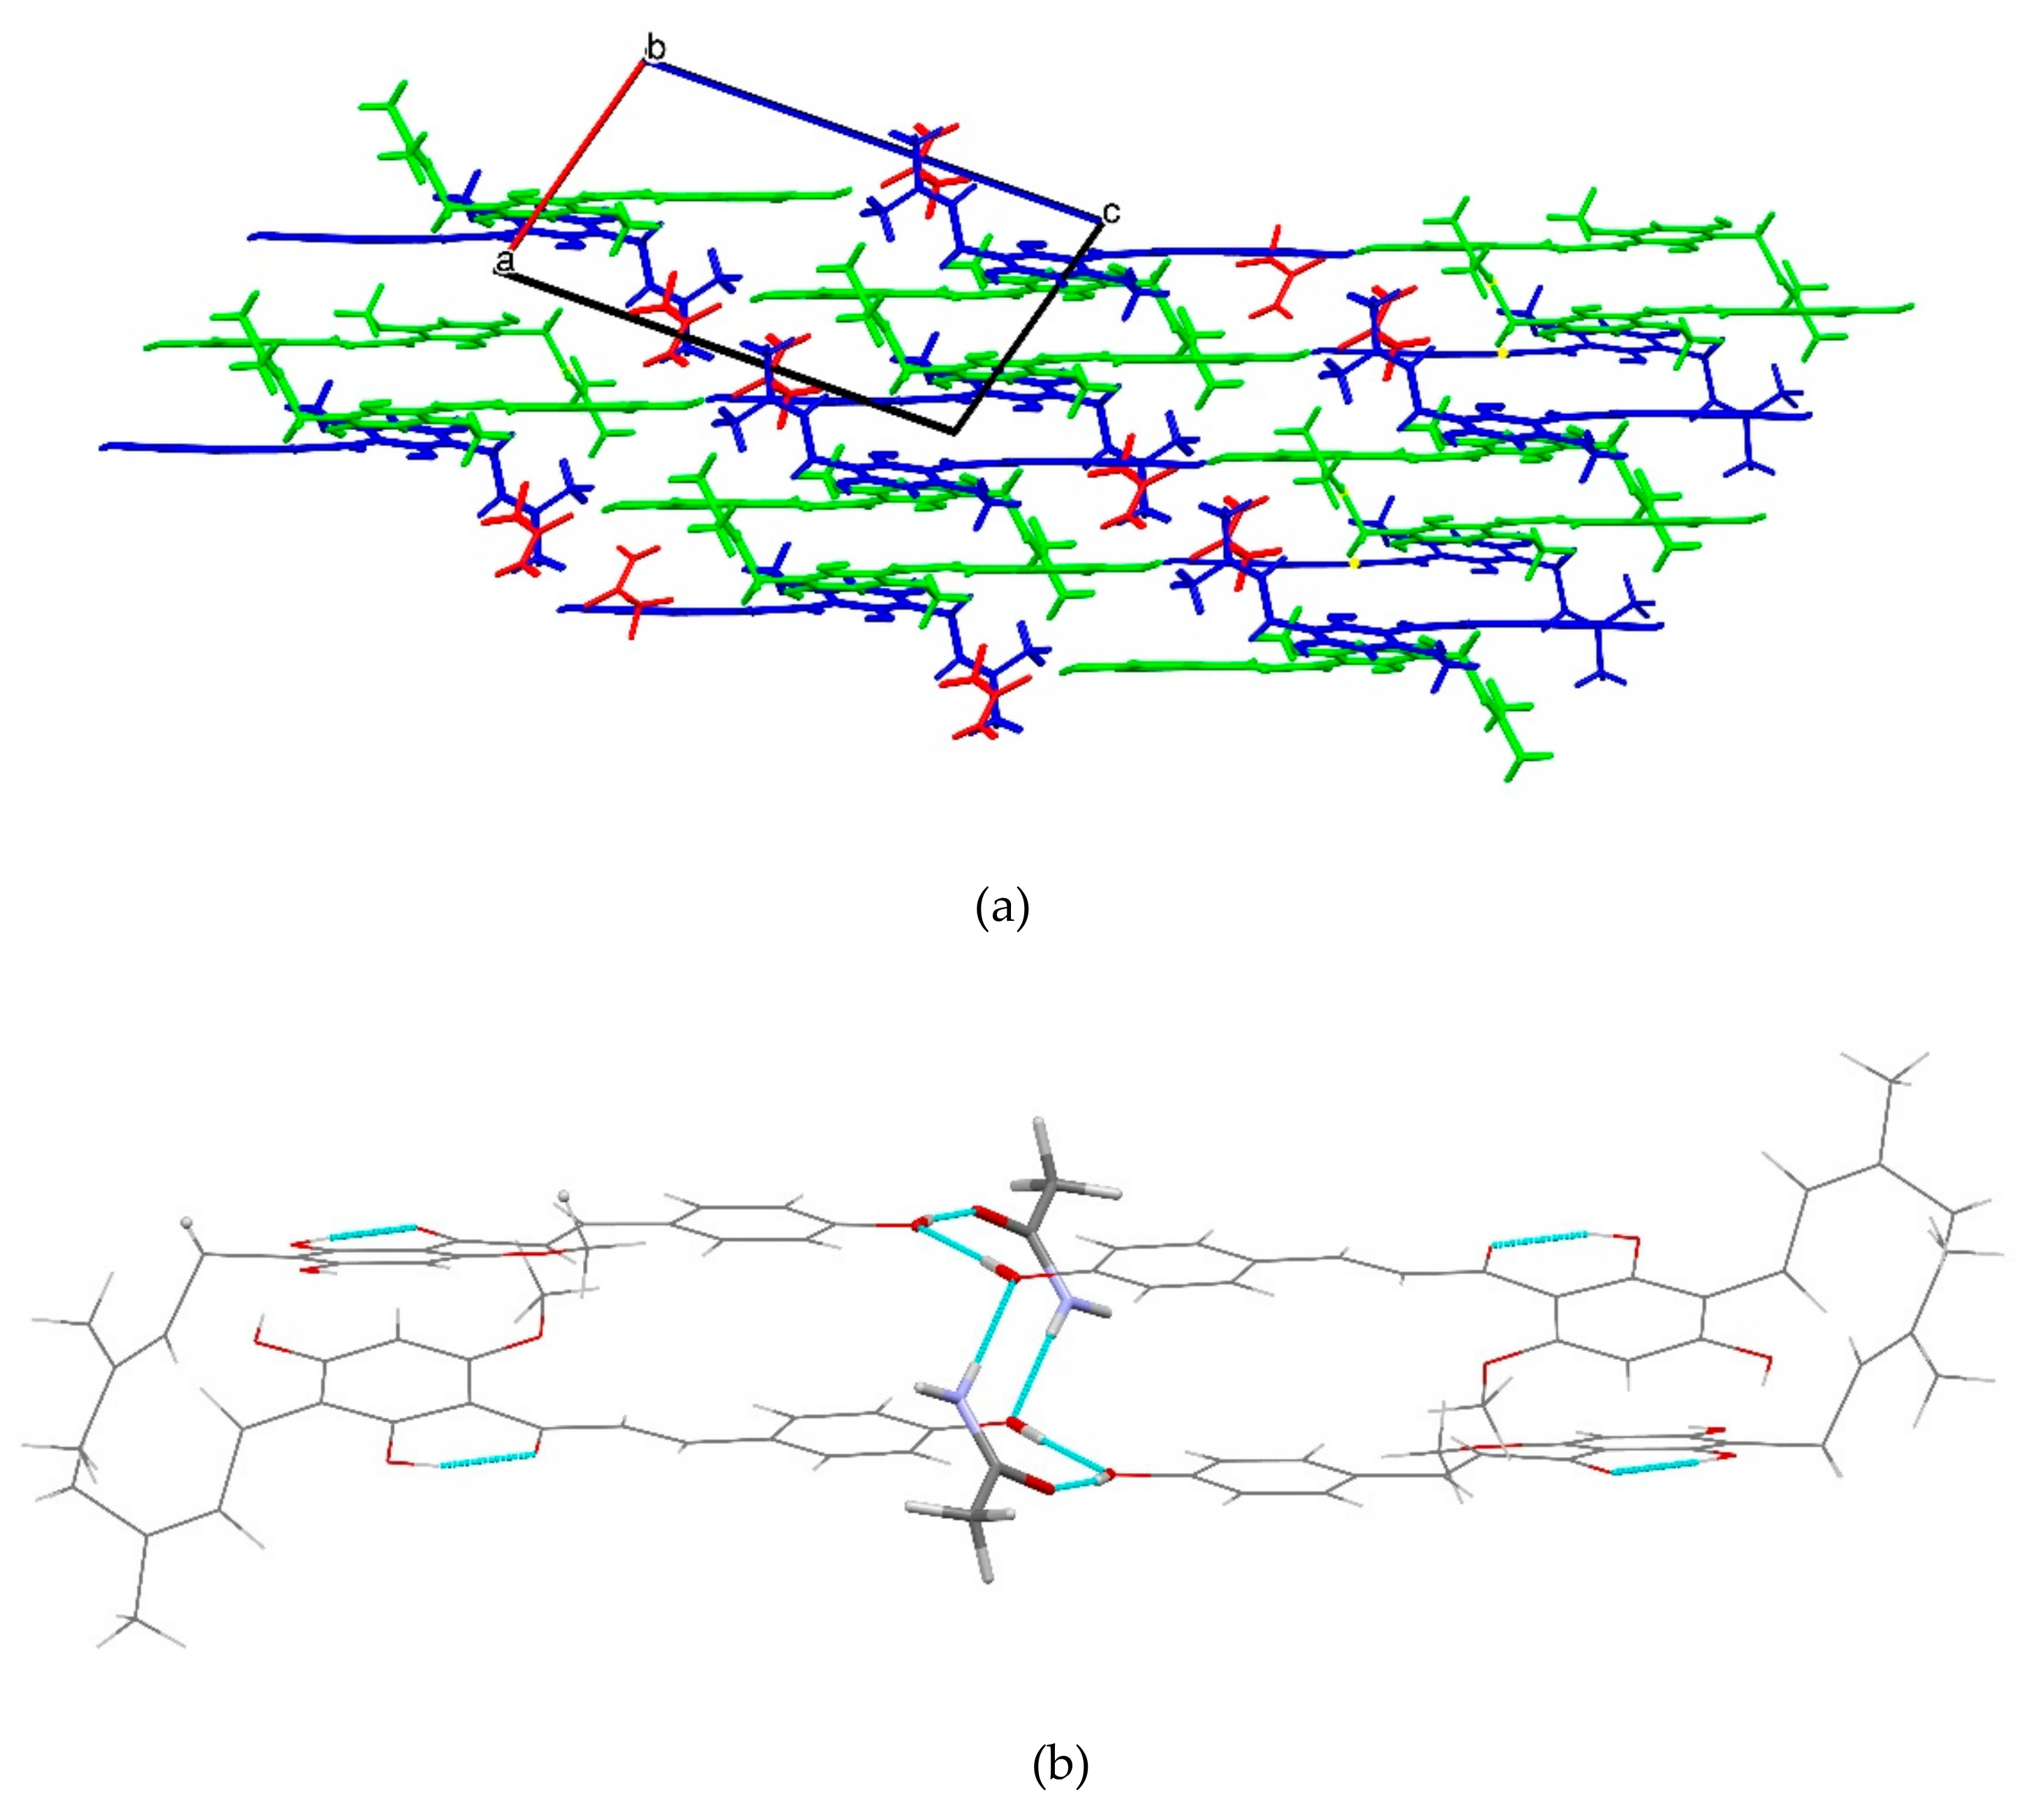
2.1.4. XN−GA (1:1)
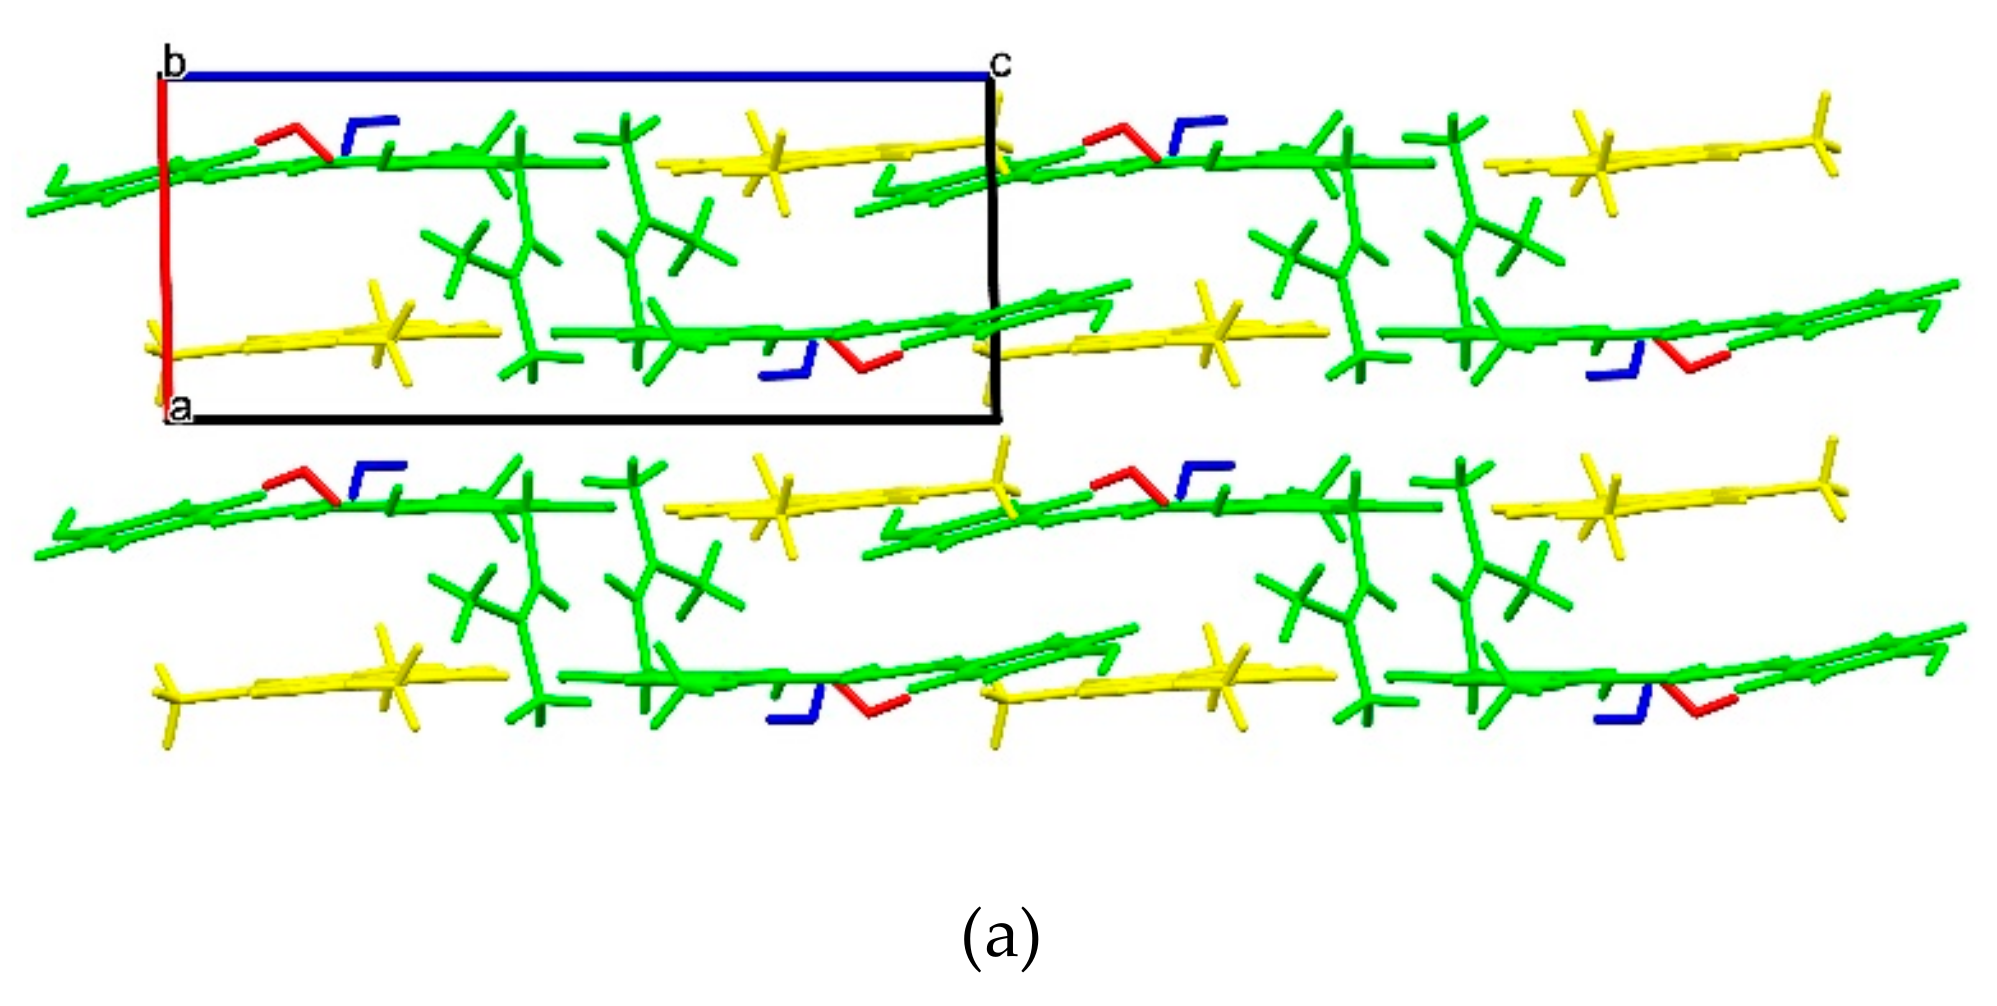
2.1.5. XN−AC (1:1)
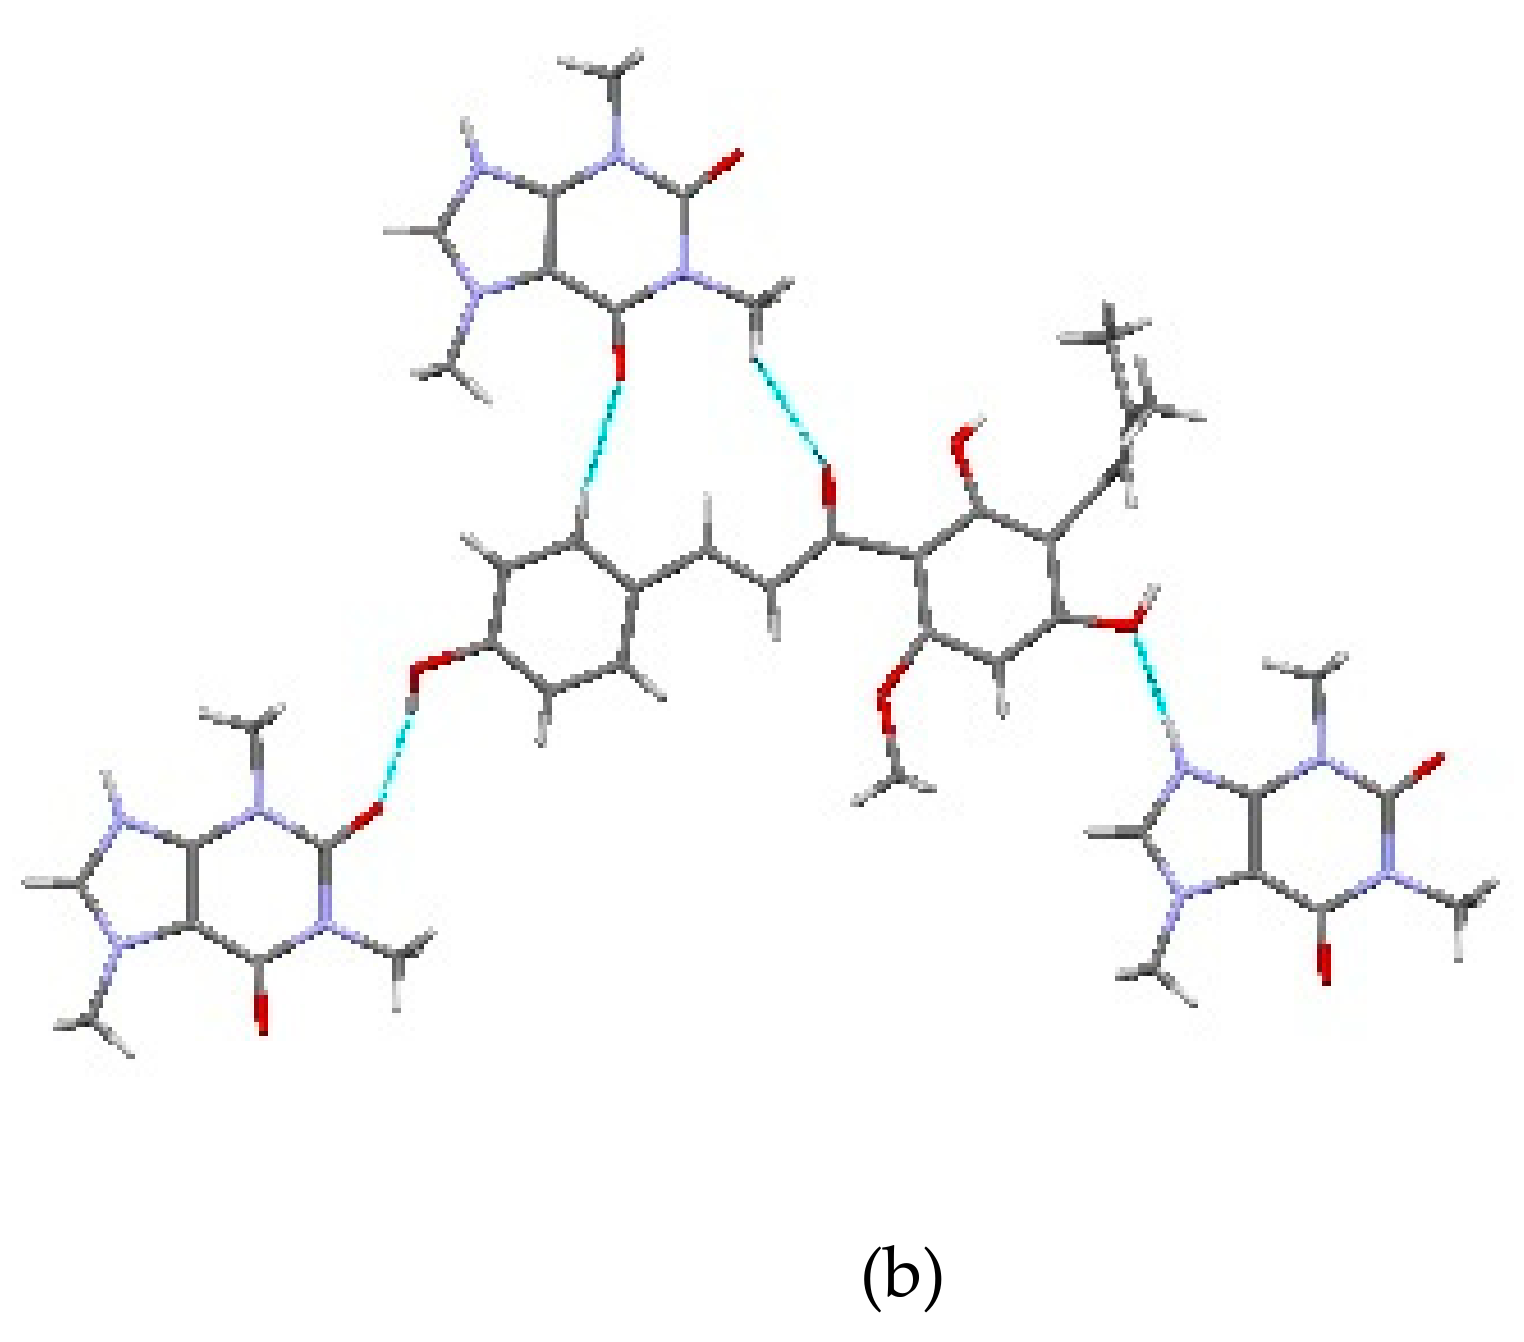
2.1.6. XN−CF (1:1)
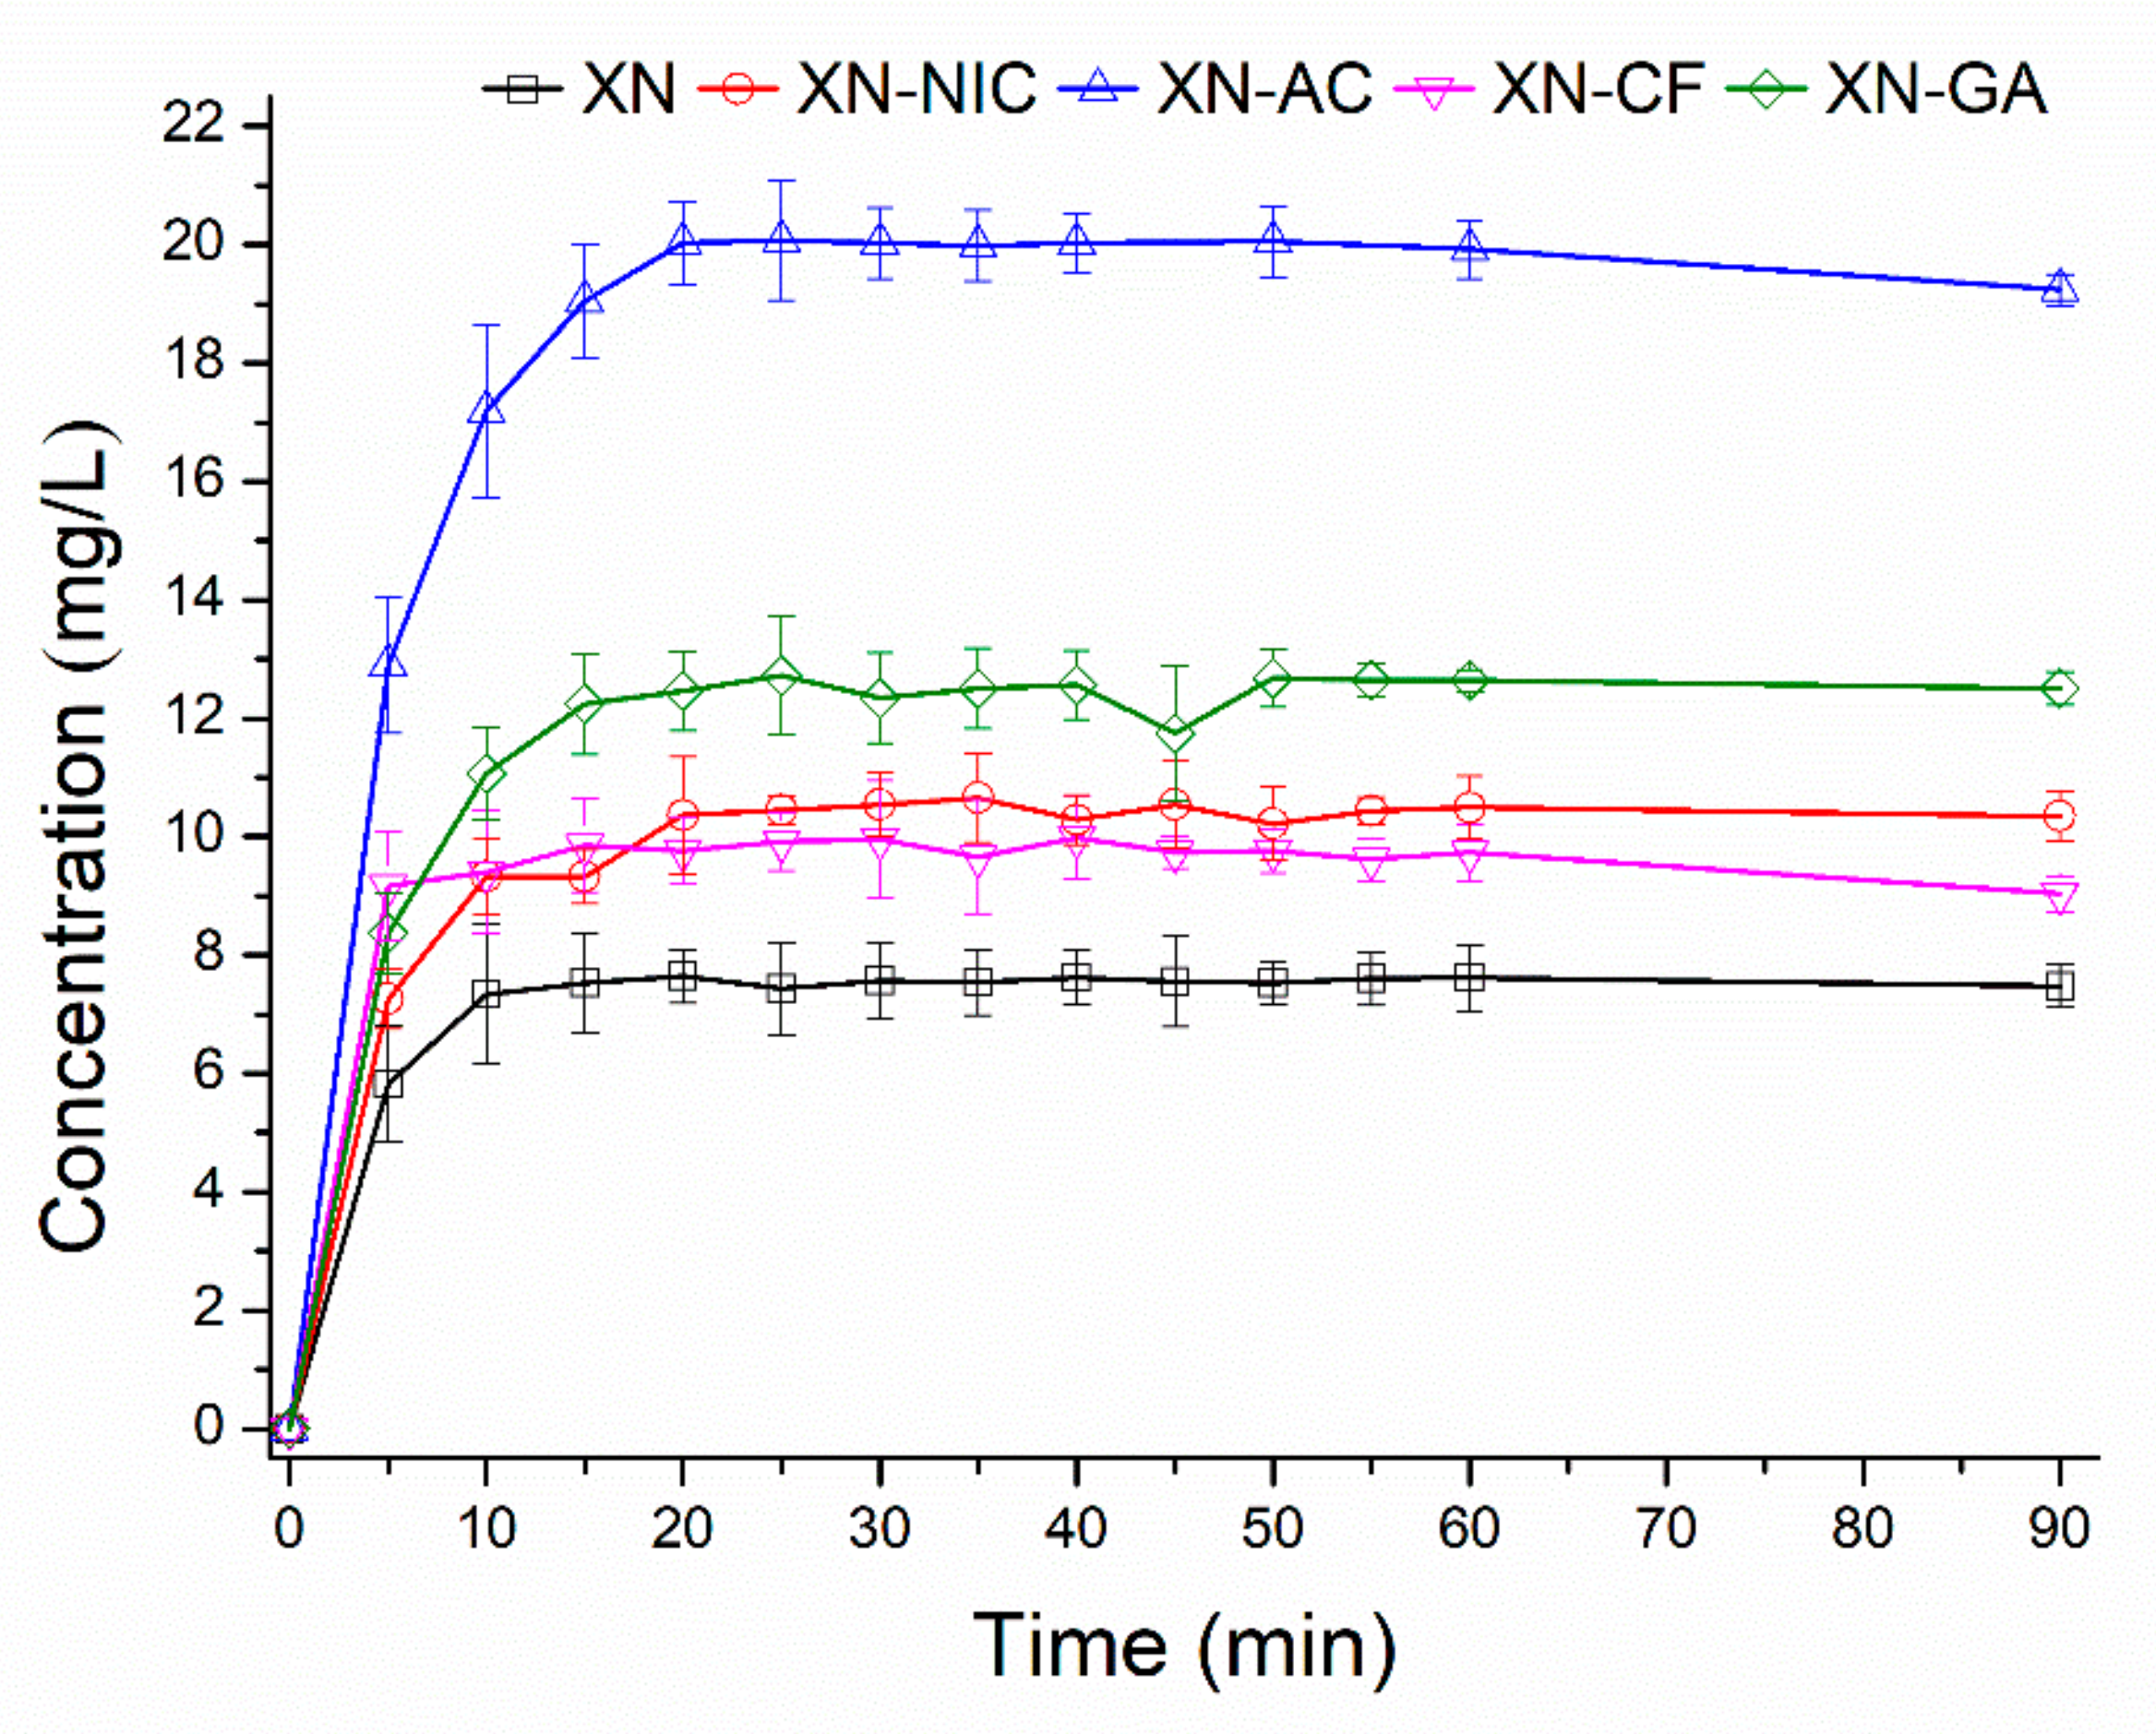
2.2. Solubility Determination
2.3. Vibrational Spectroscopy
2.4. Multivariate Analysis
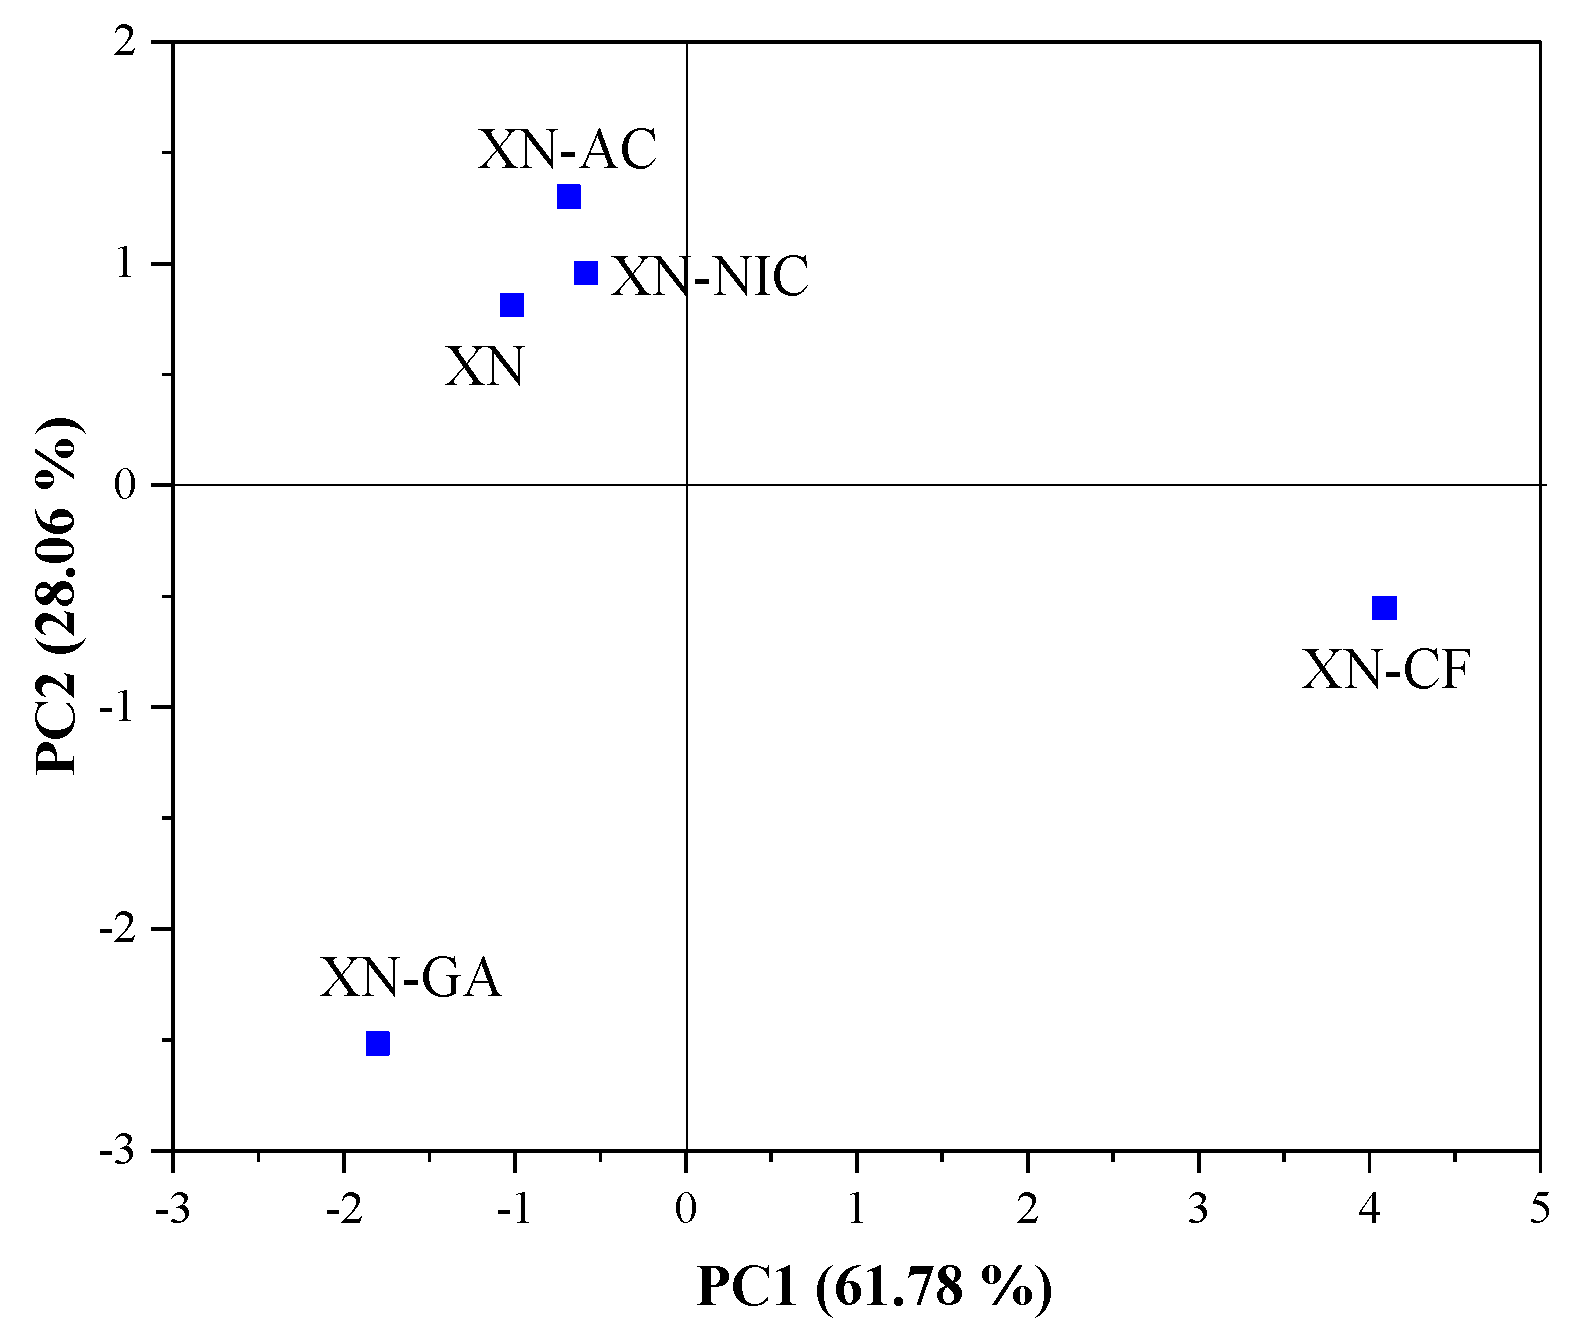
2.4.1. Principal Component Analysis (PCA)
Raman Spectroscopy
FTIR Spectroscopy
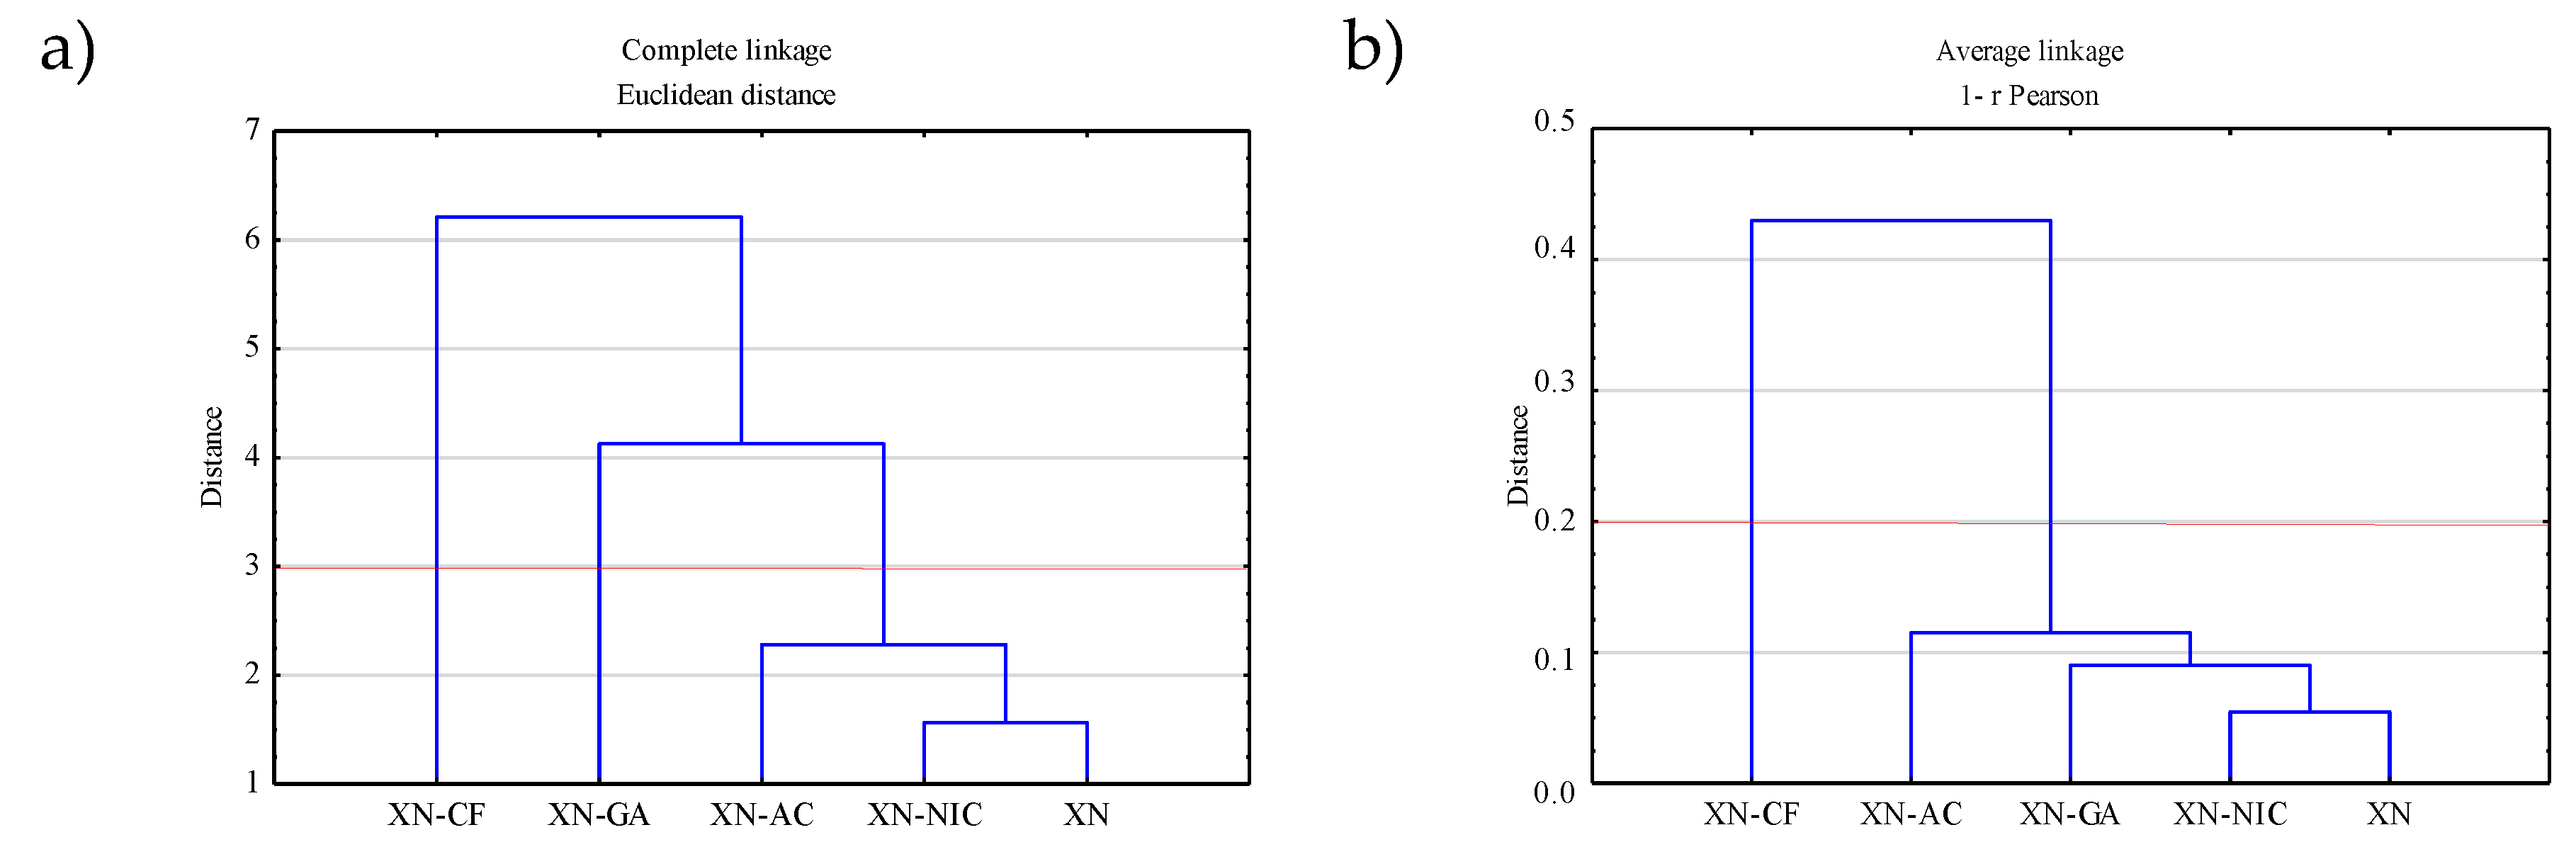
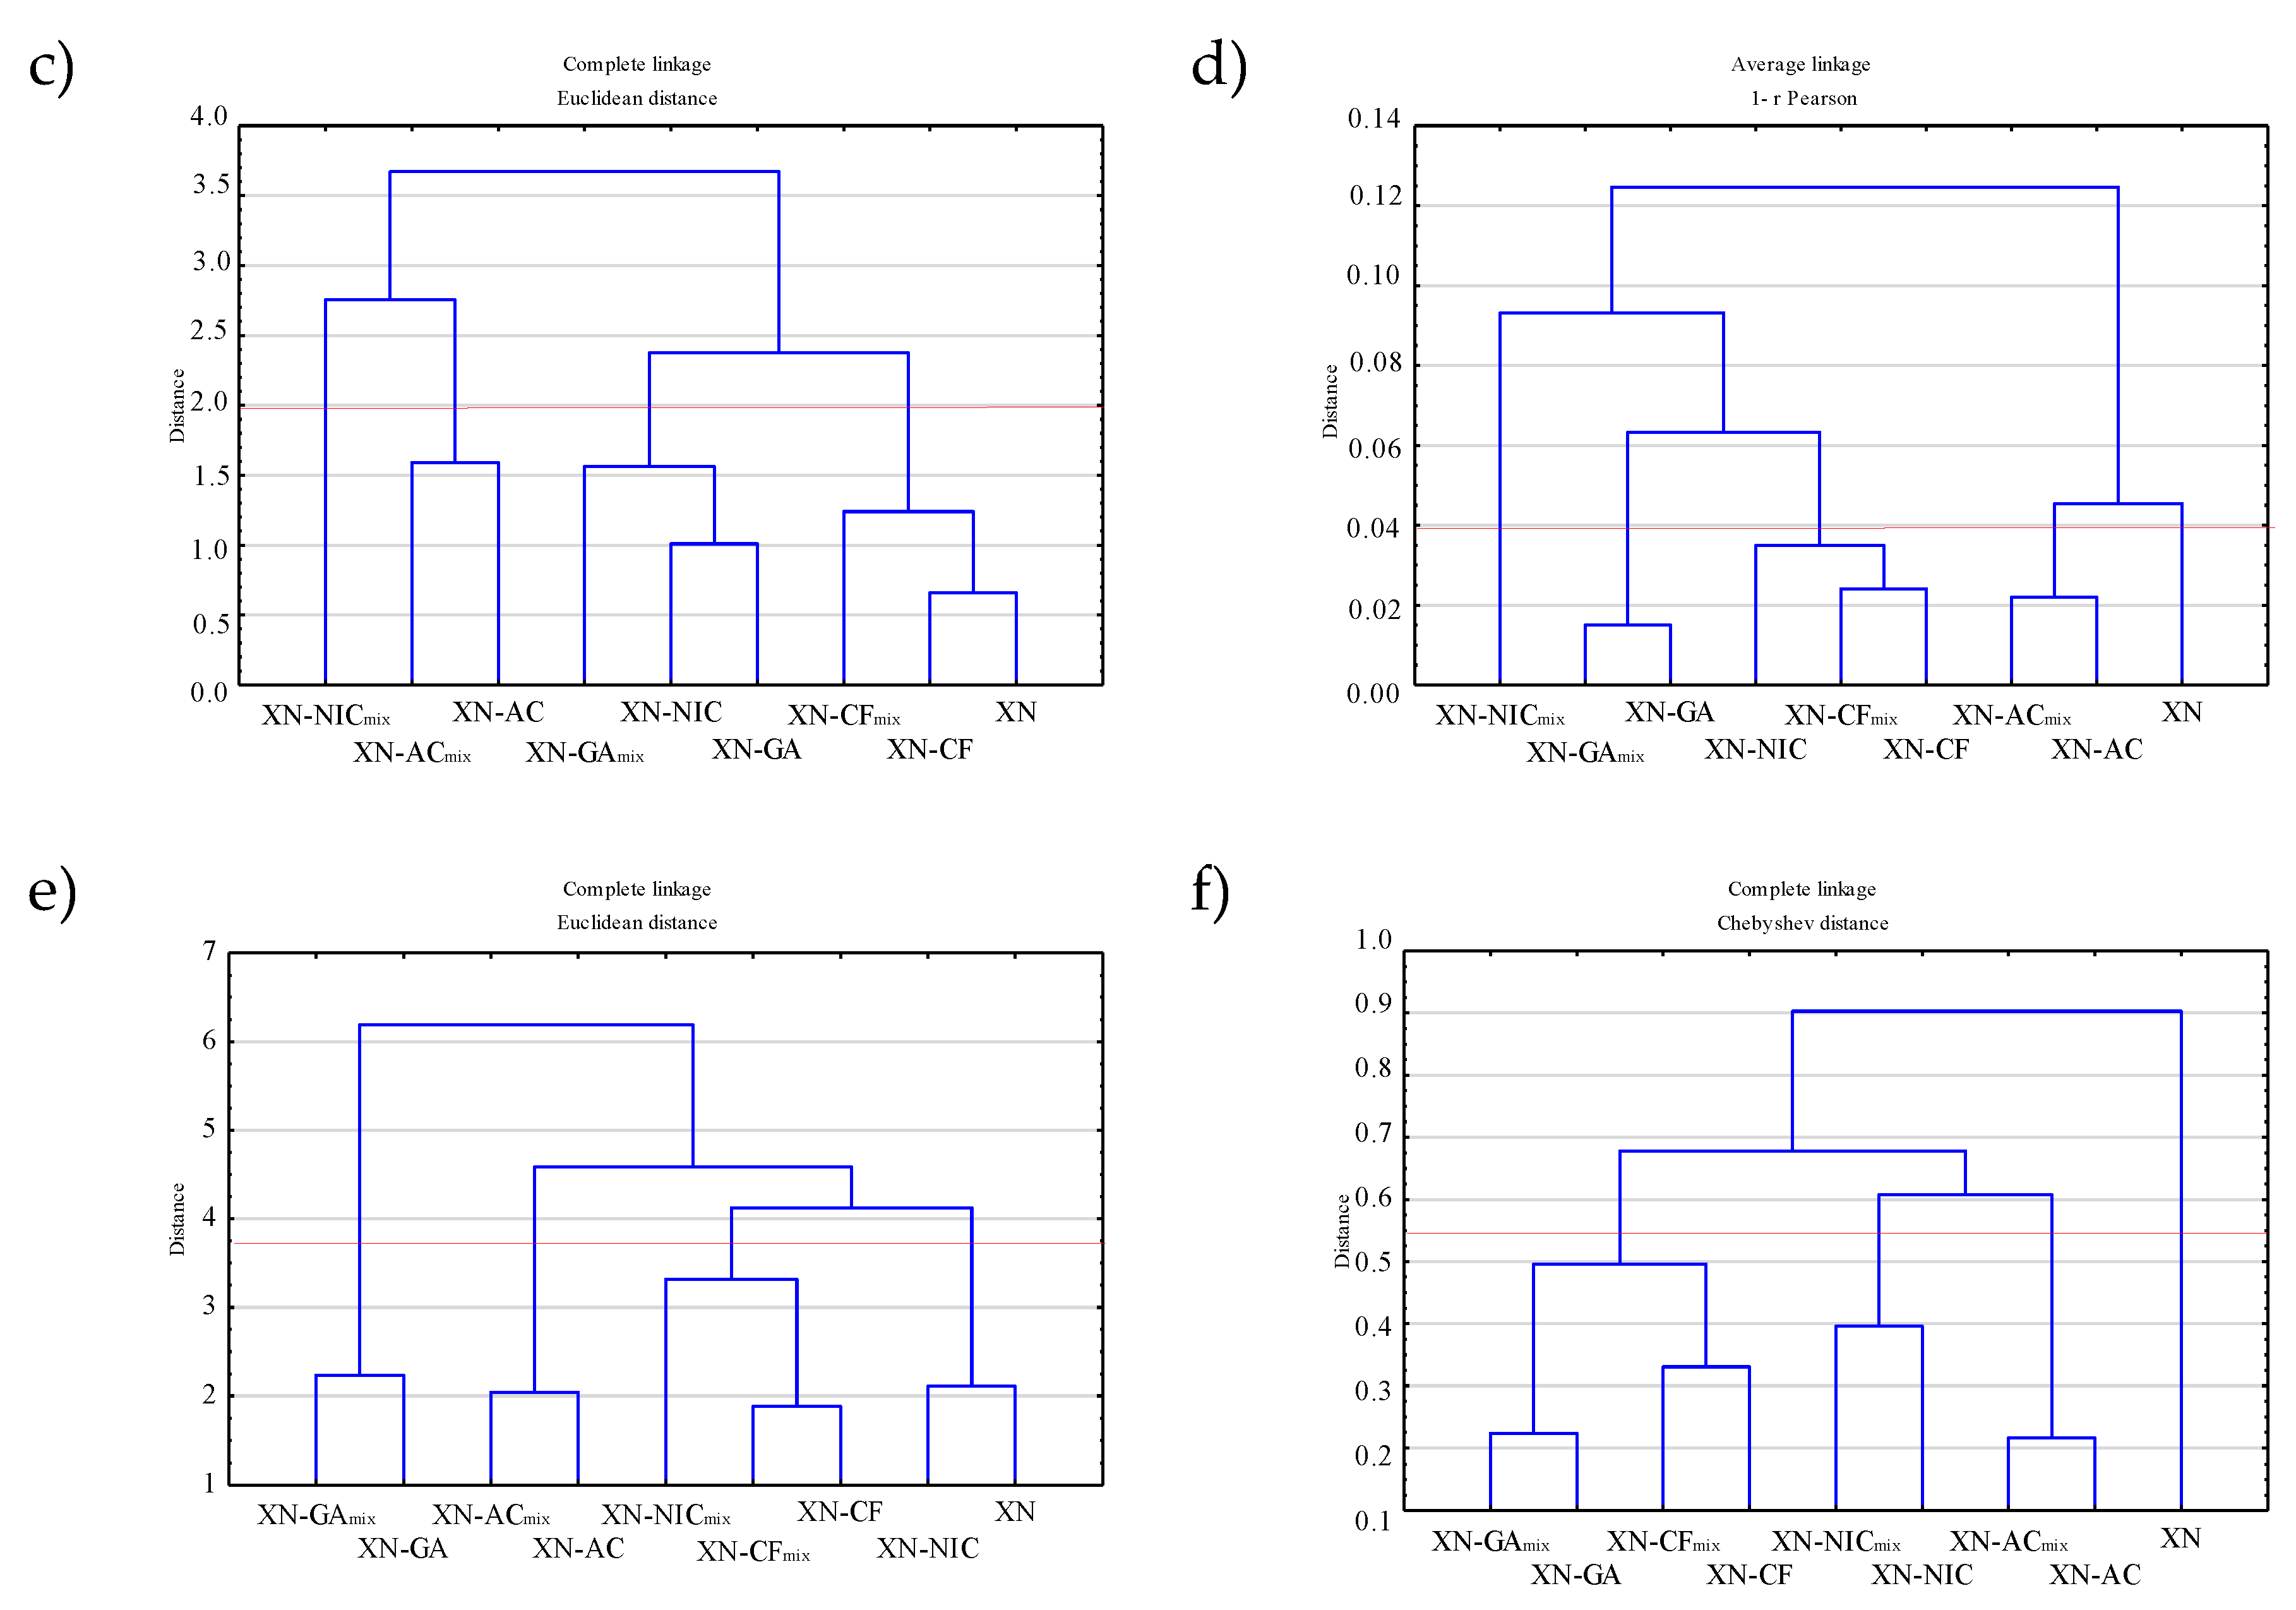
2.4.2. Hierarchical Clustering Analysis (HCA)
3. Materials and Method
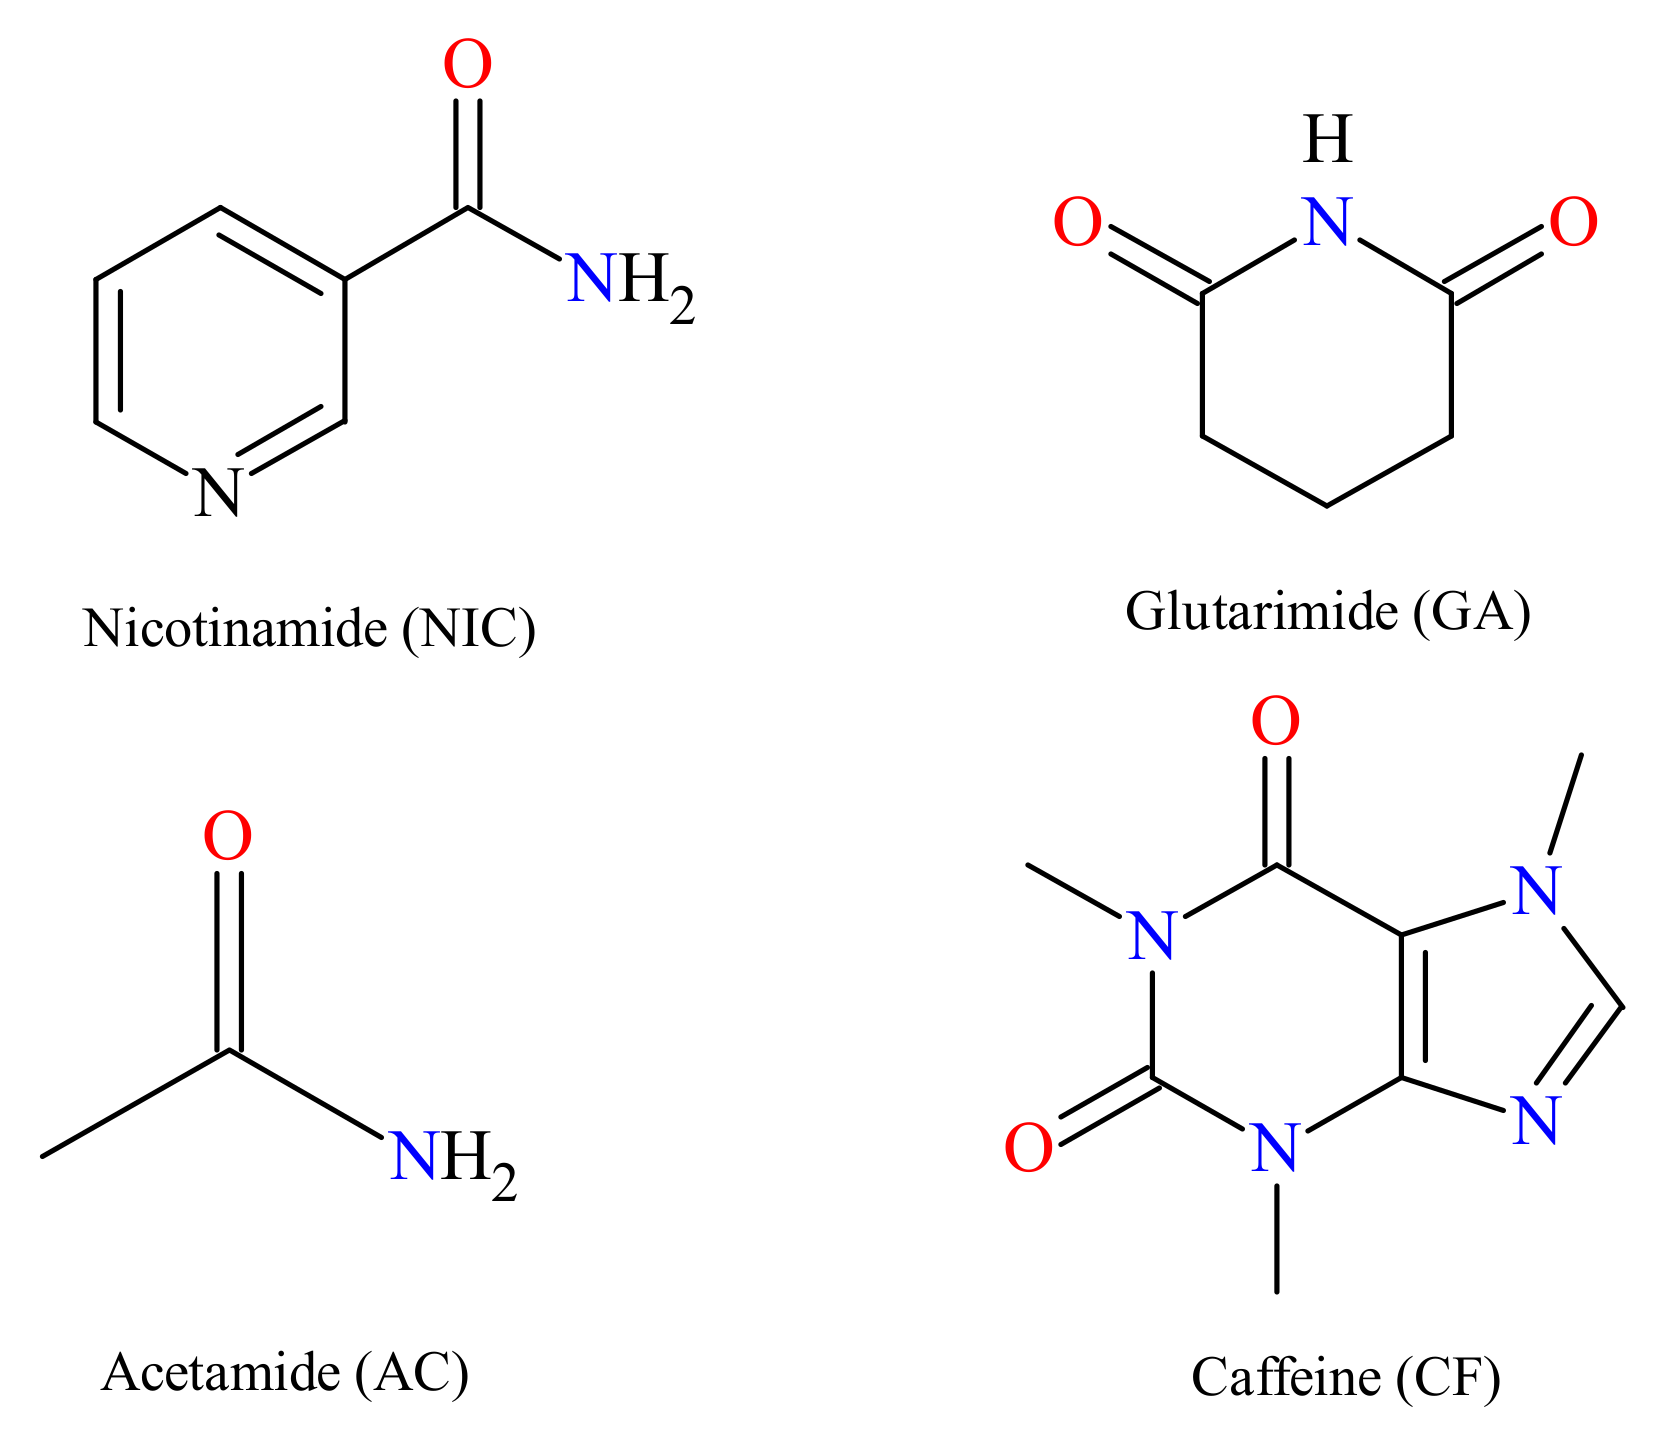
3.1. Materials
3.2. Methods
3.2.1. Single Crystal X-ray Diffraction
3.2.2. X-ray Powder Diffraction (PXRD)
3.2.3. Hirshfeld Surface Analysis
3.2.4. Solubility Experiment
3.2.5. FTIR Spectroscopy
3.2.6. Raman Spectroscopy
3.2.7. Multivariate Analysis Principal Component Analysis (PCA)
Principal Component Analysis (PCA)
Hierarchical Clustering Analysis (HCA)
4. Conclusions
Supplementary Materials
Author Contributions
Acknowledgments
Conflicts of Interest
References
- Liu, M.; Hansen, P.E.; Wang, G.Z.; Qiu, L.; Dong, J.J.; Yin, H.; Qian, Z.H.; Yang, M.; Miao, J.L. Pharmacological Profile of Xanthohumol, a Prenylated Flavonoid from Hops (Humulus lupulus). Molecules 2015, 20, 754–779. [Google Scholar] [CrossRef] [PubMed]
- Stevens, J.F.; Taylor, A.W.; Clawson, J.E.; Deinzer, M.L. Fate of xanthohumol and related prenylflavonoids from hops to beer. J. Agric. Food Chem. 1999, 47, 2421–2428. [Google Scholar] [CrossRef] [PubMed]
- Vandewalle, M. On the synthesis of xanthohumol and isoxanthohumol. Bull. Soc. Chim. Belg. 1961, 70, 163–167. [Google Scholar] [CrossRef]
- Verzele, M.; Stockx, J.; Fontijn, F.; Anteunis, A. Xanthohumol, a New Natural Chalkone. Bull. Soc. Chim. Belg. 1957, 66, 452–475. [Google Scholar] [CrossRef]
- Jiang, C.H.; Sun, T.L.; Xiang, D.X.; Wei, S.S.; Li, W.Q. Anticancer Activity and Mechanism of Xanthohumol: A Prenylated Flavonoid from Hops (Humulus lupulus L.). Front. Pharmacol. 2018, 9, 530. [Google Scholar] [CrossRef]
- Magalhaes, P.J.; Carvalho, D.O.; Cruz, J.M.; Guido, L.F.; Barros, A.A. Fundamentals and Health Benefits of Xanthohumol, a Natural Product Derived from Hops and Beer. Nat. Prod. Commun. 2009, 4, 591–610. [Google Scholar] [CrossRef]
- Wei, S.S.; Sun, T.L.; Du, J.; Zhang, B.K.; Xiang, D.X.; Li, W.Q. Xanthohumol, a prenylated flavonoid from Hops, exerts anticancer effects against gastric cancer in vitro. Oncol. Rep. 2018, 40, 3213–3222. [Google Scholar] [CrossRef]
- Stevens, J.F.; Page, J.E. Xanthohumol and related prenylflavonoids from hops and beer: To your good health! Phytochemistry 2004, 65, 1317–1330. [Google Scholar] [CrossRef]
- Monteiro, R.; Calhau, C.; Silva, A.O.E.; Pinheiro-Silva, S.; Cuerreiro, S.; Gartner, F.; Azevedo, I.; Soares, R. Xanthohumol inhibits inflammatory factor production and angiogenesis in breast cancer xenografts. J. Cell. Biochem. 2008, 104, 1699–1707. [Google Scholar] [CrossRef]
- Lee, I.S.; Lim, J.; Gal, J.; Kang, J.C.; Kim, H.J.; Kang, B.Y.; Choi, H.J. Anti-inflammatory activity of xanthohumol involves heme oxygenase-1 induction via NRF2-ARE signaling in microglial BV2 cells. Neurochem. Int. 2011, 58, 153–160. [Google Scholar] [CrossRef]
- Albini, A.; Dell’Eva, R.; Vene, R.; Ferrari, N.; Buhler, D.R.; Noonan, D.M.; Fassina, G. Mechanisms of the antiangiogenic activity by the hop flavonoid xanthohumol: NF-kappa B and Akt as targets. FASEB J. 2005, 19, 527–529. [Google Scholar] [CrossRef] [PubMed]
- Nuti, E.; Bassani, B.; Camodeca, C.; Rosalia, L.; Cantelmo, A.; Gallo, C.; Baci, D.; Bruno, A.; Orlandini, E.; Nencetti, S.; et al. Synthesis and antiangiogenic activity study of new hop chalcone Xanthohumol analogues. Eur. J. Med. Chem. 2017, 138, 890–899. [Google Scholar] [CrossRef] [PubMed]
- Li, J.; Zeng, L.; Xie, J.; Yue, Z.Y.; Deng, H.Y.; Ma, X.Y.; Zheng, C.B.; Wu, X.S.; Luo, J.; Liu, M.Y. Inhibition of Osteoclastogenesis and Bone Resorption in vitro and in vivo by a prenylflavonoid xanthohumol from hops. Sci. Rep. 2015. [Google Scholar] [CrossRef] [PubMed]
- Chadwick, L.R.; Nikolic, D.; Burdette, J.E.; Overk, C.R.; Bolton, J.L.; van Breemen, R.B.; Frohlich, R.; Fong, H.H.; Farnsworth, N.R.; Pauli, G.F. Estrogens and congeners from spent hops (Humulus lupulus). J. Nat. Prod. 2004, 67, 2024–2032. [Google Scholar] [CrossRef] [PubMed]
- Arczewska, M.; Kamiński, D.M.; Gieroba, B.; Gagoś, M. Acid-Base Properties of Xanthohumol: A Computational and Experimental Investigation. J. Nat. Prod. 2017, 80, 3194–3202. [Google Scholar] [CrossRef] [PubMed]
- Kobus-Cisowska, J.; Szymanowska-Powalowska, D.; Szczepaniak, O.; Kmiecik, D.; Przeor, M.; Gramza-Michalowska, A.; Cielecka-Piontek, J.; Smuga-Kogut, M.; Szulc, P. Composition and In Vitro Effects of Cultivars of Humulus lupulus L. Hops on Cholinesterase Activity and Microbial Growth. Nutrients 2019, 11, 1377. [Google Scholar] [CrossRef] [PubMed]
- Zhang, B.; Chu, W.; Wei, P.; Liu, Y.; Wei, T. Xanthohumol induces generation of reactive oxygen species and triggers apoptosis through inhibition of mitochondrial electron transfer chain complex I. Free Radic. Biol. Med. 2015, 89, 486–497. [Google Scholar] [CrossRef]
- Pang, Y.; Nikolic, D.; Zhu, D.; Chadwick, L.R.; Pauli, G.F.; Farnsworth, N.R.; van Breemen, R.B. Binding of the hop (Humulus lupulus L.) chalcone xanthohumol to cytosolic proteins in Caco-2 intestinal epithelial cells. Mol. Nutr. Food Res. 2007, 51, 872–879. [Google Scholar] [CrossRef]
- Van Breemen, R.B.; Yuan, Y.; Banuvar, S.; Shulman, L.P.; Qiu, X.; Alvarenga, R.F.; Chen, S.N.; Dietz, B.M.; Bolton, J.L.; Pauli, G.F.; et al. Pharmacokinetics of prenylated hop phenols in women following oral administration of a standardized extract of hops. Mol. Nutr. Food Res. 2014, 58, 1962–1969. [Google Scholar] [CrossRef]
- Amidon, G.L.; Lennernas, H.; Shah, V.P.; Crison, J.R. A theoretical basis for a biopharmaceutic drug classification: The correlation of in vitro drug product dissolution and in vivo bioavailability. Pharm. Res. 1995, 12, 413–420. [Google Scholar] [CrossRef]
- Bolla, G.; Nangia, A. Pharmaceutical cocrystals: Walking the talk. Chem. Commun. 2016, 52, 8342–8360. [Google Scholar] [CrossRef] [PubMed]
- Schultheiss, N.; Newman, A. Pharmaceutical Cocrystals and Their Physicochemical Properties. Cryst. Growth Des. 2009, 9, 2950–2967. [Google Scholar] [CrossRef] [PubMed]
- Chadha, R.; Saini, A.; Arora, P.; Bhandari, S. Pharmaceutical cocrystals: A novel approach for oral bioavailability enhancement of drugs. Crit. Rev. Ther. Drug Carr. Syst. 2012, 29, 183–218. [Google Scholar] [CrossRef] [PubMed]
- Karimi-Jafari, M.; Padrela, L.; Walker, G.M.; Croker, D.M. Creating Cocrystals: A Review of Pharmaceutical Cocrystal Preparation Routes and Applications. Cryst. Growth Des. 2018, 18, 6370–6387. [Google Scholar] [CrossRef]
- Sinha, A.S.; Maguire, A.R.; Lawrence, S.E. Cocrystallization of Nutraceuticals. Cryst. Growth Des. 2015, 15, 984–1009. [Google Scholar] [CrossRef]
- Malamatari, M.; Ross, S.A.; Douroumis, D.; Velaga, S.P. Experimental cocrystal screening and solution based scale-up cocrystallization methods. Adv. Drug Deliv. Rev. 2017, 117, 162–177. [Google Scholar] [CrossRef] [PubMed]
- Gajda, M.; Nartowski, K.P.; Pluta, J.; Karolewicz, B. Continuous, one-step synthesis of pharmaceutical cocrystals via hot melt extrusion from neat to matrix-assisted processing—State of the art. Int. J. Pharm. 2019, 558, 426–440. [Google Scholar] [CrossRef]
- Xu, J.; Huang, Y.T.; Ruan, S.D.; Chi, Z.L.; Qin, K.M.; Cai, B.C.; Cai, T. Cocrystals of isoliquiritigenin with enhanced pharmacokinetic performance. CrystEngComm 2016, 18, 8776–8786. [Google Scholar] [CrossRef]
- Zhu, B.Q.; Zhang, Q.; Wang, J.R.; Mei, X.F. Cocrystals of Baicalein with Higher Solubility and Enhanced Bioavailability. Cryst. Growth Des. 2017, 17, 1893–1901. [Google Scholar] [CrossRef]
- Ketkar, S.; Pagire, S.K.; Goud, N.R.; Mahadik, K.; Nangia, A.; Paradkar, A. Tracing the Architecture of Caffeic Acid Phenethyl Ester Cocrystals: Studies on Crystal Structure, Solubility, and Bioavailability Implications. Cryst. Growth Des. 2016, 16, 5710–5716. [Google Scholar] [CrossRef]
- Lou, B.Y.; Hu, S.L. Different Hydrogen-Bonded Interactions in the Cocrystals of Nicotinamide with Two Aromatic Acids. J. Chem. Crystallogr. 2011, 41, 1663–1668. [Google Scholar] [CrossRef]
- Smith, A.J.; Kavuru, P.; Wojtas, L.; Zaworotko, M.J.; Shytle, R.D. Cocrystals of Quercetin with Improved Solubility and Oral Bioavailability. Mol. Pharm. 2011, 8, 1867–1876. [Google Scholar] [CrossRef] [PubMed]
- Karagianni, A.; Malamatari, M.; Kachrimanis, K. Pharmaceutical Cocrystals: New Solid Phase Modification Approaches for the Formulation of APIs. Pharmaceutics 2018, 10, 18. [Google Scholar] [CrossRef] [PubMed] [Green Version]
- Power, F.B.; Tutin, F.; Rogerson, H. The constituents of hops. J. Chem. Soc. 1913, 103, 1267–1292. [Google Scholar] [CrossRef] [Green Version]
- Weiskirchen, R.; Mahli, A.; Weiskirchen, S.; Hellerbrand, C. The hop constituent xanthohumol exhibits hepatoprotective effects and inhibits the activation of hepatic stellate cells at different levels. Front. Physiol. 2015, 6, 140. [Google Scholar] [CrossRef] [Green Version]
- Sowa, M.; Ślepokura, K.; Matczak-Jon, E. Improving solubility of fisetin by cocrystallization. CrystEngComm 2014, 16, 10592–10601. [Google Scholar] [CrossRef]
- Rajput, L.; Sanphui, P.; Desiraju, G.R. New solid forms of the Anti-HIV drug etravirine: Salts, cocrystals, and solubility. Cryst. Growth Des. 2013, 13, 3681–3690. [Google Scholar] [CrossRef]
- Guzmán, H.R.; Tawa, M.; Zhang, Z.; Ratanabanangkoon, P.; Shaw, P.; Gardner, C.R.; Chen, H.; Moreau, J.P.; Almarsson, O.; Remenar, J.F. Combined use of crystalline salt forms and precipitation inhibitors to improve oral absorption of celecoxib from solid oral formulations. J. Pharm. Sci. 2007, 96, 2686–2702. [Google Scholar] [CrossRef]
- Ramkumar, V.; Anandhi, S.; Kannan, P.; Gopalakrishnan, R. Synthesis, single crystal growth, characterization and comparison of two new enone shifted chalcones and their NLO behaviour. CrystEngComm 2013, 15, 2438–2449. [Google Scholar] [CrossRef]
- Arczewska, M.; Kamiński, D.M.; Górecka, E.; Pociecha, D.; Rój, E.; Slawińska-Brych, A.; Gagoś, M. The molecular organization of prenylated flavonoid xanthohumol in DPPC multibilayers: X-ray diffraction and FTIR spectroscopic studies. Biochim. Biophys. Acta 2013, 1828, 213–222. [Google Scholar] [CrossRef] [Green Version]
- Ramalingam, S.; Periandy, S.; Govindarajan, M.; Mohan, S. FT-IR and FT-Raman vibrational spectra and molecular structure investigation of nicotinamide: A combined experimental and theoretical study. Spectrochim. Acta A Mol. Biomol. Spectrosc. 2010, 75, 1552–1558. [Google Scholar] [CrossRef] [PubMed]
- Karunakaran, V.; Balachandran, V. Experimental and computational study on molecular structure, natural bond orbital and natural hybrid orbital analysis of non-linear optical material trans-3-(o-hydroxyphenyl-1-phenyl)-2-propen-1-one. J. Mol. Struct. 2013, 1053, 66–78. [Google Scholar] [CrossRef]
- Falk, M.; Gil, M.; Iza, N. Self-association of caffeine in aqueous solution: An FT-IR study. Can. J. Chem. 1990, 68, 1293–1299. [Google Scholar] [CrossRef] [Green Version]
- Bienko, D.C.; Michalska, D.; Roszak, S.; Wojciechowski, W.; Nowak, M.J.; Lapinski, L. Infrared matrix isolation and theoretical studies on glutarimide. J. Phys. Chem. A 1997, 101, 7834–7841. [Google Scholar] [CrossRef]
- Brittain, H.G. Vibrational Spectroscopic Studies of Cocrystals and Salts. 1. The Benzamide−Benzoic Acid System. Cryst. Growth Des. 2009, 9, 2492–2499. [Google Scholar] [CrossRef]
- Sajan, D.; Binoy, J.; Joe, I.H.; Jayakumar, V.S.; Zaleski, J. Vibrational spectral studies of methyl 3-(4-methoxyphenyl) prop-2-enoate, a new organic non-linearoptic crystal. J. Raman Spectrosc. 2005, 36, 221–236. [Google Scholar] [CrossRef]
- Saganowska, P.; Wesolowski, M. Principal component and cluster analyses as supporting tools for co-crystals detection. J. Therm. Anal. Calorim. 2017, 130, 45–55. [Google Scholar] [CrossRef] [Green Version]
- Caliandro, R.; Di Profio, G.; Nicolotti, O. Multivariate analysis of quaternary carbamazepine-saccharin mixtures by X-ray diffraction and infrared spectroscopy. J. Pharm. Biomed. Anal. 2013, 78–79, 269–279. [Google Scholar] [CrossRef]
- Ong, Y.H.; Lim, M.; Liu, Q. Comparison of principal component analysis and biochemical component analysis in Raman spectroscopy for the discrimination of apoptosis and necrosis in K562 leukemia cells. Opt. Express 2012, 20, 25041–25043. [Google Scholar] [CrossRef]
- Bonnier, F.; Byrne, H.J. Understanding the molecular information contained in principal component analysis of vibrational spectra of biological systems. Analyst 2012, 137, 322–332. [Google Scholar] [CrossRef] [Green Version]
- CrysAlis PRO; Agilent Technologies Ltd.: Yarnton, Oxfordshire, UK, 2014.
- Sheldrick, G.M. Phase annealing in SHELX-90: Direct methods for larger structures. Acta Crystallogr. A 1990, A46, 473–478. [Google Scholar] [CrossRef]
- Dolomanov, O.V.; Bourhis, L.J.; Gildea, R.J.; Howard, J.A.K.; Puschmann, H. OLEX2: A complete structure solution, refinement and analysis program. J. Appl. Crystallogr. 2009, 42, 339–341. [Google Scholar] [CrossRef]
- Berman, H.M.; Westbrook, J.; Feng, Z.; Gilliland, G.; Bhat, T.N.; Weissig, H.; Shindyalov, I.N.; Bourne, P.E. The Protein Data Bank. Nucleic Acids Res. 2000, 28, 235–242. [Google Scholar] [CrossRef] [PubMed] [Green Version]
- Abidi, S.S.A.; Azim, Y.; Gupta, A.K.; Pradeep, C.P. Cocrystals of indole-3-acetic acid and indole-3-butyric acid: Synthesis, structural characterization and Hirshfeld surface analysis. J. Mol. Struct. 2018, 1166, 202–213. [Google Scholar] [CrossRef]
- Garbacz, P.; Wesołowski, M. DSC, FTIR and Raman Spectroscopy Coupled with Multivariate Analysis in a Study of Co-Crystals of Pharmaceutical Interest. Molecules 2018, 23, 2136. [Google Scholar] [CrossRef] [PubMed] [Green Version]
- Rodrigues, M.; Lopes, J.; Sarraguca, M. Vibrational Spectroscopy for Cocrystals Screening. A Comparative Study. Molecules 2018, 23, 3263. [Google Scholar] [CrossRef] [PubMed] [Green Version]
Sample Availability: Samples of the compounds are not available from the authors. |


| XN−NIC (1:1) | XN−GA (1:1) | XN−AC (1:1) | XN−CF (1:1) | |
|---|---|---|---|---|
| Molecular formula | C24 H24 N O5.5 | C15.7 H17 N0.3 O4 | C44 H49 N O11 | C14.5 H18 N2 O4.5 |
| Temperature (K) | 293(2) | 293(2) | 293(2) | 293(2) |
| Crystal system | monoclinic | triclinic | triclinic | triclinic |
| Space group | P21/c | P-1 | P-1 | P-1 |
| a (Å) | 19.754(2) | 10.2247(2) | 8.5254(3) | 6.979(2) |
| b (Å) | 14.8652(8) | 14.3115(2) | 15.2889(4) | 13.470(3) |
| c (Å) | 7.9105(7) | 16.0277(2) | 16.7199(9) | 16.775(2) |
| α (°) | 90 | 73.358(2) | 105.91(2) | 78.13(2) |
| β (°) | 100.365(7) | 77.099(2) | 104.078(1) | 86.33(2) |
| γ (°) | 90 | 75.304(2) | 93.564(1) | 77.82(2) |
| V (Å3) | 2284.9(3) | 2144.71(7) | 2013.4(2) | 1508.1(5) |
| Z | 4 | 6 | 2 | 4 |
| Calculated density (g cm−3) | 1.2047 | 1.2726 | 1.267 | 1.287 |
| Absorption coefficient (mm−1) | 0.703 | 0.753 | 0.745 | 0.803 |
| F(000) | 879 | 875 | 816 | 622 |
| θ range for data collection (°) | 3.74–68.87 | 3.83–68.65 | 3.49–83.19 | 3.92–66.53 |
| Index ranges | −23 ≤ h ≤ 23 −16 ≤ k ≤ 17 −9 ≤ l ≤ 9 | −12 ≤ h ≤ 12 −16 ≤ k ≤ 17 −19 ≤ l ≤ 19 | −10≤ h ≤ 10 −18 ≤ k ≤ 18 −20 ≤ l ≤ 20 | −8 ≤ h ≤ 5 −16 ≤ k ≤ 16 −21 ≤ l ≤ 20 |
| Reflections collected/unique | 17962/4158 (Rint = 0.0554) | 39207/12487 (Rint = 0.0306) | 32035/7314 (Rint = 0.0332) | 9599/5911 (Rint = 0.1580) |
| Observed/restraints/parameters | 17504/0/341 | 12487/3/1320 | 7314/0/658 | 5887/0/359 |
| Goodness-of-fit on F2 | 0.993 | 1.007 | 1.090 | 1.2648 |
| Final R indices (I>2sigma(I)) | R1 = 0.0637 wR2 = 0.1801 | R1 = 0.0391 wR2 = 0.1077 | R1 = 0.0497 wR2 = 0.1510 | R1 = 0.2690 wR2 = 0.5663 |
| R indices (all data) | R1 = 0.0985 wR2 = 0.2183 | R1 = 0.0514 wR2 = 0.1188 | R1 = 0.0546 wR2 = 0.1570 | R1 = 0.4224 wR2 = 0.6645 |
| Largest diff. peak and hole (e Å−3) | 0.256/−0.231 | 0.157/−0.142 | 0.27/−0.26 | 0.89/−0.60 |
| CCDC Number | 1955269 | 1955276 | 1955279 | 1955267 |
| Raman Spectra | Principal Component Number | Eigenvalue | Percentage of Variance (%) | Cumulative (%) |
| 1700–1000 cm−1 | 1 | 5.452366 | 61.78255 | 61.7826 |
| 2 | 2.476297 | 28.05973 | 89.8423 | |
| 3 | 0.656420 | 7.43811 | 97.2804 | |
| 4 | 0.240008 | 2.71961 | 100.0000 | |
| FTIR Spectra | Principal Component Number | Eigenvalue | Percentage of Variance (%) | Cumulative (%) |
| 3700–2700 cm−1 | 1 | 1.354704 | 58.52862 | 58.5286 |
| 2 | 0.601572 | 25.99032 | 84.5189 | |
| 3 | 0.238949 | 10.32354 | 94.8425 | |
| 4 | 0.073795 | 3.18824 | 98.0307 | |
| 1800–1000 cm−1 | 1 | 3.506911 | 52.04774 | 52.0477 |
| 2 | 1.439899 | 21.37023 | 73.4180 | |
| 3 | 0.749832 | 11.12861 | 84.5466 | |
| 4 | 0.601722 | 8.93044 | 93.4770 | |
| 5 | 0.208369 | 3.09250 | 96.5695 | |
| 6 | 0.118206 | 1.75435 | 98.3239 |
© 2019 by the authors. Licensee MDPI, Basel, Switzerland. This article is an open access article distributed under the terms and conditions of the Creative Commons Attribution (CC BY) license (http://creativecommons.org/licenses/by/4.0/).
Share and Cite
Budziak, I.; Arczewska, M.; Kamiński, D.M. Formation of Prenylated Chalcone Xanthohumol Cocrystals: Single Crystal X-ray Diffraction, Vibrational Spectroscopic Study Coupled with Multivariate Analysis. Molecules 2019, 24, 4245. https://0-doi-org.brum.beds.ac.uk/10.3390/molecules24234245
Budziak I, Arczewska M, Kamiński DM. Formation of Prenylated Chalcone Xanthohumol Cocrystals: Single Crystal X-ray Diffraction, Vibrational Spectroscopic Study Coupled with Multivariate Analysis. Molecules. 2019; 24(23):4245. https://0-doi-org.brum.beds.ac.uk/10.3390/molecules24234245
Chicago/Turabian StyleBudziak, Iwona, Marta Arczewska, and Daniel M. Kamiński. 2019. "Formation of Prenylated Chalcone Xanthohumol Cocrystals: Single Crystal X-ray Diffraction, Vibrational Spectroscopic Study Coupled with Multivariate Analysis" Molecules 24, no. 23: 4245. https://0-doi-org.brum.beds.ac.uk/10.3390/molecules24234245