PPARα-Dependent Modulation by Metformin of the Expression of OCT-2 and MATE-1 in the Kidney of Mice

 , and
, and 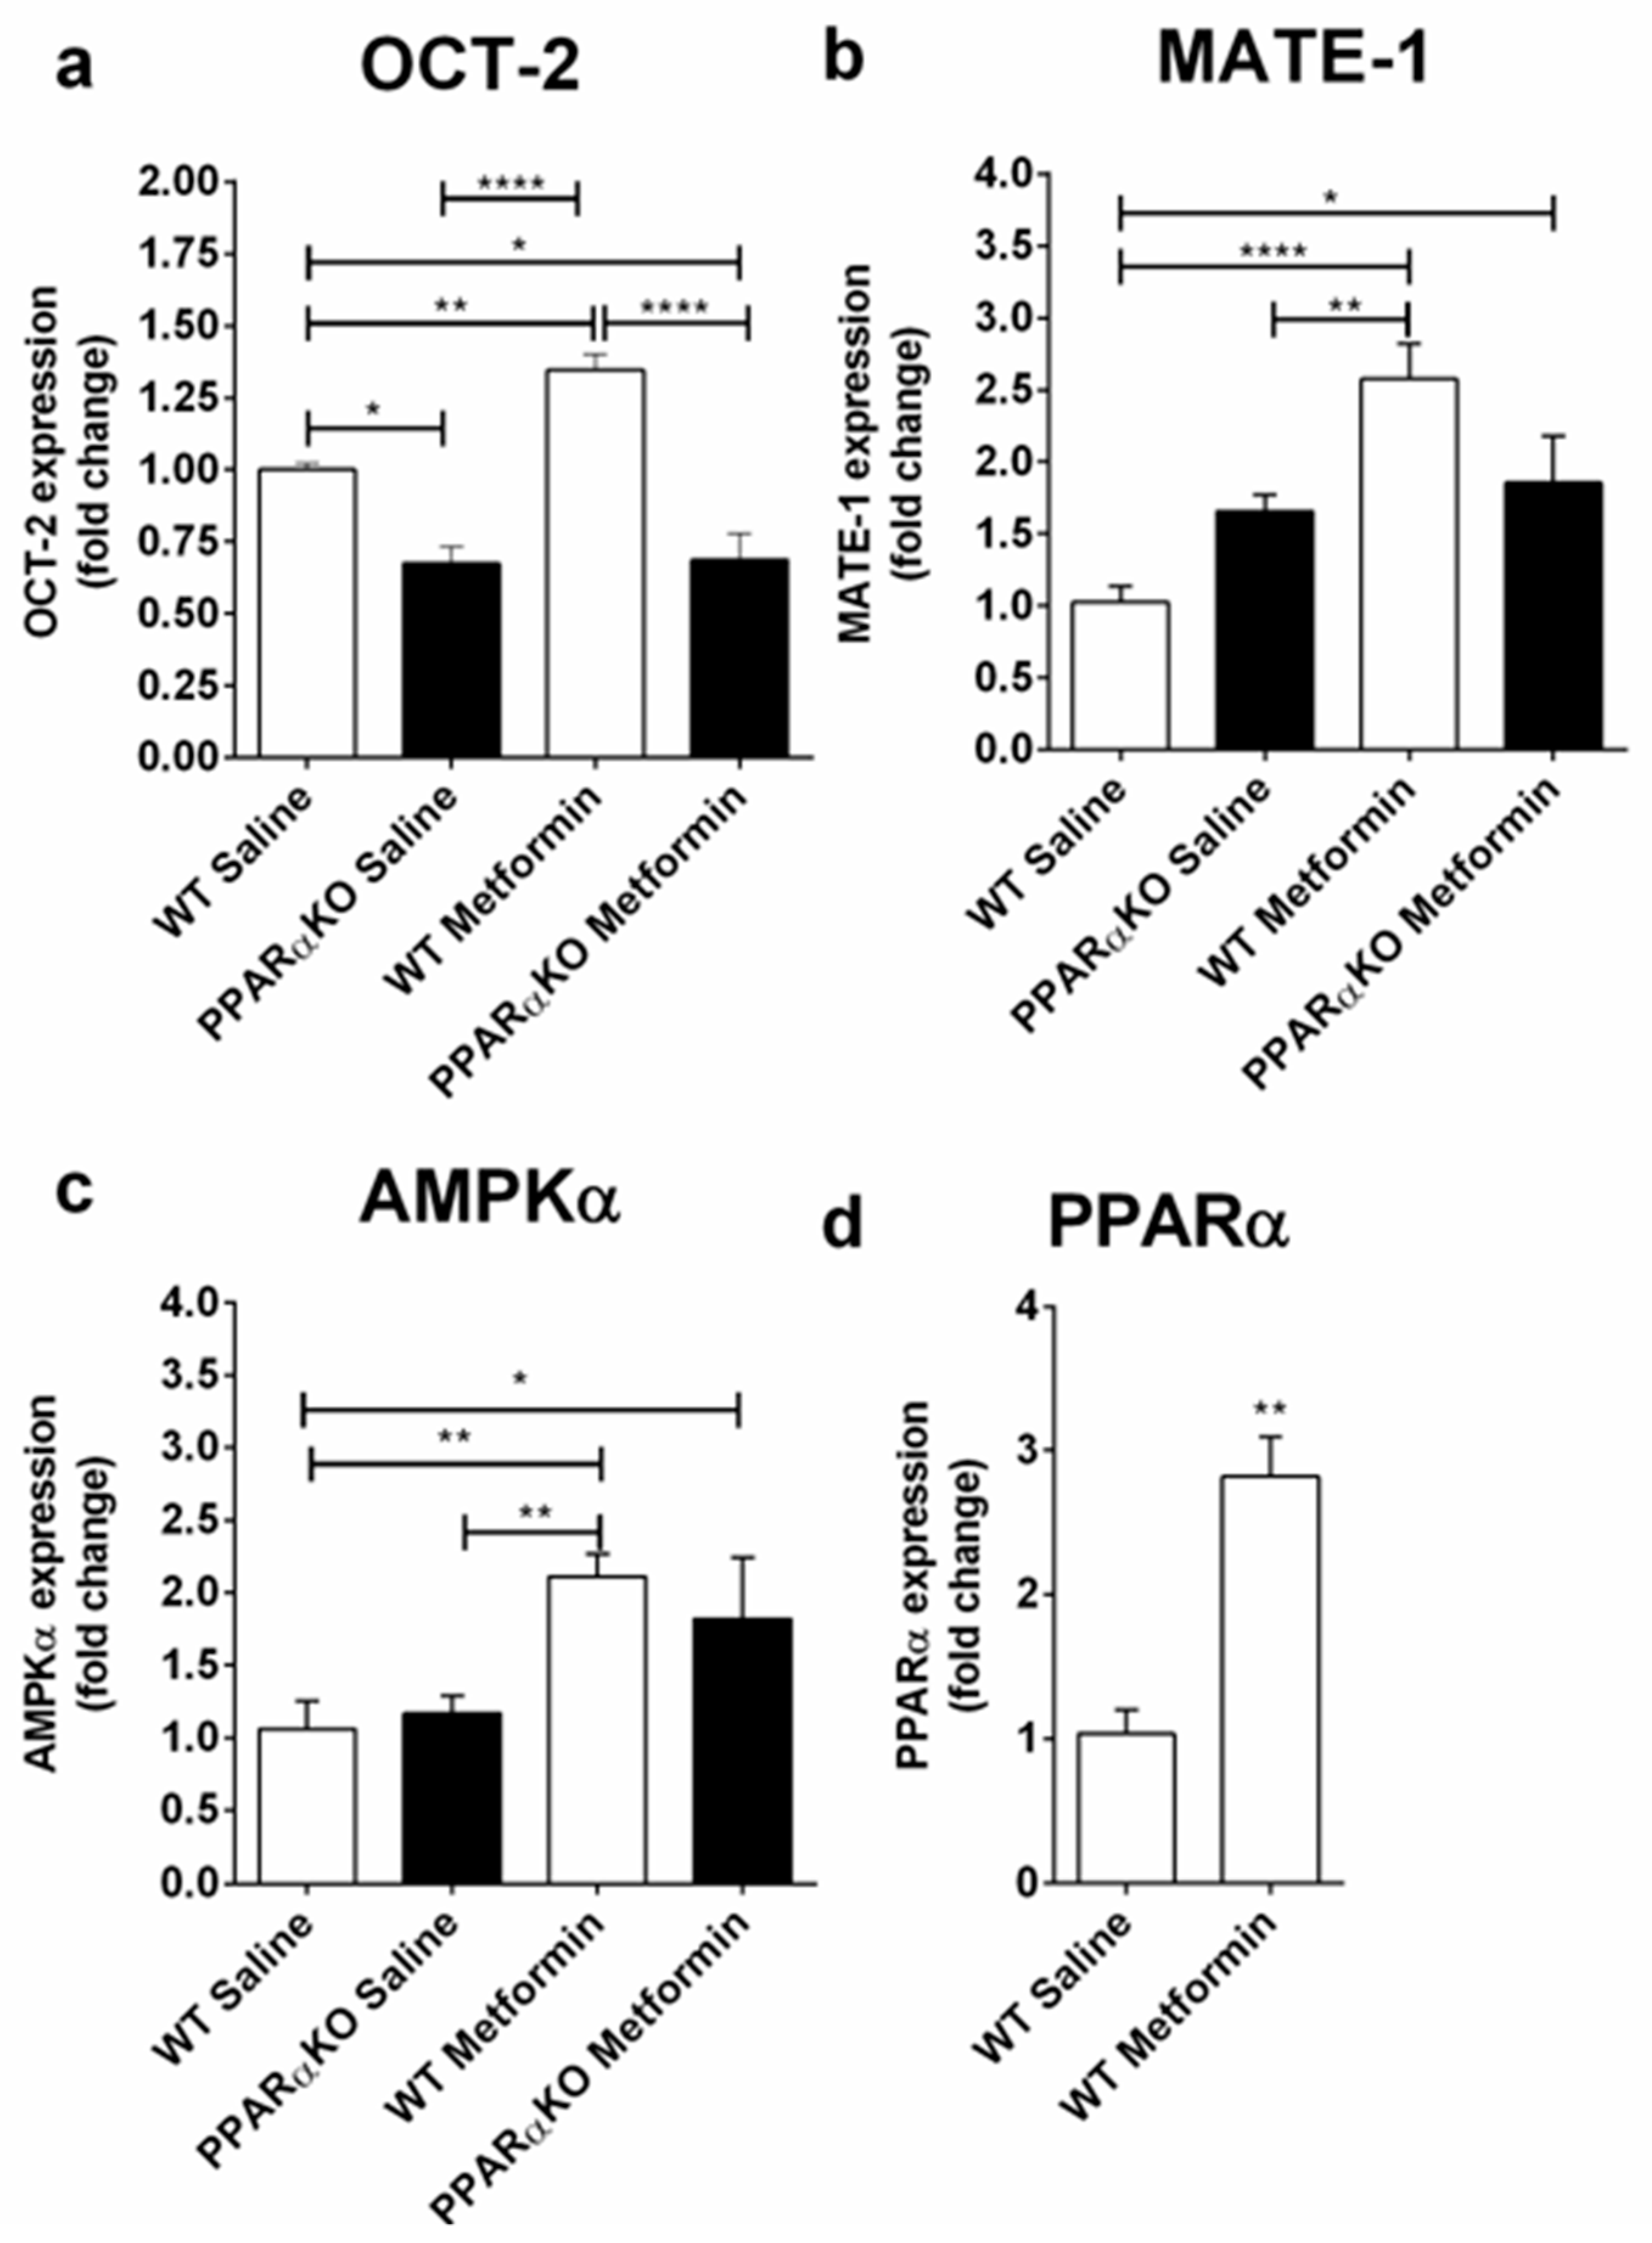
Abstract
:1. Introduction
2. Results
2.1. Metformin Administration is Capable of Modulating OCT-2, MATE-1, and PPARα Expression at the mRNA Level in the Kidney
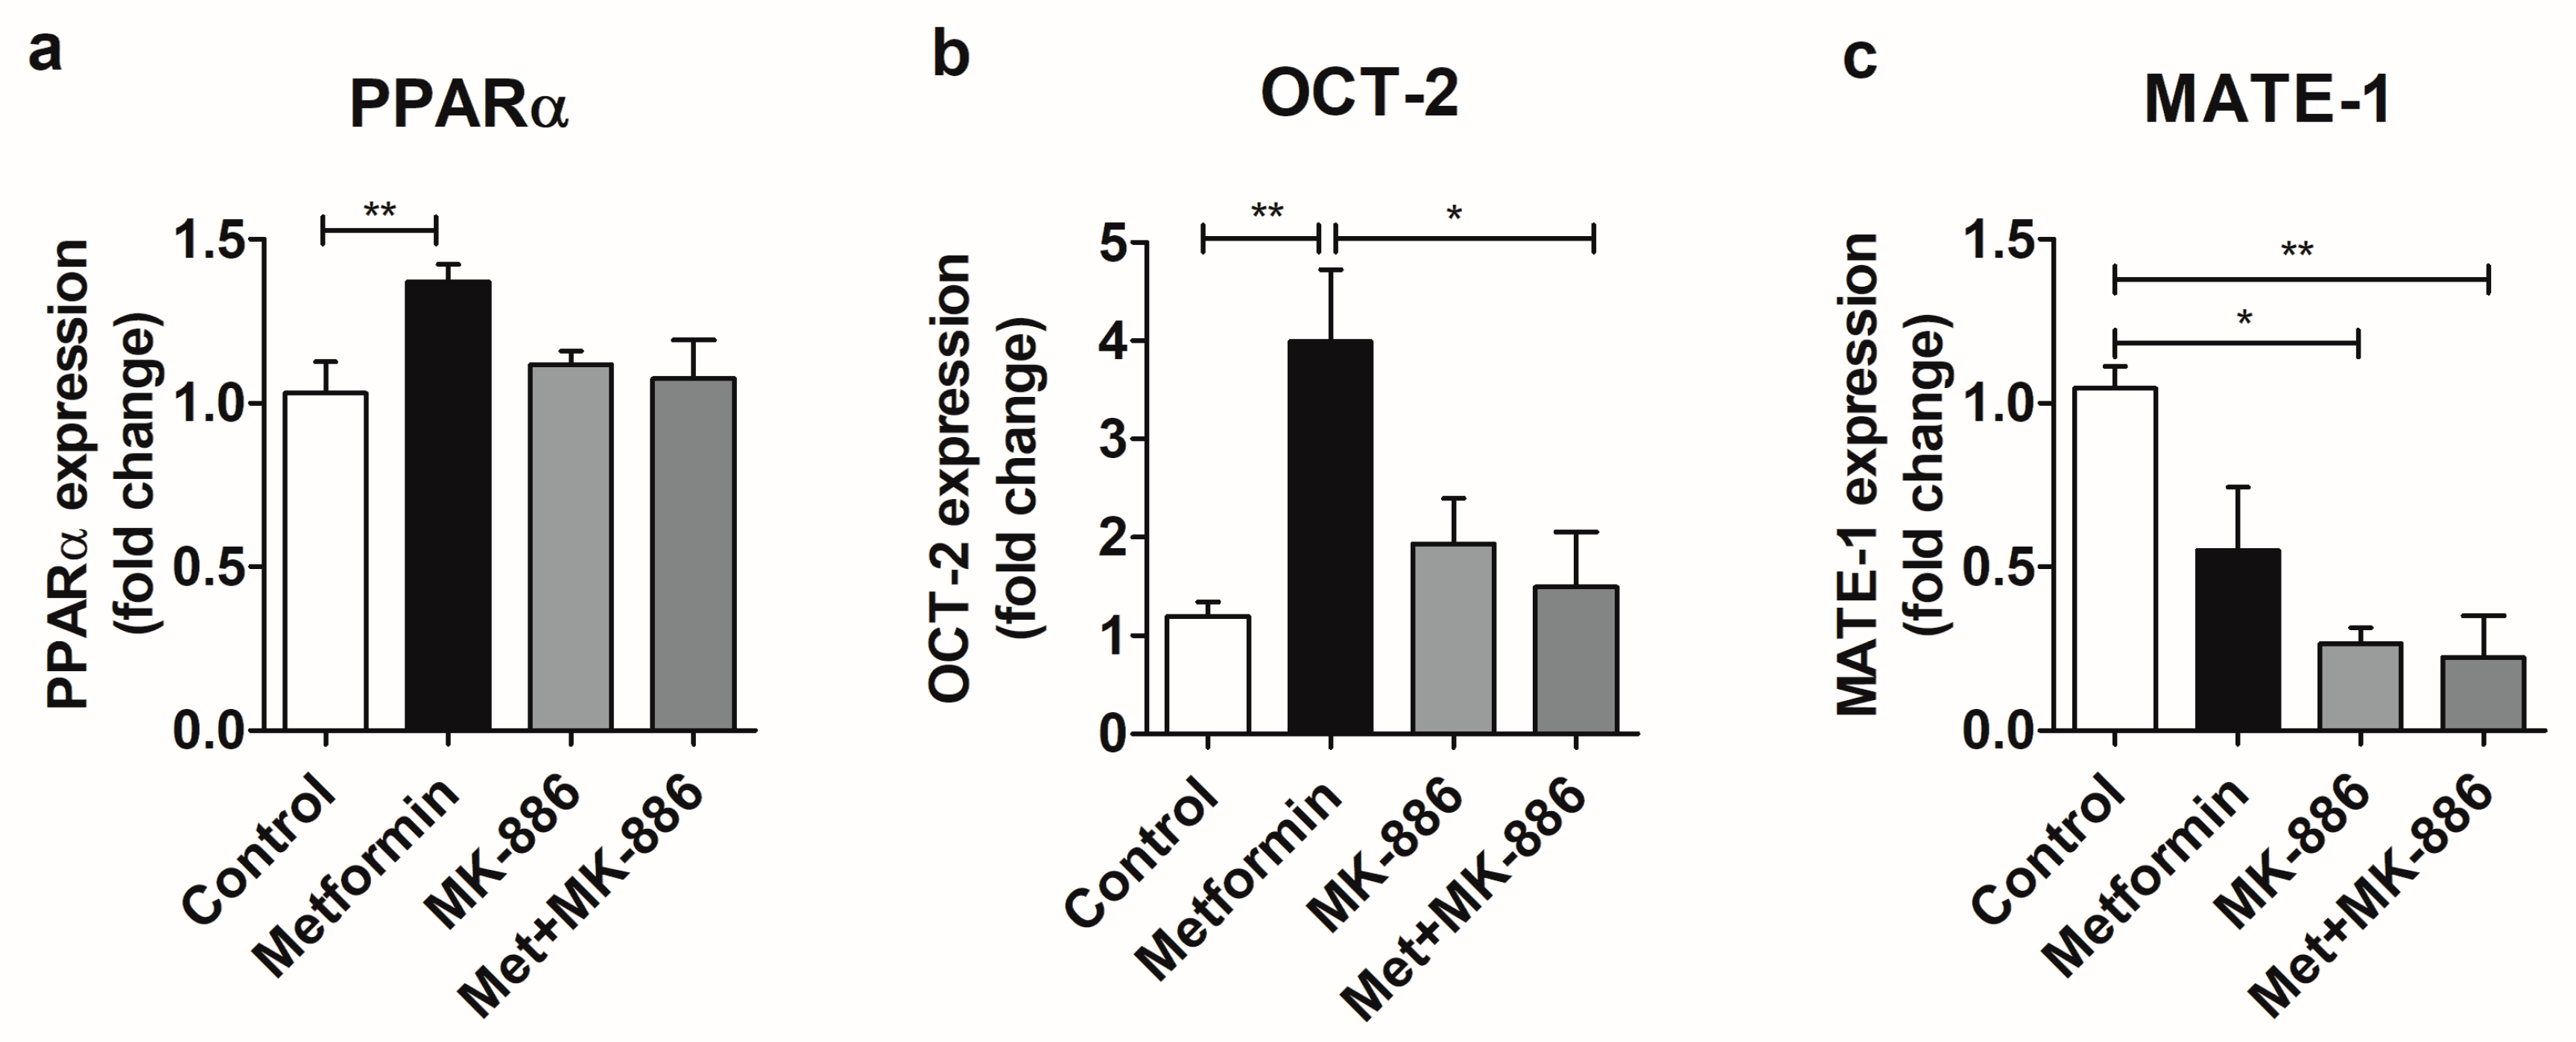
2.2. Metformin Treatment Modulates PPARα, OCT-2, and MATE-1 Expression at the mRNA Level in the MM55.K Cell Line
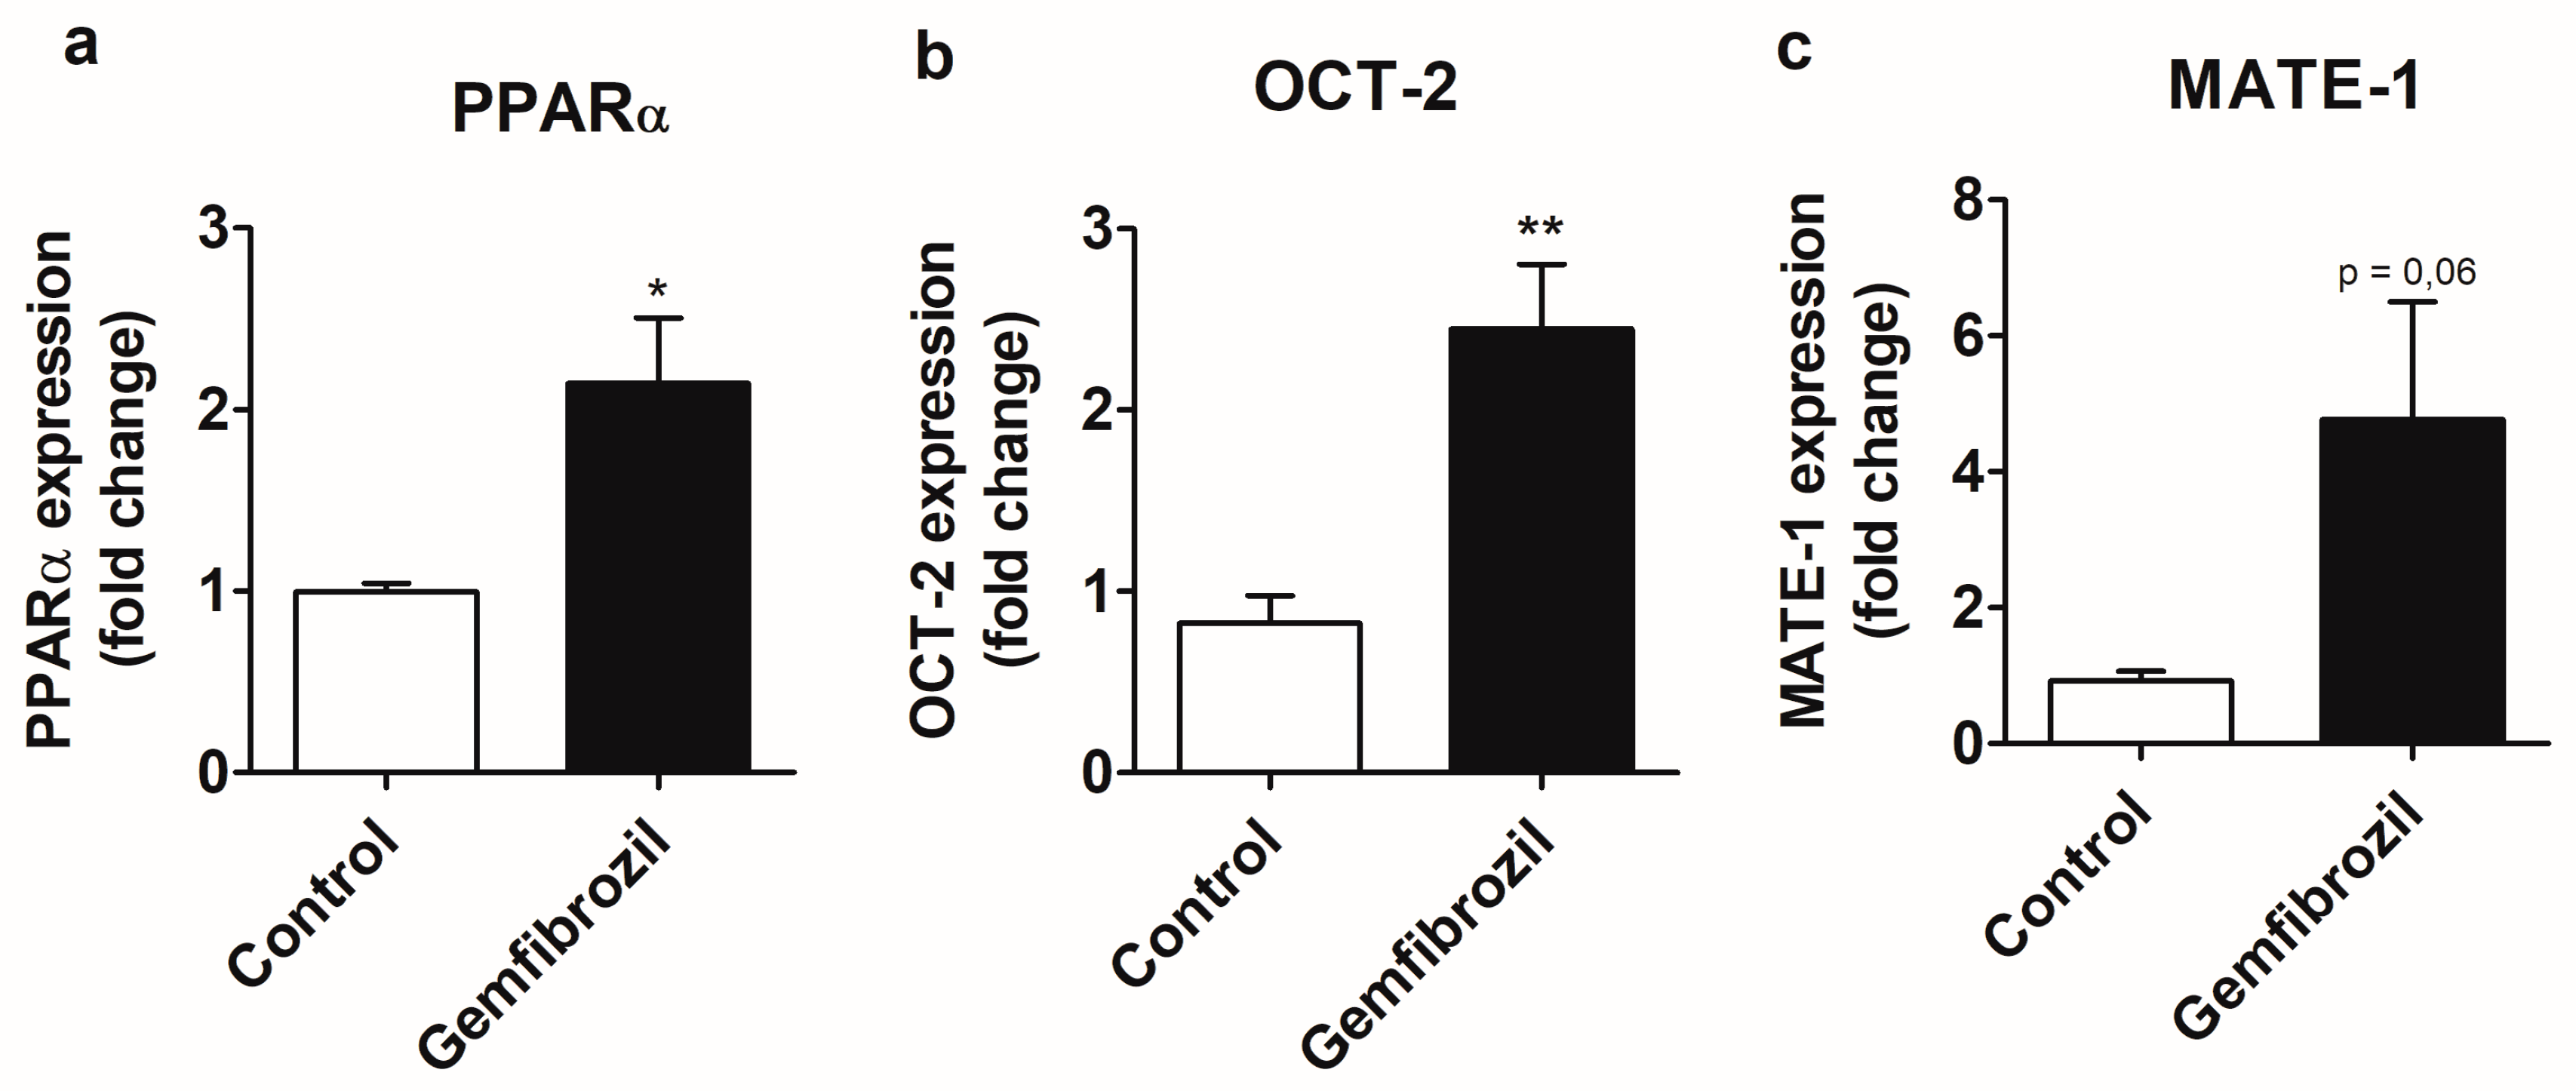
2.3. Gemfibrozil Treatment Modulates PPARα and OCT-2 Expression at the mRNA Level in the MM55.K Cell Line
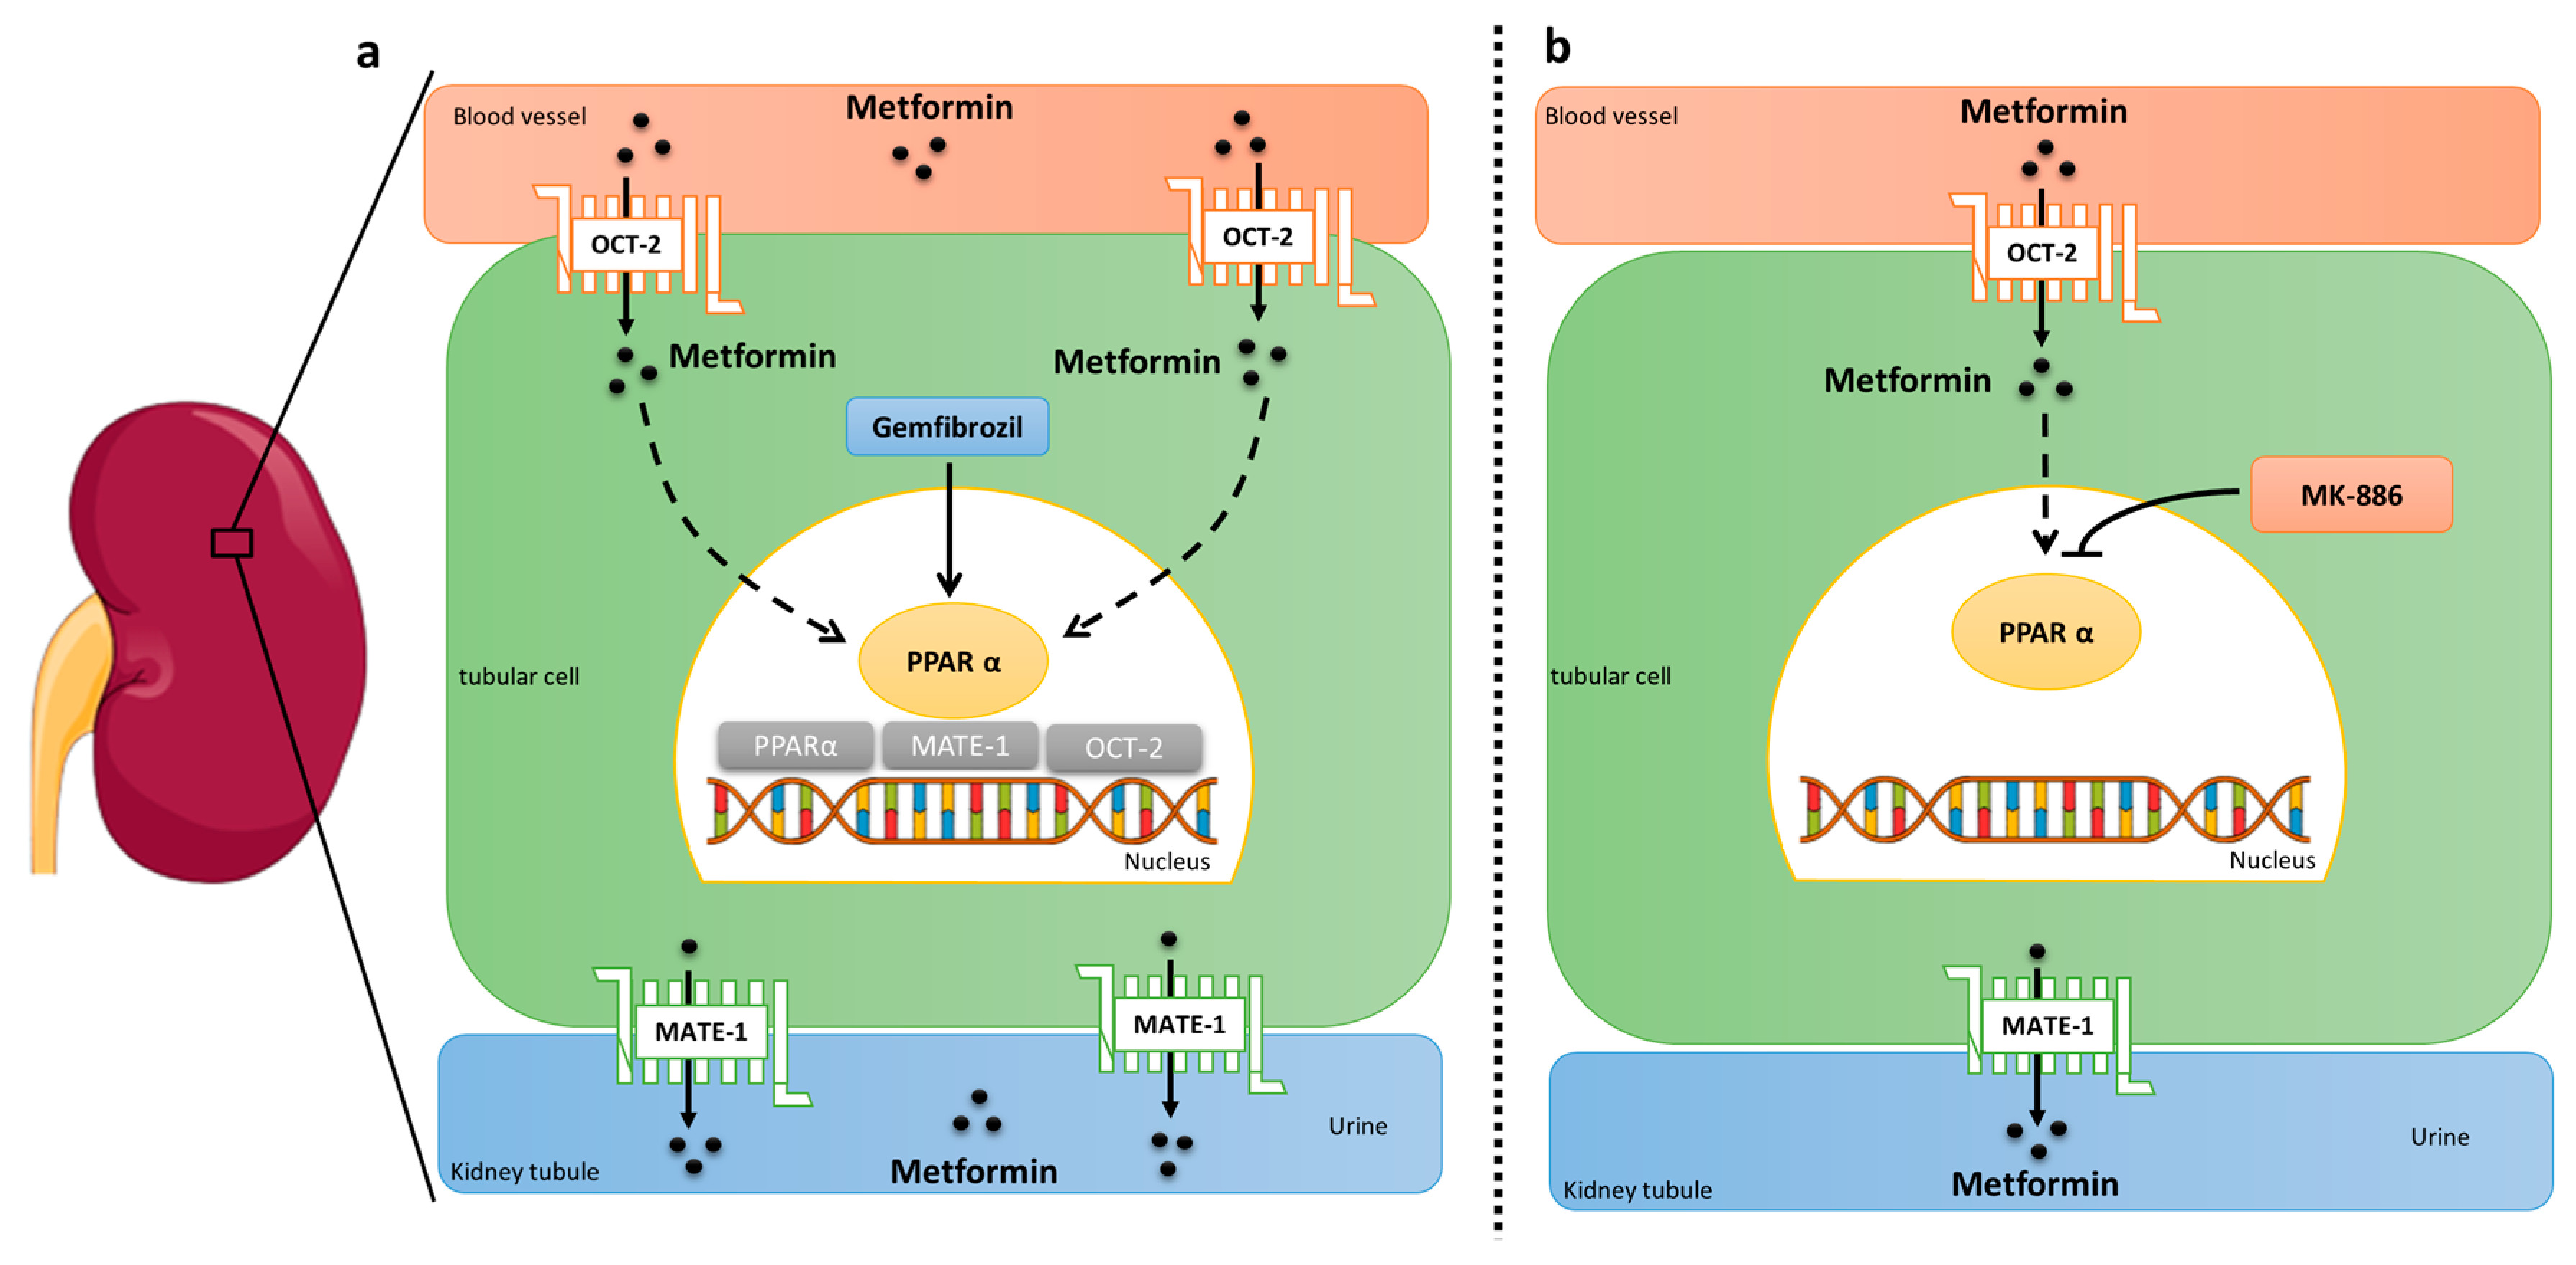
3. Discussion
4. Materials and Methods
4.1. Animals
4.2. Experimental Design in Mice
4.3. Experimental Design in MM55.K Cells
4.4. RNA Extraction and Real-Time PCR
4.5. Statistical Analysis
Supplementary Materials
Author Contributions
Funding
Acknowledgments
Conflicts of Interest
References
- Giacomini, K.M.; Huang, S.M.; Tweedie, D.J.; Benet, L.Z.; Brouwer, K.L.; Chu, X.; Dahlin, A.; Evers, R.; Fischer, V.; Hillgren, K.M.; et al. Membrane transporters in drug development. Nat. Rev. Drug Discov. 2010, 9, 215–236. [Google Scholar] [PubMed]
- Liu, X.; Pan, G. Drug Transporters in Drug Disposition, Effects and Toxicity, Advances in Experimental Medicine and Biology. Adv. Exp. Med. Biol. 2019, 1141, 588. [Google Scholar]
- Motohashi, H.; Inui, K. Organic cation transporter OCTs (SLC22) and MATEs (SLC47) in the human kidney. AAPS J. 2013, 15, 581–588. [Google Scholar] [CrossRef] [PubMed] [Green Version]
- Yin, J.; Wang, J. Renal drug transporters and their significance in drug-drug interactions. Acta Pharm. Sin. B 2016, 6, 363–373. [Google Scholar] [CrossRef] [PubMed] [Green Version]
- Graham, G.G.; Punt, J.; Arora, M.; Day, R.O.; Doogue, M.P.; Duong, J.K.; Furlong, T.J.; Greenfield, J.R.; Greenup, L.C.; Kirkpatrick, C.M.; et al. Clinical pharmacokinetics of metformin. Clin. Pharm. 2011, 50, 81–98. [Google Scholar] [CrossRef] [PubMed]
- Koepsell, H. Role of organic cation transporters in drug-drug interaction. Expert Opin. Drug Metab. Toxicol. 2015, 11, 1619–1633. [Google Scholar] [CrossRef] [PubMed]
- Stocker, S.L.; Morrissey, K.M.; Yee, S.W.; Castro, R.A.; Xu, L.; Dahlin, A.; Ramirez, A.H.; Roden, D.M.; Wilke, R.A.; McCarty, C.A.; et al. The effect of novel promoter variants in MATE1 and MATE2 on the pharmacokinetics and pharmacodynamics of metformin. Clin. Pharmacol. Ther. 2013, 93, 186–194. [Google Scholar] [CrossRef]
- Ma, Y.R.; Huang, J.; Shao, Y.Y.; Ma, K.; Zhang, G.Q.; Zhou, Y.; Zhi, R.; Qin, H.Y.; Wu, X.A. Inhibitory effect of atenolol on urinary excretion of metformin via down-regulating multidrug and toxin extrusion protein 1 (rMate1) expression in the kidney of rats. Eur. J. Pharm. Sci. 2015, 68, 18–26. [Google Scholar] [CrossRef]
- Ciarimboli, G.; Deuster, D.; Knief, A.; Sperling, M.; Holtkamp, M.; Edemir, B.; Pavenstadt, H.; Lanvers-Kaminsky, C.; am Zehnhoff-Dinnesen, A.; Schinkel, A.H.; et al. Organic cation transporter 2 mediates cisplatin-induced oto- and nephrotoxicity and is a target for protective interventions. Am. J. Pathol. 2010, 176, 1169–1180. [Google Scholar] [CrossRef]
- Oda, M.; Koyanagi, S.; Tsurudome, Y.; Kanemitsu, T.; Matsunaga, N.; Ohdo, S. Renal circadian clock regulates the dosing-time dependency of cisplatin-induced nephrotoxicity in mice. Mol. Pharmacol. 2014, 85, 715–722. [Google Scholar] [CrossRef] [Green Version]
- Chinetti, G.; Lestavel, S.; Bocher, V.; Remaley, A.T.; Neve, B.; Torra, I.P.; Teissier, E.; Minnich, A.; Jaye, M.; Duverger, N.; et al. PPAR-alpha and PPAR-gamma activators induce cholesterol removal from human macrophage foam cells through stimulation of the ABCA1 pathway. Nat. Med. 2001, 7, 53–58. [Google Scholar] [CrossRef] [PubMed]
- Montero, T.D.; Racordon, D.; Bravo, L.; Owen, G.I.; Bronfman, M.L.; Leisewitz, A.V. PPARalpha and PPARgamma regulate the nucleoside transporter hENT1. Biochem. Biophys. Res. Commun. 2012, 419, 405–411. [Google Scholar] [CrossRef] [PubMed]
- Nie, W.; Sweetser, S.; Rinella, M.; Green, R.M. Transcriptional regulation of murine Slc22a1 (Oct1) by peroxisome proliferator agonist receptor-alpha and -gamma. Am. J. Physiol. Gastrointest. Liver Physiol. 2005, 288, G207–G212. [Google Scholar] [CrossRef] [PubMed]
- Jonker, J.W.; Wagenaar, E.; Van Eijl, S.; Schinkel, A.H. Deficiency in the organic cation transporters 1 and 2 (Oct1/Oct2 [Slc22a1/Slc22a2]) in mice abolishes renal secretion of organic cations. Mol. Cell. Biol. 2003, 23, 7902–7908. [Google Scholar] [CrossRef] [Green Version]
- Chu, X.; Korzekwa, K.; Elsby, R.; Fenner, K.; Galetin, A.; Lai, Y.; Matsson, P.; Moss, A.; Nagar, S.; Rosania, G.R.; et al. International Transporter, C. Intracellular drug concentrations and transporters: Measurement, modeling, and implications for the liver. Clin. Pharmacol. Ther. 2013, 94, 126–141. [Google Scholar] [CrossRef] [Green Version]
- Estrela, G.R.; Wasinski, F.; Felizardo, R.J.F.; Souza, L.L.; Camara, N.O.S.; Bader, M.; Araujo, R.C. MATE-1 modulation by kinin B1 receptor enhances cisplatin efflux from renal cells. Mol. Cell. Biochem. 2017, 428, 101–108. [Google Scholar] [CrossRef]
- Foretz, M.; Guigas, B.; Bertrand, L.; Pollak, M.; Viollet, B. Metformin: From mechanisms of action to therapies. Cell Metab. 2014, 20, 953–966. [Google Scholar] [CrossRef]
- Wagner, D.J.; Hu, T.; Wang, J. Polyspecific organic cation transporters and their impact on drug intracellular levels and pharmacodynamics. Pharmacol. Res. 2016, 111, 237–246. [Google Scholar] [CrossRef] [Green Version]
- Motohashi, H.; Inui, K. Multidrug and toxin extrusion family SLC47: Physiological, pharmacokinetic and toxicokinetic importance of MATE1 and MATE2-K. Mol. Asp. Med. 2013, 34, 661–668. [Google Scholar] [CrossRef]
- Oh, J.; Chung, H.; Park, S.I.; Yi, S.J.; Jang, K.; Kim, A.H.; Yoon, J.; Cho, J.Y.; Yoon, S.H.; Jang, I.J.; et al. Inhibition of the multidrug and toxin extrusion (MATE) transporter by pyrimethamine increases the plasma concentration of metformin but does not increase antihyperglycaemic activity in humans. Diabetes Obes. Metab. 2016, 18, 104–108. [Google Scholar] [CrossRef] [PubMed]
- Toyama, K.; Yonezawa, A.; Masuda, S.; Osawa, R.; Hosokawa, M.; Fujimoto, S.; Inagaki, N.; Inui, K.; Katsura, T. Loss of multidrug and toxin extrusion 1 (MATE1) is associated with metformin-induced lactic acidosis. Br. J. Pharm. 2012, 166, 1183–1191. [Google Scholar] [CrossRef] [PubMed] [Green Version]
- Hyrsova, L.; Smutny, T.; Trejtnar, F.; Pavek, P. Expression of organic cation transporter 1 (OCT1): Unique patterns of indirect regulation by nuclear receptors and hepatospecific gene regulation. Drug Metab. Rev. 2016, 48, 139–158. [Google Scholar] [CrossRef] [PubMed]
- Corremans, R.; Vervaet, B.A.; D’Haese, P.C.; Neven, E.; Verhulst, A. Metformin: A Candidate Drug for Renal Diseases. Int. J. Mol. Sci. 2018, 20, 42. [Google Scholar] [CrossRef] [PubMed] [Green Version]
- Satriano, J.; Sharma, K. Autophagy and metabolic changes in obesity-related chronic kidney disease. Nephrol. Dial. Transpl. 2013, 28 (Suppl. 4), iv29–iv36. [Google Scholar] [CrossRef] [Green Version]
- Fang, L.; Zhang, M.; Li, Y.; Liu, Y.; Cui, Q.; Wang, N. PPARgene: A Database of Experimentally Verified and Computationally Predicted PPAR Target Genes. PPAR Res. 2016, 2016, 6042162. [Google Scholar] [CrossRef] [PubMed] [Green Version]
- Mandard, S.; Zandbergen, F.; Tan, N.S.; Escher, P.; Patsouris, D.; Koenig, W.; Kleemann, R.; Bakker, A.; Veenman, F.; Wahli, W.; et al. The direct peroxisome proliferator-activated receptor target fasting-induced adipose factor (FIAF/PGAR/ANGPTL4) is present in blood plasma as a truncated protein that is increased by fenofibrate treatment. J. Biol. Chem. 2004, 279, 34411–34420. [Google Scholar] [CrossRef] [PubMed] [Green Version]
- Wen, G.; Ringseis, R.; Eder, K. Mouse OCTN2 is directly regulated by peroxisome proliferator-activated receptor alpha (PPARalpha) via a PPRE located in the first intron. Biochem. Pharm. 2010, 79, 768–776. [Google Scholar] [CrossRef] [Green Version]
Sample Availability: Samples of the compounds are not available. |


© 2020 by the authors. Licensee MDPI, Basel, Switzerland. This article is an open access article distributed under the terms and conditions of the Creative Commons Attribution (CC BY) license (http://creativecommons.org/licenses/by/4.0/).
Share and Cite
Arruda, A.C.; Perilhão, M.S.; Santos, W.A.; Gregnani, M.F.; Budu, A.; Neto, J.C.R.; Estrela, G.R.; Araujo, R.C. PPARα-Dependent Modulation by Metformin of the Expression of OCT-2 and MATE-1 in the Kidney of Mice. Molecules 2020, 25, 392. https://0-doi-org.brum.beds.ac.uk/10.3390/molecules25020392
Arruda AC, Perilhão MS, Santos WA, Gregnani MF, Budu A, Neto JCR, Estrela GR, Araujo RC. PPARα-Dependent Modulation by Metformin of the Expression of OCT-2 and MATE-1 in the Kidney of Mice. Molecules. 2020; 25(2):392. https://0-doi-org.brum.beds.ac.uk/10.3390/molecules25020392
Chicago/Turabian StyleArruda, Adriano Cleis, Mauro Sérgio Perilhão, Warley Almeida Santos, Marcos Fernandes Gregnani, Alexandre Budu, José Cesar Rosa Neto, Gabriel Rufino Estrela, and Ronaldo Carvalho Araujo. 2020. "PPARα-Dependent Modulation by Metformin of the Expression of OCT-2 and MATE-1 in the Kidney of Mice" Molecules 25, no. 2: 392. https://0-doi-org.brum.beds.ac.uk/10.3390/molecules25020392