
Recent Advances in Luminescence Imaging of Biological Systems Using Lanthanide(III) Luminescent Complexes


Department of Chemistry, Humboldt State University, Arcata, CA 95521, USA
Molecules 2020, 25(9), 2089; https://0-doi-org.brum.beds.ac.uk/10.3390/molecules25092089
Submission received: 5 April 2020
/
Revised: 25 April 2020
/
Accepted: 27 April 2020
/
Published: 29 April 2020
(This article belongs to the Special Issue Luminescent Lanthanide Complexes)
Abstract
:The use of luminescence in biological systems allows one to diagnose diseases and understand cellular processes. Molecular systems, particularly lanthanide(III) complexes, have emerged as an attractive system for application in cellular luminescence imaging due to their long emission lifetimes, high brightness, possibility of controlling the spectroscopic properties at the molecular level, and tailoring of the ligand structure that adds sensing and therapeutic capabilities. This review aims to provide a background in luminescence imaging and lanthanide spectroscopy and discuss selected examples from the recent literature on lanthanide(III) luminescent complexes in cellular luminescence imaging, published in the period 2016–2020. Finally, the challenges and future directions that are pointing for the development of compounds that are capable of executing multiple functions and the use of light in regions where tissues and cells have low absorption will be discussed.
1. Introduction
The use of luminescence in biological systems allows one to diagnose and understand cellular processes [1,2,3,4,5,6,7,8]. Luminescent labels, such as organic dyes [4,9,10], transition metal complexes [8,11,12,13] and nanoparticles [1,2,3], are known, yet photobleaching and aggregation in the case of the organic dyes, as well as short emission lifetimes, and narrow Stokes shifts, limit their application.
Lanthanide(III) (LnIII) ions are very attractive for application in cellular luminescence imaging [14,15,16,17,18,19,20,21,22,23,24,25,26] due to long emission lifetimes, which enable time-gated detection and thus increased signal-to-noise ratio, and narrow emission bands. As the emission is due to parity-forbidden f–f transitions, a chromophore bound to the metal ion is used as sensitizer; it absorbs energy and transfers it to the LnIII ion, which then emits light (Figure 1) [24,27,28]. Soini and Hemmilä were the first ones to report on the use of the long-lived LnIII emission in bioimaging [29]. That was followed by decades of contribution from Bünzli′s research group to the establishment and applicability of LnIII compounds in bioimaging [20,21,30]. Since then, the use of LnIII complexes in bioimaging has flourished, and several examples are found in the literature [16,17,31,32,33].
For use in cellular luminescence imaging, the LnIII complexes have to meet the following requirements: water-solubility, thermodynamic stability, absorption band at or above 405 nm, high brightness, and excited state lifetime in the micro- or milliseconds range [26]. EuIII is still the most used LnIII in bioimaging due to its luminescence lifetime in the millisecond range, and bright emission in the red region of the electromagnetic spectrum, that allows time-gated detection in a region in which the cells and tissues have low scattering [34].
Most recent developments in LnIII luminescent complexes in the broad field of luminescence imaging are focused on systems capable of luminescence and sense a biological relevant species [35,36,37], development of compounds that are capable of imaging and therapy [31,38,39], and the use of excitation and/or emission in a region where there is low scattering by cells and tissues [15,32,40]. All those developments are geared towards compounds that are capable of executing multiple functions, which means a decrease in the cost, more results obtained with a single compound, and the use of less energetic radiation to avoid cell or tissue damage.
This review aims to provide a background in luminescence imaging and lanthanide spectroscopy and discuss selected examples of recent literature on lanthanide(III) luminescent complexes in cellular luminescence imaging, published in the period 2016–2020. For detailed information about lanthanide luminescence, internalization processes of LnIII complexes, LnIII bioconjugates, LnIII NIR luminescence imaging, molecular upconversion systems, and upconversion nanoparticles the reader is referred to other reviews [24,28,41,42,43,44,45,46,47,48,49]. Finally, the challenges and future directions that are pointing for the development of compounds that are capable of executing multiple functions, and the use of light in regions where tissues and cells have low absorption will be discussed.
2. Luminescence Imaging
The basic principle of luminescence imaging is to excite a volume of a sample containing a photoluminescent label and collect the light emitted. The excitation of the sample is achieved with light coming from the top, in a setup called inverted microscope, or from the bottom, in a setup called upright microscope. Inverted microscopes are recommended for samples fixed in a glass slide, and upright microscopes for live samples due to closer proximity between lenses and sample in the former. The two used methods to image biological samples using photoluminescent labels are widefield (WF), and confocal (CF) microscopy [50].
In WF microscopes, the excitation light is first collimated by a set of lenses (L1), reflected by a dichroic mirror (DM), and excite the sample (Figure 2a). The resulting emission passes through the dichroic mirror (DM), filter (F), and a lens (L3) focuses it on the detector that transforms the photons in the electrical signal, Figure 2a. The advantage of the WF microscopy is that it allows the use of versatile excitation sources such as Hg- (230–600 nm), Xe-arc lamp (250–1000 nm), or LEDs that cover a wide range of wavelengths. The downside of this system is that a large area of the sample is excited, resulting in undesirable background emission that causes a decrease in the signal-to-noise ratio. Also, Hg- and Xe-arc lamps have a low lifetime, ~200–500, and ~400–100 h, respectively, and an excessive amount of heat is generated, which requires special housing and ventilation. That is one of the reasons that LEDs have become popular. They have higher lifetimes (~10,000–100,000 h), generate a negligible amount of heat, and have output light intensity comparable to Hg- or Xe-arc lamps [50,51].
In CF microscopes, the excitation light is first collimated by a set of lenses (L1), passes through a pinhole, it is then reflected by a dichroic mirror (DM), focalized by lenses (L2), and excite a specific volume of the sample (Figure 2b). The resulting emission passes through the dichroic mirror (DM), filter (F), it is then focused by a lens (L3) to the pinhole and gets to the detector, Figure 2b [52,53,54]. In this setup, all the excitation light is focused on a small volume of sample, which increases the light intensity, and only light emitted from that specific point is allowed to get to the detector. The pinhole is essential in the CF system, as it excludes any emission that is not from the focal point, Figure 2c. CF setups allow a better resolution with increased signal-to-noise ratio and construction of 3D images. The downside of this system is the cost, and the possibility to use only lasers as the excitation source, which constrains the possible wavelengths (405, 440, 488, 514, 568, 635 and 685 nm, are the most common). In both WF and CF microscope setups described above, the same lens is used to both excite and collect the emission from the sample. Thus, the two systems receive the epi-fluorescence name.
3. 4f-4f Electronic Transitions
Luminescence is the spontaneous emission of radiation from electronically or vibrationally excited species not in thermal equilibrium with their environment [56]. The characteristic 4f-4f electronic transitions of LnIII are sharp due to the small Stokes shift caused by the core nature of the 4f electrons, shielded from the coordination environment by the 5s and 5p electrons, which minimizes the perturbation of the 4f electrons by the ligand field (Figure 4a,b) [57]. As a result of the shielding and high atomic number, the inter-electronic repulsion has a magnitude of ~104 cm−1, while the spin-orbit coupling and ligand field have magnitudes of ~103 and ~102 cm−1, respectively. Thus, the splitting of the energy levels of the LnIII ions is dominated by the first one, as shown in Figure 4b [57].
The energies of the transitions are therefore characteristic of each LnIII ion, and the most intense transitions are located, for example, in the UV (GdIII), visible (TbIII—green, DyIII—yellow, SmIII—orange, EuIII—red) or near infra-red (NdIII or YbIII), as illustrated in Figure 5.
The unique nature of the 4f-4f electronic transitions is examined in the seminal publication by Van Vleck [59], in which he discusses the possible mechanisms for the 4f-4f electronic transitions, namely magnetic dipole (), electric quadrupole () and electric dipole (), as summarized in Table 2.
The magnetic dipole operator depends on the coupling between the magnetic orbital and spin moments and explains part but not all the observed transitions. The 4f-4f transitions are allowed by electric quadrupole, however, the calculated oscillator strengths (10−11) are lower than the experimental ones (10−7). The electric dipole mechanism cannot connect states with the same parity (for example, f-f) in the presence of an inversion center, also known as the Laporte or parity rule. However, in an asymmetric ligand field, the inversion center is absent, and the Laporte rule is relaxed. This mechanism is known as forced electric dipole and can be used to explain the 4f-4f electronic transitions and the observed experimental oscillator strengths [60,61,62]. The Laporte rule can be demonstrated using group theory. For this example, the symmetry point group O will be considered to predict if a given 4f-4f transition is allowed or not. According to the Wigner-Eckart theorem (Equation (1)), if the direct product between the initial state (Γi) and electric dipole operator (Γµ) irreducible representations contains the final state ir.educible representation Γf, then the transition is allowed [63]:
where Γ is the irreducible representation associated with the initial (i) and final (f) states, and the electric dipole operator (µ).
Γi × Γµ ⊂ Γf,
In this case, the direct product between the 5D0 and electric dipole irreducible representations is, Γ 5D0 × Γµ= A1 × T1 = T1; thus, only transitions to final states that have the A1 representation will be allowed. Therefore, in the symmetry point group O, the 5D0 → 7F2 transition is not allowed, Figure 6. For more details regarding the symmetry rules and the number of allowed transitions, the reader is referred to the literature [63,64,65].
The Laporte forbidden nature of the f-f transitions results in a low absorption coefficient, ~1–10 mol−1 L cm−1, and long excited state lifetimes, in the range of micro to milliseconds. The limitation imposed by the low molar absorptivity is circumvented by coordinating a chromophore to the LnIII. The chromophore functions as the sensitizer, and this process is known as the antenna effect. In a LnIII coordination complex, the light is absorbed by an organic chromophore (through S → S* transitions); after inter-system crossing (ISC) the energy is transferred from the triplet level T of the ligand to the LnIII excited level f*, and finally emitted through the characteristic 4f-4f transitions, as shown in Figure 1. The influence of the ligand′s triplet level T energy, of the symmetry of the complex and the donor-acceptor distance on the luminescence efficiency, has been extensively described [28,66,67]. Charge transfer states such as ligand-to-metal (LMCT) and intra-ligand charge (ILCT) can also contribute to the energy transfer process [28,68,69].
3.1. Quantum Yield of Sensitized Emission () and Brightness (Bλ)
The characterization of LnIII ion complexes for emission applications involves quantification of the emission efficiency of the compound, also called the quantum yield of sensitized emission, . In the case of EuIII, the intrinsic quantum yield, , is easily accessible experimentally (vide infra) and thus also often reported. measures the ability of a given ligand system to protect the emissive levels from non-radiative deactivation.
The intrinsic quantum yield is equivalent to the emission efficiency using direct f-f excitation. Technically, it is possible to measure the using an integrating sphere for samples in the solid-state if the ligand band does not overlap with the f-f transitions [68,70,71]. However, depending on the non-radiative and radiative rates, the measurement using an integrating sphere results in errors up to 60% [68,71]. Therefore, the determination of using Equation (2) leads to the most trustable results:
where Atot is the total radiative emission rate (Atot = 1/τobs τobs is the experimentally determined emission lifetime) and Arad is the radiative emission rate, determined using Equation (3) [72]:
νi is the frequency of the transition, J is the quantum number of the initial state, χed and χmd are the Lorentz local field corrections, Sed and Smd are the strengths of the transitions. ed and md stand for electric dipole and magnetic dipole, respectively. For the particular case of EuIII the calculation of Arad can be done using the emission spectra, and Equation (3) simplifies to Equation (4) [65]:
where AMD, 0 is the coefficient of spontaneous emission for the 5D0 → 7F1 magnetic dipole transition (14.65 s−1), n is the refractive index of the solution, Itot and IMD are the integrated area of the whole emission spectra and of the 5D0 → 7F1 transitions, respectively.
In the case of the other lanthanides(III), there is no “pure” magnetic dipole transition which means that the absorption spectra must be used to calculate Arad. More details about the equations and the method use to obtain Arad is described by Sigoli and co-workers [73].
The experimental determination of the quantum yield of sensitized emission can be done through absolute or comparative methods. Measurement using the absolute method involves the use of an integrating sphere, to determine the ratio of photons emitted by the sample inside the integrating sphere to incident photons, as outlined in Equation (5) [27]:
where I is the intensity of emitted light and L is the scattering of incident radiation observed. sample and empty stand for integrating sphere with and without the sample, respectively.
The comparative method involves the determination of the quantum yield using a standard. A list of different standards is described in the literature [74]. When using a standard, it is desirable to excite sample and standard at the same wavelength, and it is desirable that sample and standard have emission bands in the same region of the spectrum, to account for the wavelength-dependent instrument response. To overcome potential problems with sample concentrations outside the Lambert-Beer regime, the dilution method is often used. Several solutions with different concentrations of sample and standard are prepared and the overall quantum yield is then determined with Equation (6):
where n is the refractive index, I is the intensity of the excitation source, Grad are the slopes of the plots of integrated emission spectra against absorbance of each solution for sample and standard, and Φstd is the quantum yield of the standard. A list with several standards and its excitation and emission wavelengths can be found in the literature [74].
In luminescence imaging, brightness (Bλ) is an essential parameter to be considered. High brightness is desirable to obtain images with low background noise in short periods of time. The emission brightness (Bλ) is determined using Equation (7):
where ε is the molar absorptivity (or molar extinction coefficient), and is the quantum yield, both determined at the wavelength λ. To maximize the brightness, a combination of high molar absorptivity coefficients and high quantum yield is necessary.
3.2. Deactivation of the LnIII Excited State
The LnIII emission intensity is sensitive to non-radiative deactivation processes such as back-energy transfer, thermal deactivation, and deactivation by vibrational coupling between the LnIII excited level and coordinated solvent molecules. Figure 7 shows the electronic levels for TbIII, EuIII and YbIII, and the phonons for the water molecule O–H vibrations ν(O–H) ~3600 cm−1). As shown in Figure 6, quenching of the 5D4 TbIII and 5D0 EuIII excited levels require vibrational coupling with 5–6, and 4–5 phonons, respectively, while the 2F5/2 YbIII excited level only requires vibrational coupling with three phonons. The ease in quenching the YbIII excited level is one of the challenges to overcome in developing YbIII complexes for luminescence imaging.
The number of coordinated water molecules (q) to EuIII, TbIII, and YbIII ions is correlated with the emission lifetime (τ) and can be determined using the Equations (8)–(10) [75,76], respectively:
where τ is the emission lifetime measured in H2O and D2O.
The stability constant β, or more commonly its log, log(β), is a number that correlates with the stability of the LnIII complex in solution. A high value of log(β) means that the concentration of free LnIII and free ligand in solution is small; in other words, it means stability in solution. A wide variety of EuIII and GdIII complexes, along with their log(β) values are shown in Figure 8 [27,28,77]. EuIII and GdIII were chosen mainly because of the number of reports available, and because those elements are in the middle of the LnIII series; thus, they are a good representation of the whole series. Usually, tri- or multi-dentate negatively charged ligands form LnIII complexes with high stability constants due to the thermodynamic stability yielded by the chelate bonding, and strong ionic interaction between charged ligand and LnIII, respectively. As shown in Figure 8, uncharged ligands tend to form less stable LnIII complexes compared with the charged ones. General guidelines can be drawn from the compilation of different stability constants for different LnIII complexes. However, the presence of competing cations, the size of the ligands, and the coordination strength of the solvents are factors that must be taken into account as well. For biological applications, LnIII complexes containing multi-dentate ligands and coordination numbers of nine or higher are preferred due to the high stability in aqueous solution.
3.3. Cell Lines Abbreviations and Ligand Structures
4. LnIII Complexes in Bioimaging
4.1. Nanoparticles and Polymers Systems Functionalized with LnIII Complexes in Bioimaging
Nanoparticles (NPs) are a versatile platform due to their facile synthesis and easy functionalization of the surface to achieve multiple functionalities, for example, luminescence imaging and therapy [89,90]. The low cell penetrability, low molar extinction coefficient, and absorption band in the deep UV region of the electromagnetic spectrum are however limiting factors for the use of NPs in luminescence imaging [91]. Those are circumvented by functionalizing its surface with cell receptors that facilitate cell recognition and uptake, and LnIII complexes, that improve the absorption and emission of light [92,93,94,95,96,97], respectively. For example, surface functionalization of hydroxyapatite NPs (HNPs) with [Eu(dbm)3(H2O)2] complexes yielded a system with low cytotoxicity and capable of luminescence imaging HeLa cells [92,93,94]. Although the system mentioned above is biocompatible, the cell uptake is low, resulting in the use of higher concentrations to obtain the luminescence images. Surface functionalization with folic acid (FA), a receptor overexpressed in cancer cells, improved the cellular uptake of the EuIII-HNPs by HeLa cells [95]. The use of nucleic acid-base aptamers is another strategy for improving the NPs cell uptake due to its low cost, strong interaction, and specificity towards cancer cells [98]. Bioconjugation of LnIII complexes, protected by a silica shell, with the aptamer Sgc8 using glutaraldehyde or succinic anhydride and EDAC/Sulfo-NHS resulted in a system that has a strong affinity for CCRF-CEM and Jurkat cells [96,97].
Coating LnIII complexes with silica shells [96,97], use of heterobimetallic IrI/EuIII [99], and decoration of NPs surface with chromophores [100] are strategies used to improve the emission intensity of NPs. For example, Ir/Eu heterobimetallic complexes were trapped inside mesoporous silica nanoparticles (MSN) to improve water solubility. The system showed emission quantum yield of 55.2%, low cytotoxicity in the concentration range 0–200 mg mL−1 and was used for luminescence imaging of HeLa cells [99]. Decoration of LnIII NPs with chromophores is another strategy for improving the LnIII emission intensity, and for protecting the LnIII against solvent molecules coordination [100]. Using this strategy, La0.9Tb0.1F3 NPs decorated with 3,3′-((butane-1,4-diylbis(azanediyl))bis(carbonyl))bis(2-hydroxybenzoic acid)–LNP–were used in luminescence imaging of HeLa cells (Figure 10) [100].
Polymeric systems have high absorption cross-section, high photostability, and, similar to NPs, offers the possibility of multi functionalities through the attachment of different compounds throughout the polymeric chain [101,102,103,104,105]. The broad emission bands and the low emission lifetimes are disadvantages of polymeric systems for use in luminescence imaging. Coordination of LnIII in the polymer structure results in systems with narrow emission bands, and emission lifetime in the microsecond to millisecond range that is suitable for time-gated imaging [106,107,108,109,110,111]. Biocompatible polymers such as polysiloxanes, imidazole-based polymers, and polymeric sugar chains functionalized with LnIII are widely used in luminescence imaging [107,108,109]. Imidazole-based polymers are particularly advantageous due to the capability of bonding to LnIII using the nitrogen atom from the imidazole moiety. Thus, in this kind of system extra steps to add LnIII coordinating capabilities are not required. For example, self-assembled imidazole polymers (VI-c-PEGMA) coordinated to DyIII and coated with silica was found to be chemically stable and successfully used in the luminescence imaging of L929 cells [108]. Although not specified, it is assumed that the images were obtained using excitation centered at the Dy 4f-4f transitions. Sugar polymeric chains are an alternative in the search for more biocompatible polymers due to their ease diffusion in cells and in the body [112]. Natural sugar polymeric chains modified with the [Tb(dota)] complex, were successfully used in time-gated images of arteries yielding results comparable with the magnetic resonance imaging (MRI) using similar GdIII complexes [109].
Systems capable of executing multiple functions, also called multimodal systems, are desirable due to the possibility of obtaining more information using a single system [113,114,115]. For example, NPs functionalized with the [Eu(aa)2(dta)(phen)] complex can be used not only in luminescence imaging but also in X-ray computed tomography imaging (CT) due to the high X-ray absorption cross-section of EuIII [116]. As discussed above, NPs and polymers functionalized with LnIII complexes are dynamic systems for application in luminescence imaging. However, the internalization of NPs in cells is difficult due to the size in the range from tenths to thousands of nanometers, resulting in undesired accumulation in the body, and limiting in vivo applications [91]. The use of molecular systems, namely LnIII complexes, provides the control of the spectroscopic properties at the molecular level, and tailoring of the ligand structure that adds sensing and therapy capabilities, for example.
4.2. Visible Emitting LnIII Complexes in Bioimaging
Control of the spectroscopic and chemical properties at the molecular level and the higher cell penetrability, due to the small size, of LnIII luminescent complexes, are advantages for use in luminescence imaging of biological systems. The formation of the LnIII complexes inside the cells is the most straightforward strategy used in luminescence imaging [117,118]. For example, treatment of Hepg2 cells with Eu(NO3)3 produced a luminescent EuIII complex that is not observed using the healthy L02 cell lines [117]. Although there is selectivity towards cancer cells, the identity of the ligands bonded to EuIII could not be figured out, and only a possible mechanism of formation involving NADPH was proposed. Attempts to get more information about the identity of the complexes formed in CHO cells treated with EuIII or TbIII acetate were made by Sørensen and co-workers, using a state-of-the-art confocal microscope [118]. The comparable intensities of the 5D0 → 7F1 and 5D0 → 7F2 transitions in the emission spectra suggested that the EuIII is in a high symmetry coordination environment [118]. The luminescence images also showed LnIII accumulation in the glycocalyx that points to bonding with specific components of it such as sugars [118].
Spontaneous internalization of LnIII complexes in cells is unpredictable, and effort has been made to determine the correlation structure-cell uptake [21,42,119,120,121,122,123,124,125,126,127]. The usual mechanism of cellular uptake of low molecular weight complexes is endocytosis [42]. In this mechanism, the complex interacts with the membrane forming vesicles that are responsible for the internalization of the LnIII complexes in the cell [42]. Thus, shape [119,120,121,122,123,124,125], chirality [128], and charge [21,42,127] are some of the factors that influence cell uptake. A thorough study conducted by Parker′s research group, using dota- and triazacyclonane-derivatized LnIII complexes, concluded that the mechanism of cell uptake involves recognition of the LnIII complex by proteins. Thus, the shape and the chirality of the complex are factors that determine cell uptake [119,120,121,122,123,124,125,128]. The charge also plays an essential factor in the cell uptake of LnIII complexes. Due to the strong negative charge of the cellular membrane, LnIII complexes with a positive overall charge are more likely to be internalized [21,42,127]. Although general guidelines for improving cell uptake are found, this process is sometimes unpredictable. Other studies found that change in the hydrophobicity or charge does not influence cell uptake [126]. In other cases, simple functionalization of the dipicolinato-based ligands with amino (-NH2) groups, yielded EuIII complexes that are selectively internalized by NG97 and PANC1 cells, capable of imaging, and show moderate cytotoxicity towards those kinds of cells (Figure 11) [31].
The bioconjugation of LnIII complexes with antibodies or proteins improves the cell uptake and allows targeting a specific kind of cell. The bioconjugation is achieved by reacting the amino (-NH2) or tiol (-SH) groups from a protein with isothiocyanato, chlorosulphonyl, 2,4-dichloro-1,3,5-triazinyl, or N-hydroxysuccinimide groups from the LnIII complex [77,111,119,129]. Although bioconjugation is an expensive method, it yields luminescent compounds that have a particular target cell [130].
Accumulation of LnIII luminescent compounds in a specific organelle helps to unravel the different cellular processes [131,132,133]. Recent examples show that LnIII complexes are found to accumulate in different regions of the cell, such as lysosome [134], nucleoli [135], cytosol [136], and primary cilium [137]. The ligand structure plays an essential role in directing the specific organelle that the LnIII complexes accumulate. For example, functionalization of the ligands with triphenylphosphonium, morpholine, or methyl phenyl sulfonamide yielded accumulation of LnIII luminescent complexes in the mitochondria, lysosomes, and endoplasmic reticulum, respectively [138,139,140]. Dopamine-functionalized complexes [Ln(dtpa-dopa)(H2O)] (Ln = EuIII or TbIII), were found to accumulate in the cytosol of HeLa and Neuro-2 cells, with low cytotoxicity [136] while the [Ln(tfnb)3(dpq)] (Ln = EuIII or TbIII) complexes containing planar aromatic ligands were found to accumulate in the nucleoli [135]. In this case, the strong interaction between [Ln(tfnb)3(dpq)] (Ln = EuIII or TbIII) complexes and DNA, and extensive photoinduced DNA damage (λexc = 364 nm) were used to kill H460 cells [135]. The examples mentioned above highlight the potential of molecular LnIII systems in luminescence imaging. Although successful, emission in the visible is scattered by cells and tissues; thus, luminescent LnIII complexes with emission in the biological window—a region where cells and tissues have low absorption—is needed (Figure 12).
4.3. NIR Emitting LnIII Complexes in Bioimaging
NIR emitting LnIII complexes are being recently applied in luminescence imaging due to its emission in the biological window. There are two significant challenges for developing NIR emitters for use in luminescence imaging, the first one is the low instrumental sensitivity in the NIR, and the second one is to overcome the high non-radiative rates caused by vibrational coupling with O-H vibrations, mentioned in Section 3.2, reflecting in low emission quantum yields, and low brightness compared with visible emitting LnIII [40,141].
[Nd(dtpa)] and [Nd(dota)] complexes were successfully used in in vivo NIR luminescence imaging [142,143]. Although successful, due to the absence of chromophore groups in the ligands′ structure, the excitation was centered at the 4f-4f transitions that required high excitation power and longer acquisition times. To overcome this limitation, YbIII complexes with porphyrin-based ligands and Kläui ligands (LK) have been used for in vitro and in vivo NIR luminescence imaging [16,17,25,144]. Porphyrin-based ligands have low energy singlet and triplet levels that are adequate to sensitize NIR emitting LnIII [145]. The functionalization of porphyrin ligands with a benzoic acid moiety yielded YbIII complexes ([Yb(LCOOH)(LK)]) that are capable of sensing pH in vitro and in vivo [17]. The decrease in the YbIII emission lifetime was observed in the range 5.0–9.0, and 5.0–1.0 due to photoinduced electron transfer (PET) and aggregation effects, respectively (Figure 13) [17]. The use of polymeric systems formed by 1,n–dihydroxyanthraquinone-functionalized polystyrene (PS) is also a strategy used for sensitizing the YbIII emission and imaging HeLa cells with low cytotoxicity [146]. The use of SmIII complexes is an alternative to the traditional YbIII and NdIII NIR emitters. Due to transitions in both the visible (4G5/2 → 6H7/2, ~600 nm) and NIR (4G5/2 → 6F5/2, ~950 nm) SmIII complexes are attractive for combined Vis and NIR luminescence imaging [147].
4.4. Two-Photon Excitation LnIII Complexes in Bioimaging
Shifting the excitation towards longer wavelengths is another strategy to minimize interference from the background emission. However, the shift towards longer wavelengths results in decrease of the triplet level energy and inefficient sensitization of visible emitting LnIII [148]. Two-photon absorption (2PA) [149,150,151,152,153,154] is a nonlinear process where two photons with half the energy required by the one-photon excitation (1PA) are absorbed simultaneously (Figure 14) [155,156]. As a result, the excitation wavelengths in the 2PA process are in the NIR and fall in the biological window.
Lakowicz and co-workers pioneered the sensitization of EuIII emission using 2PA [157,158]. Since then, examples of the application of EuIII [15,159,160,161,162], TbIII [33], DyIII [33], YbIII [32,163], and SmIII [15,163] complexes in 2P-luminescence imaging have been demonstrated. High 2P brightness (B(2)), one of the critical factors for obtaining good quality luminescence imaging, is achieved by the presence of charge transfer states (CT) [40,164,165], high complex rigidity [166], or use of plasmonic bands [167]. For example, 2P-sensitized emission, using λexc = 975 nm, of the [Eu(dbm)3(phen-NH2)] complex deposited onto a glass substrate is only observed when a layer of triangular silver nano prisms is present [167].
The use of excitation and emission in the NIR, also called NIR-to-NIR luminescence imaging, allows higher signal-to-noise ratio and luminescence imaging of deep tissues. Conventional confocal microscope setups do not allow measurement of emission in the 950–1050 nm range due to optical filtering schemes, and PMT detectors that are optimized for the visible range. By modifying the optical filtering schemes and connect an adequate NIR detector, Andraud and co-workers successfully obtained images using a combination of 2P-excitation and NIR emission (NIR-to-NIR luminescence imaging) [19]. Determination of the 3D blood capillary network in mouse brain using the NIR-emitting [Yb(tacnN(PEG)2)] complex validated the setup, and shortly after that, the first example of NIR-to-NIR luminescence imaging using the [Yb(dotaN(PEG)2)]+ complex was reported [32]. Due to the possibility of emitting in the visible and NIR, SmIII complexes have been explored for use in luminescence imaging. For example, 2P-luminescence imaging of T24 cells in the visible and NIR was possible using the [Sm(tacnMeO)] complex (Figure 15A,B) [163]. The NIR luminescence image quality obtained was similar to the analogous YbIII complex (Figure 15C,D) [163].
The addition of 1O2 generation [168,169], and DNA damage capabilities [159] to the LnIII complexes opens new ways for the use of those compounds as theranostics. For example, photoactivated DNA damage and 2P-luminescence imaging capabilities are possible using the heterobimetallic [Eu(dota-py)(H2O)RuCl(bpy)3]+ complex [159]. Upon illumination at 488 nm, there is the release of the [RuCl(bpy)3]+ complex increasing the EuIII emission intensity and also DNA damage (Figure 16) [159]. Thus, this a system that has light-activated cytotoxicity and is capable of tracking the delivery of the complex using 2P-luminescence imaging.
4.5. Molecular Upconversion Systems
Excitation of LnIII complexes at longer wavelengths is achieved through non-linear optical processes, such as two-photon absorption (2PA) (vide supra) or cumulative effects of multiple first-order absorption phenomena, namely upconversion (UC) [170,171]. The latter can be achieved through excited-state absorption (ESA) and energy transfer upconversion (ETU), Figure 17. In the UC process, a very long-lived intermediate state is present as opposed to the 2PA one, where a short-lived intermediate state is present. This results in a higher absorption cross-section in UC, making it possible to observe this process with inexpensive and low power continuous-wave lasers [172]. In the UC process through ESA, a sensitizer ion absorbs low-energy photons, followed by energy transfer to the activator ion, which then emits in a characteristic wavelength. YbIII/ErIII [173,174,175,176], YbIII/TmIII [113,114], and NdIII/YbIII/ErIII [177,178] are some of the most common sensitizer/activator systems. The challenge in developing molecular UC systems is to overcome the high non-radiative rates caused by vibrational coupling with O-H and C-H vibrations, inefficient 4f-4f excitation of the sensitizer ion, and long distances activator-sensitizer in LnIII complexes that lower the energy transfer rates [43].
The first attempt to achieve molecular UC reports back from 2005 when Faris and co-workers observed UC sensitized emission in the UV from [Nd(edta)2] and the blue and green from [Er(dpa)3]3−, and [Tm(dpa)3]3−. Although successful, a combination of two laser sources and high-power laser intensities (~100 kW focused on a 100 μm spot) was needed to observe the UC emission [179]. Although the intensity used was high for practical applications that encouraged researchers to design luminescent LnIII complexes with improved UC properties. MOFs have a very defined solid structure with the possibility to have two or more metallic centers close to each other. Because the energy transfer process is dependent on the distance donor-acceptor, in this case, sensitizer-activator, this proximity is beneficial for improving the UC sensitization process (ETU). Jin′s research group reported a series of LnIII MOFs with benzodicarboxylato (BDC) [180], pza [181], 4,4′-oxybis(benzoato) [182], in all the cases YIII was used as the matrix that was doped with YbIII and ErIII to achieve UC sensitized emission. One of the limitations of the MOFs cited above is the coordination of, at least, one solvent molecule to the LnIII, which increases the non-radiative rates and decreases the UC efficiency. Other LnIII MOFs showing UC sensitized emission are reported [183,184,185], and the same problem mentioned above was found, the solvent coordinated to the LnIII decreases the UC efficiency. Research in the development of UC sensitized emission in molecular LnIII complexes using reasonable laser intensities is a field in development. Piguet and co-workers reported the first molecular system to achieve UC sensitized emission using a very elegant trinuclear CrIIIErIIICrIII coordinated by a helicate ligand (LH1), in frozen solution at ~30 K, Figure 18a [186]. In this system, low-intensity UC sensitized emission is achieved by CrIII absorption at 750 nm (4A2 → 2T1), ETU CrIII → ErIII followed by the characteristic 4f-4f ErIII centered emission in the green (4S3/2 → 4I15/2), Figure 18b [186]. In a follow-up article, the ETU mechanism was further discussed in detail, and further experimental proof of the energy pathways was provided [187]. UC sensitized emission was also demonstrated in a binuclear CrIIErIII complex [188]. In order to avoid quenching by cross-relaxation, dilution of the [CrErCr(LH1)]9+ complex in a matrix of [GaYGa(LH1)]9+ (ratio 1:9) improved the UC emission intensity [189].
In a quest to miniaturize the UC systems, Piguet and co-workers designed ErIII complexes with ligands that are capable of shielding ErIII from non-radiative processes due to coupling with high energy oscillators resulting in emission at room temperature in the solid-state [190]. UC sensitized emission in solution is challenging due to the efficient vibrational coupling with high energy oscillators (vide supra) and slow energy transfer rates between the LnIII caused by dilution of the complex, which is essential in the ETU process. UC sensitized emission in D2O, at room temperature, was first observed using the [Er(Luc)]+ [191]. In order to decrease the distance ErIII-ErIII, F-− ions were added to balance the charge and force the formation of a dimer. The characteristic ErIII UC emission in the green (2H11/2 → 4I15/2 and 4S3/2 → 4I15/2), and red (4F9/2 → 4I15/2) are observed, and the UC emission mechanism consists of GSA/ESA, where one ErIII center absorbs two-photons, and ETU, where there is energy transfer between two ErIII centers. Recently another example of UC sensitized emission in solution, at room temperature, was reported for a mononuclear ErIII complex [192]. Recently, UC sensitized emission of TbIII was demonstrated by Charbonnière and co-workers in D2O solution using a system YbIII/TbIII [193,194]. In those systems, a YbIII mononuclear complex is first generated using the ligands bipyPO3 [193] or tacnPO3 [194], followed by the addition of TbIII forming a supramolecular structure YbIIITbIIIYbIII. The formation of the supramolecular structure is possible due to the coordination of TbIII to the free P-O-− groups. The characteristic TbIII transitions (5D4 → 7FJ; J = 6–0) are observed (Figure 19a) and the proposed mechanism consists of cooperative upconversion (CU) where two YbIII centers populate the 5D4 excited level of TbIII (Figure 19b) [194].
The low molar extinction coefficient of the 4f-4f transitions and the non-radiative rates due to the presence of C-H bonds in the structure of the ligands are factors that limit the UC process and decrease the UC emission intensity, respectively. The antenna effect (vide supra) is well known and uses chromophores with a high molar extinction coefficient to improve the LnIII emission intensity. This approach was used to boost the UC emission intensity of the NaYF4: 20%YbIII, 2%ErIII@NaYF4: 20%NdIII NP by decorating the surface with the chromophore F-SG [2]. The only example of this strategy for improving the UC emission intensity of molecular systems was reported by Hyppänen and co-workers [195]. The system proposed was straightforward, the anionic [Er(tta)4]-− complex and the IR-806 dye as the counter ion. Although a faint emission in the green was observed, upon excitation at 808 nm, the UC emission is mixed up into broad bands that might be residual ligand emission from the IR-806 dye or even from the tta ligands. Although the detailed UC mechanism was not proved experimentally, the authors proposed that the IR-806 absorbs the excitation, and transfers it to the ErIII excited levels. The field of molecular LnIII UC systems is still in the initial development phase, and the possibility to use low power lasers in the biological window to obtain emission in the visible is exciting.
4.6. Sensing of Chemical Species inside Biological Systems Using Visible Emitting LnIII
Multimodal systems capable of luminescing and sensing of biologically relevant species are attractive due to the possibility of unraveling cellular processes and track abnormalities in the cell that are indicative of diseases [196,197,198,199]. Due to the possibility of controlling the chemical and spectroscopic properties by tailoring the ligand structure, LnIII luminescent complexes are capable of sensing different chemical species [200,201,202,203,204,205,206,207]. The sensing process in those systems is based on the energy transfer chromophore → LnIII that changes as a function of a chemical species. Using this approach, the emission intensity changes by the LnIII, is correlated with the concentration of a particular chemical species. Vitamin C [208], CuII [209,210,211], sulfide [209,210,211], carbon monoxide [138], biothiols [35], ZnII [36], peroxynitrite [37], singlet oxygen [212,213,214], hypochlorous acid [139,215,216,217], superoxide anions [140], and ATP [218] are some of the compounds that can be sensed by LnIII luminescent complexes.
Ascorbic acid (or vitamin C) is essential for healthy cell development, calcium absorption, and synthesis of collagen [219,220,221]. TEMPO-functionalized ligands were used to synthesize the complex [Eu(tob)]−, and sensing vitamin C in solution, in Hepg2 cells, and in Daphnia magna using time-gated luminescence (Figure 20) [208]. The presence of the TEMPO moiety quenches the EuIII luminescence through the PET mechanism. In the presence of vitamin C, the TEMPO radical is quenched, resulting in the quench of the PET that reflects in the EuIII emission intensity increase [208].
Reactive oxygen species (ROS), are oxygenated compounds having unpaired electrons. ROS are generated during cellular processes, or by the interaction of the ligand excited state and the molecular oxygen [222,223,224,225]. For example, hypochlorous acid (HClO), a ROS produced by living cells, plays an essential role in immune systems. Accumulation of HClO triggers cell death and is associated with cardiovascular diseases, neurodegenerative disorders, and certain cancers [226,227,228,229,230,231]. Sensing of intracellular HClO using EuIII complexes is achieved using ligands that are capable of reacting with HClO, and as a response, there is an increase or decrease in the emission intensity due to the changes in the energy transfer rates [139,215]. The sensing of HOCl inside RAW264.7 cells and Daphnia magna microorganisms using luminescence imaging was possible using the [Eu(npptta)]-− complex that has a terpyridine-based ligand modified with a dinitrophenyl moiety [215]. In this system, there is quenching by PET due to the nitrophenyl moiety; in the presence of HOCl, the C=N bond is broken, resulting in an increase in the emission intensity due to the absence of PET. Singlet oxygen (1O2), another ROS, is produced by the interaction of triplet levels of the ligand with molecular oxygen, and is used in photodynamic therapy (PDT) [232,233,234,235]. The [Eu(pfdap)(tpy)] complex containing β-diketonate ligands functionalized with anthracene moieties was shown to be capable of sensing 1O2 inside Hepg2 cells using luminescence imaging (Figure 21) [212]. The EuIII emission intensity increases as a function of the 1O2 concentration in the range between 5.0–1800 μM, and is specific to 1O2. The formation of the endoperoxide changes the energy transfer rate ligand → EuIII making it possible to sense 1O2. Although not fully explained in the original research, it is possible that the triplet energy level of the pfdap ligand has similar or lower energy level than the excited EuIII 5D0 electronic level, reflecting in inefficient EuIII sensitization. In the presence of 1O2, the formation of the endoperoxide decreases the electronic conjugation of the ligand. That reflects in an increase of the pfdap ligand triplet energy and, thus, a better sensitization of the EuIII emission. In a follow-up study, the same research group used the [Eu(pfdap)3(dpbt)] complex that has excitation band red-shifted to 450 nm, a region that is more suitable for luminescence imaging [214]. The [Eu(pfdap)3(dpbt)] complex is capable of sensing 1O2 in MCF-7 cells, and in small microorganisms such as Daphnia magna.
CuII plays a central role in enzyme-catalyzed and redox reactions. High cellular levels of CuII are related to lethargy, increased blood pressure, liver damage, and neurodegenerative diseases [236,237]. Coordination of CuII using the dipicoylamine moiety in the ligand structure of the [Eu(bhhct-bped)] complex results in quenching of the EuIII emission intensity, and allows sensing of CuII in Hepg2 cells [210]. This probe can be restored by “washing out” CuII using sulfide ions (S2-). An improvement of this probe was reported using a heterobimetallic EuIII/TbIII complex containing a terpyridine-derivatized ligand (datp) that uses the intensity ratio between the 5D0 → 7F2 (EuIII) and 5D4 → 7F5 (TbIII) transitions for sensing [211]. Thus, the response of the probe does not change as a function of the instrumental response, setup, or concentration of the complex. ZnII is involved in several extra- and intracellular processes; thus, its detection is relevant to unravel cellular processes [238,239,240]. Grafting chromophores and the [Nd(dota)] complex on zinc fingers yielded systems that are capable of sensing ZnII [36]. In this exquisite system chromophore-zinc finger-[Nd(dota)], the distance chromophore → NdIII changes as a result of the structural changes in the zinc finger structure caused by the presence of ZnII.
Adenosine triphosphate (ATP) serves as the chemical energy source for biological processes, including muscle contraction and maintenance of neuronal membrane potential [241]. The release of ATP to the extracellular space has been identified in both damaged and apoptotic cells [242,243]. Due to the strong interaction between the ATP phosphate groups and the EuIII, it is possible to sense in real-time changes in the intracellular concentration of ATP using the [Eu(dota3)(H2O)]+ complex inside NIH-3T3 [218]. The ATP molecules replace the coordinated solvent molecules reflecting in an increase of the EuIII emission intensity that is a function of the ATP concentration.
5. Closing Remarks and Perspectives
The recent literature on LnIII luminescent complexes shows a wide variety of possible applications in the fields of luminescence imaging and sensing of chemical species to aid in the understanding of biological processes or the diagnosis of diseases. The possibility to tailor the ligands’ structure to tune their chemical, spectroscopic properties, and develop multi-modal systems makes LnIII luminescent complexes particularly attractive. Due to its high emission intensities, high emission quantum yields, and long luminescence lifetimes, EuIII is the most used lanthanide in the synthesis of complexes for luminescence imaging, however, there is a high demand for the development of luminescent complexes that can be used in NIR-to-NIR imaging due to the high penetrability and low scattering of this light. Overcoming the high non-radiative rates, characteristic of NIR emitters, is still the big challenge for developing this field.
The field of molecular upconversion (UC) is expected to have fast development in the coming years. UC excitation is a cumulative effect of multiple first-order absorption phenomena where there is excited-state absorption (ESA) and energy transfer upconversion (ETU). In the UC process, a very long-lived intermediate state is present as opposed to the 2PA one, where a short-lived intermediate state is present. This results in a higher absorption cross-section in UC, making it possible to observe this process with inexpensive and low power continuous-wave lasers. The pair YbIII/ErIII is the most used system in UC due to the energy match that allows efficient ETU, the possibility of using NIR excitation, and emission in the blue, green, and red regions of the electromagnetic spectrum. To the date, only a few examples of molecular UC LnIII complexes [189,190,191,192,193,194,195,244].
Funding
Humboldt State University is gratefully acknowledged for financial support (start-up grant K1037).
Conflicts of Interest
The author declares no conflict of interest.
References
- Liu, L.; Zhang, H.; Song, D.; Wang, Z. An upconversion nanoparticle-based fluorescence resonance energy transfer system for effectively sensing caspase-3 activity. Analyst 2018, 143, 761–767. [Google Scholar] [CrossRef] [PubMed]
- Liang, T.; Li, Z.; Wang, P.; Zhao, F.; Liu, J.; Liu, Z. Breaking Through the Signal-to-Background Limit of Upconversion Nanoprobes Using a Target-Modulated Sensitizing Switch. J. Am. Chem. Soc. 2018, 140, 14696–14703. [Google Scholar] [CrossRef]
- Hao, C.; Wu, X.; Sun, M.; Zhang, H.; Yuan, A.; Xu, L.; Xu, C.; Kuang, H. Chiral Core-Shell Upconversion Nanoparticle@MOF Nanoassemblies for Quantification and Bioimaging of Reactive Oxygen Species in Vivo. J. Am. Chem. Soc. 2019, 141, 19373–19378. [Google Scholar] [CrossRef] [PubMed]
- Wang, H.; Zhao, W.; Liu, X.; Wang, S.; Wang, Y. BODIPY-Based Fluorescent Surfactant for Cell Membrane Imaging and Photodynamic Therapy. ACS Appl. Bio Mater. 2020, 3, 593–601. [Google Scholar] [CrossRef] [Green Version]
- Chen, C.; Tian, R.; Zeng, Y.; Chu, C.; Liu, G. Activatable Fluorescence Probes for “Turn-On” and Ratiometric Biosensing and Bioimaging: From NIR-I to NIR-II. Bioconjugate Chem. 2020, 31, 276–292. [Google Scholar] [CrossRef] [Green Version]
- Zhou, J.; Liu, Z.; Li, F. Upconversion nanophosphors for small-animal imaging. Chem. Soc. Rev. 2012, 41, 1323–1349. [Google Scholar] [CrossRef]
- Lo, K.K.-W. Molecular Design of Bioorthogonal Probes and Imaging Reagents Derived from Photofunctional Transition Metal Complexes. Acc. Chem. Res. 2020, 53, 32–44. [Google Scholar] [CrossRef]
- Lin, S.; Pan, H.; Li, L.; Liao, R.; Yu, S.; Zhao, Q.; Sun, H.; Huang, W. AIPE-active platinum(II) complexes with tunable photophysical properties and their application in constructing thermosensitive probes used for intracellular temperature imaging. J. Mater. Chem. C 2019, 7, 7893–7899. [Google Scholar] [CrossRef]
- Lei, Z.; Sun, C.; Pei, P.; Wang, S.; Li, D.; Zhang, X.; Zhang, F. Stable, Wavelength-Tunable Fluorescent Dyes in the NIR-II Region for In Vivo High-Contrast Bioimaging and Multiplexed Biosensing. Angew. Chem. Int. Ed. 2019, 58, 8166–8171. [Google Scholar] [CrossRef]
- Li, B.; Lu, L.; Zhao, M.; Lei, Z.; Zhang, F. An Efficient 1064 nm NIR-II Excitation Fluorescent Molecular Dye for Deep-Tissue High-Resolution Dynamic Bioimaging. Angew. Chem. Int. Ed. 2018, 57, 7483–7487. [Google Scholar] [CrossRef]
- Yao, Y.; Hou, C.-L.; Yang, Z.-S.; Ran, G.; Kang, L.; Li, C.; Zhang, W.; Zhang, J.; Zhang, J.-L. Unusual near infrared (NIR) fluorescent palladium(II) macrocyclic complexes containing M-C bonds with bioimaging capability. Chem. Sci. 2019, 10, 10170–10178. [Google Scholar] [CrossRef]
- Li, X.; Baryshnikov, G.; Ding, L.; Bao, X.; Li, X.; Lu, J.; Liu, M.; Shen, S.; Luo, M.; Zhang, M.; et al. Dual-Phase Thermally Activated Delayed Fluorescence Luminogens: A Material for Time-Resolved Imaging Independent of Probe Pretreatment and Probe Concentration. Angew. Chem. Int. Ed. 2020. [Google Scholar]
- Day, A.H.; Übler, M.H.; Best, H.L.; Lloyd-Evans, E.; Mart, R.J.; Fallis, I.A.; Allemann, R.K.; Al-Wattar, E.A.H.; Keymer, N.I.; Buurma, N.J.; et al. Targeted cell imaging properties of a deep red luminescent iridium(III) complex conjugated with a c-Myc signal peptide. Chem. Sci. 2020, 11, 1599–1606. [Google Scholar] [CrossRef] [Green Version]
- Dai, Z.; Tian, L.; Song, B.; Liu, X.; Yuan, J. Development of a novel lysosome-targetable time-gated luminescence probe for ratiometric and luminescence lifetime detection of nitric oxide in vivo. Chem. Sci. 2017, 8, 1969–1976. [Google Scholar] [CrossRef] [Green Version]
- Hamon, N.; Galland, M.; Le Fur, M.; Roux, A.; Duperray, A.; Grichine, A.; Andraud, C.; Le Guennic, B.; Beyler, M.; Maury, O.; et al. Combining a pyclen framework with conjugated antenna for the design of europium and samarium luminescent bioprobes. Chem. Commun. 2018, 54, 6173–6176. [Google Scholar] [CrossRef]
- Ning, Y.; Tang, J.; Liu, Y.-W.; Jing, J.; Sun, Y.; Zhang, J.-L. Highly luminescent, biocompatible ytterbium(III) complexes as near-infrared fluorophores for living cell imaging. Chem. Sci. 2018, 9, 3742–3753. [Google Scholar] [CrossRef] [Green Version]
- Ning, Y.; Cheng, S.; Wang, J.-X.; Liu, Y.-W.; Feng, W.; Li, F.; Zhang, J.-L. Fluorescence lifetime imaging of upper gastrointestinal pH in vivo with a lanthanide based near-infrared τ probe. Chem. Sci. 2019, 10, 4227–4235. [Google Scholar] [CrossRef] [Green Version]
- Picot, A.; D’Aleo, A.; Baldeck, P.L.; Grichine, A.; Duperray, A.; Andraud, C.; Maury, O. Long-lived two-photon excited luminescence of water-soluble europium complex: Applications in biological imaging using two-photon scanning microscopy. J. Am. Chem. Soc. 2008, 130, 1532–1533. [Google Scholar] [CrossRef] [Green Version]
- D’Aleo, A.; Bourdolle, A.; Brustlein, S.; Fauquier, T.; Grichine, A.; Duperray, A.; Baldeck, P.L.; Andraud, C.; Brasselet, S.; Maury, O. Ytterbium-based bioprobes for near-infrared two-photon scanning laser microscopy imaging. Angew. Chem. Int. Ed. 2012, 51, 6622–6625. [Google Scholar] [CrossRef] [Green Version]
- Fernandez-Moreira, V.; Song, B.; Sivagnanam, V.; Chauvin, A.S.; Vandevyver, C.D.; Gijs, M.; Hemmila, I.; Lehr, H.A.; Bünzli, J.-C.G. Bioconjugated lanthanide luminescent helicates as multilabels for lab-on-a-chip detection of cancer biomarkers. Analyst 2010, 135, 42–52. [Google Scholar] [CrossRef]
- Deiters, E.; Song, B.; Chauvin, A.S.; Vandevyver, C.D.; Gumy, F.; Bünzli, J.-C.G. Luminescent bimetallic lanthanide bioprobes for cellular imaging with excitation in the visible-light range. Chem.-Eur. J. 2009, 15, 885–900. [Google Scholar] [CrossRef]
- Law, G.L.; Pal, R.; Palsson, L.O.; Parker, D.; Wong, K.L. Responsive and reactive terbium complexes with an azaxanthone sensitiser and one naphthyl group: Applications in ratiometric oxygen sensing in vitro and in regioselective cell killing. Chem. Commun. 2009, 7321–7323. [Google Scholar] [CrossRef]
- McMahon, B.K.; Pal, R.; Parker, D. A bright and responsive europium probe for determination of pH change within the endoplasmic reticulum of living cells. Chem. Commun. 2013, 49, 5363–5365. [Google Scholar] [CrossRef]
- Ning, Y.; Zhu, M.; Zhang, J.-L. Near-infrared (NIR) lanthanide molecular probes for bioimaging and biosensing. Coord. Chem. Rev. 2019, 399, 213028. [Google Scholar] [CrossRef]
- Ning, Y.; Chen, S.; Chen, H.; Wang, J.-X.; He, S.; Liu, Y.-W.; Cheng, Z.; Zhang, J.-L. A proof-of-concept application of water-soluble ytterbium(III) molecular probes in in vivo NIR-II whole body bioimaging. Inorg. Chem. Front. 2019, 6, 1962–1967. [Google Scholar] [CrossRef]
- Rajendran, M.; Yapici, E.; Miller, L.W. Lanthanide-based imaging of protein-protein interactions in live cells. Inorg. Chem. 2014, 53, 1839–1853. [Google Scholar] [CrossRef] [Green Version]
- Bünzli, J.-C.G.; Eliseeva, S.V. Basics of lanthanide Photophysics. In Lanthanide Luminescence: Photophysical, Analytical and Biological Aspects; Hänninen, P., Härmä, H., Eds.; Springer: Berlin, Germany, 2011; pp. 1–46. [Google Scholar]
- Bünzli, J.-C.G. On the design of highly luminescent lanthanide complexes. Coord. Chem. Rev. 2015, 293, 19–47. [Google Scholar] [CrossRef]
- Soini, E.; Hemmila, I. Fluoroimmunoassay: Present status and key problems. Clin. Chem. 1979, 25, 353–361. [Google Scholar] [CrossRef]
- Chauvin, A.S.; Comby, S.; Song, B.; Vandevyver, C.D.; Bünzli, J.-C.G. A versatile ditopic ligand system for sensitizing the luminescence of bimetallic lanthanide bio-imaging probes. Chem.-Eur. J. 2008, 14, 1726–1739. [Google Scholar] [CrossRef]
- Monteiro, J.; Machado, D.; de Hollanda, L.M.; Lancellotti, M.; Sigoli, F.A.; de Bettencourt-Dias, A. Selective cytotoxicity and luminescence imaging of cancer cells with a dipicolinato-based EuIII complex. Chem. Commun. 2017, 53, 11818–11821. [Google Scholar] [CrossRef]
- Bui, A.T.; Beyler, M.; Grichine, A.; Duperray, A.; Mulatier, J.-C.; Guyot, Y.; Andraud, C.; Tripier, R.; Brasselet, S.; Maury, O. Near infrared two photon imaging using a bright cationic Yb(III) bioprobe spontaneously internalized into live cells. Chem. Commun. 2017, 53, 6005–6008. [Google Scholar] [CrossRef] [PubMed]
- Bui, A.T.; Roux, A.; Grichine, A.; Duperray, A.; Andraud, C.; Maury, O. Twisted Charge-Transfer Antennae for Ultra-Bright Terbium(III) and Dysprosium(III) Bioprobes. Chem. Eur. J. 2018, 24, 3408–3412. [Google Scholar] [CrossRef]
- Hemmer, E.; Venkatachalam, N.; Hyodo, H.; Hattori, A.; Ebina, Y.; Kishimoto, H.; Soga, K. Upconverting and NIR emitting rare earth based nanostructures for NIR-bioimaging. Nanoscale 2013, 5, 11339–11361. [Google Scholar] [CrossRef] [PubMed]
- Liu, X.; Song, B.; Ma, H.; Tang, Z.; Yuan, J. Development of a mitochondria targetable ratiometric time-gated luminescence probe for biothiols based on lanthanide complexes. J. Mater. Chem. B 2018, 6, 1844–1851. [Google Scholar] [CrossRef] [PubMed]
- Isaac, M.; Raibaut, L.; Cepeda, C.; Roux, A.; Boturyn, D.; Eliseeva, S.V.; Petoud, S.; Seneque, O. Luminescent Zinc Fingers: Zn-Responsive Neodymium Near-Infrared Emission in Water. Chem.-Eur. J. 2017, 23, 10992–10996. [Google Scholar] [CrossRef]
- Wu, J.; Yang, Y.; Zhang, L.; Wang, H.; Yang, M.; Yuan, J. A visible-light-excited Eu3+ complex-based luminescent probe for highly sensitive time-gated luminescence imaging detection of intracellular peroxynitrite. J. Mater. Chem. B 2017, 5, 2322–2329. [Google Scholar] [CrossRef]
- Zhang, J.-X.; Chan, W.-L.; Xie, C.; Zhou, Y.; Chau, H.-F.; Maity, P.; Harrison, G.T.; Amassian, A.; Mohammed, O.F.; Tanner, P.A.; et al. Impressive near-infrared brightness and singlet oxygen generation from strategic lanthanide-porphyrin double-decker complexes in aqueous solution. Light Sci. Appl. 2019, 8, 46. [Google Scholar] [CrossRef] [Green Version]
- Jiang, Z.W.; Zou, Y.C.; Zhao, T.T.; Zhen, S.J.; Li, Y.F.; Huang, C.Z. Controllable Synthesis of Porphyrin-Based 2D Lanthanide Metal-Organic Frameworks with Thickness- and Metal-Node-Dependent Photocatalytic Performance. Angew. Chem. Int. Ed. 2020, 59, 3300–3306. [Google Scholar] [CrossRef]
- Monteiro, J.H.S.K.; Fetto, N.R.; Tucker, M.J.; de Bettencourt-Dias, A. Luminescent Carbazole-Based EuIII and YbIII Complexes with a High Two-Photon Absorption Cross-Section Enable Viscosity Sensing in the Visible and Near IR with One- and Two-Photon Excitation. Inorg. Chem. 2020, 59, 3193–3199. [Google Scholar] [CrossRef]
- Bünzli, J.-C.G. Chapter 287–Lanthanide Luminescence: From a Mystery to Rationalization, Understanding, and Applications. In Handbook on the Physics and Chemistry of Rare Earths; Bünzli, J.-C.G., Pecharsky, V.K., Eds.; Elsevier: Amsterdam, The Netherlands, 2016; Volume 50, pp. 141–176. [Google Scholar]
- New, E.J.; Parker, D.; Smith, D.G.; Walton, J.W. Development of responsive lanthanide probes for cellular applications. Curr. Opin. Chem. Biol. 2010, 14, 238–246. [Google Scholar] [CrossRef]
- Nonat, A.M.; Charbonnière, L.J. Upconversion of light with molecular and supramolecular lanthanide complexes. Coord. Chem. Rev. 2020, 409, 213192. [Google Scholar] [CrossRef]
- Ferreira da Rosa, P.P.; Kitagawa, Y.; Hasegawa, Y. Luminescent lanthanide complex with seven-coordination geometry. Coord. Chem. Rev. 2020, 406, 213153. [Google Scholar] [CrossRef]
- Sy, M.; Nonat, A.; Hildebrandt, N.; Charbonnière, L.J. Lanthanide-based luminescence biolabelling. Chem. Commun. 2016, 52, 5080–5095. [Google Scholar] [CrossRef] [PubMed]
- Li, H.; Wang, X.; Huang, D.; Chen, G. Recent advances of lanthanide-doped upconversion nanoparticles for biological applications. Nanotechnology 2019, 31, 072001. [Google Scholar] [CrossRef] [PubMed]
- Sun, L.-D.; Wang, Y.-F.; Yan, C.-H. Paradigms and Challenges for Bioapplication of Rare Earth Upconversion Luminescent Nanoparticles: Small Size and Tunable Emission/Excitation Spectra. Acc. Chem. Res. 2014, 47, 1001–1009. [Google Scholar] [CrossRef]
- Zhou, B.; Shi, B.; Jin, D.; Liu, X. Controlling upconversion nanocrystals for emerging applications. Nat. Nanotechnol. 2015, 10, 924–936. [Google Scholar] [CrossRef]
- Dong, H.; Sun, L.-D.; Yan, C.-H. Energy transfer in lanthanide upconversion studies for extended optical applications. Chem. Soc. Rev. 2015, 44, 1608–1634. [Google Scholar] [CrossRef]
- Cole, R. Live-cell imaging The cell′s perspective. Cell Adhes. Migr. 2014, 8, 452–459. [Google Scholar] [CrossRef] [Green Version]
- Cole, R.W.; Turner, J.N. Light-emitting diodes are better illumination sources for biological microscopy than conventional sources. Microsc. Microanal. 2008, 14, 243–250. [Google Scholar] [CrossRef]
- Nwaneshiudu, A.; Kuschal, C.; Sakamoto, F.H.; Anderson, R.R.; Schwarzenberger, K.; Young, R.C. Introduction to Confocal Microscopy. J. Investig. Dermatol. 2012, 132, 1–5. [Google Scholar] [CrossRef] [Green Version]
- Földes-Papp, Z.; Demel, U.; Tilz, G.P. Laser scanning confocal fluorescence microscopy: An overview. Int. Immunopharmacol. 2003, 3, 1715–1729. [Google Scholar] [CrossRef]
- Bayguinov, P.O.; Oakley, D.M.; Shih, C.-C.; Geanon, D.J.; Joens, M.S.; Fitzpatrick, J.A.J. Modern Laser Scanning Confocal Microscopy. Curr. Protoc. Cytom. 2018, 85, e39. [Google Scholar] [CrossRef] [PubMed]
- Jonkman, J.; Brown, C.M.; Cole, R.W. Quantitative confocal microscopy: Beyond a pretty picture. Quant. Imaging Cell Biol. 2014, 123, 113–134. [Google Scholar] [CrossRef]
- Verhoeven, J.W. Glossary of terms used in photochemistry. Pure Appl. Chem. 1996, 68, 2223–2286. [Google Scholar] [CrossRef]
- Monteiro, J.H.S.K.; de Bettencourt-Dias, A. Lanthanide ion emission in multicolor OLEDs (Ce3+, Pr3+, Tb3+, Dy3+, Tm3+, and white light Eu3+/Tb3+ hybrid systems) and device characterization. In Lanthanide-Based Multifunctional Materials; Pablo, M.-R., Silva, M.R., Eds.; Elsevier: Amsterdam, The Netherlands, 2018; pp. 99–131. [Google Scholar]
- Sastri, V.S.; Bünzli, J.C.; Perumareddi, J.R.; Rao, V.R.; Rayudu, G.V.S. Modern Aspects of Rare Earths and Their Complexes; Elsevier: Amsterdam, The Netherlands, 2003; pp. 569–731. [Google Scholar]
- Vleck, J.H.V. The Puzzle of Rare-earth Spectra in Solids. J. Phys. Chem. 1937, 41, 67–80. [Google Scholar] [CrossRef]
- Judd, B.R. Optical absorption intensities of rare-earth ions. Phys. Rev. 1962, 127, 750–761. [Google Scholar] [CrossRef]
- Ofelt, G.S. Intensities of crystal spectra of rare-earth ions. J. Chem. Phys. 1962, 37, 511–520. [Google Scholar] [CrossRef]
- Malta, O.L. A Simple Overlap Model in Lanthanide Crystal-Field Theory. Chem. Phys. Lett. 1982, 87, 27–29. [Google Scholar] [CrossRef]
- Solé, J.G.; Bausá, L.; Jaque, D. An Introduction to the Optical Spectroscopy of Inorganic Solids; John Wiley & Sons, Ltd.: Chichester, UK, 2005; pp. 235–262. [Google Scholar]
- Tanner, P.A. Lanthanide Luminescence in Solids. In Lanthanide Luminescence: Photophysical, Analytical and Biological Aspects; Hänninen, P., Härmä, H., Eds.; Springer: Berlin, Germany, 2011; pp. 183–233. [Google Scholar]
- de Bettencourt-Dias, A. Introduction to Lanthanide Ion Luminescence. In Luminescence of Lanthanide Ions in Coordination Compounds and Nanomaterials; John Wiley & Sons Ltd.: Chichester, UK, 2014; pp. 1–48. [Google Scholar]
- Latva, M.; Takalo, H.; Mukkala, V.M.; Matachescu, C.; RodriguezUbis, J.C.; Kankare, J. Correlation between the lowest triplet state energy level of the ligand and lanthanide(III) luminescence quantum yield. J. Lumin. 1997, 75, 149–169. [Google Scholar] [CrossRef]
- Monteiro, J.H.S.K.; de Bettencourt-Dias, A.; Sigoli, F.A. Estimating the Donor–Acceptor Distance To Tune the Emission Efficiency of Luminescent Lanthanide Compounds. Inorg. Chem. 2017, 56, 709–712. [Google Scholar] [CrossRef]
- Monteiro, J.H.S.K.; de Bettencourt-Dias, A.; Mazali, I.O.; Sigoli, F.A. The effect of 4-halogenobenzoate ligands on luminescent and structural properties of lanthanide complexes: Experimental and theoretical approaches. New J. Chem. 2015, 39, 1883–1891. [Google Scholar] [CrossRef] [Green Version]
- D’Aléo, A.; Pointillart, F.; Ouahab, L.; Andraud, C.; Maury, O. Charge transfer excited states sensitization of lanthanide emitting from the visible to the near-infra-red. Coord. Chem. Rev. 2012, 256, 1604–1620. [Google Scholar] [CrossRef]
- Aebischer, A.; Gumy, F.; Bünzli, J.-C.G. Intrinsic quantum yields and radiative lifetimes of lanthanide tris(dipicolinates). Phys. Chem. Chem. Phys. 2009, 11, 1346–1353. [Google Scholar] [CrossRef]
- Monteiro, J.H.S.K.; Formiga, A.L.B.; Sigoli, F.A. The influence of carboxilate, phosphinate and seleninate groups on luminescent properties of lanthanides complexes. J. Lumin. 2014, 154, 22–31. [Google Scholar] [CrossRef]
- Werts, M.H.V.; Jukes, R.T.F.; Verhoeven, J.W. The emission spectrum and the radiative lifetime of Eu3+ in luminescent lanthanide complexes. Phys. Chem. Chem. Phys. 2002, 4, 1542–1548. [Google Scholar] [CrossRef]
- Monteiro, J.H.; Mazali, I.O.; Sigoli, F.A. Determination of Judd-Ofelt intensity parameters of pure samarium(III) complexes. J. Fluoresc. 2011, 21, 2237–2243. [Google Scholar] [CrossRef]
- Brouwer, A.M. Standards for photoluminescence quantum yield measurements in solution (IUPAC Technical Report). Pure Appl. Chem. 2011, 83, 2213–2228. [Google Scholar] [CrossRef] [Green Version]
- Supkowski, R.M.; Horrocks, W.D. On the determination of the number of water molecules, q, coordinated to europium(III) ions in solution from luminescence decay lifetimes. Inorg. Chim. Acta 2002, 340, 44–48. [Google Scholar] [CrossRef]
- Beeby, A.; Clarkson, I.M.; Dickins, R.S.; Faulkner, S.; Parker, D.; Royle, L.; de Sousa, A.S.; Williams, J.A.G.; Woods, M. Non-radiative deactivation of the excited states of europium, terbium and ytterbium complexes by proximate energy-matched OH, NH and CH oscillators: An improved luminescence method for establishing solution hydration states. J. Chem. Soc. Perkin Trans. 2 1999, 493–503. [Google Scholar] [CrossRef]
- Bünzli, J.-C.G. Lanthanide luminescence for biomedical analyses and imaging. Chem. Rev. 2010, 110, 2729–2755. [Google Scholar] [CrossRef]
- Chauvin, A.S.; Gumy, F.; Imbert, D.; Bünzli, J.C.G. Europium and Terbiumtris(Dipicolinates) as Secondary Standards for Quantum Yield Determination. Spectrosc. Lett. 2004, 37, 517–532. [Google Scholar] [CrossRef]
- Andres, J.; Chauvin, A.-S. 6-Phosphoryl picolinic acids as europium and terbium sensitizers. Inorg. Chem. 2011, 50, 10082–10090. [Google Scholar] [CrossRef] [PubMed]
- Comby, S.; Imbert, D.; Vandevyver, C.; Bunzli, J.-C.G. A novel strategy for the design of 8-hydroxyquinolinate-based lanthanide bioprobes that emit in the near infrared range. Chem.-Eur. J. 2007, 13, 936–944. [Google Scholar] [CrossRef]
- WeSsling, P.; Trumm, M.; Macerata, E.; Ossola, A.; Mossini, E.; Gullo, M.C.; Arduini, A.; Casnati, A.; Mariani, M.; Adam, C.; et al. Activation of the Aromatic Core of 3,3′-(Pyridine-2,6-diylbis(1H-1,2,3-triazole-4,1-diyl))bis(propan-1-ol)-Effects on Extraction Performance, Stability Constants, and Basicity. Inorg. Chem. 2019, 58, 14642–14651. [Google Scholar] [CrossRef] [Green Version]
- Chen, B.; Liu, J.; Lv, L.; Yang, L.; Luo, S.; Yang, Y.; Peng, S. Complexation of Lanthanides with N, N, N′, N′-Tetramethylamide Derivatives of Bipyridinedicarboxylic Acid and Phenanthrolinedicarboxylic Acid: Thermodynamics and Coordination Modes. Inorg. Chem. 2019, 58, 7416–7425. [Google Scholar] [CrossRef]
- Borisova, N.E.; Ivanov, A.; Kharcheva, A.; Sumyanova, T.; Surkova, U.; Matveev, P.I.; Patsaeva, S.V. Effect of Heterocyclic Ring on LnIII Coordination, Luminescence and Extraction of Diamides of 2,2′-Bipyridyl-6,6′-Dicarboxylic Acid. Molecules 2019, 25, 62. [Google Scholar] [CrossRef] [Green Version]
- Le Fur, M.; Molnar, E.; Beyler, M.; Fougere, O.; Esteban-Gomez, D.; Rousseaux, O.; Tripier, R.; Tircso, G.; Platas-Iglesias, C. Expanding the Family of Pyclen-Based Ligands Bearing Pendant Picolinate Arms for Lanthanide Complexation. Inorg. Chem. 2018, 57, 6932–6945. [Google Scholar] [CrossRef]
- Negri, R.; Baranyai, Z.; Tei, L.; Giovenzana, G.B.; Platas-Iglesias, C.; Benyei, A.C.; Bodnar, J.; Vagner, A.; Botta, M. Lower denticity leading to higher stability: Structural and solution studies of Ln(III)-OBETA complexes. Inorg. Chem. 2014, 53, 12499–12511. [Google Scholar] [CrossRef]
- Leygue, N.; Galaup, C.; Lopera, A.; Delgado-Pinar, E.; Williams, R.M.; Gornitzka, H.; Zwier, J.M.; Garcia-Espana, E.; Lamarque, L.; Picard, C. Tripyridinophane Platform Containing Three Acetate Pendant Arms: An Attractive Structural Entry for the Development of Neutral Eu(III) and Tb(III) Complexes in Aqueous Solution. Inorg. Chem. 2020, 59, 1496–1512. [Google Scholar] [CrossRef]
- de Bettencourt-Dias, A.; Barber, P.S.; Viswanathan, S.; de Lill, D.T.; Rollett, A.; Ling, G.; Altun, S. Para-derivatized pybox ligands as sensitizers in highly luminescent Ln(III) complexes. Inorg. Chem. 2010, 49, 8848–8861. [Google Scholar] [CrossRef]
- Cacheris, W.P.; Nickle, S.K.; Sherry, A.D. Thermodynamic study of lanthanide complexes of 1,4,7-triazacyclononane-N,N′,N”-triacetic acid and 1,4,7,10-tetraazacyclododecane-N,N′,N”,N′′′-tetraacetic acid. Inorg. Chem. 1987, 26, 958–960. [Google Scholar] [CrossRef]
- Addisu, K.D.; Hsu, W.-H.; Hailemeskel, B.Z.; Andrgie, A.T.; Chou, H.-Y.; Yuh, C.-H.; Lai, J.-Y.; Tsai, H.-C. Mixed Lanthanide Oxide Nanoparticles Coated with Alginate-Polydopamine as Multifunctional Nanovehicles for Dual Modality: Targeted Imaging and Chemotherapy. ACS Biomater. Sci. Eng. 2019, 5, 5453–5469. [Google Scholar] [CrossRef]
- Hsu, C.-C.; Lin, S.-L.; Chang, C.A. Lanthanide-Doped Core-Shell-Shell Nanocomposite for Dual Photodynamic Therapy and Luminescence Imaging by a Single X-ray Excitation Source. ACS Appl. Mater. Interfaces 2018, 10, 7859–7870. [Google Scholar] [CrossRef]
- Li, D.; He, S.; Wu, Y.; Liu, J.; Liu, Q.; Chang, B.; Zhang, Q.; Xiang, Z.; Yuan, Y.; Jian, C.; et al. Excretable Lanthanide Nanoparticle for Biomedical Imaging and Surgical Navigation in the Second Near-Infrared Window. Adv. Sci. 2019, 6, 1902042. [Google Scholar] [CrossRef]
- Wang, Y.; Chang, H.; Jia, L.; Zhu, T.; Xu, Z.; Zhou, T.; Li, H.; Li, Z.; Xu, J. Development of a visible-light-sensitized THA-based lanthanide nanocomposite for cell imaging. Mater. Lett. 2015, 161, 644–647. [Google Scholar] [CrossRef]
- Pranjita, Z.; Fiona, F.; Sutapa Roy, R.; Meenal, K. Rare Earth Doped Hydroxyapatite Nanoparticles for In Vitro Bioimaging Applications. Curr. Phys. Chem. 2019, 9, 94–109. [Google Scholar]
- Machado, T.R.; Leite, I.S.; Inada, N.M.; Li, M.S.; da Silva, J.S.; Andrés, J.; Beltrán-Mir, H.; Cordoncillo, E.; Longo, E. Designing biocompatible and multicolor fluorescent hydroxyapatite nanoparticles for cell-imaging applications. Mater. Today Chem. 2019, 14, 100211. [Google Scholar] [CrossRef]
- Kataoka, T.; Abe, S.; Tagaya, M. Surface-Engineered Design of Efficient Luminescent Europium(III) Complex-Based Hydroxyapatite Nanocrystals for Rapid HeLa Cancer Cell Imaging. ACS Appl. Mater. Interfaces 2019, 11, 8915–8927. [Google Scholar] [CrossRef]
- Grechkin, Y.; Grechkina, S.; Zaripov, E.; Fedorenko, S.V.; Mustafina, A.; Berezovski, M.V. Aptamer-Conjugated Tb(III)-Doped Silica Nanoparticles for Luminescent Detection of Leukemia Cells. Biomedicines 2020, 8, 14. [Google Scholar] [CrossRef] [Green Version]
- Francis, B.; Neuhaus, B.; Reddy, M.L.P.; Epple, M.; Janiak, C. Amine-Functionalized Silica Nanoparticles Incorporating Covalently Linked Visible-Light-Excitable Eu3+ Complexes: Synthesis, Characterization, and Cell-Uptake Studies. Eur. J. Inorg. Chem. 2017, 2017, 3205–3213. [Google Scholar] [CrossRef]
- Musumeci, D.; Platella, C.; Riccardi, C.; Moccia, F.; Montesarchio, D. Fluorescence Sensing Using DNA Aptamers in Cancer Research and Clinical Diagnostics. Cancers 2017, 9, 174. [Google Scholar] [CrossRef] [Green Version]
- Wu, Y.; Shi, M.; Zhao, L.; Feng, W.; Li, F.; Huang, C. Visible-light-excited and europium-emissive nanoparticles for highly-luminescent bioimaging in vivo. Biomaterials 2014, 35, 5830–5839. [Google Scholar] [CrossRef]
- Cardoso Dos Santos, M.; Goetz, J.; Bartenlian, H.; Wong, K.L.; Charbonnière, L.J.; Hildebrandt, N. Autofluorescence-Free Live-Cell Imaging Using Terbium Nanoparticles. Bioconjugate Chem. 2018, 29, 1327–1334. [Google Scholar] [CrossRef]
- Al-Natour, M.A.; Yousif, M.D.; Cavanagh, R.; Abouselo, A.; Apebende, E.A.; Ghaemmaghami, A.; Kim, D.-H.; Aylott, J.W.; Taresco, V.; Chauhan, V.M.; et al. Facile Dye-Initiated Polymerization of Lactide–Glycolide Generates Highly Fluorescent Poly(lactic-co-glycolic Acid) for Enhanced Characterization of Cellular Delivery. ACS Macro Lett. 2020, 9, 431–437. [Google Scholar] [CrossRef]
- Alizadeh, T.; Sharifi, A.R.; Ganjali, M.R. A new bio-compatible Cd2+-selective nanostructured fluorescent imprinted polymer for cadmium ion sensing in aqueous media and its application in bio imaging in Vero cells. RSC Adv. 2020, 10, 4110–4117. [Google Scholar] [CrossRef] [Green Version]
- Zhu, M.-Q.; Zhu, L.; Han, J.J.; Wu, W.; Hurst, J.K.; Li, A.D.Q. Spiropyran-based photochromic polymer nanoparticles with optically switchable luminescence. J. Am. Chem. Soc. 2006, 128, 4303–4309. [Google Scholar] [CrossRef] [Green Version]
- Pu, K.; Shuhendler, A.J.; Jokerst, J.V.; Mei, J.; Gambhir, S.S.; Bao, Z.; Rao, J. Semiconducting polymer nanoparticles as photoacoustic molecular imaging probes in living mice. Nat. Nanotechnol. 2014, 9, 233–239. [Google Scholar] [CrossRef] [Green Version]
- Zhang, Y.; Fu, H.; Chen, S.; Liu, B.; Sun, W.; Gao, H. Construction of an iridium(III)-complex-loaded MOF nanoplatform mediated with a dual-responsive polycationic polymer for photodynamic therapy and cell imaging. Chem. Commun. 2020, 56, 762–765. [Google Scholar] [CrossRef]
- Kemal, E.; Peters, R.; Bourke, S.; Fairclough, S.; Bergstrom-Mann, P.; Owen, D.M.; Sandiford, L.; Dailey, L.A.; Green, M. Magnetic conjugated polymer nanoparticles doped with a europium complex for biomedical imaging. Photochem. Photobiol. S 2018, 17, 718–721. [Google Scholar] [CrossRef] [Green Version]
- Zhang, Y.; Zuo, Y.; Yang, T.; Gou, Z.; Lin, W. Polysiloxane-based hyperbranched fluorescent materials prepared by thiol-ene “click” chemistry as potential cellular imaging polymers. Eur. Polym. J. 2019, 112, 515–523. [Google Scholar] [CrossRef]
- Cui, J.; Zhang, G.; Xin, L.; Yun, P.; Yan, Y.; Su, F. Functional nanoscale metal–organic particles synthesized from a new vinylimidazole-based polymeric ligand and dysprosium ions. J. Mater. Chem. C 2018, 6, 280–289. [Google Scholar] [CrossRef]
- Nghia, N.T.; Tinet, E.; Ettori, D.; Beilvert, A.; Pavon-Djavid, G.; Maire, M.; Ou, P.; Tualle, J.-M.; Chaubet, F. Gadolinium/terbium hybrid macromolecular complexes for bimodal imaging of atherothrombosis. J. Biomed. Opt. 2017, 22, 076004. [Google Scholar]
- Xu, D.; Zhou, X.; Huang, Q.; Tian, J.; Huang, H.; Wan, Q.; Dai, Y.; Wen, Y.; Zhang, X.; Wei, Y. Facile fabrication of biodegradable lanthanide ions containing fluorescent polymeric nanoparticles: Characterization, optical properties and biological imaging. Mater. Chem. Phys. 2018, 207, 226–232. [Google Scholar] [CrossRef]
- Xu, D.; Liu, M.; Huang, Q.; Chen, J.; Huang, H.; Deng, F.; Wen, Y.; Tian, J.; Zhang, X.; Wei, Y. One-step synthesis of europium complexes containing polyamino acids through ring-opening polymerization and their potential for biological imaging applications. Talanta 2018, 188, 1–6. [Google Scholar] [CrossRef] [PubMed]
- Beilvert, A.; Vassy, R.; Canet-Soulas, E.; Rousseaux, O.; Picton, L.; Letourneur, D.; Chaubet, F. Synthesis and evaluation of a tri-tyrosine decorated dextran MR contrast agent for vulnerable plaque detection. Chem. Commun. 2011, 47, 5506–5508. [Google Scholar] [CrossRef]
- Zhang, R.; Liang, L.; Meng, Q.; Zhao, J.; Ta, H.T.; Li, L.; Zhang, Z.; Sultanbawa, Y.; Xu, Z.P. Responsive Upconversion Nanoprobe for Background-Free Hypochlorous Acid Detection and Bioimaging. Small 2019, 15, e1803712. [Google Scholar] [CrossRef]
- Song, X.; Zhang, J.; Yue, Z.; Wang, Z.; Liu, Z.; Zhang, S. Dual-Activator Codoped Upconversion Nanoprobe with Core-Multishell Structure for in Vitro and in Vivo Detection of Hydroxyl Radical. Anal. Chem. 2017, 89, 11021–11026. [Google Scholar] [CrossRef]
- Song, X.; Yue, Z.; Zhang, J.; Jiang, Y.; Wang, Z.; Zhang, S. Multicolor Upconversion Nanoprobes Based on a Dual Luminescence Resonance Energy Transfer Assay for Simultaneous Detection and Bioimaging of Ca2+i and pHi in Living Cells. Chem.-Eur. J. 2018, 24, 6458–6463. [Google Scholar] [CrossRef]
- Zou, Y.; Sun, F.; Liu, C.; Yu, C.; Zhang, M.; He, Q.; Xiong, Y.; Xu, Z.; Yang, S.; Liao, G. A novel nanotheranostic agent for dual-mode imaging-guided cancer therapy based on europium complexes-grafted-oxidative dopamine. Chem. Eng. J. 2019, 357, 237–247. [Google Scholar] [CrossRef]
- Ye, J.; Wang, J.; Li, Q.; Dong, X.; Ge, W.; Chen, Y.; Jiang, X.; Liu, H.; Jiang, H.; Wang, X. Rapid and accurate tumor-target bio-imaging through specific in vivo biosynthesis of a fluorescent europium complex. Biomater. Sci. 2016, 4, 652–660. [Google Scholar] [CrossRef]
- Arppe-Tabbara, R.; Carro-Temboury, M.R.; Hempel, C.; Vosch, T.; Sorensen, T.J. Luminescence from Lanthanide(III) Ions Bound to the Glycocalyx of Chinese Hamster Ovary Cells. Chem.-Eur. J. 2018, 24, 11885–11889. [Google Scholar] [CrossRef] [PubMed]
- Montgomery, C.P.; Murray, B.S.; New, E.J.; Pal, R.; Parker, D. Cell-penetrating metal complex optical probes: Targeted and responsive systems based on lanthanide luminescence. Acc. Chem. Res. 2009, 42, 925–937. [Google Scholar] [CrossRef] [PubMed]
- Poole, R.A.; Montgomery, C.P.; New, E.J.; Congreve, A.; Parker, D.; Bottab, M. Identification of emissive lanthanide complexes suitable for cellular imaging that resist quenching by endogenous anti-oxidants. Org. Biomol. Chem. 2007, 5, 2055–2062. [Google Scholar] [CrossRef] [PubMed]
- Pal, R.; Parker, D. A ratiometric optical imaging probe for intracellular pH based on modulation of europium emission. Org. Biomol. Chem. 2008, 6, 1020–1033. [Google Scholar] [CrossRef]
- Yu, J.; Parker, D.; Pal, R.; Poole, R.A.; Cann, M.J. A europium complex that selectively stains nucleoli of cells. J. Am. Chem. Soc. 2006, 128, 2294–2299. [Google Scholar] [CrossRef]
- Frias, J.C.; Bobba, G.; Cann, M.J.; Hutchison, C.J.; Parker, D. Luminescent nonacoordinate cationic lanthanide complexes as potential cellular imaging and reactive probes. Org. Biomol. Chem. 2003, 1, 905–907. [Google Scholar] [CrossRef]
- Beeby, A.; Botchway, S.W.; Clarkson, I.M.; Faulkner, S.; Parker, A.W.; Parker, D.; Williams, J.A.G. Luminescence imaging microscopy and lifetime mapping using kinetically stable lanthanide(III) complexes. J. Photochem. Photobiol. B 2000, 57, 83–89. [Google Scholar] [CrossRef]
- Walton, J.W.; Bourdolle, A.; Butler, S.J.; Soulie, M.; Delbianco, M.; McMahon, B.K.; Pal, R.; Puschmann, H.; Zwier, J.M.; Lamarque, L.; et al. Very bright europium complexes that stain cellular mitochondria. Chem. Commun. 2013, 49, 1600–1602. [Google Scholar] [CrossRef] [Green Version]
- Peterson, K.L.; Dang, J.V.; Weitz, E.A.; Lewandowski, C.; Pierre, V.C. Effect of Lanthanide Complex Structure on Cell Viability and Association. Inorg. Chem. 2014, 53, 6013–6021. [Google Scholar] [CrossRef] [Green Version]
- Butler, S.J.; McMahon, B.K.; Pal, R.; Parker, D.; Walton, J.W. Bright mono-aqua europium complexes based on triazacyclononane that bind anions reversibly and permeate cells efficiently. Chem.-Eur. J. 2013, 19, 9511–9517. [Google Scholar] [CrossRef]
- Frawley, A.T.; Linford, H.V.; Starck, M.; Pal, R.; Parker, D. Enantioselective cellular localisation of europium(III) coordination complexes. Chem. Sci. 2018, 9, 1042–1049. [Google Scholar] [CrossRef] [PubMed] [Green Version]
- Diamandis, E.P. Immunoassays with time-resolved fluorescence spectroscopy: Principles and applications. Clin. Biochem. 1988, 21, 139–150. [Google Scholar] [CrossRef]
- Sayyadi, N.; Connally, R.E.; Try, A. A novel biocompatible europium ligand for sensitive time-gated immunodetection. Chem. Commun. 2016, 52, 1154–1157. [Google Scholar] [CrossRef] [PubMed]
- Rabie, H.; Zhang, Y.; Pasquale, N.; Lagos, M.J.; Batson, P.E.; Lee, K.-B. NIR Biosensing of Neurotransmitters in Stem Cell-Derived Neural Interface Using Advanced Core-Shell Upconversion Nanoparticles. Adv. Mater. 2019, 31, e1806991. [Google Scholar] [CrossRef] [PubMed]
- Wang, Z.; Hu, M.; Ai, X.; Zhang, Z.; Xing, B. Near-Infrared Manipulation of Membrane Ion Channels via Upconversion Optogenetics. Adv. Biosyst. 2018, 3, 1800233. [Google Scholar] [CrossRef] [Green Version]
- Chen, Z.; Thiramanas, R.; Schwendy, M.; Xie, C.; Parekh, S.H.; Mailänder, V.; Wu, S. Upconversion Nanocarriers Encapsulated with Photoactivatable Ru Complexes for Near-Infrared Light-Regulated Enzyme Activity. Small 2017, 13, 1700997. [Google Scholar] [CrossRef] [PubMed]
- George, T.M.; Krishna, M.S.; Reddy, M.L.P. A lysosome targetable luminescent bioprobe based on a europium β-diketonate complex for cellular imaging applications. Dalton Trans. 2016, 45, 18719–18729. [Google Scholar] [CrossRef]
- Dasari, S.; Singh, S.; Sivakumar, S.; Patra, A.K. Dual-Sensitized Luminescent Europium(III) and Terbium(III) Complexes as Bioimaging and Light-Responsive Therapeutic Agents. Chem.-Eur. J. 2016, 22, 17387–17396. [Google Scholar] [CrossRef]
- Singh, K.; Goenka, A.; Ganesh, S.; Patra, A.K. Luminescent EuIII and TbIII Complexes Containing Dopamine Neurotransmitter: Biological Interactions, Antioxidant Activity and Cellular-Imaging Studies. Eur. J. Inorg. Chem. 2018, 2018, 3942–3951. [Google Scholar] [CrossRef]
- Li, H.; Lan, R.; Chan, C.-F.; Bao, G.; Xie, C.; Chu, P.-H.; Tai, W.C.S.; Zha, S.; Zhang, J.-X.; Wong, K.-L. A luminescent lanthanide approach towards direct visualization of primary cilia in living cells. Chem. Commun. 2017, 53, 7084–7087. [Google Scholar] [CrossRef]
- Tang, Z.; Song, B.; Ma, H.; Luo, T.; Guo, L.; Yuan, J. Mitochondria-Targetable Ratiometric Time-Gated Luminescence Probe for Carbon Monoxide Based on Lanthanide Complexes. Anal. Chem. 2019, 91, 2939–2946. [Google Scholar] [CrossRef] [PubMed]
- Ma, H.; Song, B.; Wang, Y.; Liu, C.; Wang, X.; Yuan, J. Development of organelle-targetable europium complex probes for time-gated luminescence imaging of hypochlorous acid in live cells and animals. Dyes Pigments 2017, 140, 407–416. [Google Scholar] [CrossRef]
- Tang, Z.; Song, B.; Zhang, W.; Guo, L.; Yuan, J. Precise Monitoring of Drug-Induced Kidney Injury Using an Endoplasmic Reticulum-Targetable Ratiometric Time-Gated Luminescence Probe for Superoxide Anions. Anal. Chem. 2019, 91, 14019–14028. [Google Scholar] [CrossRef] [PubMed]
- de Bettencourt-Dias, A.; Barber, P.S.; Bauer, S. A water-soluble Pybox derivative and its highly luminescent lanthanide ion complexes. J. Am. Chem. Soc. 2012, 134, 6987–6994. [Google Scholar] [CrossRef] [PubMed]
- Li, Y.; Li, X.; Xue, Z.; Jiang, M.; Zeng, S.; Hao, J. Second near-infrared emissive lanthanide complex for fast renal-clearable in vivo optical bioimaging and tiny tumor detection. Biomaterials 2018, 169, 35–44. [Google Scholar] [CrossRef]
- Yang, Y.; Wang, P.; Lu, L.; Fan, Y.; Sun, C.; Fan, L.; Xu, C.; El-Toni, A.M.; Alhoshan, M.; Zhang, F. Small-Molecule Lanthanide Complexes Probe for Second Near-Infrared Window Bioimaging. Anal. Chem. 2018, 90, 7946–7952. [Google Scholar] [CrossRef]
- Zhang, T.; Zhu, X.; Cheng, C.C.W.; Kwok, W.-M.; Tam, H.-L.; Hao, J.; Kwong, D.W.J.; Wong, W.-K.; Wong, K.-L. Water-Soluble Mitochondria-Specific Ytterbium Complex with Impressive NIR Emission. J. Am. Chem. Soc. 2011, 133, 20120–20122. [Google Scholar] [CrossRef]
- Ning, Y.; Ke, X.-S.; Hu, J.-Y.; Liu, Y.-W.; Ma, F.; Sun, H.-L.; Zhang, J.-L. Bioinspired Orientation of β-Substituents on Porphyrin Antenna Ligands Switches Ytterbium(III) NIR Emission with Thermosensitivity. Inorg. Chem. 2017, 56, 1897–1905. [Google Scholar] [CrossRef]
- Martinić, I.; Eliseeva, S.V.; Collet, G.; Luo, T.-Y.; Rosi, N.; Petoud, S. One Approach for Two: Toward the Creation of Near-Infrared Imaging Agents and Rapid Screening of Lanthanide(III) Ion Sensitizers Using Polystyrene Nanobeads. ACS Appl. Bio Mater. 2019, 2, 1667–1675. [Google Scholar] [CrossRef]
- Foucault-Collet, A.; Shade, C.M.; Nazarenko, I.; Petoud, S.; Eliseeva, S.V. Polynuclear Sm(III) polyamidoamine-based dendrimer: A single probe for combined visible and near-infrared live-cell imaging. Angew. Chem. Int. Ed. 2014, 53, 2927–2930. [Google Scholar] [CrossRef]
- Dansholm, C.N.; Junker, A.K.R.; Nielsen, L.G.; Kofod, N.; Pal, R.; Sorensen, T.J. pi-Expanded Thioxanthones–Engineering the Triplet Level of Thioxanthone Sensitizers for Lanthanide-Based Luminescent Probes with Visible Excitation. ChemPlusChem 2019, 84, 1778–1788. [Google Scholar] [CrossRef] [PubMed]
- Ren, T.; Xu, W.; Zhang, Q.; Zhang, X.; Wen, S.; Yi, H.; Yuan, L.; Zhang, X. Harvesting Hydrogen Bond Network: Enhance the Anti-Solvatochromic Two-Photon Fluorescence for Cirrhosis Imaging. Angew. Chem. Int. Ed. 2018, 57, 7473–7477. [Google Scholar] [CrossRef] [PubMed]
- Agrawalla, B.K.; Lee, H.W.; Phue, W.H.; Raju, A.; Kim, J.J.; Kim, H.M.; Kang, N.Y.; Chang, Y.T. Two-Photon Dye Cocktail for Dual-Color 3D Imaging of Pancreatic Beta and Alpha Cells in Live Islets. J. Am. Chem. Soc. 2017, 139, 3480–3487. [Google Scholar] [CrossRef] [PubMed]
- Denk, W.; Strickler, J.H.; Webb, W.W. 2-Photon Laser Scanning Fluorescence Microscopy. Science 1990, 248, 73–76. [Google Scholar] [CrossRef] [Green Version]
- Helmchen, F.; Denk, W. Deep tissue two-photon microscopy. Nature Methods 2005, 2, 932–940. [Google Scholar] [CrossRef]
- Liu, B.; Li, C.; Yang, P.; Hou, Z.; Lin, J. 808-nm-Light-Excited Lanthanide-Doped Nanoparticles: Rational Design, Luminescence Control and Theranostic Applications. Adv. Mater. 2017, 29, 1605434. [Google Scholar] [CrossRef]
- Nguyen, T.N.; Ebrahim, F.M.; Stylianou, K.C. Photoluminescent, upconversion luminescent and nonlinear optical metal-organic frameworks: From fundamental photophysics to potential applications. Coord. Chem. Rev. 2018, 377, 259–306. [Google Scholar] [CrossRef]
- Terenziani, F.; Katan, C.; Badaeva, E.; Tretiak, S.; Blanchard-Desce, M. Enhanced Two-Photon Absorption of Organic Chromophores: Theoretical and Experimental Assessments. Adv. Mater. 2008, 20, 4641–4678. [Google Scholar] [CrossRef] [Green Version]
- Andraud, C.; Maury, O. Lanthanide Complexes for Nonlinear Optics: From Fundamental Aspects to Applications. Eur. J. Inorg. Chem. 2009, 2009, 4357–4371. [Google Scholar] [CrossRef]
- Lakowicz, J.R.; Piszczek, G.; Maliwal, B.P.; Gryczynski, I. Multiphoton excitation of lanthanides. Chemphyschem 2001, 2, 247–252. [Google Scholar] [CrossRef]
- Piszczek, G.; Maliwal, B.P.; Gryczynski, I.; Dattelbaum, J.; Lakowicz, J.R. Multiphoton ligand-enhanced excitation of lanthanides. J. Fluoresc. 2001, 11, 101–107. [Google Scholar] [CrossRef] [PubMed]
- Li, H.; Xie, C.; Lan, R.; Zha, S.; Chan, C.-F.; Wong, W.-Y.; Ho, K.-L.; Chan, B.D.; Luo, Y.; Zhang, J.-X.; et al. A Smart Europium-Ruthenium Complex as Anticancer Prodrug: Controllable Drug Release and Real-Time Monitoring under Different Light Excitations. J. Med. Chem. 2017, 60, 8923–8932. [Google Scholar] [CrossRef]
- Sund, H.; Liao, Y.Y.; Andraud, C.; Duperray, A.; Grichine, A.; Le Guennic, B.; Riobé, F.; Takalo, H.; Maury, O. Polyanionic Polydentate Europium Complexes as Ultrabright One- or Two-photon Bioprobes. ChemPhysChem 2018, 19, 3318–3324. [Google Scholar] [CrossRef]
- Grichine, A.; Haefele, A.; Pascal, S.; Duperray, A.; Michel, R.; Andraud, C.; Maury, O. Millisecond lifetime imaging with a europium complex using a commercial confocal microscope under one or two-photon excitation. Chem. Sci. 2014, 5, 3475–3485. [Google Scholar] [CrossRef]
- Bui, A.T.; Beyler, M.; Liao, Y.Y.; Grichine, A.; Duperray, A.; Mulatier, J.C.; Le Guennic, B.; Andraud, C.; Maury, O.; Tripier, R. Cationic Two-Photon Lanthanide Bioprobes Able to Accumulate in Live Cells. Inorg. Chem. 2016, 55, 7020–7025. [Google Scholar] [CrossRef]
- Bui, A.T.; Grichine, A.; Brasselet, S.; Duperray, A.; Andraud, C.; Maury, O. Unexpected Efficiency of a Luminescent Samarium(III) Complex for Combined Visible and Near-Infrared Biphotonic Microscopy. Chem.-Eur. J. 2015, 21, 17757–17761. [Google Scholar] [CrossRef]
- D’Aleo, A.; Picot, A.; Baldeck, P.L.; Andraud, C.; Maury, O. Design of Dipicolinic Acid Ligands for the Two-Photon Sensitized Luminescence of Europium Complexes with Optimized Cross-Sections. Inorg. Chem. 2008, 47, 10269–10279. [Google Scholar] [CrossRef]
- D’Aleo, A.; Picot, A.; Beeby, A.; Williams, J.A.G.; Le Guennic, B.; Andraud, C.; Maury, O. Efficient Sensitization of Europlum, Ytterbium, and Neodymium Functionalized Tris-Dipicolinate Lanthanide Complexes through Tunable Charge-Transfer Excited States. Inorg. Chem. 2008, 47, 10258–10268. [Google Scholar] [CrossRef]
- Dai, L.; Lo, W.-S.; Gu, Y.; Xiong, Q.; Wong, K.-L.; Kwok, W.-M.; Wong, W.-T.; Law, G.-L. Breaking the 1,2-HOPO barrier with a cyclen backbone for more efficient sensitization of Eu(III) luminescence and unprecedented two-photon excitation properties. Chem. Sci. 2019, 10, 4550–4559. [Google Scholar] [CrossRef] [Green Version]
- Rabor, J.B.; Kawamura, K.; Kurawaki, J.; Niidome, Y. Plasmon-enhanced two-photon excitation fluorescence of rhodamine 6G and an Eu-diketonate complex by a picosecond diode laser. Analyst 2019, 144, 4045–4050. [Google Scholar] [CrossRef]
- Galland, M.; Le Bahers, T.; Banyasz, A.; Lascoux, N.; Duperray, A.; Grichine, A.; Tripier, R.; Guyot, Y.; Maynadier, M.; Nguyen, C.; et al. “Multi-Heavy-Atom” Approach toward Biphotonic Photosensitizers with Improved Singlet-Oxygen Generation Properties. Chem.-Eur. J. 2019, 25, 9026–9034. [Google Scholar] [CrossRef] [PubMed]
- Jia, J.; Zhang, Y.; Zheng, M.; Shan, C.; Yan, H.; Wu, W.; Gao, X.; Cheng, B.; Liu, W.; Tang, Y. Functionalized Eu(III)-Based Nanoscale Metal-Organic Framework To Achieve Near-IR-Triggered and -Targeted Two-Photon Absorption Photodynamic Therapy. Inorg. Chem. 2018, 57, 300–310. [Google Scholar] [CrossRef] [PubMed]
- Auzel, F. Upconversion Processes in Coupled Ion Systems. J. Lumin. 1990, 45, 341–345. [Google Scholar] [CrossRef]
- Li, Z.; Lv, S.; Wang, Y.; Chen, S.; Liu, Z. Construction of LRET-Based Nanoprobe Using Upconversion Nanoparticles with Confined Emitters and Bared Surface as Luminophore. J. Am. Chem. Soc. 2015, 137, 3421–3427. [Google Scholar] [CrossRef]
- Chen, C.; Wang, F.; Wen, S.; Su, Q.P.; Wu, M.C.L.; Liu, Y.; Wang, B.; Li, D.; Shan, X.; Kianinia, M.; et al. Multi-photon near-infrared emission saturation nanoscopy using upconversion nanoparticles. Nat. Commun. 2018, 9, 3290. [Google Scholar] [CrossRef]
- Boyer, J.-C.; Vetrone, F.; Cuccia, L.A.; Capobianco, J.A. Synthesis of Colloidal Upconverting NaYF4 Nanocrystals Doped with Er3+, Yb3+ and Tm3+, Yb3+ via Thermal Decomposition of Lanthanide Trifluoroacetate Precursors. J. Am. Chem. Soc. 2006, 128, 7444–7445. [Google Scholar] [CrossRef]
- Zhou, J.; Liu, Q.; Feng, W.; Sun, Y.; Li, F. Upconversion Luminescent Materials: Advances and Applications. Chem. Rev. 2015, 115, 395–465. [Google Scholar] [CrossRef]
- Lim, E.K.; Kim, T.; Paik, S.; Haam, S.; Huh, Y.M.; Lee, K. Nanomaterials for Theranostics: Recent Advances and Future Challenges. Chem. Rev. 2015, 115, 327–394. [Google Scholar] [CrossRef]
- Hemmer, E.; Quintanilla, M.; Legare, F.; Vetrone, F. Temperature-Induced Energy Transfer in Dye-Conjugated Upconverting Nanoparticles: A New Candidate for Nanothermometry. Chem. Mater. 2015, 27, 235–244. [Google Scholar] [CrossRef]
- Hao, S.; Chen, G.; Yang, C.; Shao, W.; Wei, W.; Liu, Y.; Prasad, P.N. Nd3+-Sensitized multicolor upconversion luminescence from a sandwiched core/shell/shell nanostructure. Nanoscale 2017, 9, 10633–10638. [Google Scholar] [CrossRef]
- Ai, F.; Ju, Q.; Zhang, X.; Chen, X.; Wang, F.; Zhu, G. A core-shell-shell nanoplatform upconverting near-infrared light at 808 nm for luminescence imaging and photodynamic therapy of cancer. Sci. Rep. 2015, 5, 10785. [Google Scholar] [CrossRef] [Green Version]
- Xiao, X.; Haushalter, J.P.; Faris, G.W. Upconversion from aqueous phase lanthanide chelates. Opt. Lett. 2005, 30, 1674–1676. [Google Scholar] [CrossRef] [Green Version]
- Weng, D.; Zheng, X.; Jin, L. Assembly and Upconversion Properties of Lanthanide Coordination Polymers Based on Hexanuclear Building Blocks with (μ3-OH) Bridges. Eur. J. Inorg. Chem. 2006, 2006, 4184–4190. [Google Scholar] [CrossRef]
- Weng, D.; Zheng, X.; Chen, X.; Li, L.; Jin, L. Synthesis, Upconversion Luminescence and Magnetic Properties of New Lanthanide–Organic Frameworks with (43)2(46,66,83) Topology. Eur. J. Inorg. Chem. 2007, 2007, 3410–3415. [Google Scholar] [CrossRef]
- Sun, C.-Y.; Zheng, X.-J.; Chen, X.-B.; Li, L.-C.; Jin, L.-P. Assembly and upconversion luminescence of lanthanide–organic frameworks with mixed acid ligands. Inorg. Chim. Acta 2009, 362, 325–330. [Google Scholar] [CrossRef]
- Zhang, X.; Li, B.; Ma, H.; Zhang, L.; Zhao, H. Metal-Organic Frameworks Modulated by Doping Er(3+) for Up-Conversion Luminescence. ACS Appl. Mater. Interfaces 2016, 8, 17389–17394. [Google Scholar] [CrossRef]
- Balashova, T.V.; Pushkarev, A.P.; Yablonskiy, A.N.; Andreev, B.A.; Grishin, I.D.; Rumyantcev, R.V.; Fukin, G.K.; Bochkarev, M.N. Organic Er-Yb complexes as potential upconversion materials. J. Lumin. 2017, 192, 208–211. [Google Scholar] [CrossRef]
- Li, M.; Gul, S.; Tian, D.; Zhou, E.; Wang, Y.; Han, Y.; Yin, L.; Huang, L. Erbium(III)-based metal–organic frameworks with tunable upconversion emissions. Dalton Trans. 2018, 47, 12868–12872. [Google Scholar] [CrossRef]
- Aboshyan-Sorgho, L.; Besnard, C.; Pattison, P.; Kittilstved, K.R.; Aebischer, A.; Bünzli, J.-C.G.; Hauser, A.; Piguet, C. Near-Infrared→Visible Light Upconversion in a Molecular Trinuclear d–f–d Complex. Angew. Chem. Int. Ed. 2011, 50, 4108–4112. [Google Scholar] [CrossRef] [Green Version]
- Suffren, Y.; Zare, D.; Eliseeva, S.V.; Guénée, L.; Nozary, H.; Lathion, T.; Aboshyan-Sorgho, L.; Petoud, S.; Hauser, A.; Piguet, C. Near-Infrared to Visible Light-Upconversion in Molecules: From Dream to Reality. J. Phys. Chem. C 2013, 117, 26957–26963. [Google Scholar] [CrossRef]
- Zare, D.; Suffren, Y.; Guénée, L.; Eliseeva, S.V.; Nozary, H.; Aboshyan-Sorgho, L.; Petoud, S.; Hauser, A.; Piguet, C. Smaller than a nanoparticle with the design of discrete polynuclear molecular complexes displaying near-infrared to visible upconversion. Dalton Trans. 2015, 44, 2529–2540. [Google Scholar] [CrossRef] [PubMed]
- Zare, D.; Suffren, Y.; Nozary, H.; Hauser, A.; Piguet, C. Controlling Lanthanide Exchange in Triple-Stranded Helicates: A Way to Optimize Molecular Light-Upconversion. Angew. Chem. Int. Ed. 2017, 56, 14612–14617. [Google Scholar] [CrossRef] [PubMed]
- Golesorkhi, B.; Nozary, H.; Guénée, L.; Fürstenberg, A.; Piguet, C. Room-Temperature Linear Light Upconversion in a Mononuclear Erbium Molecular Complex. Angew. Chem. Int. Ed. 2018, 57, 15172–15176. [Google Scholar] [CrossRef] [PubMed] [Green Version]
- Nonat, A.; Chan, C.F.; Liu, T.; Platas-Iglesias, C.; Liu, Z.; Wong, W.; Wong, W.-K.; Wong, K.L.; Charbonnière, L.J. Room temperature molecular up conversion in solution. Nat. Commun. 2016, 7, 11978. [Google Scholar] [CrossRef] [PubMed] [Green Version]
- Golesorkhi, B.; Furstenberg, A.; Nozary, H.; Piguet, C. Deciphering and quantifying linear light upconversion in molecular erbium complexes. Chem. Sci. 2019, 10, 6876–6885. [Google Scholar] [CrossRef] [Green Version]
- Souri, N.; Tian, P.; Platas-Iglesias, C.; Wong, K.-L.; Nonat, A.; Charbonniere, L.J. Upconverted Photosensitization of Tb Visible Emission by NIR Yb Excitation in Discrete Supramolecular Heteropolynuclear Complexes. J. Am. Chem. Soc. 2017, 139, 1456–1459. [Google Scholar] [CrossRef]
- Nonat, A.; Bahamyirou, S.; Lecointre, A.; Przybilla, F.; Mely, Y.; Platas-Iglesias, C.; Camerel, F.; Jeannin, O.; Charbonniere, L.J. Molecular Upconversion in Water in Heteropolynuclear Supramolecular Tb/Yb Assemblies. J. Am. Chem. Soc. 2019, 141, 1568–1576. [Google Scholar] [CrossRef]
- Hyppänen, I.; Lahtinen, S.; Ääritalo, T.; Mäkelä, J.; Kankare, J.; Soukka, T. Photon Upconversion in a Molecular Lanthanide Complex in Anhydrous Solution at Room Temperature. ACS Photonics 2014, 1, 394–397. [Google Scholar] [CrossRef]
- Yang, L.; Zhang, K.; Bi, S.; Zhu, J.-J. Dual-Acceptor-Based Upconversion Luminescence Nanosensor with Enhanced Quenching Efficiency for in Situ Imaging and Quantification of MicroRNA in Living Cells. ACS Appl. Mater. Interfaces 2019, 11, 38459–38466. [Google Scholar] [CrossRef]
- Tian, R.; Zhao, S.; Liu, G.; Chen, H.; Ma, L.; You, H.; Liu, C.; Wang, Z. Construction of lanthanide-doped upconversion nanoparticle-Uelx Europaeus Agglutinin-I bioconjugates with brightness red emission for ultrasensitive in vivo imaging of colorectal tumor. Biomaterials 2019, 212, 64–72. [Google Scholar] [CrossRef]
- Xu, J.; Gulzar, A.; Yang, D.; Gai, S.; He, F.; Yang, P. Tumor self-responsive upconversion nanomedicines for theranostic applications. Nanoscale 2019, 11, 17535–17556. [Google Scholar] [CrossRef] [PubMed]
- Wu, M.; Wang, X.; Wang, K.; Guo, Z. An ultrasensitive fluorescent nanosensor for trypsin based on upconversion nanoparticles. Talanta 2017, 174, 797–802. [Google Scholar] [CrossRef] [PubMed]
- Tsukube, H.; Shinoda, S. Lanthanide complexes in molecular recognition and chirality sensing of biological substrates. Chem. Rev. 2002, 102, 2389–2403. [Google Scholar] [CrossRef] [PubMed]
- Pandya, S.; Yu, J.; Parker, D. Engineering emissive europium and terbium complexes for molecular imaging and sensing. Dalton Trans. 2006, 23, 2757. [Google Scholar] [CrossRef]
- Harbuzaru, B.V.; Corma, A.; Rey, F.; Jorda, J.L.; Ananias, D.; Carlos, L.D.; Rocha, J. A miniaturized linear pH sensor based on a highly photoluminescent self-assembled europium(III) metal-organic framework. Angew. Chem. Int. Ed. 2009, 48, 6476–6479. [Google Scholar] [CrossRef]
- Gunnlaugsson, T.; Leonard, J.P. Responsive lanthanide luminescent cyclen complexes: From switching/sensing to supramolecular architectures. Chem. Commun. 2005, 25, 3114. [Google Scholar] [CrossRef]
- Tan, H.; Liu, B.; Chen, Y. Lanthanide coordination polymer nanoparticles for sensing of mercury(II) by photoinduced electron transfer. ACS Nano 2012, 6, 10505–10511. [Google Scholar] [CrossRef]
- Khullar, S.; Singh, S.; Das, P.; Mandal, S.K. Luminescent Lanthanide-Based Probes for the Detection of Nitroaromatic Compounds in Water. ACS Omega 2019, 4, 5283–5292. [Google Scholar] [CrossRef]
- Wang, H.-F.; Ma, X.-F.; Zhu, Z.-H.; Zou, H.-H.; Liang, F.-P. Regulation of the Metal Center and Coordinating Anion of Mononuclear Ln(III) Complexes to Promote an Efficient Luminescence Response to Various Organic Solvents. Langmuir 2020, 36, 1409–1417. [Google Scholar] [CrossRef]
- Hewitt, S.H.; Macey, G.; Mailhot, R.; Elsegood, M.R.J.; Duarte, F.; Kenwright, A.M.; Butler, S.J. Tuning the anion binding properties of lanthanide receptors to discriminate nucleoside phosphates in a sensing array. Chem. Sci. 2020, 11, 3619–3628. [Google Scholar] [CrossRef] [Green Version]
- Song, B.; Ye, Z.; Yang, Y.; Ma, H.; Zheng, X.; Jin, D.; Yuan, J. Background-free in-vivo Imaging of Vitamin C using Time-gateable Responsive Probe. Sci. Rep. 2015, 5, 14194. [Google Scholar] [CrossRef] [PubMed] [Green Version]
- Wang, Y.; Wang, H.; Yang, M.; Yuan, J.; Wu, J. A visible-light-excited europium(III) complex-based luminescent probe for visualizing copper ions and hydrogen sulfide in living cells. Opt. Mater. 2018, 75, 243–251. [Google Scholar] [CrossRef]
- Wang, Y.; Wang, H.; Zhao, X.; Jin, Y.; Xiong, H.; Yuan, J.; Wu, J. A β-diketonate–europium(III) complex-based fluorescent probe for highly sensitive time-gated luminescence detection of copper and sulfide ions in living cells. New J. Chem. 2017, 41, 5981–5987. [Google Scholar] [CrossRef]
- Tang, Z.; Song, B.; Ma, H.; Shi, Y.; Yuan, J. A ratiometric time-gated luminescence probe for hydrogen sulfide based on copper(II)-coupled lanthanide complexes. Anal. Chim. Acta 2019, 1049, 152–160. [Google Scholar] [CrossRef]
- Sun, J.; Song, B.; Ye, Z.; Yuan, J. Mitochondria Targetable Time-Gated Luminescence Probe for Singlet Oxygen Based on a beta-Diketonate-Europium Complex. Inorg. Chem. 2015, 54, 11660–11668. [Google Scholar] [CrossRef]
- Wu, J.; Xing, Y.; Wang, H.; Liu, H.; Yang, M.; Yuan, J. Design of a β-diketonate–Eu3+ complex-based time-gated luminescence probe for visualizing mitochondrial singlet oxygen. New J. Chem. 2017, 41, 15187–15194. [Google Scholar] [CrossRef]
- Ma, H.; Wang, X.; Song, B.; Wang, L.; Tang, Z.; Luo, T.; Yuan, J. Extending the excitation wavelength from UV to visible light for a europium complex-based mitochondria targetable luminescent probe for singlet oxygen. Dalton Trans. 2018, 47, 12852–12857. [Google Scholar] [CrossRef]
- Liu, X.; Guo, L.; Song, B.; Tang, Z.; Yuan, J. Development of a novel europium complex-based luminescent probe for time-gated luminescence imaging of hypochlorous acid in living samples. Methods Appl. Fluores. 2017, 5, 014009. [Google Scholar] [CrossRef]
- Tian, L.; Ma, H.; Song, B.; Dai, Z.; Zheng, X.; Zhang, R.; Chen, K.; Yuan, J. Time-gated luminescence probe for ratiometric and luminescence lifetime detection of Hypochorous acid in lysosomes of live cells. Talanta 2020, 212, 120760. [Google Scholar] [CrossRef]
- Ma, H.; Song, B.; Wang, Y.; Cong, D.; Jiang, Y.; Yuan, J. Dual-emissive nanoarchitecture of lanthanide-complex-modified silica particles for in vivo ratiometric time-gated luminescence imaging of hypochlorous acid. Chem. Sci. 2017, 8, 150–159. [Google Scholar] [CrossRef] [Green Version]
- Mailhot, R.; Traviss-Pollard, T.; Pal, R.; Butler, S.J. Cationic Europium Complexes for Visualizing Fluctuations in Mitochondrial ATP Levels in Living Cells. Chem.-Eur. J. 2018, 24, 10745–10755. [Google Scholar] [CrossRef] [Green Version]
- Eipper, B.A.; Mains, R.E.; Glembotski, C.C. Identification in Pituitary Tissue of a Peptide Alpha Amidation Activity that Acts on Glycine Extended Peptides and Requires Molecular Oxygen Copper and Ascorbic-acid. Proc. Natl. Acad. Sci. USA 1983, 80, 5144–5148. [Google Scholar] [CrossRef] [Green Version]
- Klebanoff, S.J.; Dziewiatkowski, D.D.; Okinaka, G.J. The effect of ascorbic acid oxidation on the incorporation of sulfate by slices of calf costal cartilage. J. Gen. Physiol. 1958, 42, 303–318. [Google Scholar] [CrossRef] [Green Version]
- Carita, A.C.; Fonseca-Santos, B.; Shultz, J.D.; Michniak-Kohn, B.; Chorilli, M.; Leonardi, G.R. Vitamin C: One compound, several uses. Advances for delivery, efficiency and stability. Nanomedicine 2020, 24, 102117. [Google Scholar] [CrossRef]
- Cheng, P.; Pu, K. Activatable Phototheranostic Materials for Imaging-Guided Cancer Therapy. ACS Appl. Mater. Interfaces 2020, 12, 5286–5299. [Google Scholar] [CrossRef]
- Chen, J.; Fan, T.; Xie, Z.; Zeng, Q.; Xue, P.; Zheng, T.; Chen, Y.; Luo, X.; Zhang, H. Advances in nanomaterials for photodynamic therapy applications: Status and challenges. Biomaterials 2020, 237, 119827. [Google Scholar] [CrossRef]
- Li, B.; Xiao, H.; Cai, M.; Li, X.; Xu, X.; Wang, S.; Huang, S.; Wang, Y.; Cheng, D.; Pang, P.; et al. Molecular Probe Crossing Blood–Brain Barrier for Bimodal Imaging–Guided Photothermal/Photodynamic Therapies of Intracranial Glioblastoma. Adv. Funct. Mater. 2020, 30. [Google Scholar] [CrossRef]
- Zou, J.; Zhu, J.; Yang, Z.; Li, L.; Fan, W.; He, L.; Tang, W.; Deng, L.; Mu, J.; Ma, Y.; et al. A Phototheranostic Strategy to Continuously Deliver Singlet Oxygen in the Dark and Hypoxic Tumor Microenvironment. Angew. Chem. Int. Ed. 2020. [Google Scholar] [CrossRef]
- Zhang, P.; Wang, H.; Hong, Y.; Yu, M.; Zeng, R.; Long, Y.; Chen, J. Selective visualization of endogenous hypochlorous acid in zebrafish during lipopolysaccharide-induced acute liver injury using a polymer micelles-based ratiometric fluorescent probe. Biosens. Bioelectron. 2018, 99, 318–324. [Google Scholar] [CrossRef]
- Han, X.; Ma, Y.; Chen, Y.; Wang, X.; Wang, Z. Enhancement of the Aggregation-Induced Emission by Hydrogen Bond for Visualizing Hypochlorous Acid in an Inflammation Model and a Hepatocellular Carcinoma Model. Anal. Chem. 2020, 92, 2830–2838. [Google Scholar] [CrossRef]
- Schwab, J.M.; Chiang, N.; Arita, M.; Serhan, C.N. Resolvin E1 and protectin D1 activate inflammation-resolution programmes. Nature 2007, 447, 869–874. [Google Scholar] [CrossRef] [Green Version]
- Koide, Y.; Urano, Y.; Hanaoka, K.; Terai, T.; Nagano, T. Development of an Si-Rhodamine-Based Far-Red to Near-Infrared Fluorescence Probe Selective for Hypochlorous Acid and Its Applications for Biological Imaging. J. Am. Chem. Soc. 2011, 133, 5680–5682. [Google Scholar] [CrossRef]
- Cheng, D.; Pan, Y.; Wang, L.; Zeng, Z.; Yuan, L.; Zhang, X.; Chang, Y.-T. Selective Visualization of the Endogenous Peroxynitrite in an Inflamed Mouse Model by a Mitochondria-Targetable Two-Photon Ratiometric Fluorescent Probe. J. Am. Chem. Soc. 2017, 139, 285–292. [Google Scholar] [CrossRef]
- Jaeschke, H.; Ramachandran, A. Reactive oxygen species in the normal and acutely injured liver. J. Hepatol. 2011, 55, 227–228. [Google Scholar] [CrossRef] [Green Version]
- Schweitzer, C.; Schmidt, R. Physical mechanisms of generation and deactivation of singlet oxygen. Chem. Rev. 2003, 103, 1685–1757. [Google Scholar] [CrossRef]
- DeRosa, M.; Crutchley, R.J. Photosensitized singlet oxygen and its applications. Coord. Chem. Rev. 2002, 233, 351–371. [Google Scholar] [CrossRef]
- Idris, N.M.; Gnanasammandhan, M.K.; Zhang, J.; Ho, P.C.; Mahendran, R.; Zhang, Y. In vivo photodynamic therapy using upconversion nanoparticles as remote-controlled nanotransducers. Nat. Med. 2012, 18, 1580. [Google Scholar] [CrossRef]
- Yu, Y.; Mei, L.; Shi, Y.; Zhang, X.; Cheng, K.; Cao, F.; Zhang, L.; Xu, J.; Li, X.; Xu, Z. Ag-Conjugated graphene quantum dots with blue light-enhanced singlet oxygen generation for ternary-mode highly-efficient antimicrobial therapy. J. Mater. Chem. B 2020, 8, 1371–1382. [Google Scholar] [CrossRef]
- Gaggelli, E.; Kozlowski, H.; Valensin, D.; Valensin, G. Copper homeostasis and neurodegenerative disorders (Alzheimer′s, prion, and Parkinson′s diseases and amyotrophic lateral sclerosis). Chem. Rev. 2006, 106, 1995–2044. [Google Scholar] [CrossRef]
- D’Ambrosi, N.; Rossi, L. Copper at synapse: Release, binding and modulation of neurotransmission. Neurochem. Int. 2015, 90, 36–45. [Google Scholar] [CrossRef]
- Duce, J.A.; Tsatsanis, A.; Cater, M.A.; James, S.A.; Robb, E.; Wikhe, K.; Leong, S.L.; Perez, K.; Johanssen, T.; Greenough, M.A.; et al. Iron-Export Ferroxidase Activity of beta-Amyloid Precursor Protein Is Inhibited by Zinc in Alzheimer′s Disease. Cell 2010, 142, 857–867. [Google Scholar] [CrossRef] [Green Version]
- Frederickson, C.J.; Koh, J.-Y.; Bush, A.I. The neurobiology of zinc in health and disease. Nat. Rev. Neurosci. 2005, 6, 449–462. [Google Scholar] [CrossRef]
- Sensi, S.L.; Paoletti, P.; Bush, A.I.; Sekler, I. Zinc in the physiology and pathology of the CNS. Nat. Rev. Neurosci. 2009, 10, 780. [Google Scholar] [CrossRef]
- Zhao, G.; Joca, H.C.; Nelson, M.T.; Lederer, W.J. ATP- and voltage-dependent electro-metabolic signaling regulates blood flow in heart. Proc. Natl. Acad. Sci. USA 2020, 117, 7461–7470. [Google Scholar] [CrossRef]
- Rajendran, M.; Dane, E.; Conley, J.; Tantama, M. Imaging Adenosine Triphosphate (ATP). Biol. Bull. 2016, 231, 73–84. [Google Scholar] [CrossRef] [Green Version]
- Zhou, Y.; Tozzi, F.; Chen, J.; Fan, F.; Xia, L.; Wang, J.; Gao, G.; Zhang, A.; Xia, X.; Brasher, H.; et al. Intracellular ATP Levels Are a Pivotal Determinant of Chemoresistance in Colon Cancer Cells. Cancer Res. 2012, 72, 304–314. [Google Scholar] [CrossRef] [Green Version]
- Suffren, Y.; Golesorkhi, B.; Zare, D.; Guénée, L.; Nozary, H.; Eliseeva, S.V.; Petoud, S.; Hauser, A.; Piguet, C. Taming Lanthanide-Centered Upconversion at the Molecular Level. Inorg. Chem. 2016, 55, 9964–9972. [Google Scholar] [CrossRef] [Green Version]
Figure 1.
Energy level diagram illustrating the antenna effect. A is absorption, ISC intersystem crossing, EnT energy transfer, BEnT back-energy transfer, L luminescence, NR non-radiative pathways, S designates levels with singlet multiplicity and T levels with triplet multiplicity.
Figure 1.
Energy level diagram illustrating the antenna effect. A is absorption, ISC intersystem crossing, EnT energy transfer, BEnT back-energy transfer, L luminescence, NR non-radiative pathways, S designates levels with singlet multiplicity and T levels with triplet multiplicity.

Figure 2.
(a) WF and (b) CF microscope setup. (c) Exclusion of out-of-focus light by the pinhole in a CF setup. L indicates lens, DM dichroic mirror, F filter, the purple and red lines indicate excitation and emission, respectively, and the green line indicates emission coming from out-of-focus.
Figure 2.
(a) WF and (b) CF microscope setup. (c) Exclusion of out-of-focus light by the pinhole in a CF setup. L indicates lens, DM dichroic mirror, F filter, the purple and red lines indicate excitation and emission, respectively, and the green line indicates emission coming from out-of-focus.

Figure 3.
Comparison between luminescence images obtained using a WF (A) and a CF (B) microscope setups. Reproduced with permission from Elsevier [55].
Figure 3.
Comparison between luminescence images obtained using a WF (A) and a CF (B) microscope setups. Reproduced with permission from Elsevier [55].

Figure 4.
(a) Radial probability distribution of 4f, 5s and 5p electrons for PrIII Reproduced with permission from Elsevier [58]); (b) Magnitude of the inter-electronic repulsion, spin-orbit coupling and ligand field of the 4f6 configuration of a LnIII ion.
Figure 4.
(a) Radial probability distribution of 4f, 5s and 5p electrons for PrIII Reproduced with permission from Elsevier [58]); (b) Magnitude of the inter-electronic repulsion, spin-orbit coupling and ligand field of the 4f6 configuration of a LnIII ion.

Figure 5.
Main electronic transitions of the GdIII, TbIII, DyIII, SmIII, EuIII, NdIII, and YbIII ions.
Figure 5.
Main electronic transitions of the GdIII, TbIII, DyIII, SmIII, EuIII, NdIII, and YbIII ions.

Figure 6.
Energy level scheme showing the electronic levels 5D0 and 7F2 in the free ion (black), and the symmetry point group O (red), and transition probability for the 5D0 → 7F2 electronic transition.
Figure 6.
Energy level scheme showing the electronic levels 5D0 and 7F2 in the free ion (black), and the symmetry point group O (red), and transition probability for the 5D0 → 7F2 electronic transition.

Figure 7.
Energy diagram showing the electronic levels of TbIII (green), EuIII (red), and YbIII (light pink), and the phonons for the water molecule O-H vibrations (blue).
Figure 7.
Energy diagram showing the electronic levels of TbIII (green), EuIII (red), and YbIII (light pink), and the phonons for the water molecule O-H vibrations (blue).

Figure 8.
Structure of several LnIII complexes along with their stability constants (β) [31,78,79,80,81,82,83,84,85,86,87,88].

Figure 9.
Structures of the ligands mentioned throughout this review.

Figure 10.
Time-gated luminescence imaging of HeLa cells incubated with the NP-LNP hybrid system for 24 h. Concentration = 1.2 (left column), 0.12 (middle column), and 0.012 nM (right column). The first, second, and third rows correspond to the bright field, time-gated luminescence, and overlay images. Reprinted with permission from [100]. Copyright (2020) American Chemical Society.

Figure 11.
(a) Single crystal X-ray structure of the [Gd(dipicNH2)3]3− complex and (b) Bright field, luminescence, and overlay imaging of the NG97 cells after 12 h of incubation with [Eu(dipicNH2)3]3−. Reproduced from [31] with permission from the Royal Society of Chemistry.
Figure 11.
(a) Single crystal X-ray structure of the [Gd(dipicNH2)3]3− complex and (b) Bright field, luminescence, and overlay imaging of the NG97 cells after 12 h of incubation with [Eu(dipicNH2)3]3−. Reproduced from [31] with permission from the Royal Society of Chemistry.

Figure 12.
Plot “attenuation coefficient as a function of the wavelength” for human skin tissues. Reproduced from [34] with permission from The Royal Society of Chemistry.
Figure 12.
Plot “attenuation coefficient as a function of the wavelength” for human skin tissues. Reproduced from [34] with permission from The Royal Society of Chemistry.

Figure 13.
(a) Plot YbIII emission lifetime (black trace) and YbIII emission intensity (red trace) as a function of the pH in the range 1–11. (b) NIR luminescence imaging and (c) emission lifetime imaging showing migration of the YbIII complex from the stomach (pH 1–3) to the intestine (pH 6–7) [17]. Reproduced from [17] published by The Royal Society of Chemistry.

Figure 14.
Energy level diagram illustrating the antenna effect for LnIII. 2PA and 1PA are the two- and one-photon absorption, F fluorescence, P phosphorescence, ISC intersystem crossing, ET energy transfer, BT back-transfer, L luminescence, NR non-radiative pathways, S states with singlet and T states with triplet multiplicity. Reprinted with permission from [40]. Copyright (2020) American Chemical Society.

Figure 15.
2P-luminescence imaging of T 24 cells using the [Sm(tacnMeO)]. (A) Visible luminescence channel. (B) NIR luminescence channel. (C) Comparison between the SmIII (visible and NIR) and YbIII (NIR) emission intensities. (D) 2P-luminescence imaging obtained using the [Yb(tacnMeO)] complex [163]. Reproduced from [163] with permission from John Wiley and Sons.

Figure 16.
(a) 2P-luminescence imaging of HeLa cells at different times after irradiation at 488 nm ([complex] = 50 μM and λexc = 700 nm). (b) Plot tumor volume as a function of the time in the absence (aqua line), presence of the complex without light (red line), and presence of the complex with light (blue line). mcomplex = 40 μg, λ = 488 nm. Reprinted with permission from [159]. Copyright (2017) American Chemical Society.

Figure 17.
Energy level diagram illustrating the upconversion process.

Figure 18.
(a) X-ray single structure of the [CrEuCr(LH1)]2(CF3SO3)18•(C3H5N)30. (b) Energy diagram showing the energy transfer processes in the [CrErCr(LH1)]9+ system. Excitation solid upward arrow, internal conversion curled arrow, ETU dotted arrow. Reproduced from ref. [186] with permission from John Wiley and Sons.

Figure 19.
(a) UC emission of the [(Yb(tacnPO3))2Tb] complex. The inset shows the UC emission intensity as a function of the ratio [Tb]/[Yb(tacnPO3)]. [YbIII] = 1.25 mM, in D2O (pD ~7.1). λexc = 980 nm, p = 1.08 W. Reprinted with permission from [194], copyright (2019) American Chemical Society. (b) Energy level diagram showing the UC energy transfer mechanism for the [(Yb(tacnPO3))2Tb] complex. GSA is ground state absorption, ETU is energy transfer upconversion, and UC is upconversion emission. Reproduced from [43] with permission from Elsevier.

Figure 20.
(A) Time-gated luminescence imaging of (A) HepG2 cells loaded with vitamin C, at different loading times, followed by incubation for 1 h with [Eu(tob)]-− complex. [complex] = 20 μM, and [vitamin C] = 1.0 mM. (B) Luminescence imaging of Daphnia magna (a) bright field imaging, (b) time-gated luminescence imaging, (c) time-gated and (d) luminescence imaging after incubation with vitamin C for 40 min. [complex] = 5.0 μM, and [vitamin C] = 1.0 mM. Reproduced from [208].

Figure 21.
Luminescence imaging of HepG2 cells (A) incubated with [Eu(pfdap)3(tpy)] complex for 1 h, (B) incubated with ALA for 0.5 h followed by the [Eu(pfdap)3(tpy)] complex for 1 h, and (C) incubated with ALA for 0.5 h followed by the [Eu(pfdap)3(tpy)] complex for 1 h in the presence of NaN3. In all cases, the first, second, and third columns correspond to the bright field, luminescence imaging, and overlay of the bright field and luminescence imaging. After incubation with the [Eu(pfdap)3(tpy)] complex, the cells were irradiated at 660 nm for 0.5 to stimulate the production of singlet oxygen. ALA stimulates the production of singlet oxygen while NaN3 quenches it. [complex] = 20 μM, [ALA] = 15 μM, and [NaN3] = 200 μM. Reproduced from [212]. Copyright (2015) American Chemical Society.


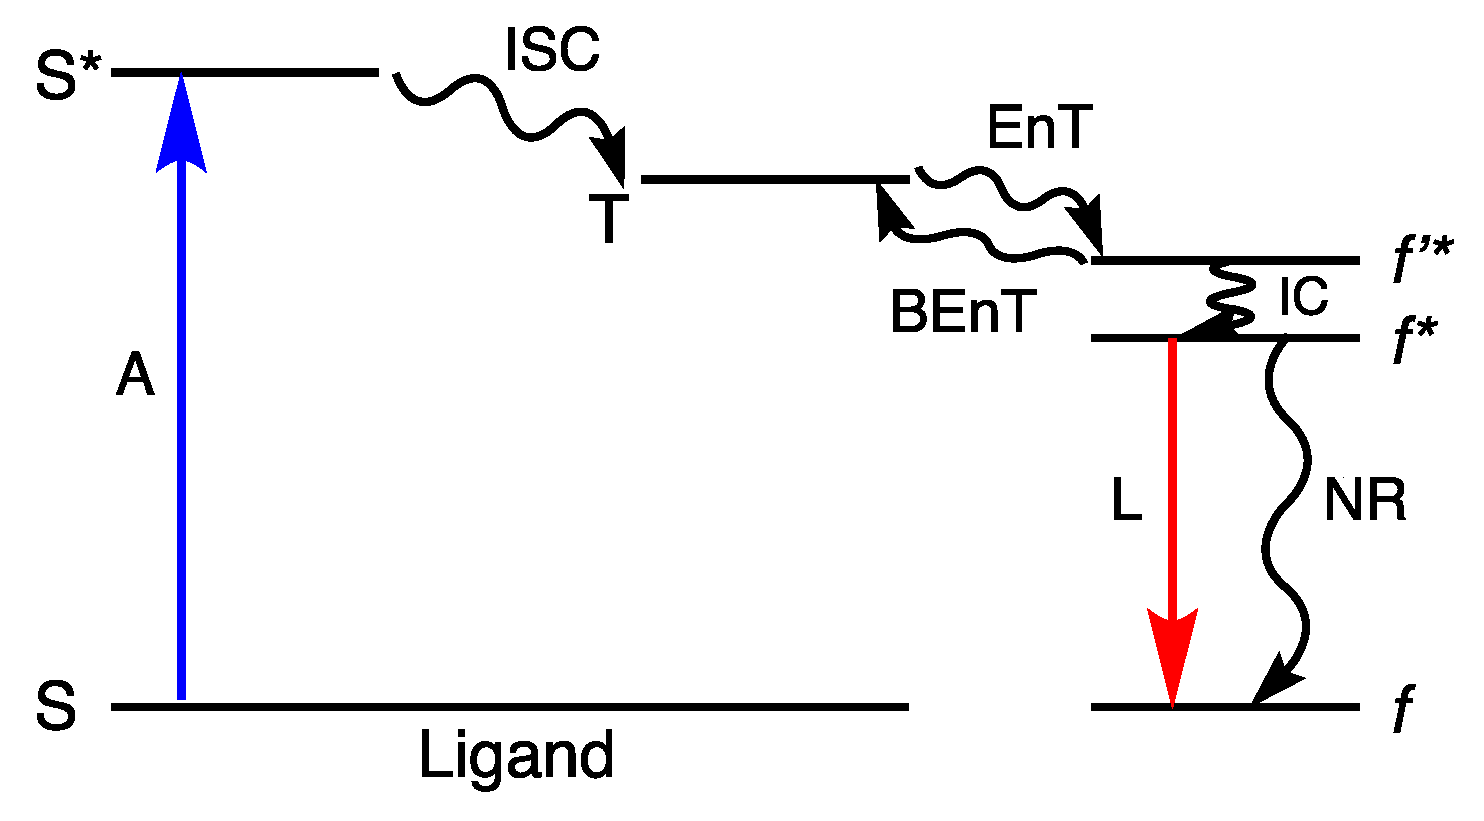
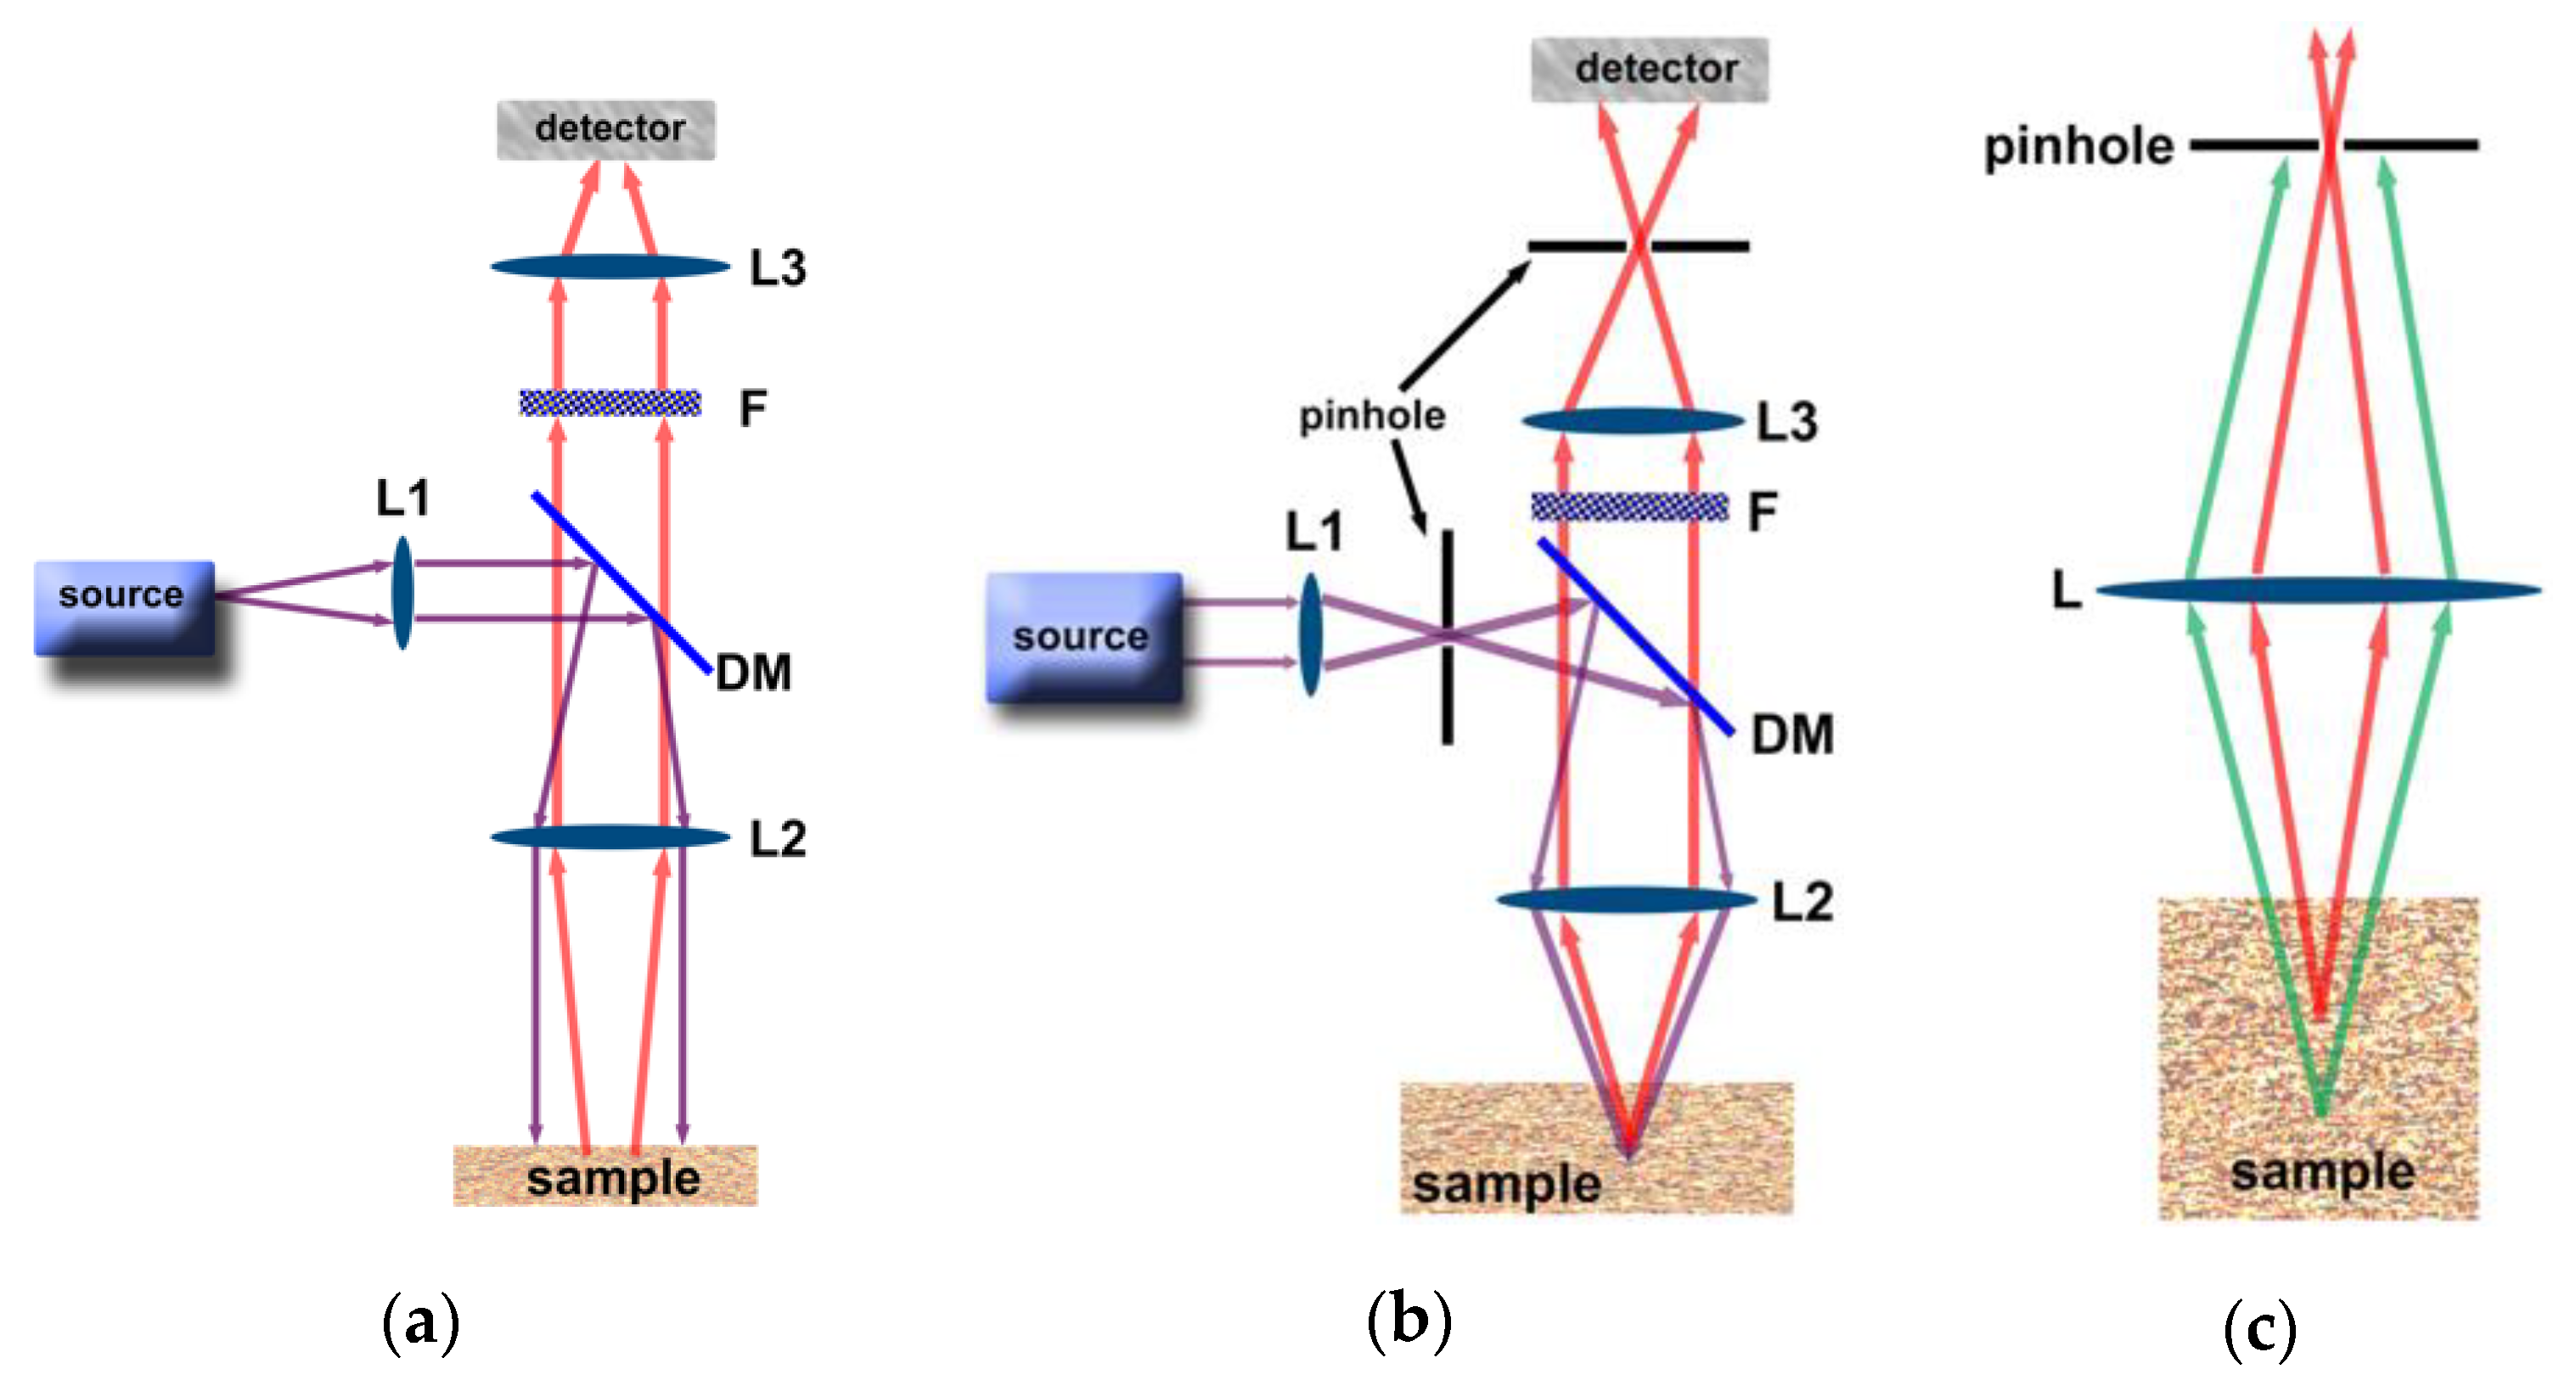
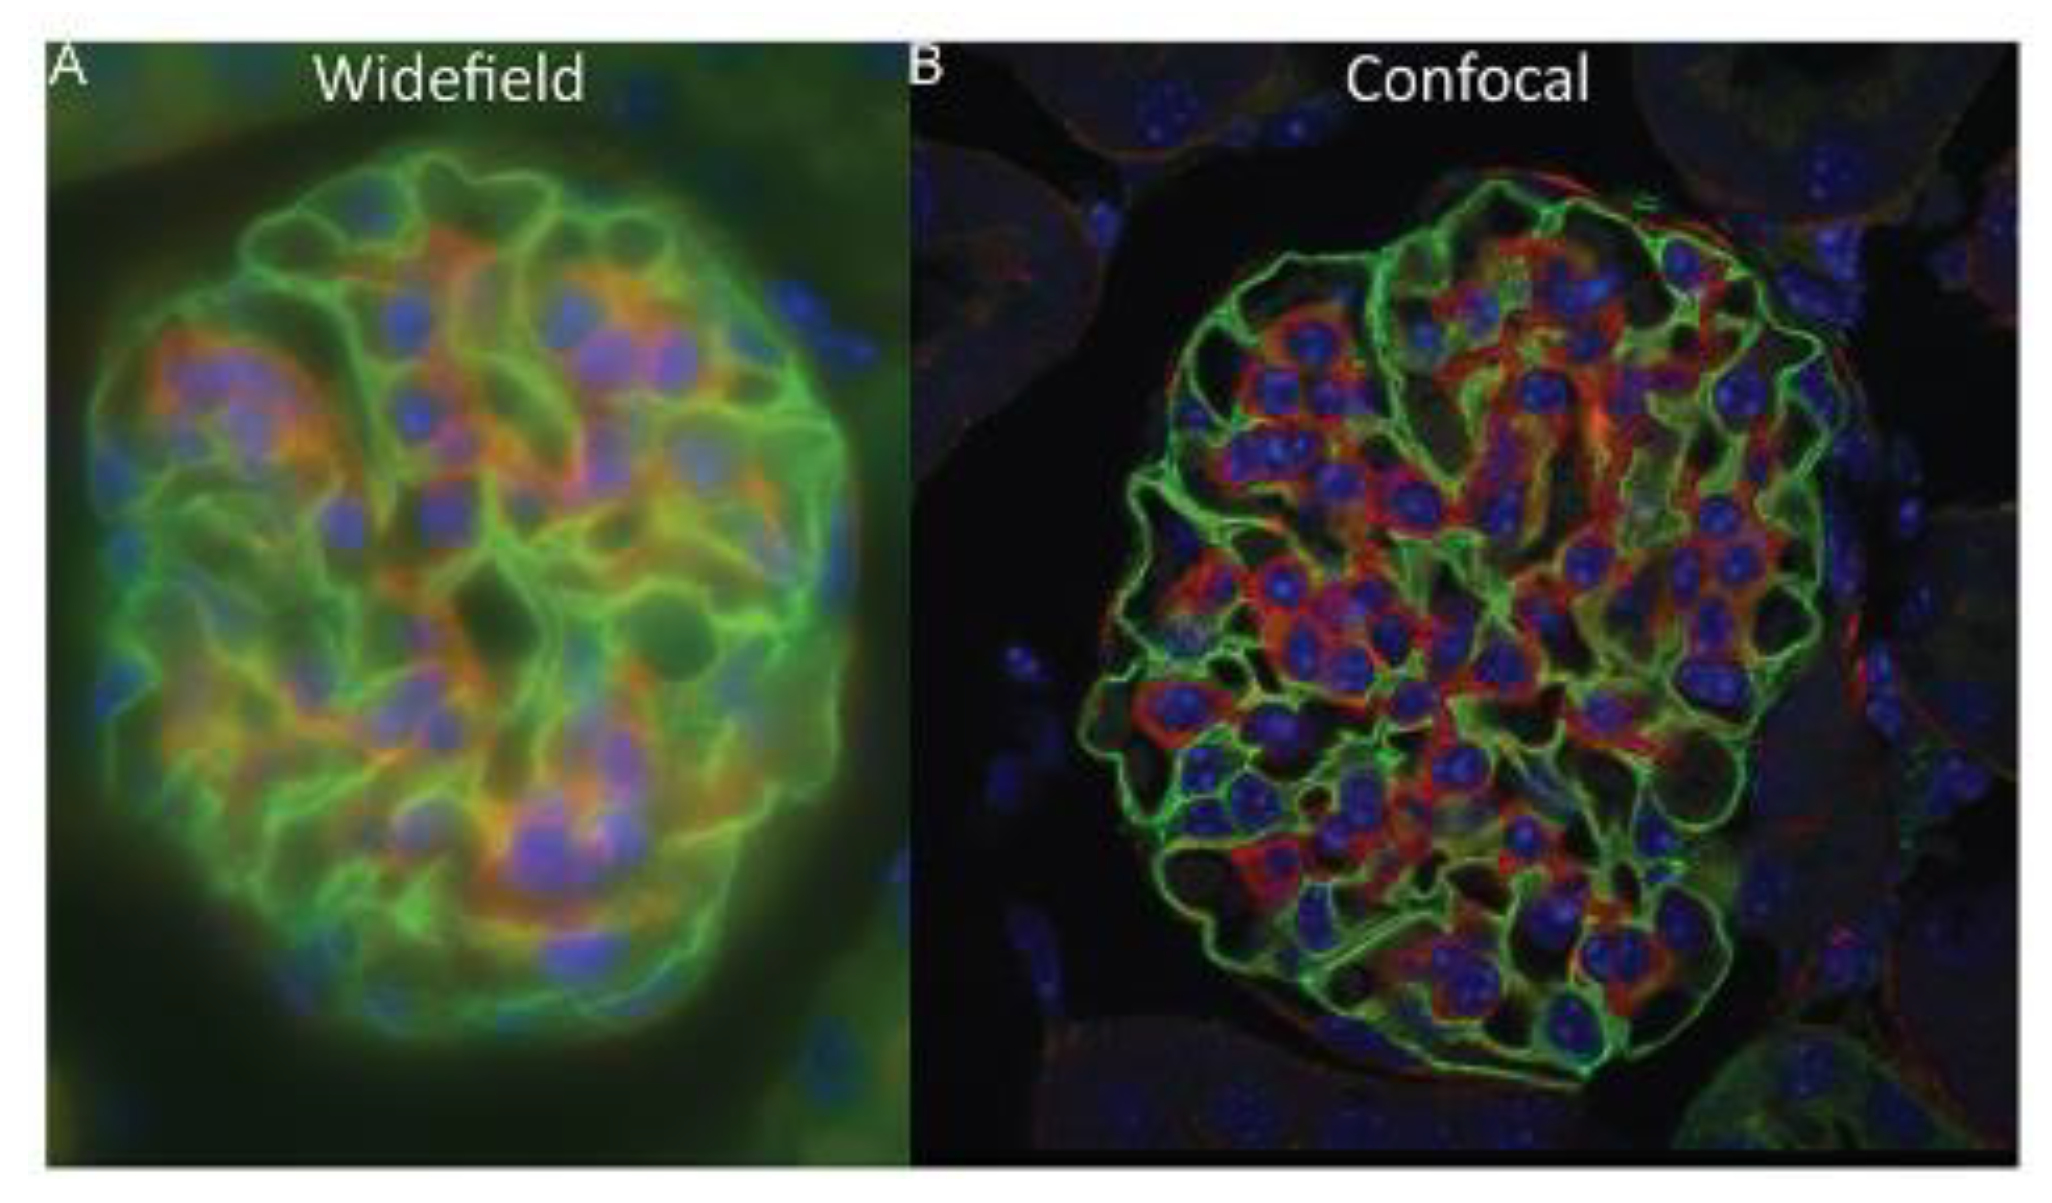
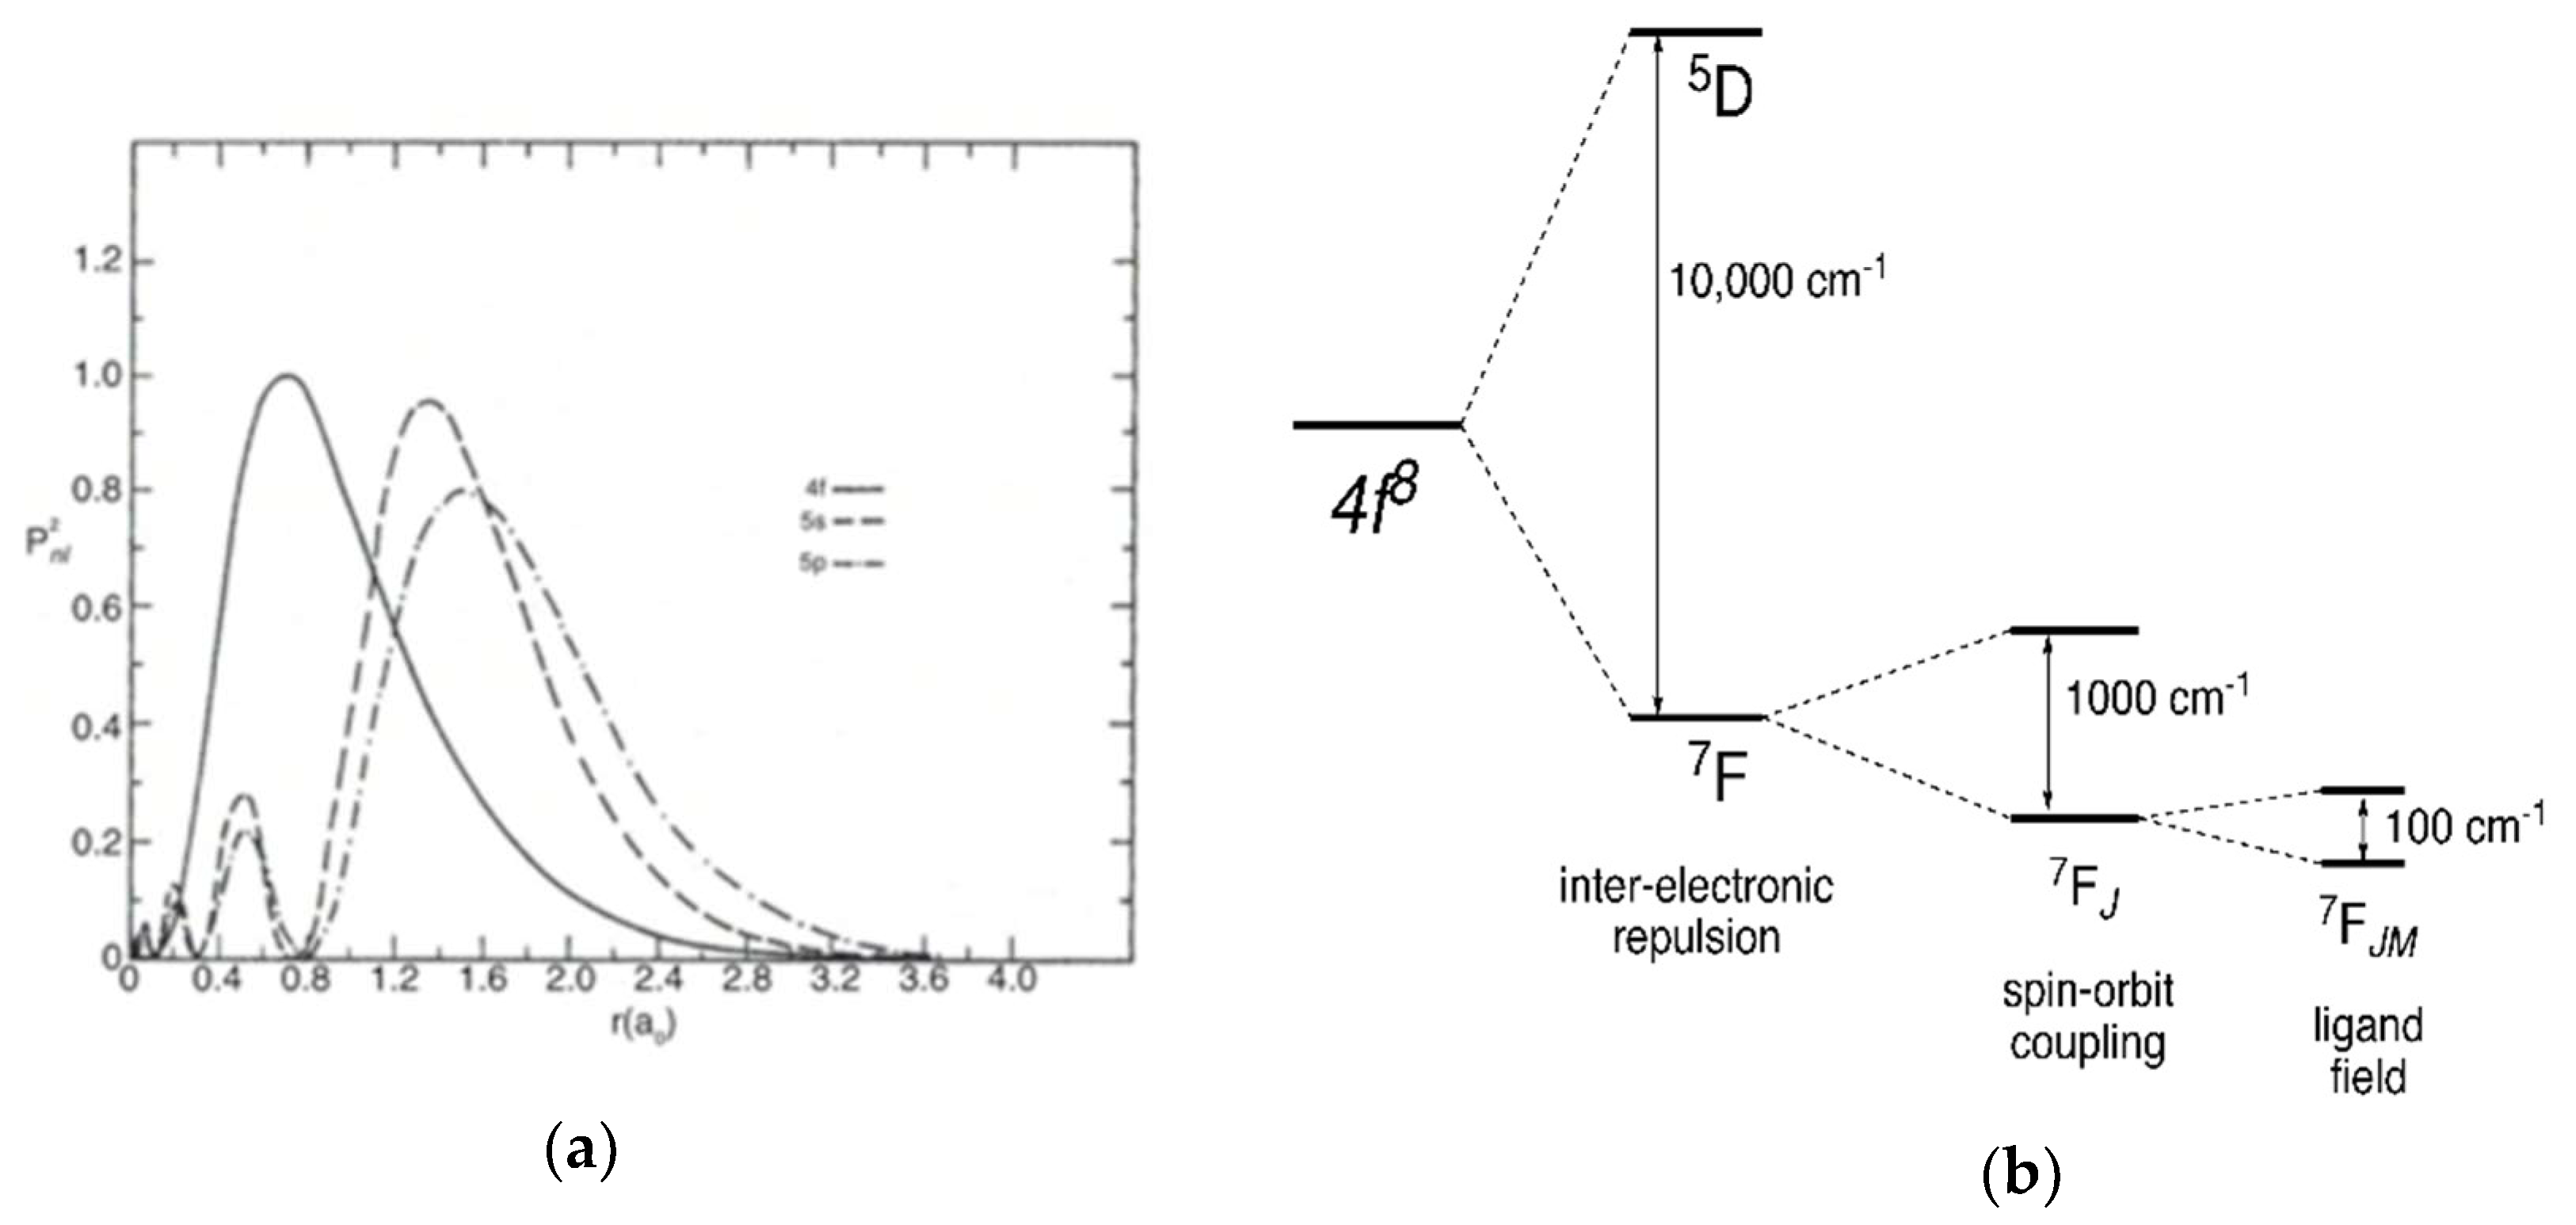
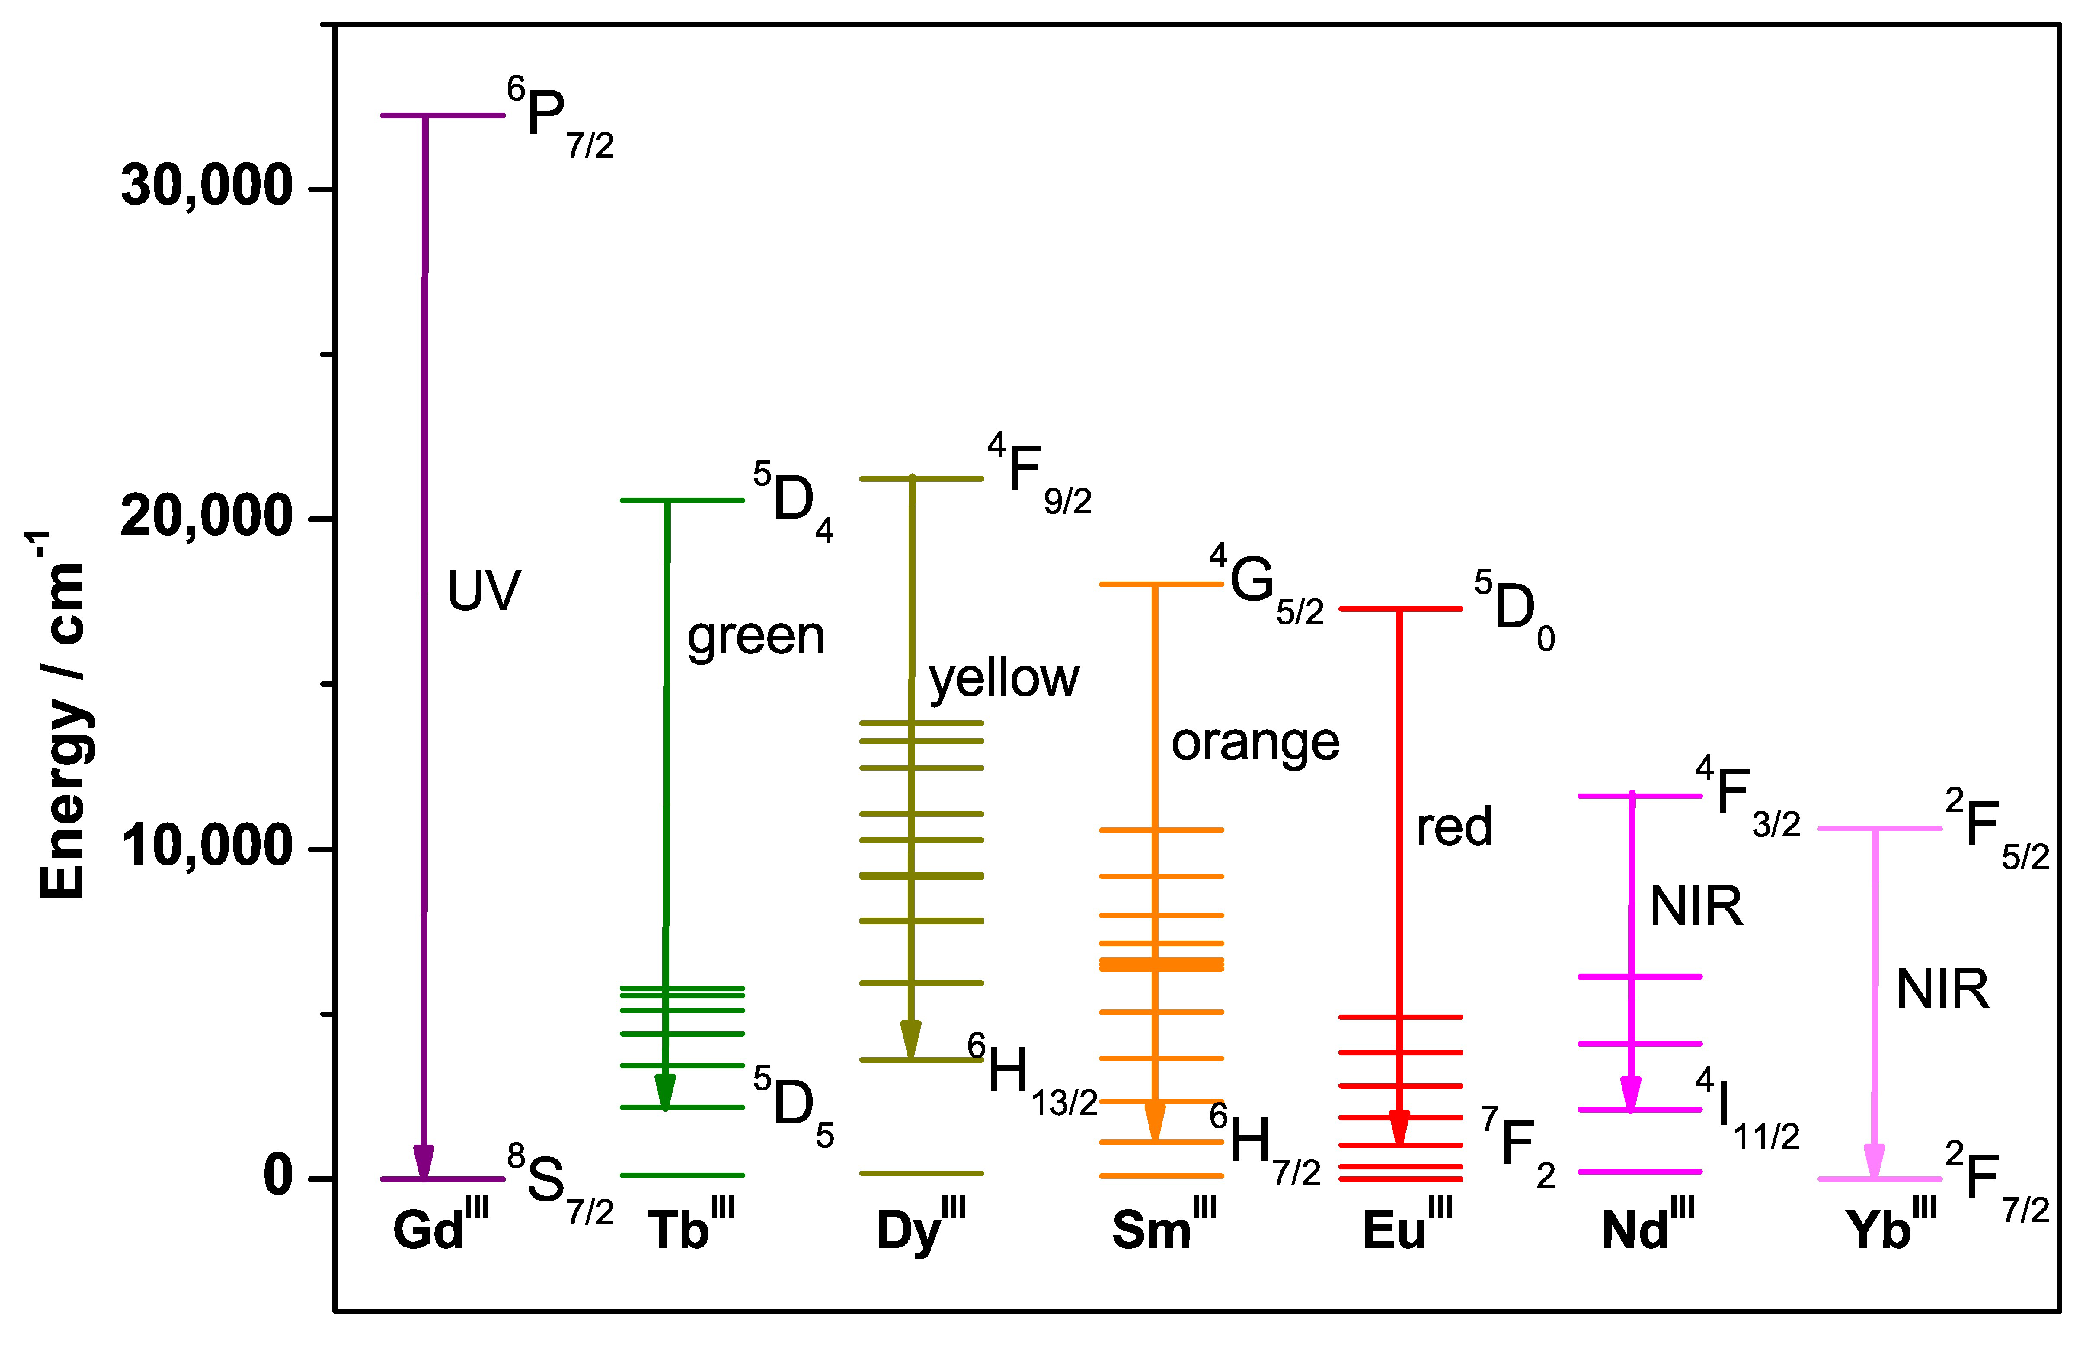
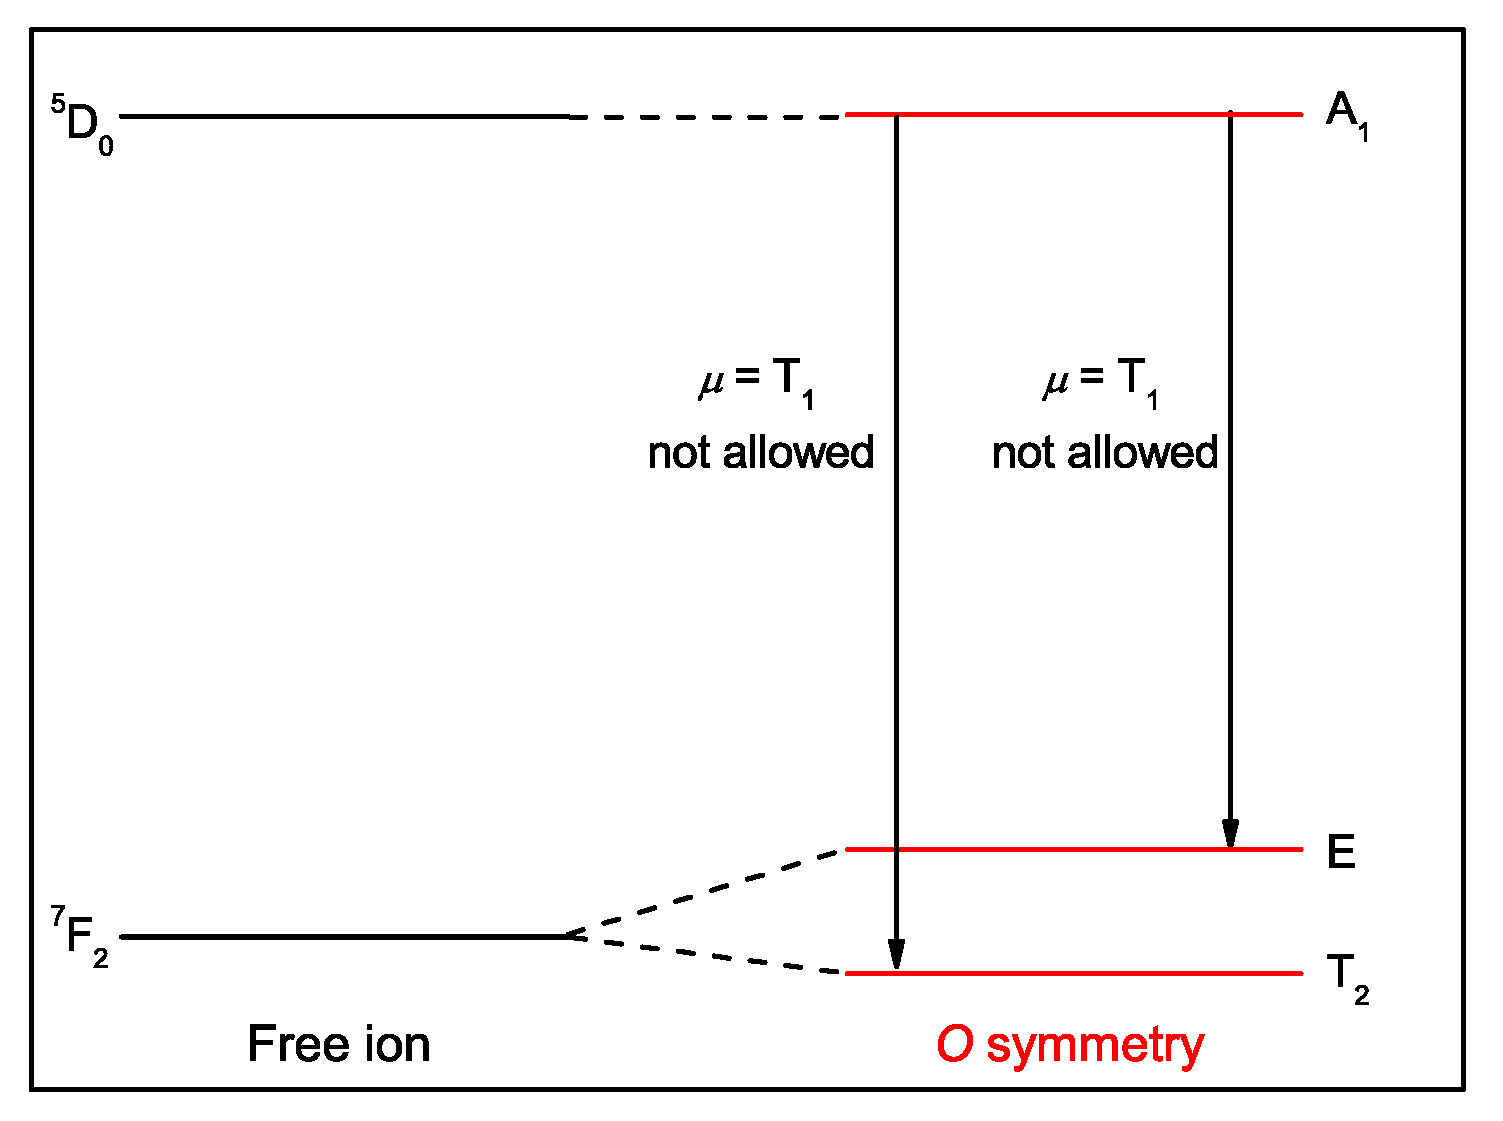
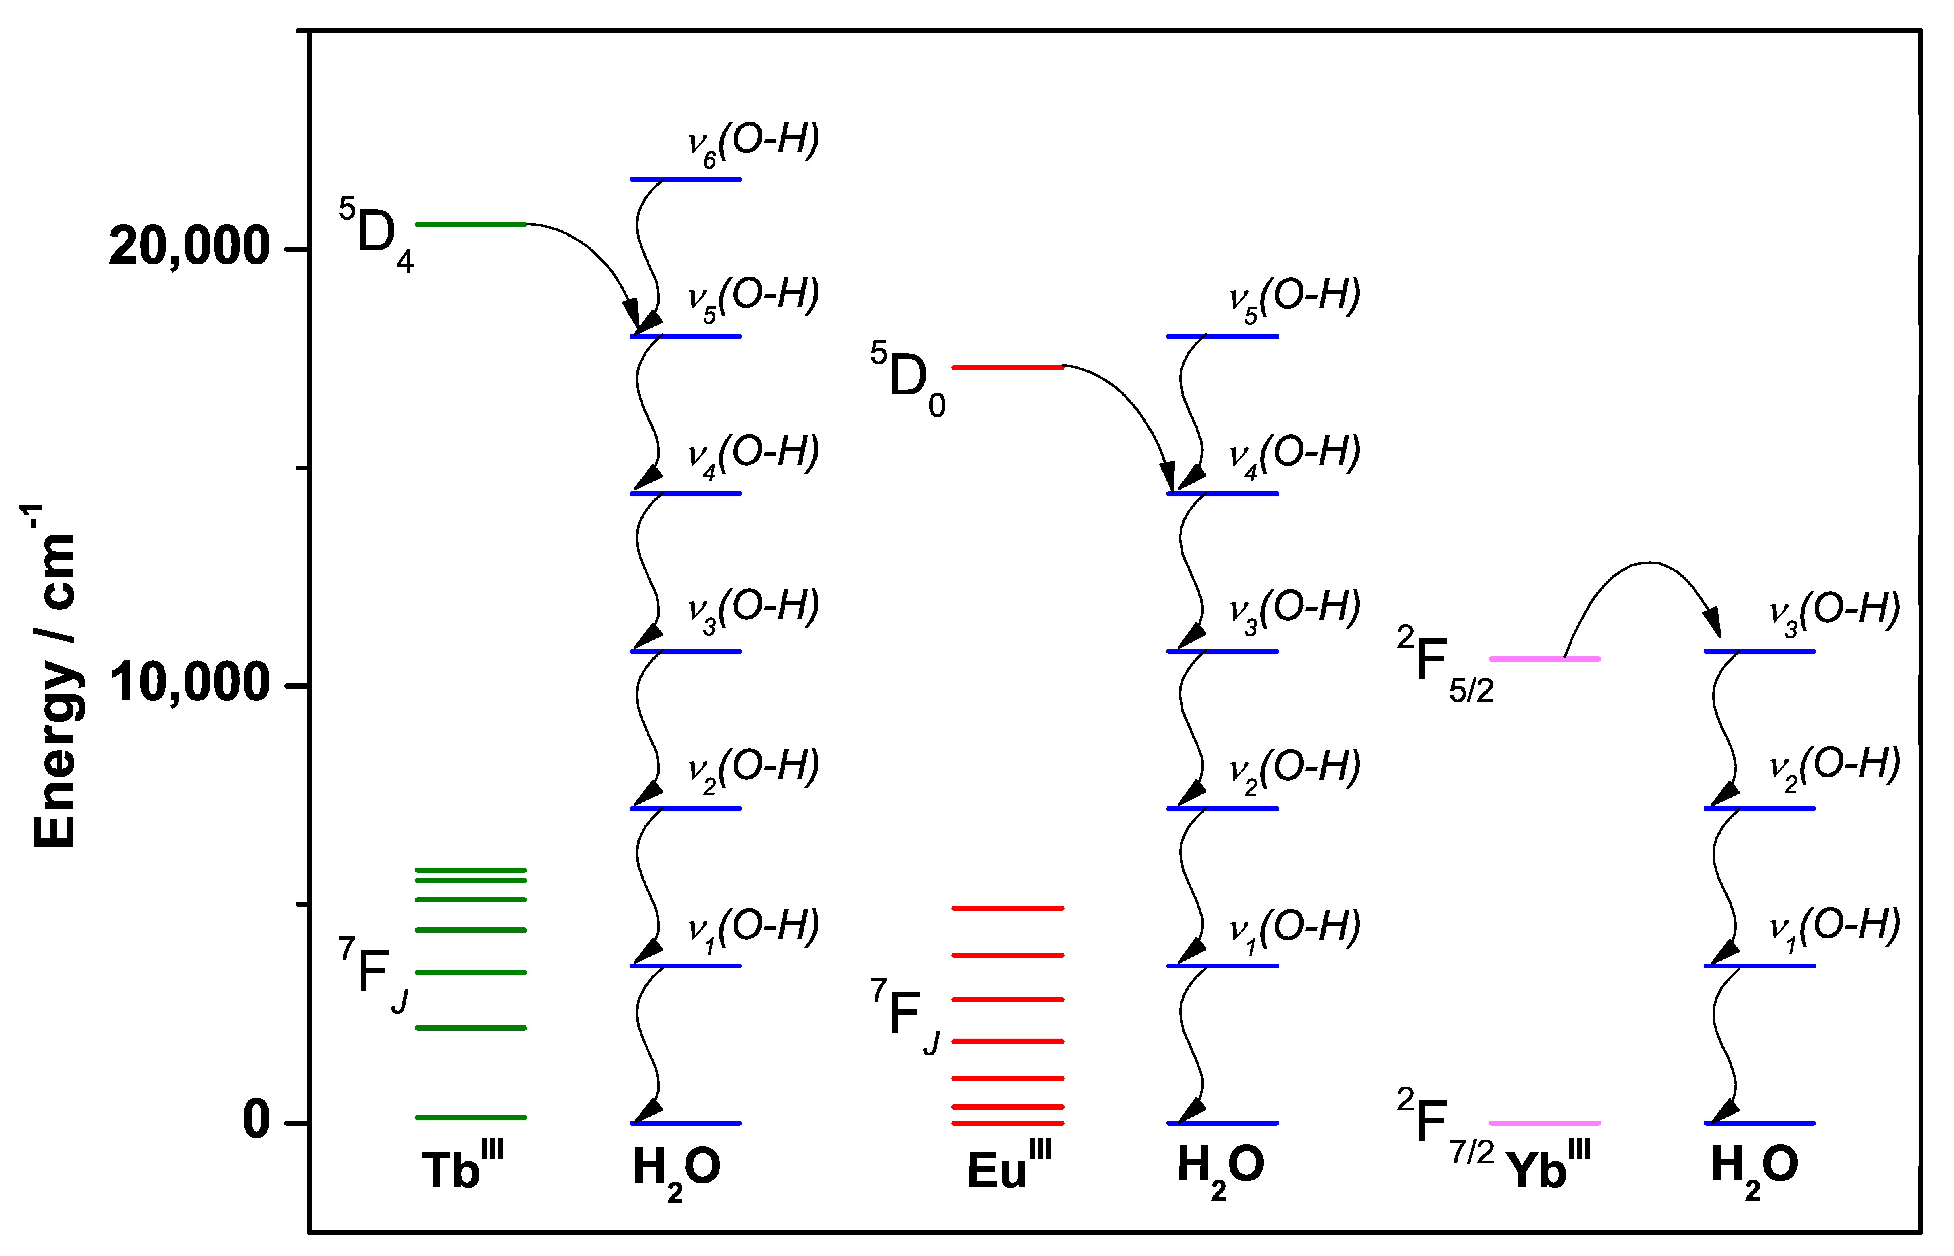
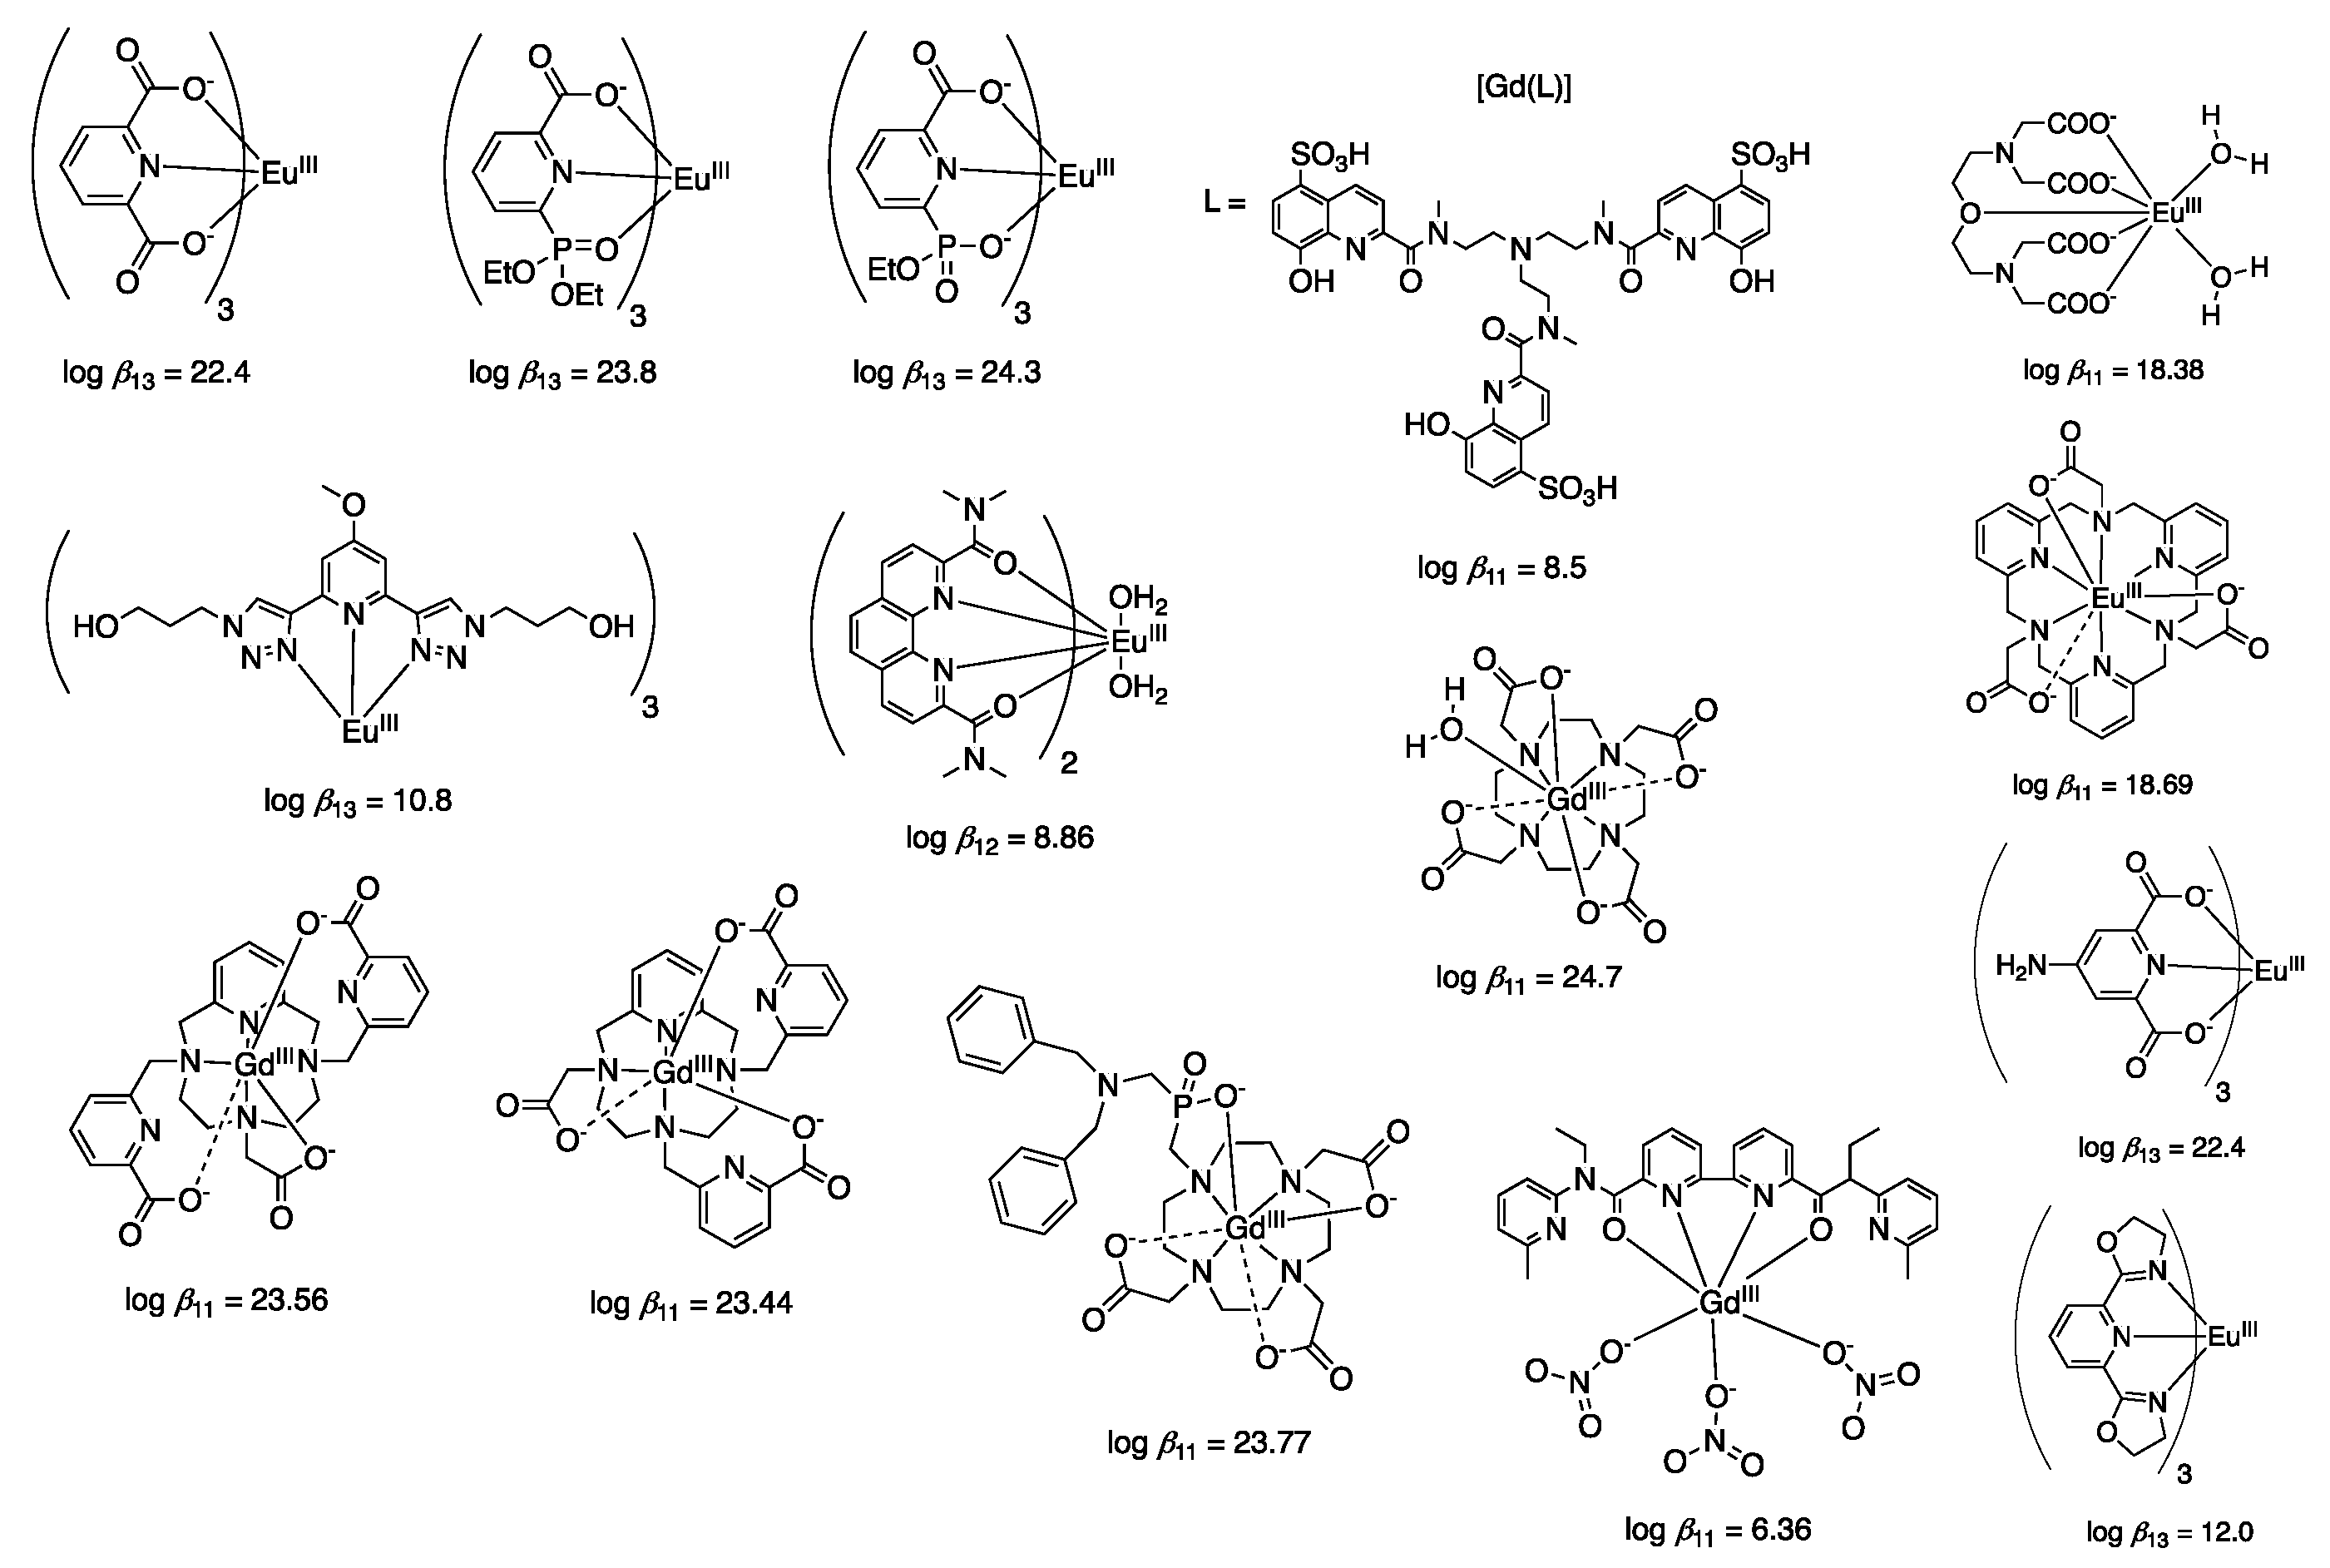
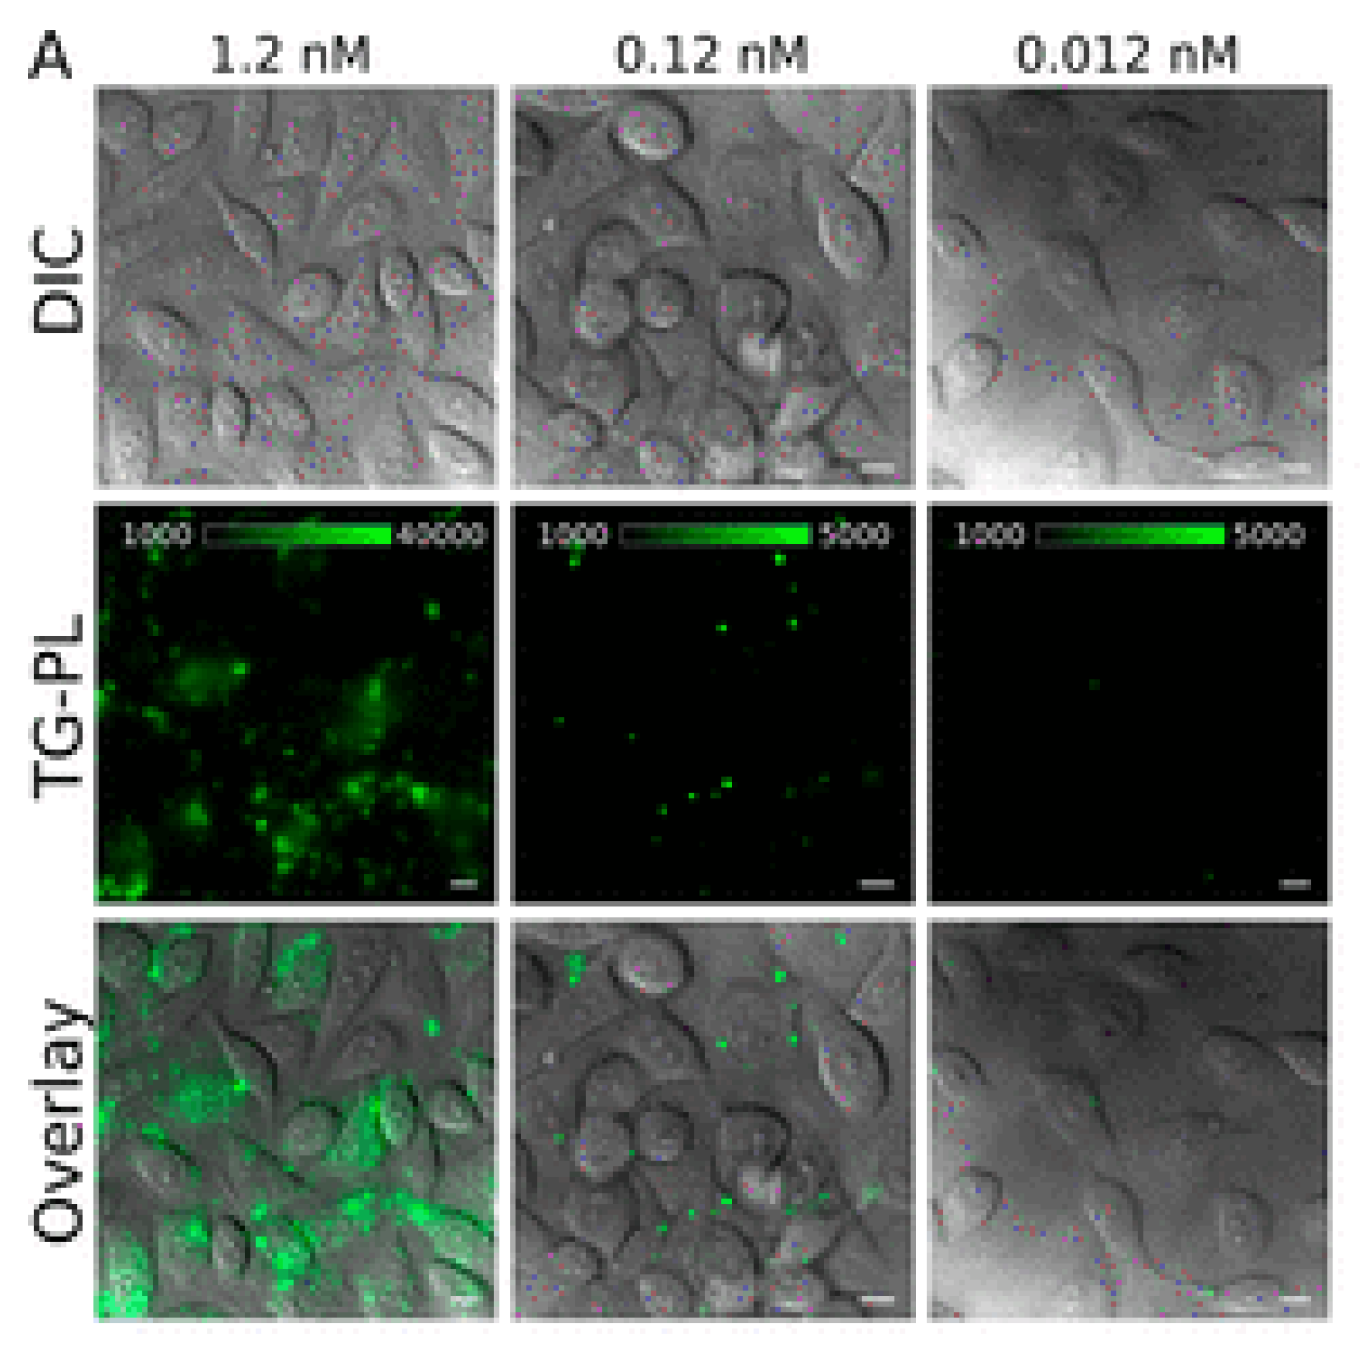
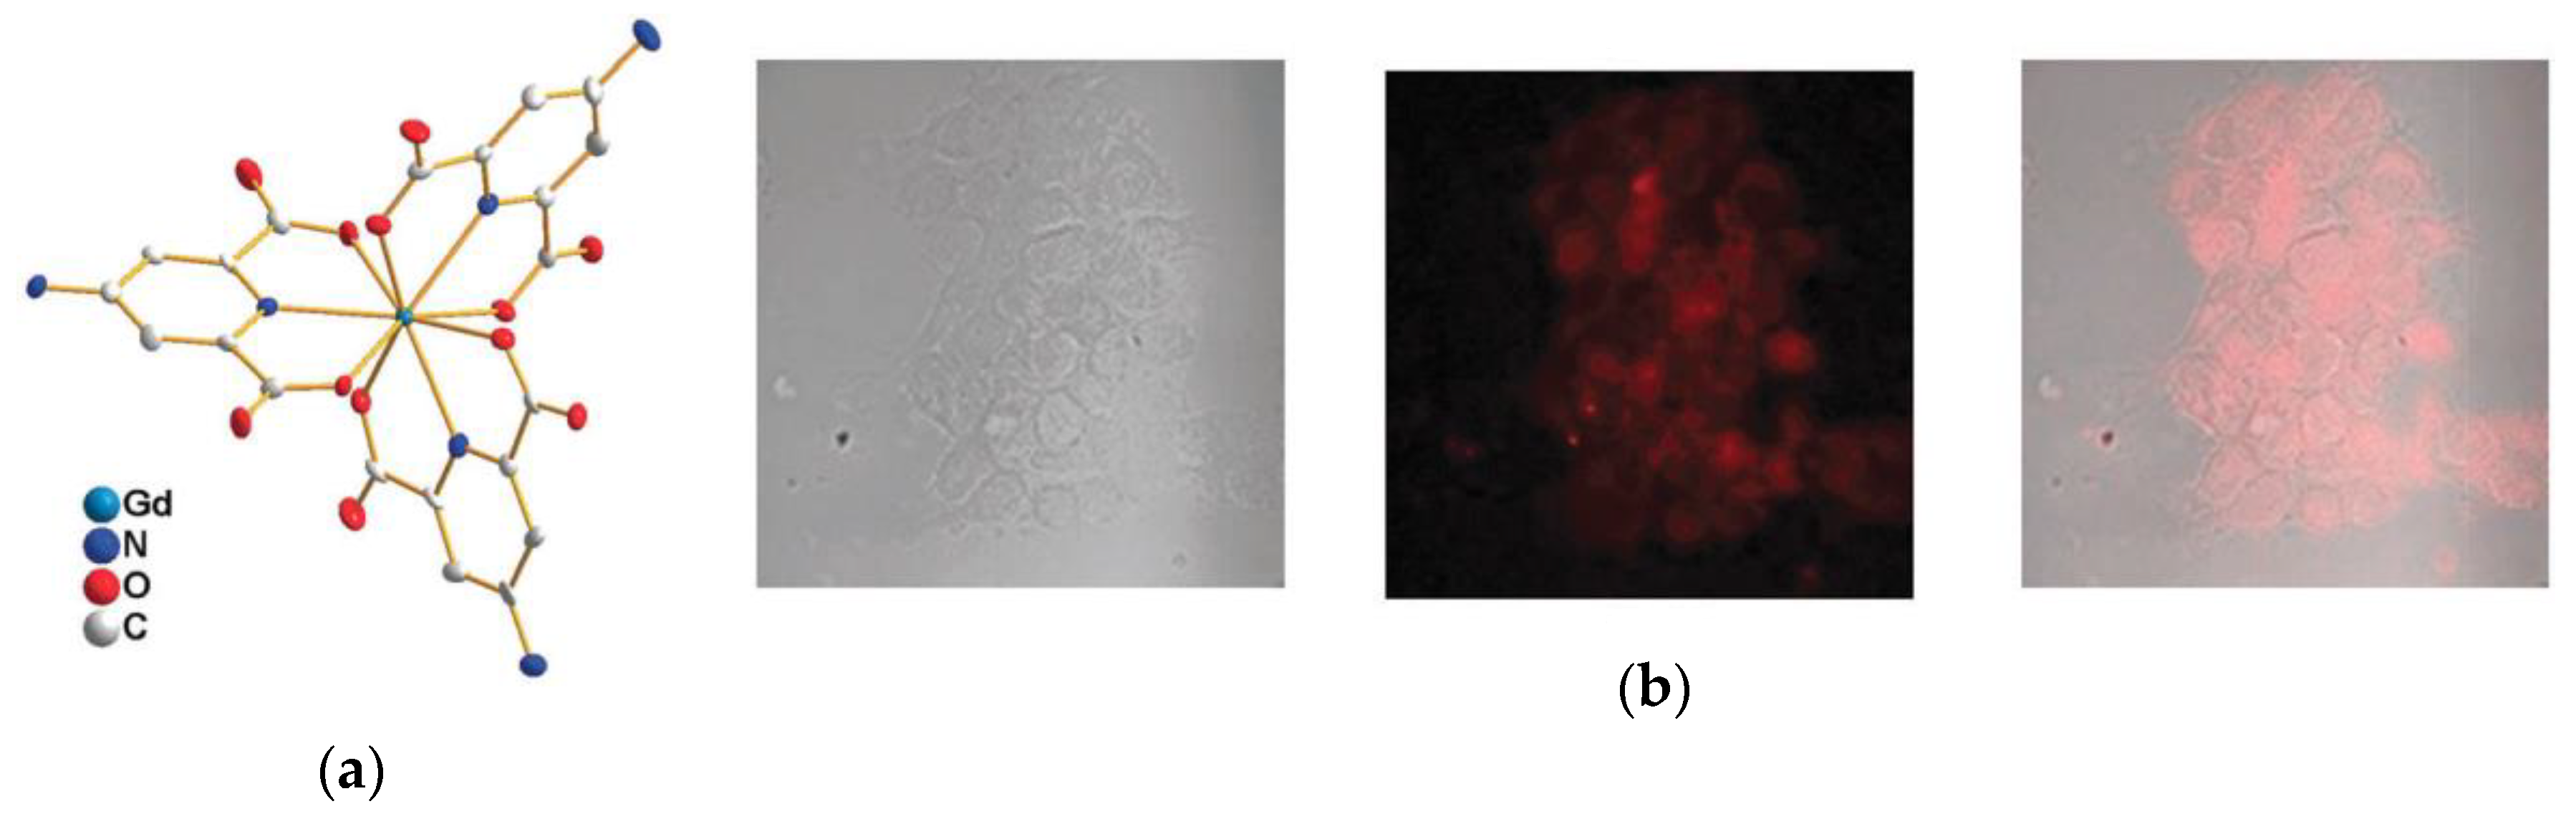
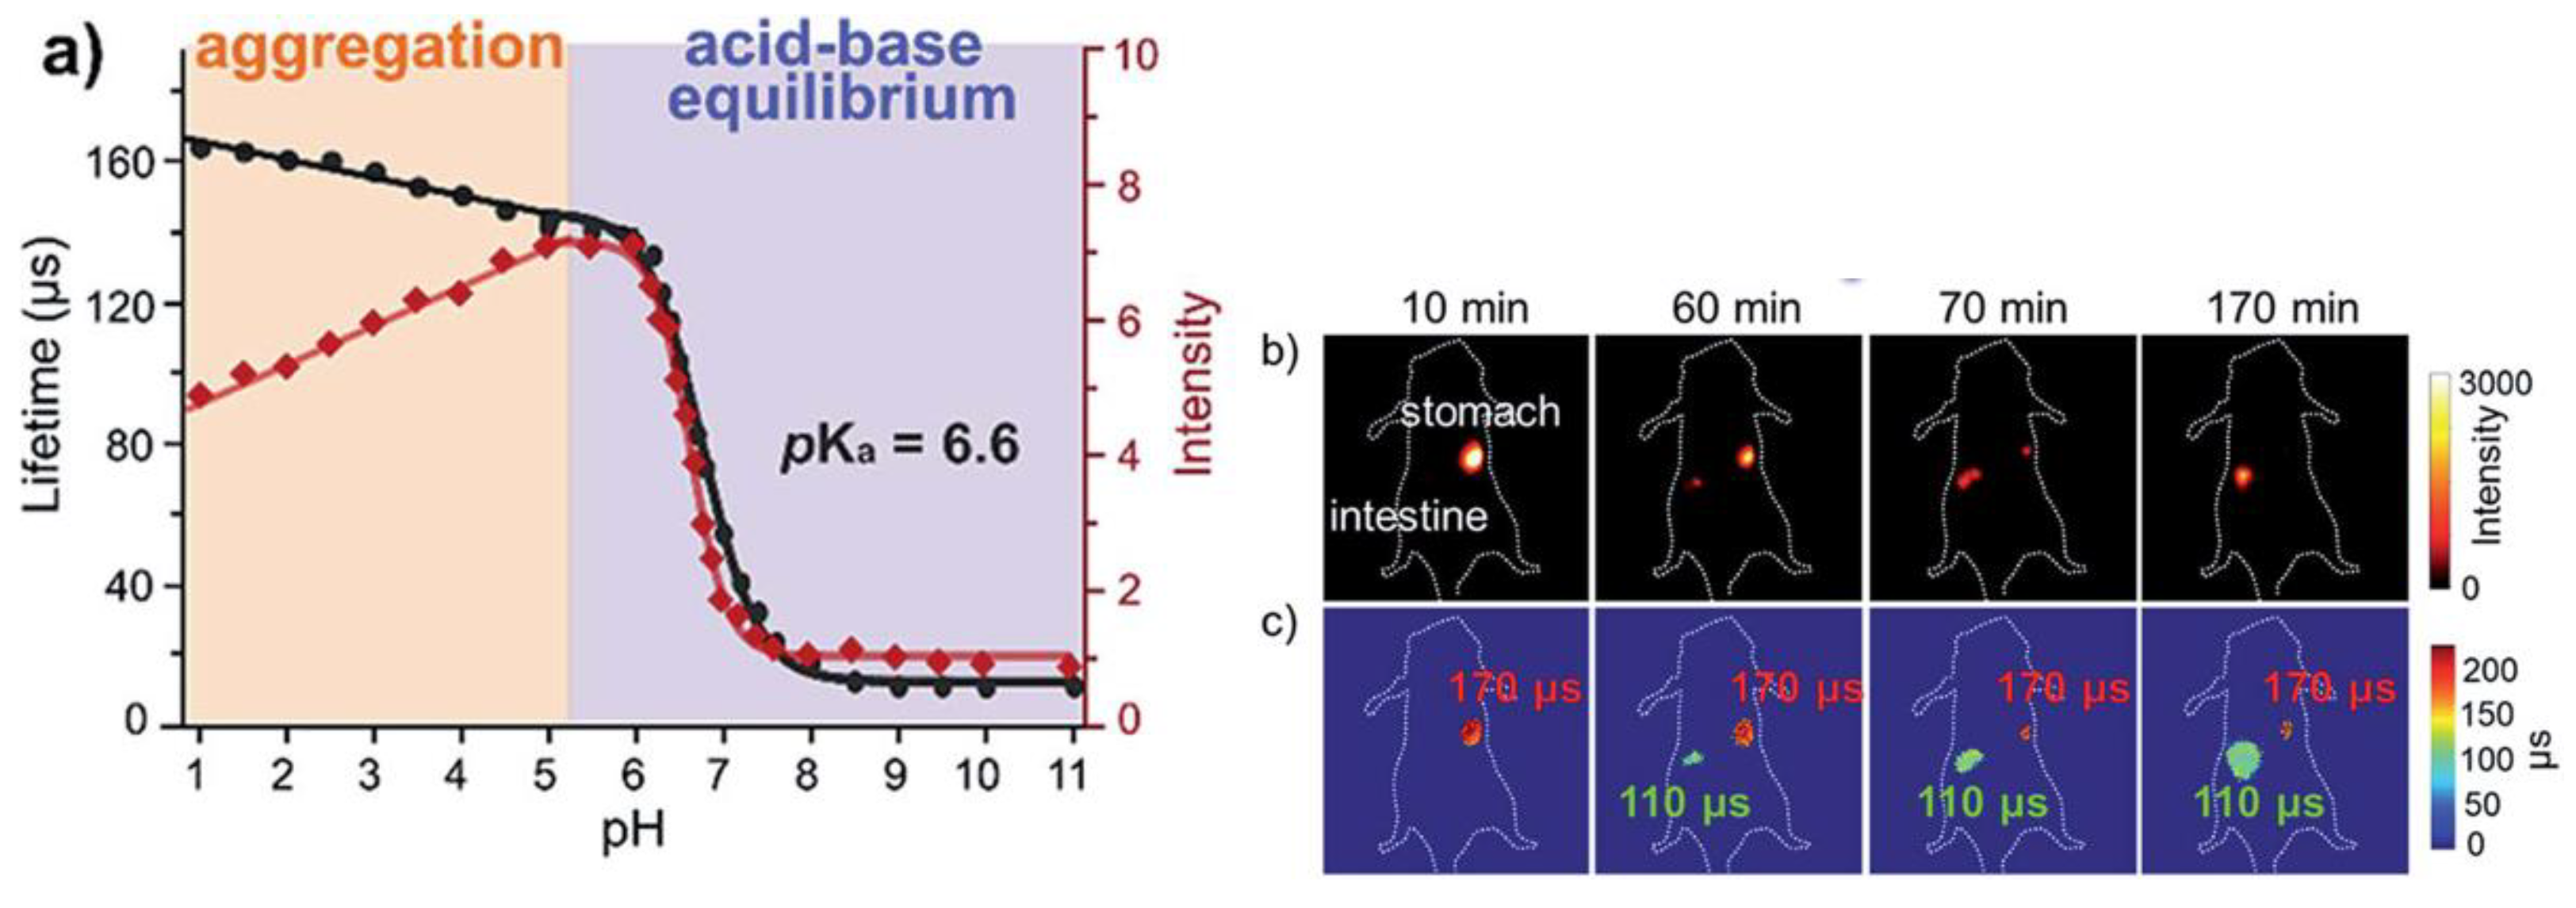
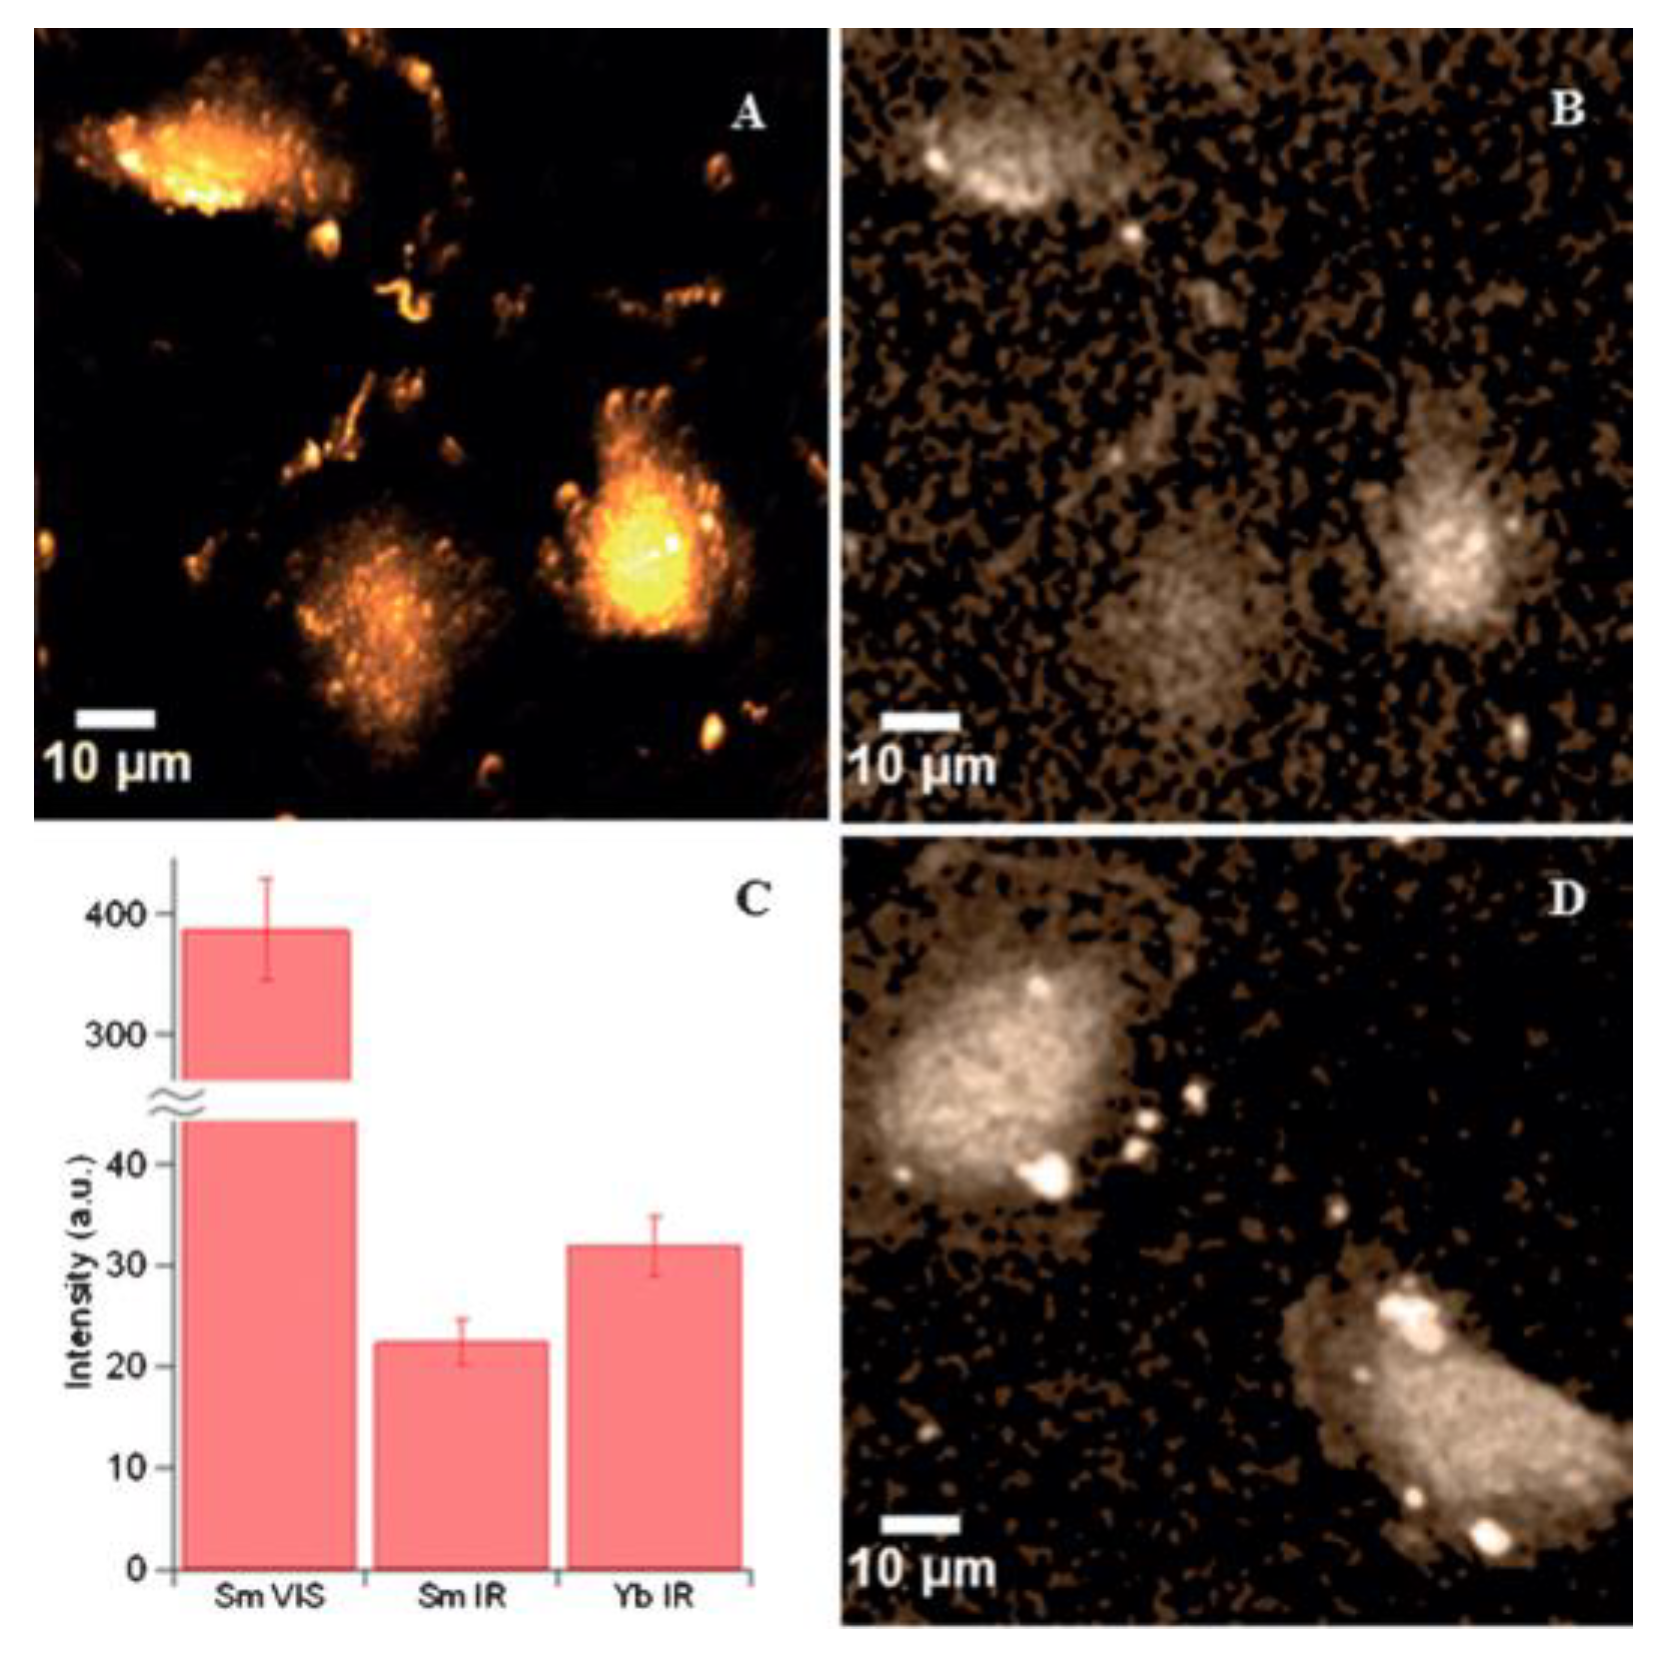
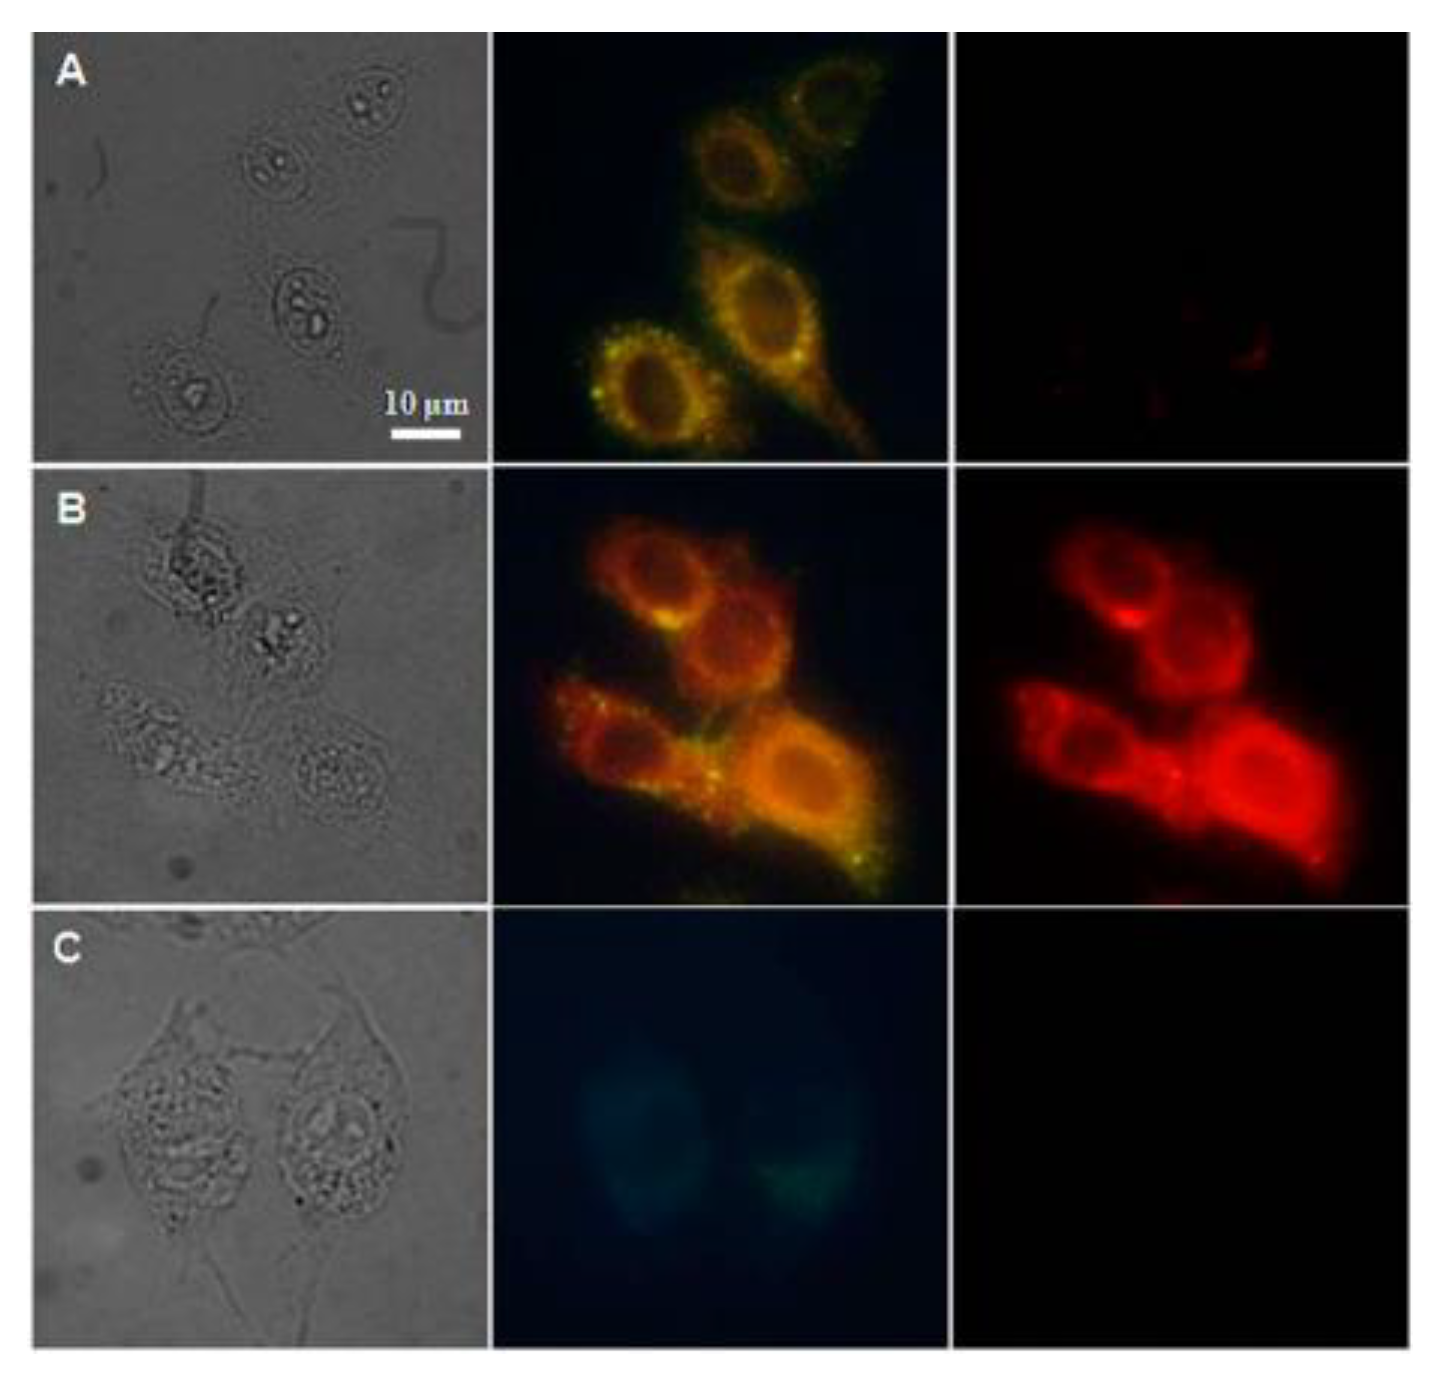
Table 1.
Summary of advantages and disadvantages of WF and CF microscopy.
| Technique | Advantages | Disadvantages |
|---|---|---|
| WF microscopy | Wide range of excitation wavelengths, low cost | Does not allow the construction of 3D images, usually low signal-to-noise ratio |
| CF microscopy | Allows the construction of 3D images, high signal-to-noise ratio | The excitation wavelengths are restricted to specific wavelengths, high cost |
Table 2.
Formula, symmetry operation and selection rules of the magnetic dipole, electric quadrupole and electric dipole transitions [27].
Table 2.
Formula, symmetry operation and selection rules of the magnetic dipole, electric quadrupole and electric dipole transitions [27].
| Operator | Formula | Symmetry Operation | Selection Rules | ||
|---|---|---|---|---|---|
| ΔS | ΔL | ΔJ | |||
| Magnetic dipole () | Rotation (Rx, Ry and Rz) | 0 | 0 | 0, ±1 | |
| Electric quadrupole () | Product (xy, xz, yz, x2 − y2) | 0 | 0, ±1, ±2 | 0, ±1, ±2 | |
| Electric dipole () | (x, y and z) | 0 | ≤ 6 | ≤ 6 (2, 4, 6) | |
Table 3.
Cell line names and abbreviations.
| Cell Line | Abbreviation | Cell Line | Abbreviation |
|---|---|---|---|
| Human liver carcinoma | Hepg2 | Glioblastoma | NG97 |
| Human hepatic cells | L02 | Human pancreatic cancer | PANC1 |
| Mouse skin fibroblast | NIH-3T3 | ||
| Chinese hamster ovarian | CHO | Cervical cancer | HeLa |
| Non-small human lung carcinoma | H460 | Abelson murine leukemia virus-induced tumor | RAW 264.7 |
| Mouse fibroblast | L929 |
© 2020 by the author. Licensee MDPI, Basel, Switzerland. This article is an open access article distributed under the terms and conditions of the Creative Commons Attribution (CC BY) license (http://creativecommons.org/licenses/by/4.0/).
Share and Cite
MDPI and ACS Style
Monteiro, J.H.S.K. Recent Advances in Luminescence Imaging of Biological Systems Using Lanthanide(III) Luminescent Complexes. Molecules 2020, 25, 2089. https://0-doi-org.brum.beds.ac.uk/10.3390/molecules25092089
AMA Style
Monteiro JHSK. Recent Advances in Luminescence Imaging of Biological Systems Using Lanthanide(III) Luminescent Complexes. Molecules. 2020; 25(9):2089. https://0-doi-org.brum.beds.ac.uk/10.3390/molecules25092089
Chicago/Turabian StyleMonteiro, Jorge H. S. K. 2020. "Recent Advances in Luminescence Imaging of Biological Systems Using Lanthanide(III) Luminescent Complexes" Molecules 25, no. 9: 2089. https://0-doi-org.brum.beds.ac.uk/10.3390/molecules25092089