
Research on Very Volatile Organic Compounds and Odors from Veneered Medium Density Fiberboard Coated with Water-Based Lacquers

 , ,
, ,
Abstract
:1. Introduction
2. Results and Discussion
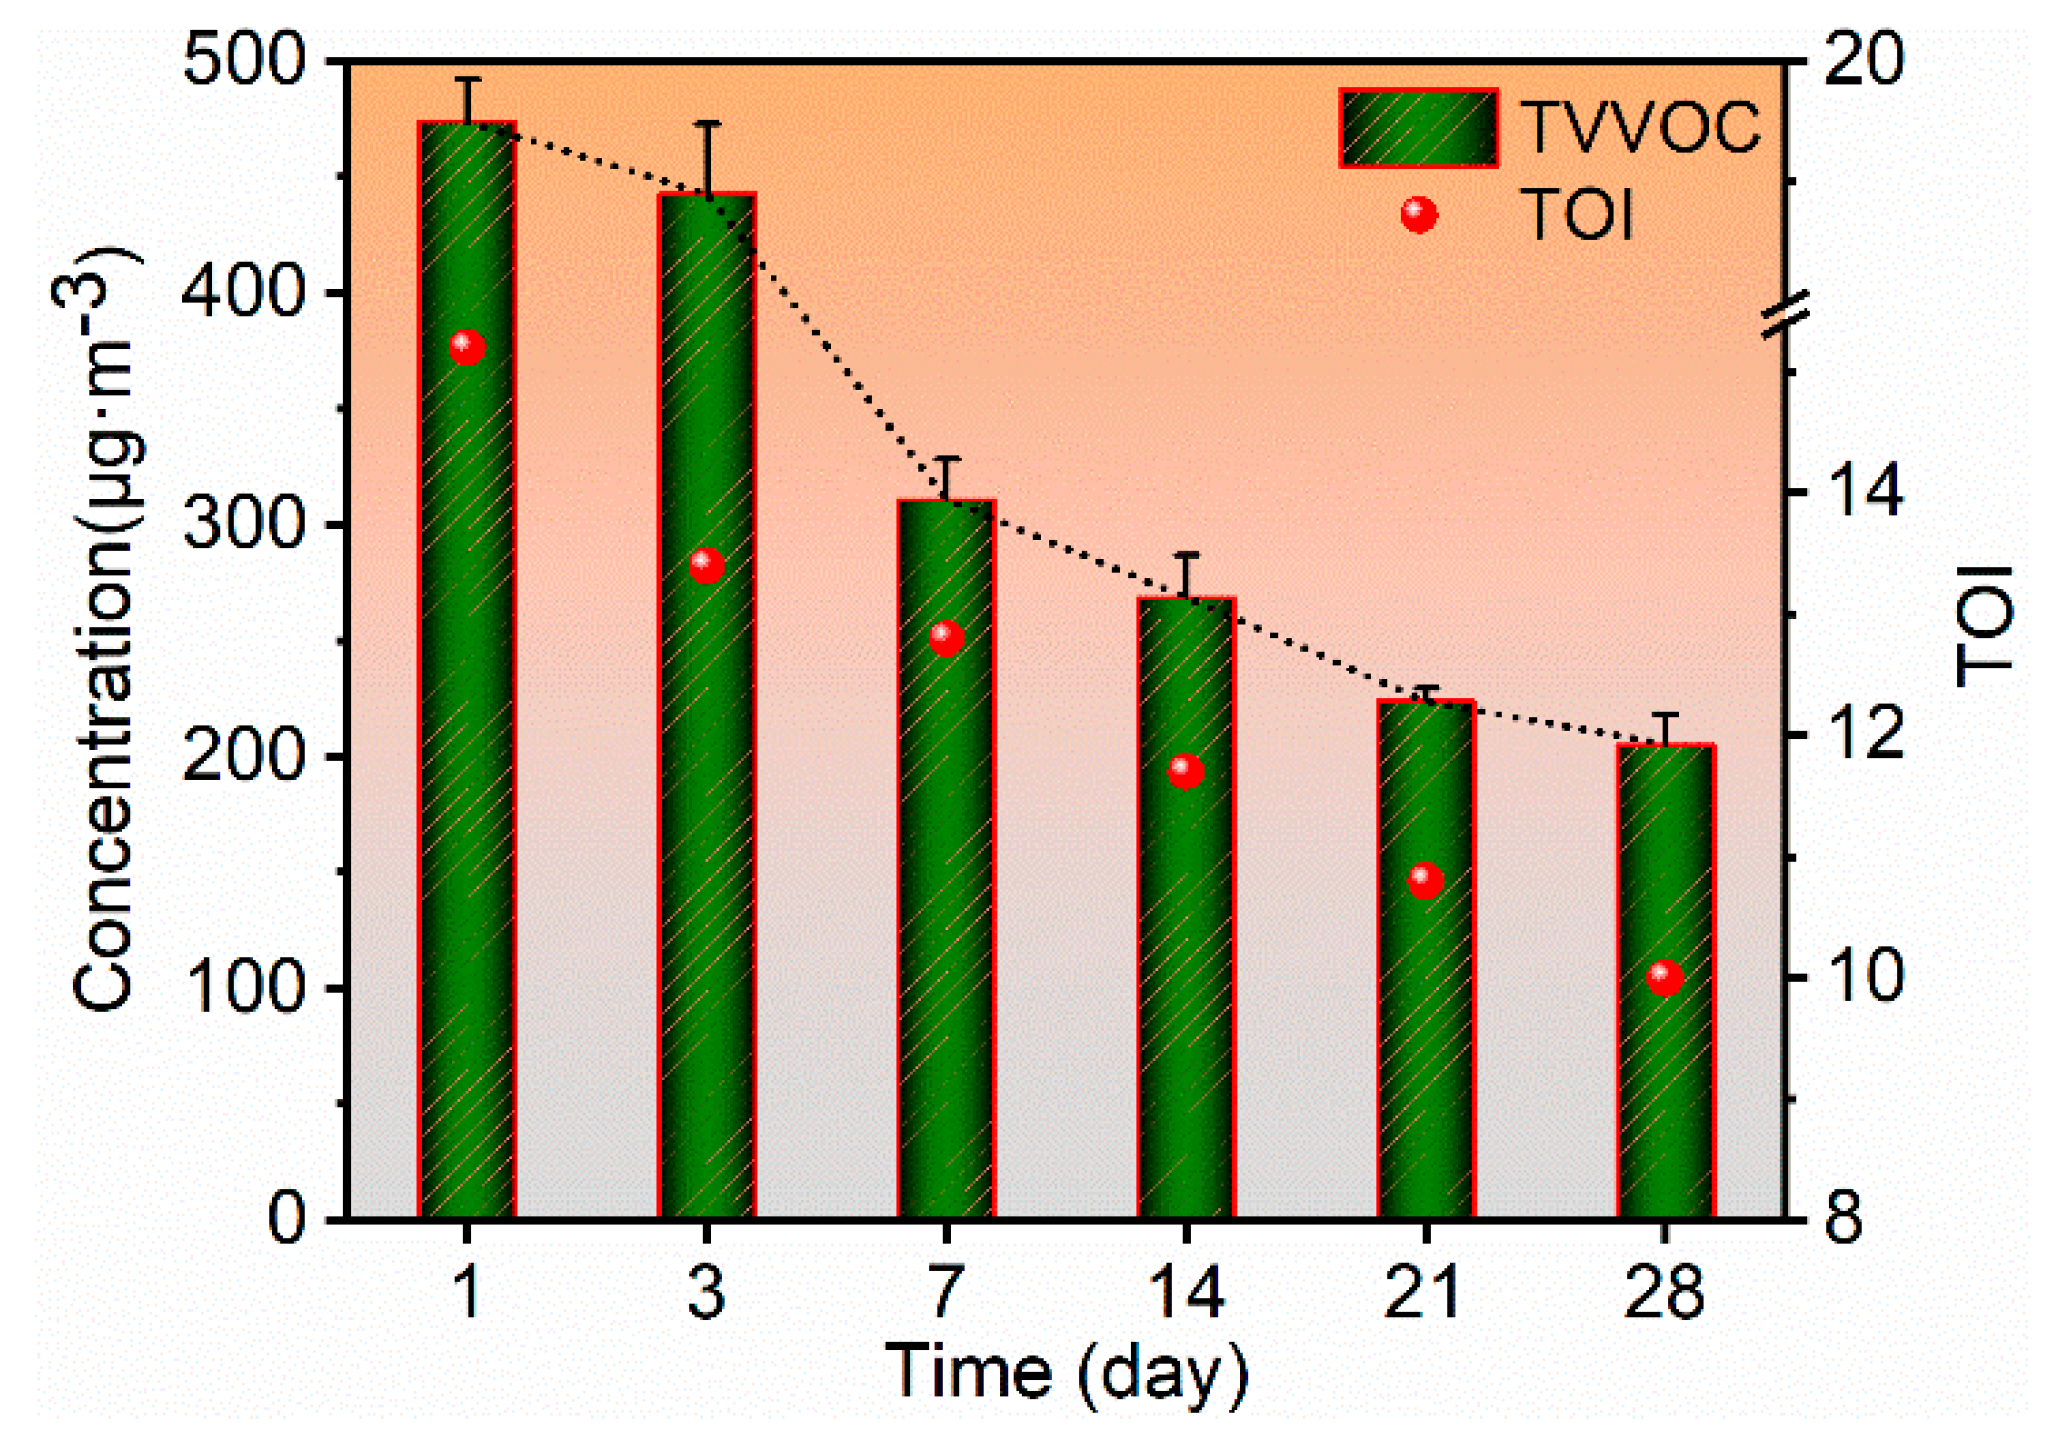
2.1. TVVOC and TOI of WB-MDF
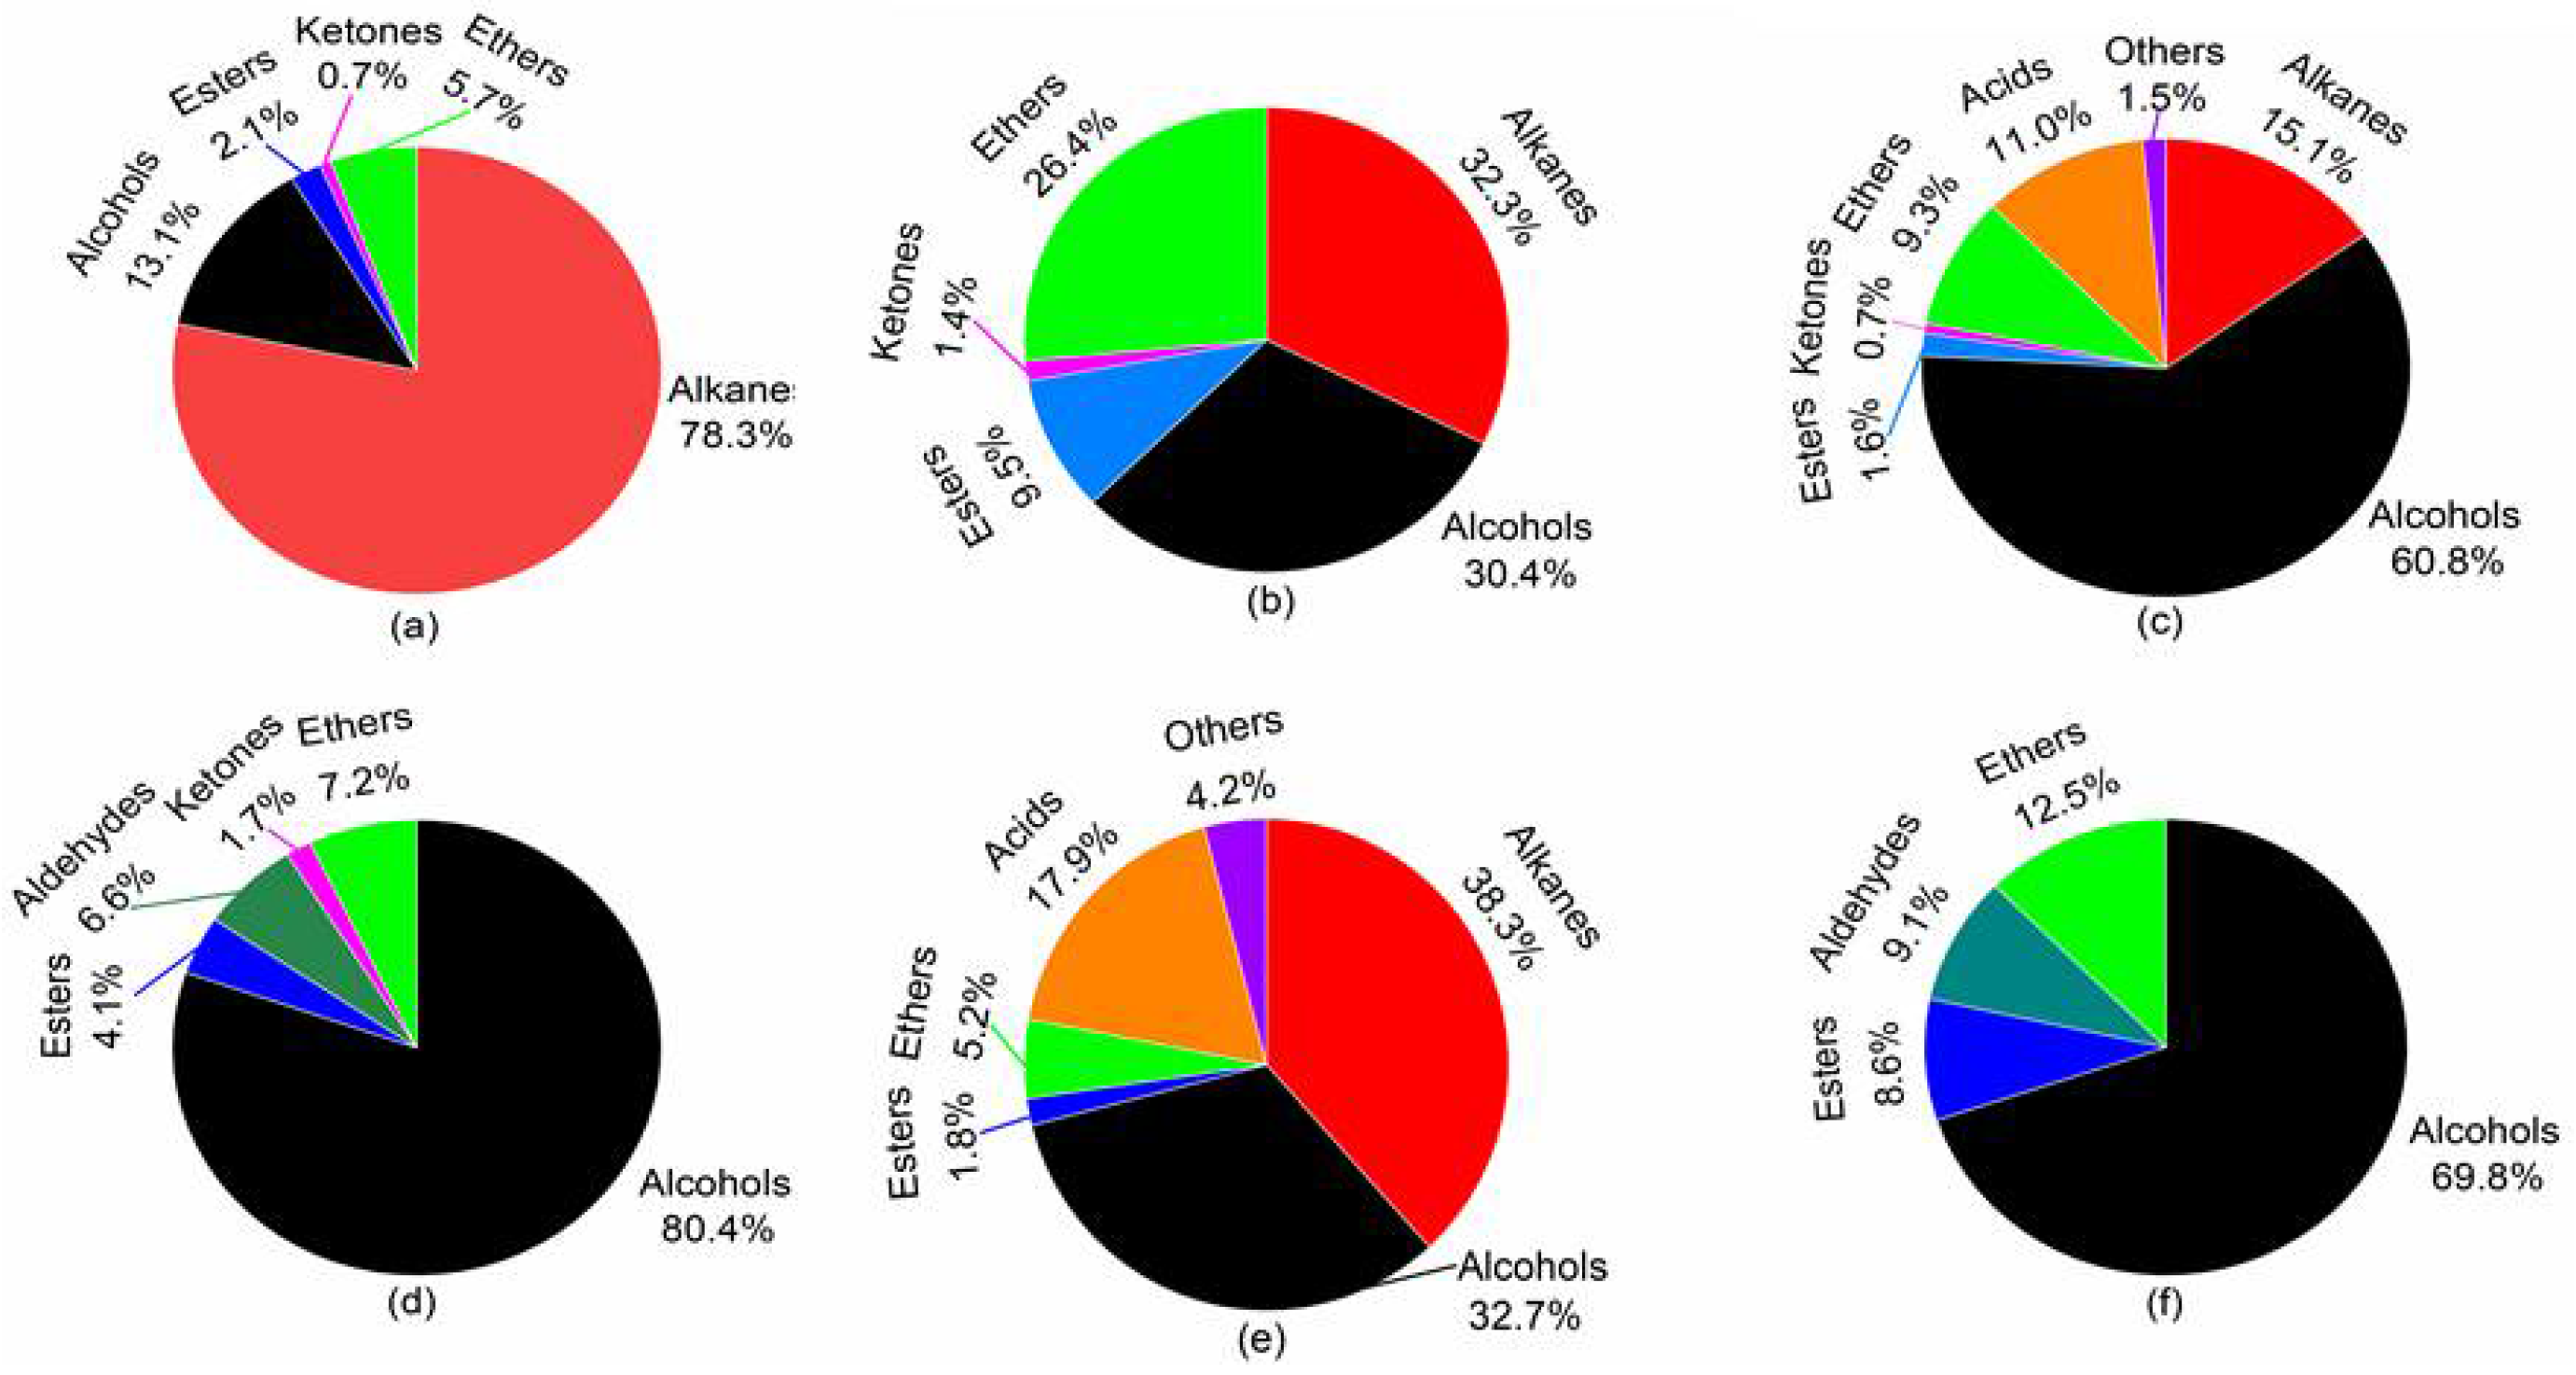
2.2. VVOC Composition of WB-MDF
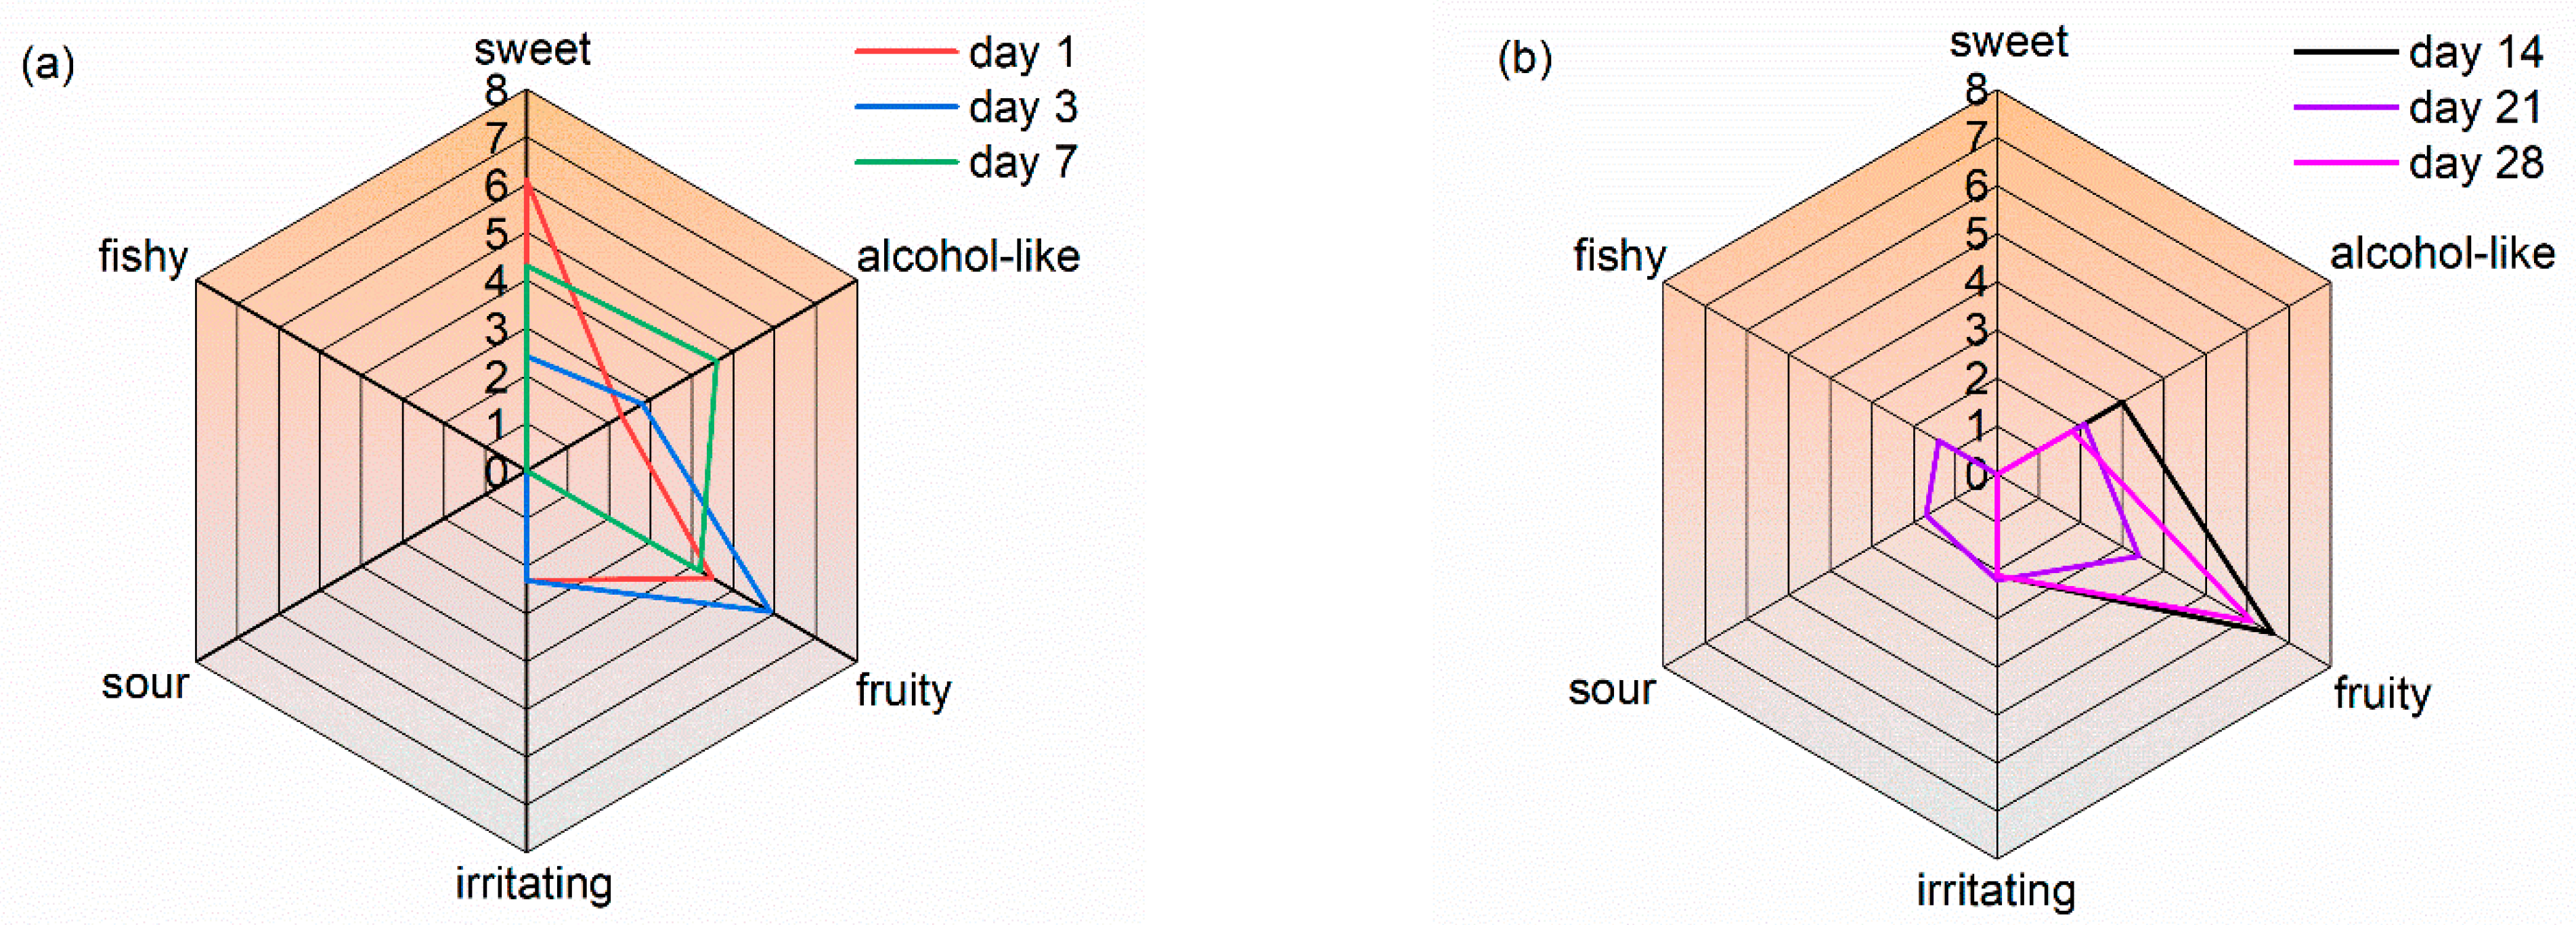
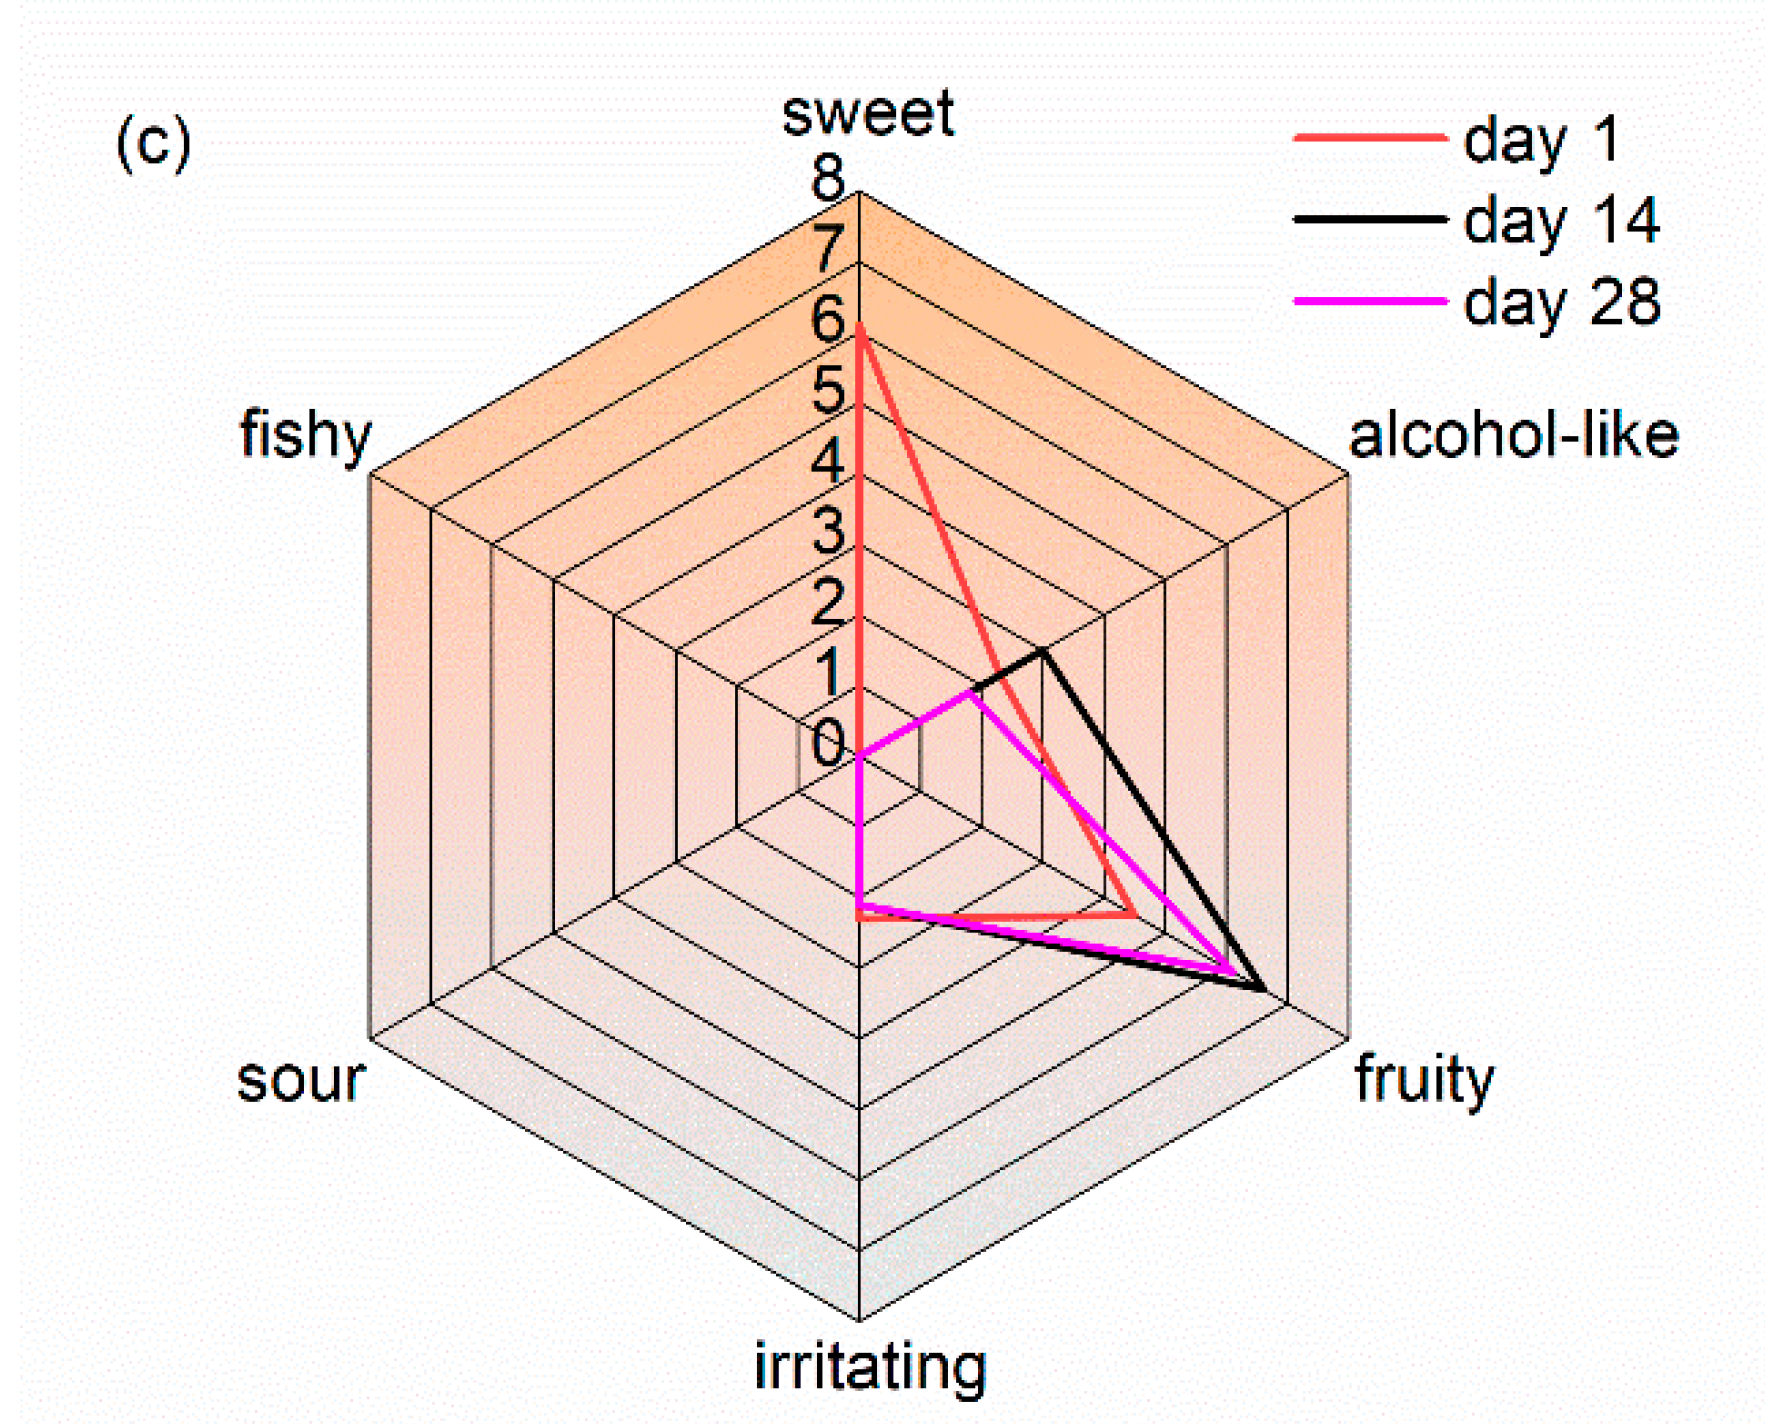
2.3. Identification of Odor Compounds of WB-MDF
3. Materials and Methods
3.1. Materials
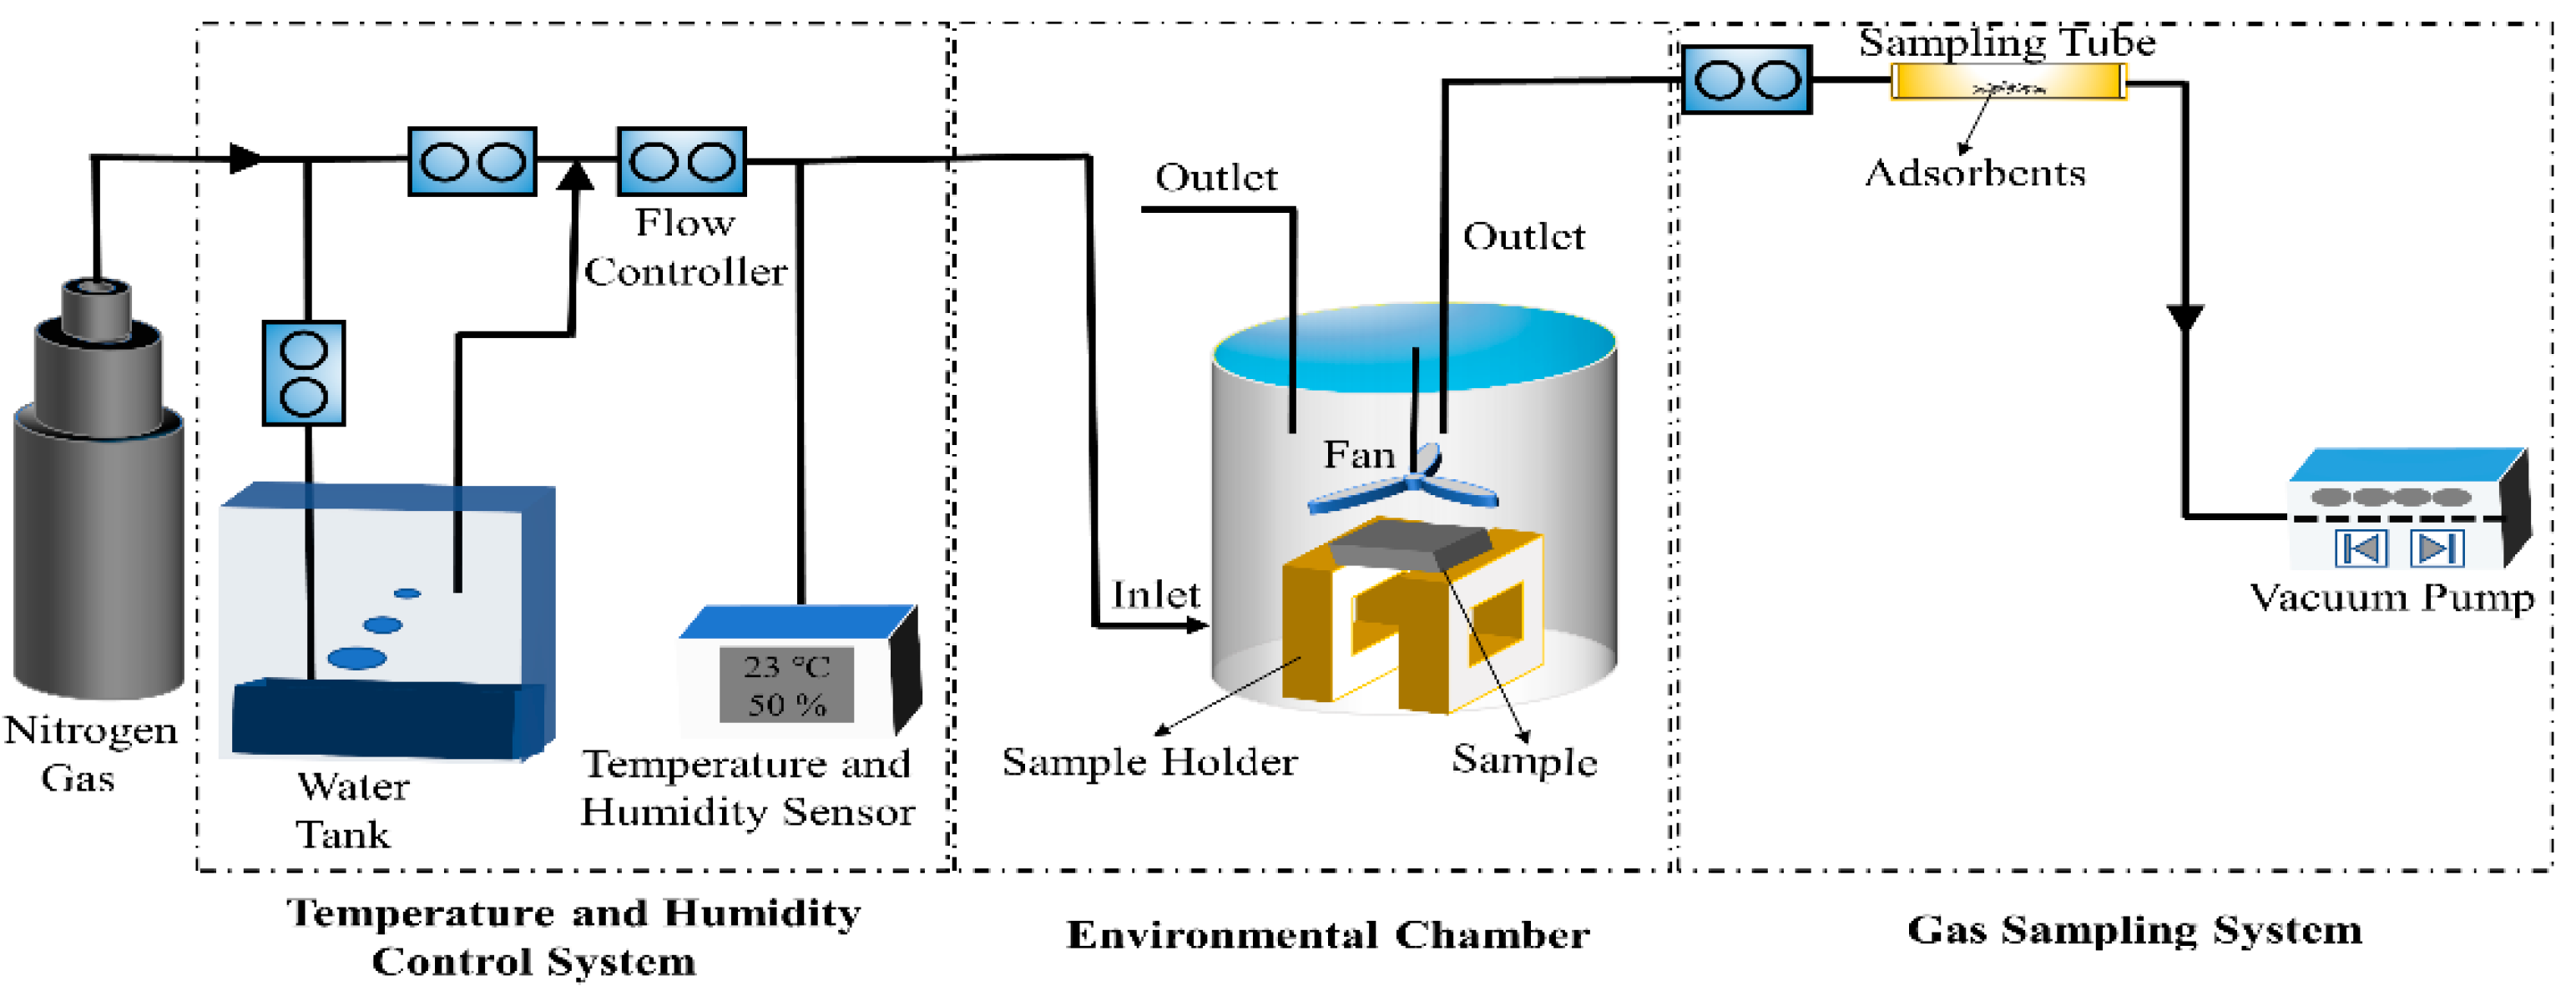
3.2. Sampling
3.3. Analytical Method for GC-MS
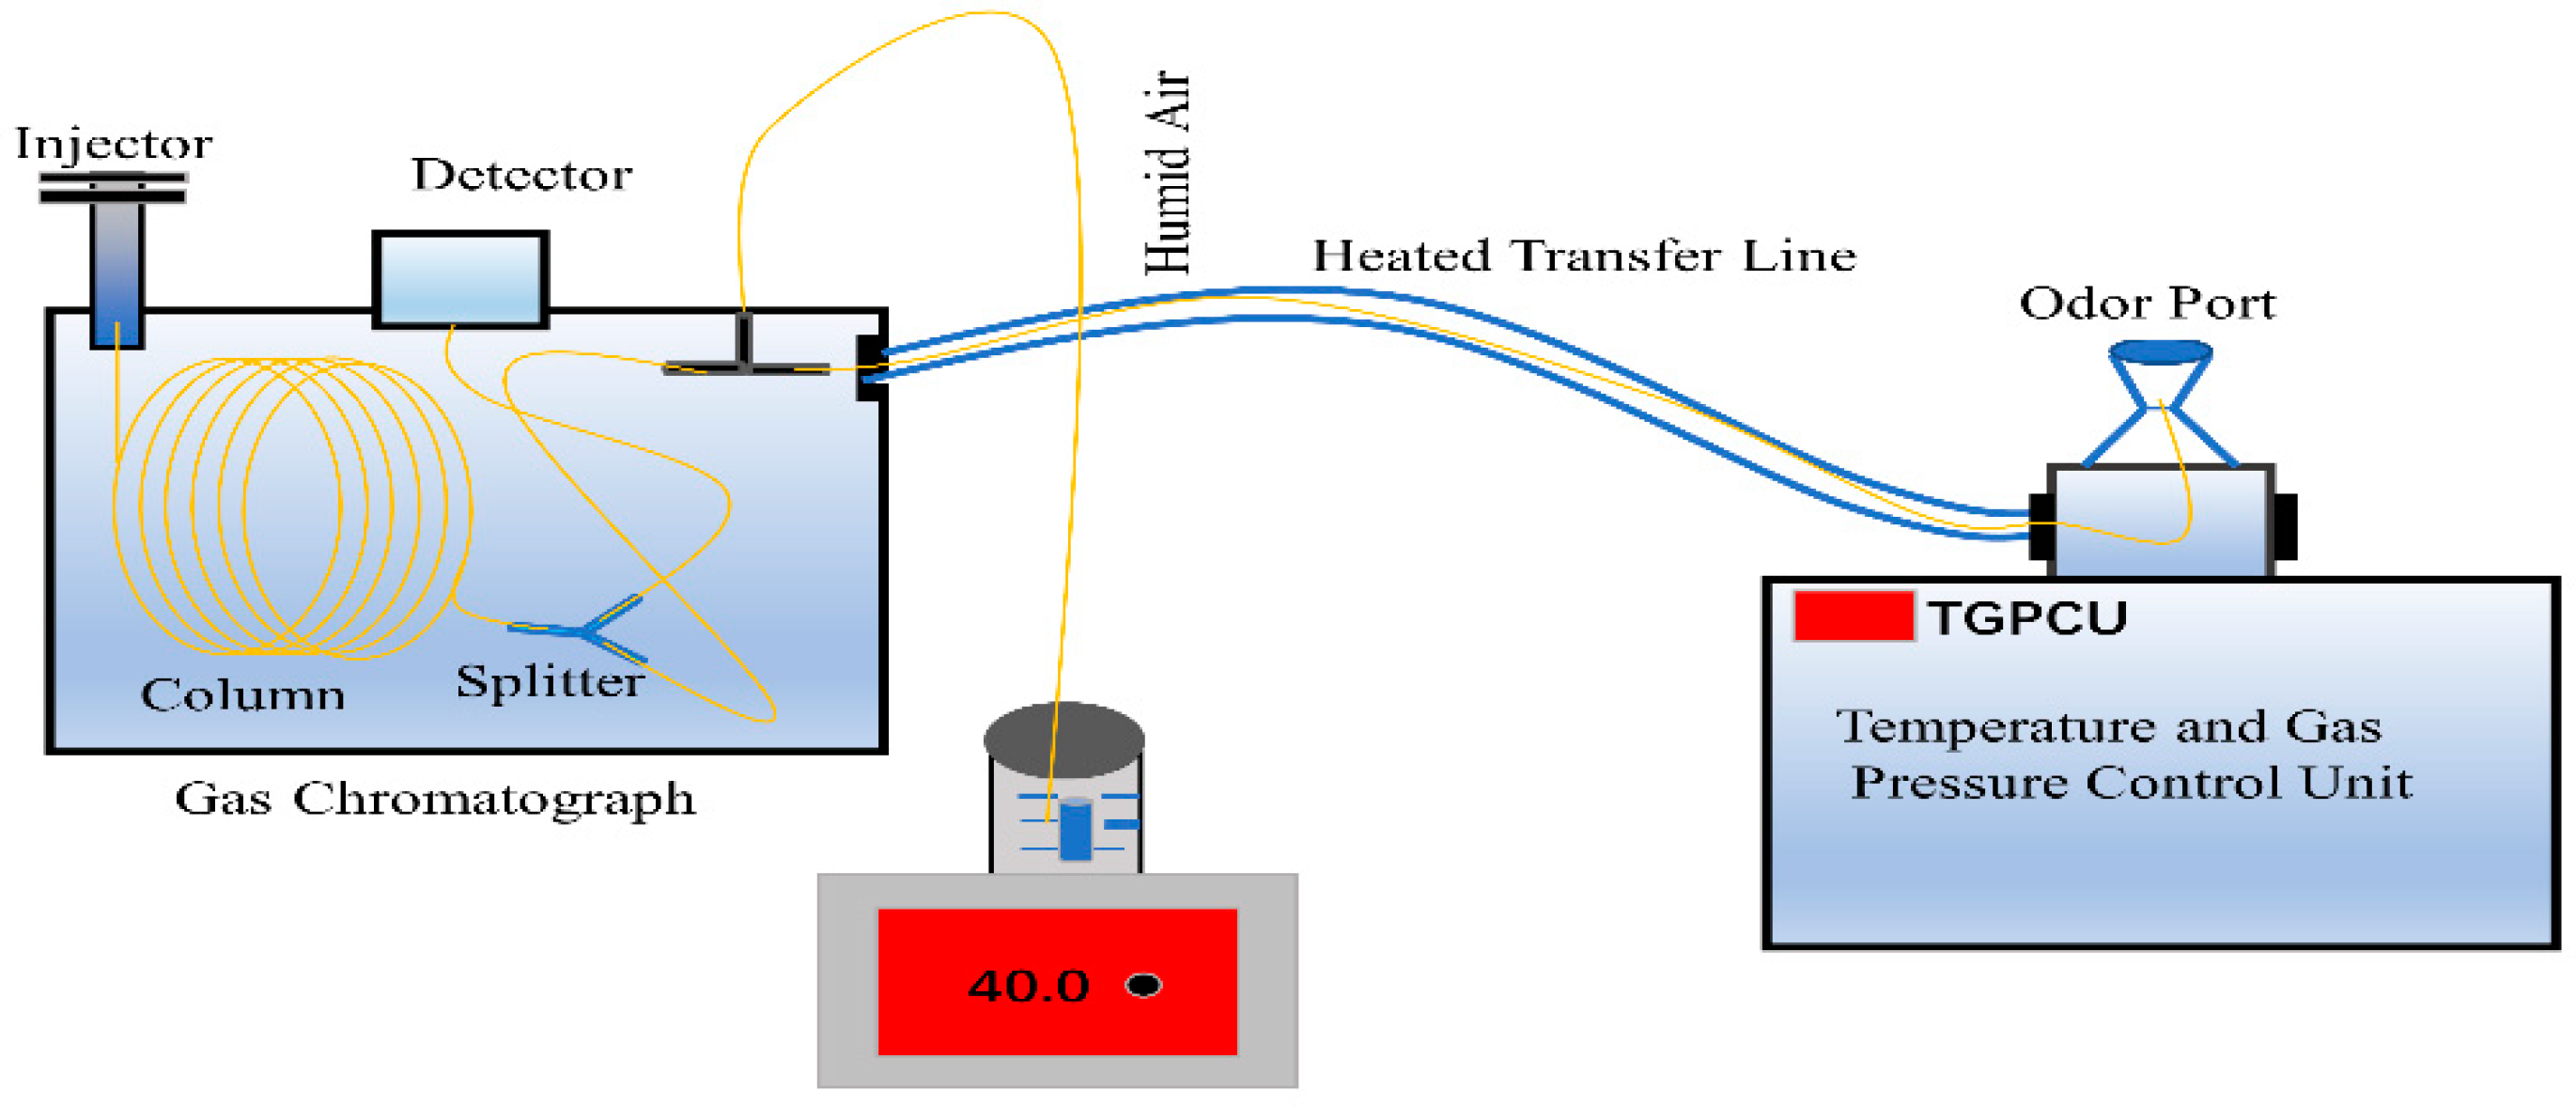
3.4. Analytical Method for GC-O
4. Conclusions
Author Contributions
Funding
Institutional Review Board Statement
Informed Consent Statement
Data Availability Statement
Acknowledgments
Conflicts of Interest
Sample Availability
References
- Adamova, T.; Hradecky, J.; Panek, M. Volatile Organic Compounds (VOCs) from wood and wood-based panels: Methods for evaluation, potential health risks, and mitigation. Polymers 2020, 12, 2289. [Google Scholar] [CrossRef] [PubMed]
- Aatamila, M.; Verkasalo, P.K.; Korhonen, M.J.; Suominen, A.L.; Hirvonen, M.R.; Viluksela, M.K.; Nevalainen, A. Odour annoyance and symptoms among residents living near waste treatment centres. Environ. Res. 2011, 111, 164–170. [Google Scholar] [CrossRef] [PubMed]
- Brattoli, M.; Cisternino, E.; Dambruoso, P.R.; De Gennaro, G.; Giungato, P.; Mazzone, A.; Palmisani, J.; Tutino, M. Gas chromatography analysis with olfactometric detection (GC-O) as a useful methodology for chemical characterization of odorous compounds. Sensors 2013, 13, 16759–16800. [Google Scholar] [CrossRef] [PubMed] [Green Version]
- Yan, M.; Zhai, Y.; Shi, P.; Hu, Y.; Yang, H.; Zhao, H. Emission of volatile organic compounds from new furniture products and its impact on human health. Hum. Ecol. Risk. Assess. 2019, 25, 1886–1906. [Google Scholar] [CrossRef]
- Kim, S.; Choi, Y.K.; Park, K.W.; Kim, J.T. Test methods and reduction of organic pollutant compound emissions from wood-based building and furniture materials. Bioresour. Technol. 2010, 101, 6562–6568. [Google Scholar] [CrossRef] [PubMed]
- Wang, Q.; Shen, J.; Zeng, B.; Wang, H. Identification and analysis of odor-active compounds from Choerospondias axillaris (Roxb.) Burtt et Hill with different moisture content levels and lacquer treatments. Sci. Rep. 2020, 10, 14856. [Google Scholar] [CrossRef] [PubMed]
- Wang, Q.; Shen, J.; Zeng, B.; Wang, H.; Wang, W. Effects of environmental conditions on the emission and odor-active compounds from Fraxinus mandshurica Rupr. Environ. Sci. Pollut. Res. 2022, 29, 30459–30469. [Google Scholar] [CrossRef]
- Xiong, J.; Chen, F.; Sun, L.; Yu, X.; Zhao, J.; Hu, Y.; Wang, Y. Characterization of VOC emissions from composite wood furniture: Parameter determination and simplified model. Build. Environ. 2019, 161, 106237. [Google Scholar] [CrossRef]
- Guo, M.; Yu, W.; Zhang, S.; Wang, H.; Wei, S. A numerical model predicting indoor volatile organic compound Volatile Organic Compounds emissions from multiple building materials. Environ. Sci. Pollut. Res. 2020, 27, 587–596. [Google Scholar] [CrossRef]
- Wang, Y.; Yang, T.; He, Z.; Sun, L.; Yu, X.; Zhao, J.; Hu, Y.; Zhang, S.; Xiong, J. A general regression method for accurately determining the key parameters of VOC emissions from building materials/furniture in a ventilated chamber. Atmos. Environ. 2020, 231, 117527. [Google Scholar] [CrossRef]
- An, T.; Huang, Y.; Li, G.; He, Z.; Chen, J.; Zhang, C. Pollution profiles and health risk assessment of VOCs emitted during e-waste dismantling processes associated with different dismantling methods. Environ. Int. 2014, 73, 186–194. [Google Scholar] [CrossRef] [PubMed]
- Liu, Y.; Shen, J.; Zhu, X.D. Optimization of processing parameters for low VOC emissions of wood-based panels. Appl. Mech. Mater. 2012, 148–149, 130–133. [Google Scholar] [CrossRef]
- AgBB. Health-Related Evaluation Procedure for Volatile Organic Compounds Emissions from Building Products; Committee for Health-related Evaluation of Building Products: Berlin, Germany, February 2015. [Google Scholar]
- Schieweck, A.; Gunschera, J.; Varol, D.; Salthammer, T. Analytical procedure for the determination of very volatile organic compounds (C3–C6) in indoor air. Anal. Bioanal. Chem. 2018, 410, 3171–3183. [Google Scholar] [CrossRef] [PubMed] [Green Version]
- Schieweck, A. Very volatile organic compounds (VVOC) as emissions from wooden materials and in indoor air of new prefabricated wooden houses. Build. Environ. 2021, 190, 107537. [Google Scholar] [CrossRef]
- Jiang, Z.; Teng, H.; Zhang, D.; Khomik, S.V.; Medvedev, S.P. On the mechanism of detonation initiations. In Shock Waves; Springer: Berlin/Heidelberg, Germany, 2009; pp. 329–334. [Google Scholar]
- Zhu, J.; Xiao, Z. Characterization of the major odor-active compounds in dry jujube cultivars by application of gas chromatography–olfactometry and odor activity value. J. Agric. Food Chem. 2018, 66, 7722–7734. [Google Scholar] [CrossRef]
- Dharmawan, J.; Kasapis, S.; Sriramula, P.; Lear, M.J.; Curran, P. Evaluation of aroma-active compounds in pontianak orange peel oil (Citrus nobilis Lour. Var. microcarpa Hassk.) by gas chromatography−olfactometry, aroma reconstitution, and omission test. J. Agric. Food Chem. 2009, 57, 239–244. [Google Scholar] [CrossRef]
- Xiao, Z.; Chen, J.; Niu, Y.; Chen, F. Characterization of the key odorants of fennel essential oils of different regions using GC–MS and GC–O combined with partial least squares regression. J. Chromatogr. B 2017, 1063, 226–234. [Google Scholar] [CrossRef]
- Bulliner, E.A.; Koziel, J.A.; Cai, L.; Wright, D. Characterization of livestock odors using steel plates, solid-phase microextraction, and multidimensional gas chromatography–mass spectrometry–olfactometry. J. Air. Waste Manag. 2006, 56, 1391–1403. [Google Scholar] [CrossRef] [Green Version]
- Wang, Q.; Shen, J.; Shao, Y.; Dong, H.; Li, Z.; Shen, X. Volatile organic compounds and odor emissions from veneered particleboards coated with water-based lacquer detected by gas chromatography-mass spectrometry/olfactometry. Eur. J. Wood Wood Prod. 2019, 77, 771–781. [Google Scholar] [CrossRef]
- Schreiner, L.; Loos, H.M.; Buettner, A. Identification of odorants in wood of Calocedrus decurrens (Torr.) Florin by aroma extract dilution analysis and two-dimensional gas chromatography–mass spectrometry/olfactometry. Anal. Bioanal. Chem. 2017, 409, 3719–3729. [Google Scholar] [CrossRef]
- Liu, Y.; Zhu, X.; Qin, X.; Wang, W.; Hu, Y.; Yuan, D. Identification and characterization of odorous volatile organic compounds emitted from wood-based panels. Environ. Monit. Assess 2020, 192, 348. [Google Scholar] [CrossRef] [PubMed]
- Dong, H.; Jiang, L.; Shen, J.; Zhao, Z.; Wang, Q.; Shen, X. Identification and analysis of odor-active substances from PVC-overlaid MDF. Environ. Sci. Pollut. Res. 2019, 26, 20769–20779. [Google Scholar] [CrossRef] [PubMed]
- Zhu, X.; Liu, Y.; Shen, J. Volatile organic compounds (VOCs) emissions of wood-based panels coated with nanoparticles modified water based varnish. Eur. J. Wood Wood Prod. 2016, 74, 601–607. [Google Scholar] [CrossRef]
- Wang, Q.; Shen, J.; Wang, H.; Zeng, B.; Wang, W. Determination of odor-active compounds from Phoebe neurantha (Hemsl.) Gamble and Osmanthus fragrans (Thunb.) Lour. by GC–MS/O and micro-chamber combined with Tenax TA and multi-bed tubes. Wood Sci. Technol. 2021, 55, 1135–1151. [Google Scholar] [CrossRef]
- Karlsson, S.; Bánhidi, Z.G.; Albertsson, A.C. Gas chromatographic detection of volatile amines found in indoor air due to putrefactive degradation of casein-containing building materials. Mater. Struct. 1989, 22, 163–169. [Google Scholar] [CrossRef]
- Ulker, O.C.; Ulker, O.; Hiziroglu, S. Volatile organic compounds (VOCs) emitted from coated furniture units. Coatings 2021, 11, 806. [Google Scholar] [CrossRef]
- Rossberg, M. Chloromethanes. Ullmann’s Encyclopedia of Industrial Chemistry, 7th ed.; John Wiley & Sons: New York, NY, USA, 2011. [Google Scholar]
- Lewis, R.J., Sr. (Ed.) Sax’s Dangerous Properties of Industrial Materials, 11th ed.; Wiley-Inter Science, Wiley & Sons, Inc.: Hoboken, NJ, USA, 2004. [Google Scholar]
- Verschueren, K. Handbook of Environmental Data on Organic Chemicals, 4th ed.; John Wiley & Sons: New York, NY, USA, 2001; Volumes 1–2, p. 359. [Google Scholar]
- Cain, W.S.; Drexler, M. Scope and evaluation of odor counteraction and masking. Ann. N. Y. Acad. Sci. 1974, 237, 427–439. [Google Scholar] [CrossRef]
- Li, S. Design of Small Environment Chamber and Study of VOC Emission Characteristic from Wood-Based Panel. Master’s Thesis, Northeast Forestry University, Harbin, China, 2013. [Google Scholar]
- Wang, Q.; Shen, J.; Cao, T.; Du, J.; Dong, H.; Shen, X. Emission chararacteristics and health risks of volatile organic compounds and odor from PVC-overlaid particleboard. Bioresources 2019, 14, 4385–4402. [Google Scholar] [CrossRef]


| Group | Number | Boiling Point (°C) | Compound | Mass Concentration (μg·m−3) | |||||
|---|---|---|---|---|---|---|---|---|---|
| 1 | 3 | 7 | 14 | 21 | 28 | ||||
| Alkanes | 1 | 75.0 | 2,3-Epoxy-2-methylbutane | 46.61 | / | 46.94 | / | / | / |
| 2 | 39.8 | Dichloromethane | 324.51 | 143.17 | / | / | / | / | |
| 3 | −0.5 | Butane | / | / | / | / | 85.65 | / | |
| Total | 371.12 | 143.17 | 46.94 | / | 85.65 | / | |||
| Alcohols | 4 | 78.3 | Ethanol | 62.01 | 134.46 | 86.19 | 170.29 | 67.51 | 57.97 |
| 5 | 117.6 | 1-Butanol | / | / | 102.64 | / | / | / | |
| 6 | 184.8 | 1,2-Propanediol | / | / | / | 45.59 | 5.81 | 85.86 | |
| Total | 62.01 | 134.46 | 188.83 | 215.88 | 73.32 | 143.83 | |||
| Esters | 7 | 100.0 | 2-Methylacrylic acid methyl ester | 5.03 | 10.93 | / | 4.78 | / | 8.16 |
| 8 | 77.2 | Ethyl acetate | 4.81 | 30.92 | 4.97 | 6.36 | 3.96 | 9.49 | |
| Total | 9.84 | 41.85 | 4.97 | 11.14 | 3.96 | 17.65 | |||
| Aldehydes | 9 | 20.8 | Acetaldehyde | / | / | / | 17.74 | / | 18.7 |
| Total | / | / | / | 17.74 | / | 18.7 | |||
| Ketones | 10 | 222.4 | 3-Methyl-2(5H)-furanone | 3.49 | 6.15 | 2.15 | 4.52 | / | / |
| Total | 3.49 | 6.15 | 2.15 | 4.52 | / | / | |||
| Ethers | 11 | 66.0 | Tetrahydrofuran | 27.23 | 117.06 | 29.02 | 19.34 | 11.59 | 25.79 |
| Total | 27.23 | 117.06 | 29.02 | 19.34 | 11.59 | 25.79 | |||
| Acids | 12 | 149.0 | N-Formylglycine | / | / | 34.14 | / | 26.06 | / |
| 13 | 117.9 | Acetic acid | / | / | / | / | 13.91 | / | |
| Total | / | 34.14 | / | 39.97 | / | ||||
| Others | 14 | 153.0 | N, N-Dimethylformamide | / | / | / | / | 4.86 | / |
| 15 | 101.0 | 1,4-Dioxane | / | / | 4.78 | / | 4.56 | / | |
| Total | / | / | 4.78 | / | 9.32 | / | |||
| TVVOC | 473.69 | 442.69 | 310.83 | 268.62 | 223.91 | 205.27 | |||
| No. | Chemical Formula | Compound | RI | Odor Characteristic | Odor Intensity | |||||
|---|---|---|---|---|---|---|---|---|---|---|
| 1 | 3 | 7 | 14 | 21 | 28 | |||||
| 1 | CH2Cl2 | Dichloromethane | <600 | sweet | 3.4 | 2.4 | x | x | x | x |
| 2 | C5H10O | 2,3-Epoxy-2-methylbutane | <600 | sweet | 2.7 | x | 2.5 | x | x | x |
| 3 | C2H6O | Ethanol | <600 | alcohol-like | 2.3 | 2.8 | 2.5 | 3.0 | 2.1 | 1.8 |
| 4 | C4H8O2 | Ethyl acetate | <600 | fruity | 1.8 | 2.7 | 1.8 | 2.1 | 1.6 | 1.8 |
| 5 | C5H8O2 | 2-Methylacrylic acid methyl ester | 701 | pungent, irritant | 2.3 | 2.3 | x | 2.1 | x | 2.1 |
| 6 | C4H8O | Tetrahydrofuran | 627 | fruity, ether-like | 2.7 | 3.2 | 2.4 | 2.3 | 1.8 | 2.1 |
| 7 | C4H10O | 1-Butanol | 647 | alcohol-like | x | x | 2.1 | x | x | x |
| 8 | C4H8O2 | 1,4-Dioxane | 700 | sweet | x | x | 1.8 | x | x | x |
| 9 | C2H4O | Acetaldehyde | <600 | fruity | x | x | x | 6 | x | 2.2 |
| 10 | C4H10 | Butane | <600 | irritating | x | x | x | x | 2.2 | x |
| 11 | C2H4O2 | Acetic acid | <600 | sour, vinegar-like | x | x | x | x | 1.7 | x |
| 12 | C3H7NO | N, N-Dimethylformamide | 772 | fishy | x | x | x | x | 1.4 | x |
Publisher’s Note: MDPI stays neutral with regard to jurisdictional claims in published maps and institutional affiliations. |
© 2022 by the authors. Licensee MDPI, Basel, Switzerland. This article is an open access article distributed under the terms and conditions of the Creative Commons Attribution (CC BY) license (https://creativecommons.org/licenses/by/4.0/).
Share and Cite
Wang, W.; Shen, X.; Zhang, S.; Lv, R.; Liu, M.; Xu, W.; Chen, Y.; Wang, H. Research on Very Volatile Organic Compounds and Odors from Veneered Medium Density Fiberboard Coated with Water-Based Lacquers. Molecules 2022, 27, 3626. https://0-doi-org.brum.beds.ac.uk/10.3390/molecules27113626
Wang W, Shen X, Zhang S, Lv R, Liu M, Xu W, Chen Y, Wang H. Research on Very Volatile Organic Compounds and Odors from Veneered Medium Density Fiberboard Coated with Water-Based Lacquers. Molecules. 2022; 27(11):3626. https://0-doi-org.brum.beds.ac.uk/10.3390/molecules27113626
Chicago/Turabian StyleWang, Weidong, Xiwei Shen, Siqi Zhang, Ruixue Lv, Ming Liu, Wang Xu, Yu Chen, and Huiyu Wang. 2022. "Research on Very Volatile Organic Compounds and Odors from Veneered Medium Density Fiberboard Coated with Water-Based Lacquers" Molecules 27, no. 11: 3626. https://0-doi-org.brum.beds.ac.uk/10.3390/molecules27113626