Application of a Flow-Induced Stress Wave and Investigation of Associated Injuries on Cell Monolayers Using a Parallel Plate Flow Chamber

 ,
, 
Abstract
:1. Introduction
2. Procedure
2.1. Cell Culture
- Coating 40 mm Diameter Coverslips with CollagenNote: 40 mm coverslips have to be used as they are compatible with the apparatus (Bioptechs FCS2 Flow Chamber). These are the bottom coverslips that we seed the cells on.
- Coverslips’ Preparation
- Coverslips can be sterilized via different sterilization methods; here, we used autoclaving at 121 °C for 30 min.Note: The steps below have to be performed in a biological hood under sterilized conditions to prevent contamination.
- Prepare (25 µL/mL) collagen solution using Collagen I Rat Protein, Tail (ThermoFisher scientific, CAT# A1048301). The stock solution is 3 mg/mL, and to prepare a 25 µL/mL collagen solution, dilute 416 µL collagen solution in 50 mL distilled autoclaved water.
- Place the cover slips in individual well plates (here, we used 60 mm diameter wells to fit 40 mm coverslips) and add a total of 2 mL of the coating solution to each well. Cover the plates and leave the coverslips to incubate with the collagen coating solution for 1 h at room temperature.Note: Collagen coating is critical as cells might detach while being exposed to bubble flow-induced stresses in the flow chamber, so, it is necessary to prevent such detachment. Other matrices, like poly-L-lysine or fibronectin, can be used in case of unavailability of collagen.
- Wash coverslips with 1 mL of PBS (Phosphate Buffer saline) and allow them to air dry (around 15 min).
- Seeding Epithelial Cells on Coverslips
2.2. Harvesting
- To harvest A549 cells at a density of 5 × 10⁴ cells/mL and 149 L2 cells at a density of 3 × 10⁴ cells/mL, the following protocols should be followed.Note: This protocol is for A549 (ATCC CCL-185) and L2 (ATCC CCL-149) lung epithelial cells. A549 cells are accepted as type-2 alveolar epithelial cells, whereas L2 cells are accepted as type-1 [11]. Type-1 cells comprise ~95% of the alveolar surface area and function mainly in gas exchange, whereas type-2 cells make up ~5% of the alveolar surface area and are necessary for surfactant cytokine synthesis. To culture A549 or L2 cells, ATCC recommends Ham’s F12K media (Thermofisher scientific, CAT# 21127022) supplemented with 10% fetal bovine serum (FBS) and 1% antibiotic and antifungal solution (Thermofisher scientific, Cat 15240062).For cells stored in liquid nitrogen:
- Take the cells (cryotube) from liquid nitrogen and allow them to thaw.
- Add pre-warmed 1 mL media to the cryotube and transfer it all to a 15 mL tube.
- Repeat step 2 for two to three times to assure all cells have been transferred.
- Centrifuge the tube at 16.1 g for 5 min.
- Discard the supernatant and keep the pellet.
- Re-suspend the pallet in 1 mL media.
- Prepare two T25 flasks for each thawed cryotube. Add 5 mL media to each flask.
- Add 500 µL from the cell suspension to each T25 culture flask (Thermofisher scientific, Cat 156367).Note: The amounts of cells added will depend on the number of cells stored. The seeding density of both 149L2 and A549 should be cells/mL in a T25 flask.
- Incubate the flasks in a 37 °C incubator supplemented with 5% CO2 and 95% air until they become confluent.Note: The media needs to be changed every 2–3 days.
For confluent cells grown in a T25 culture flask:- Discard the media, then wash the cells twice with pre-warmed 5 mL PBS (wait around 30 s in between each wash).
- Add 1–2 mL of 0.25% trypsin solution (Thermofisher scientific, Cat 25200056) and incubate the cells in the incubator for 5 min.
- Check the cells under the microscope for cell detachment, if the cells are floating (detached), add 5 mL media (with FBS) and transfer the media with cells to a 15 mL tube.
- Centrifuge the tube at 16.1 g for 5 min.
- Discard the supernatant and keep the pellet.Note: If you are using a T75 flask, the same protocol is applied but with 3 mL 0.25% trypsin solution, and add 7 mL media after cell detachment (in step 3).
- After harvesting, re-suspend the pellet in 1 mL of pre-warmed complete media.
- Count the number of cells needed to become confluent (using a trypan blue-hemocytometer or automated counting).For manual counting using a hemocytometer:
- Add 80 µL of trypan blue to a 1.5 mL Eppendorf tube and 20 µL of the cell suspension and mix well.
- Place a coverslip on the top of the hemocytometer slide.
- Insert 10 µL of the suspension to one side of the hemocytometer (the suspension is added inside the groove).Note: For more accurate counting, the suspension is loaded into both sides of the hemocytometer, thus eight gridded areas are counted.
- Count live cells of four gridded areas under the microscope and record an average number of cells for the four areas.Note: Live cells appear non-blue when stained with trypan blue, as trypan blue gets into dead cells and stains them. Only live cells are counted.
- To find the concentration of cells suspended in the cell/mL unit, use Equation (1).Note: For CCL-149 (known as L2) rat lung cells, a concentration of 8 × 10⁴ cells/mL and 2 mL cell media can be used for the cells to become confluent in four days. For CCL-185 (known as A549) cells, a concentration of 1.4 × 10⁴ cells/cm2 with 2 mL media is used for the cells to become confluent in four days.where the dilution factor in our case is 5, and 104 is the hemocytometer constant.Cell concentration (cell/mL) = Average # of cells counted in 4 or 8 areas × dilution factor × 104
- Place sterilized 40 mm collagen-coated coverslips on 50 mm Petri dishes.
- Add media to the petri dish and then add the required number of cells.Note: Homogenous cell distribution is critical; to avoid cells growing in one area only, the dishes must be shaken, or the cells must be mixed well with the media.
- Incubate flasks at optimum growth conditions (5% CO2, 95% air, and at 37 °C).
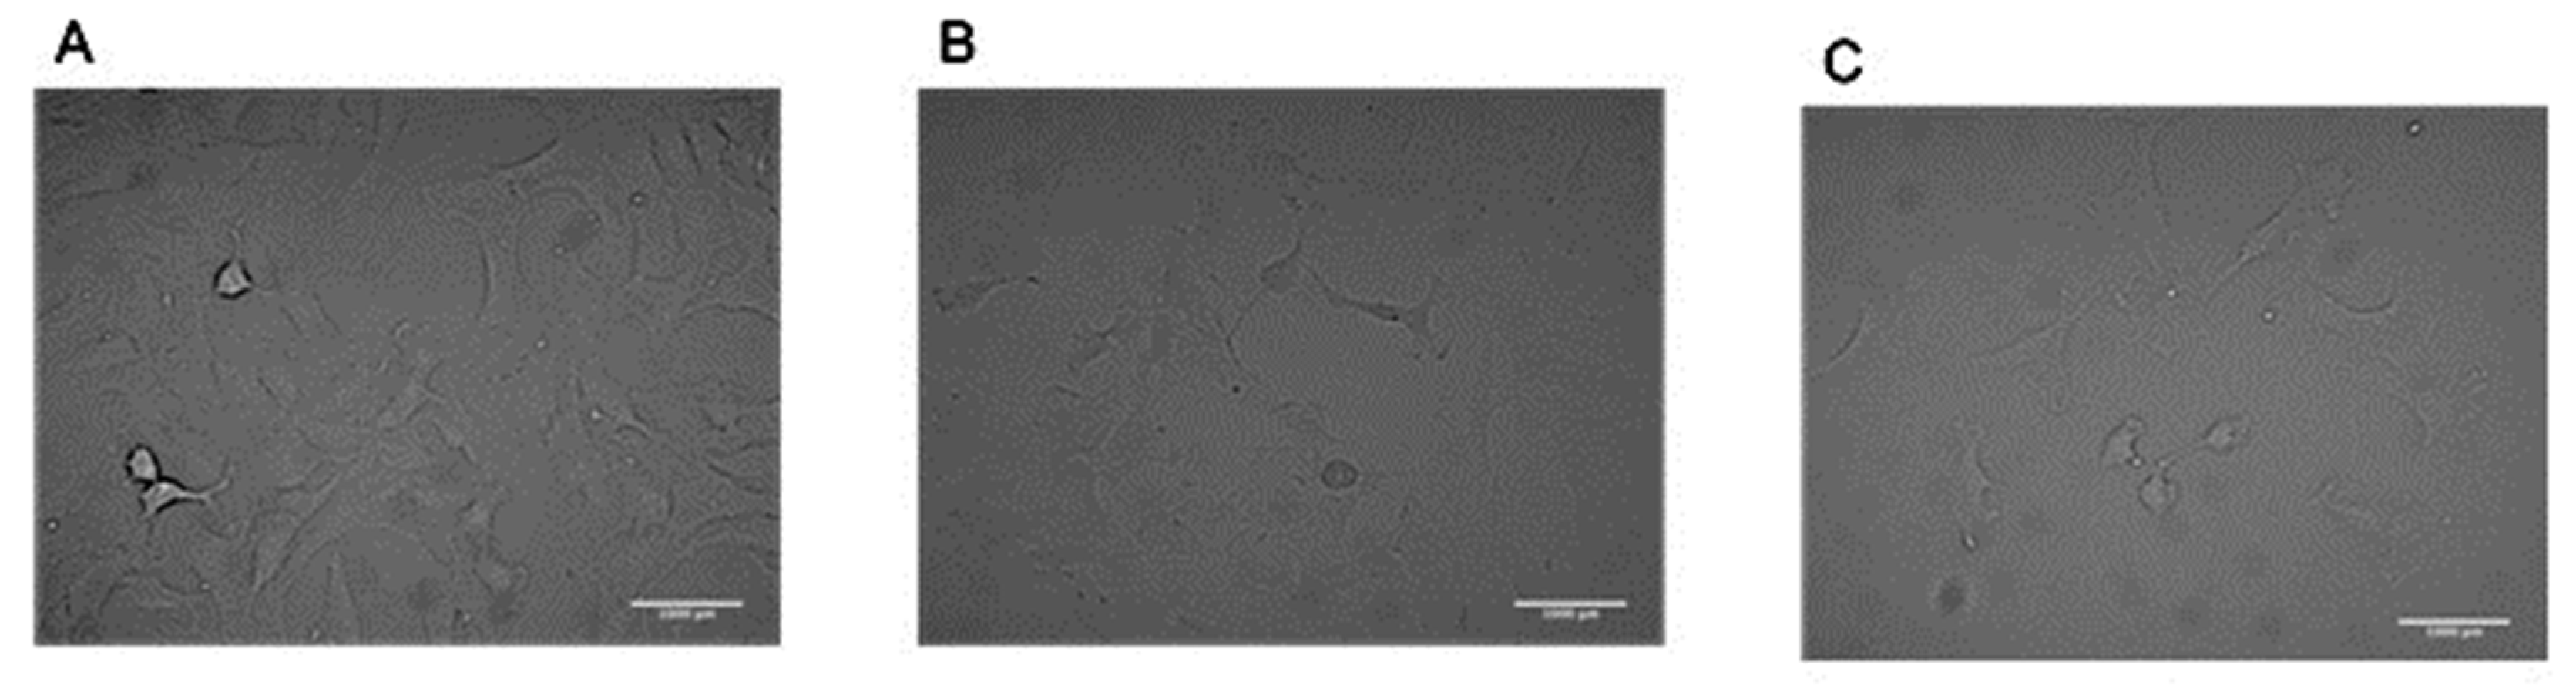
- Change the media every 2–3 days and wait until cells are ≈80–100% confluent. (Figure 2)
2.3. In Vitro Flow Chamber and Bubble Propagation over Cell Monolayers
2.3.1. Flow Chamber Assembly and Flow Rate Calculations
Parallel Plate Flow Chamber Assembling
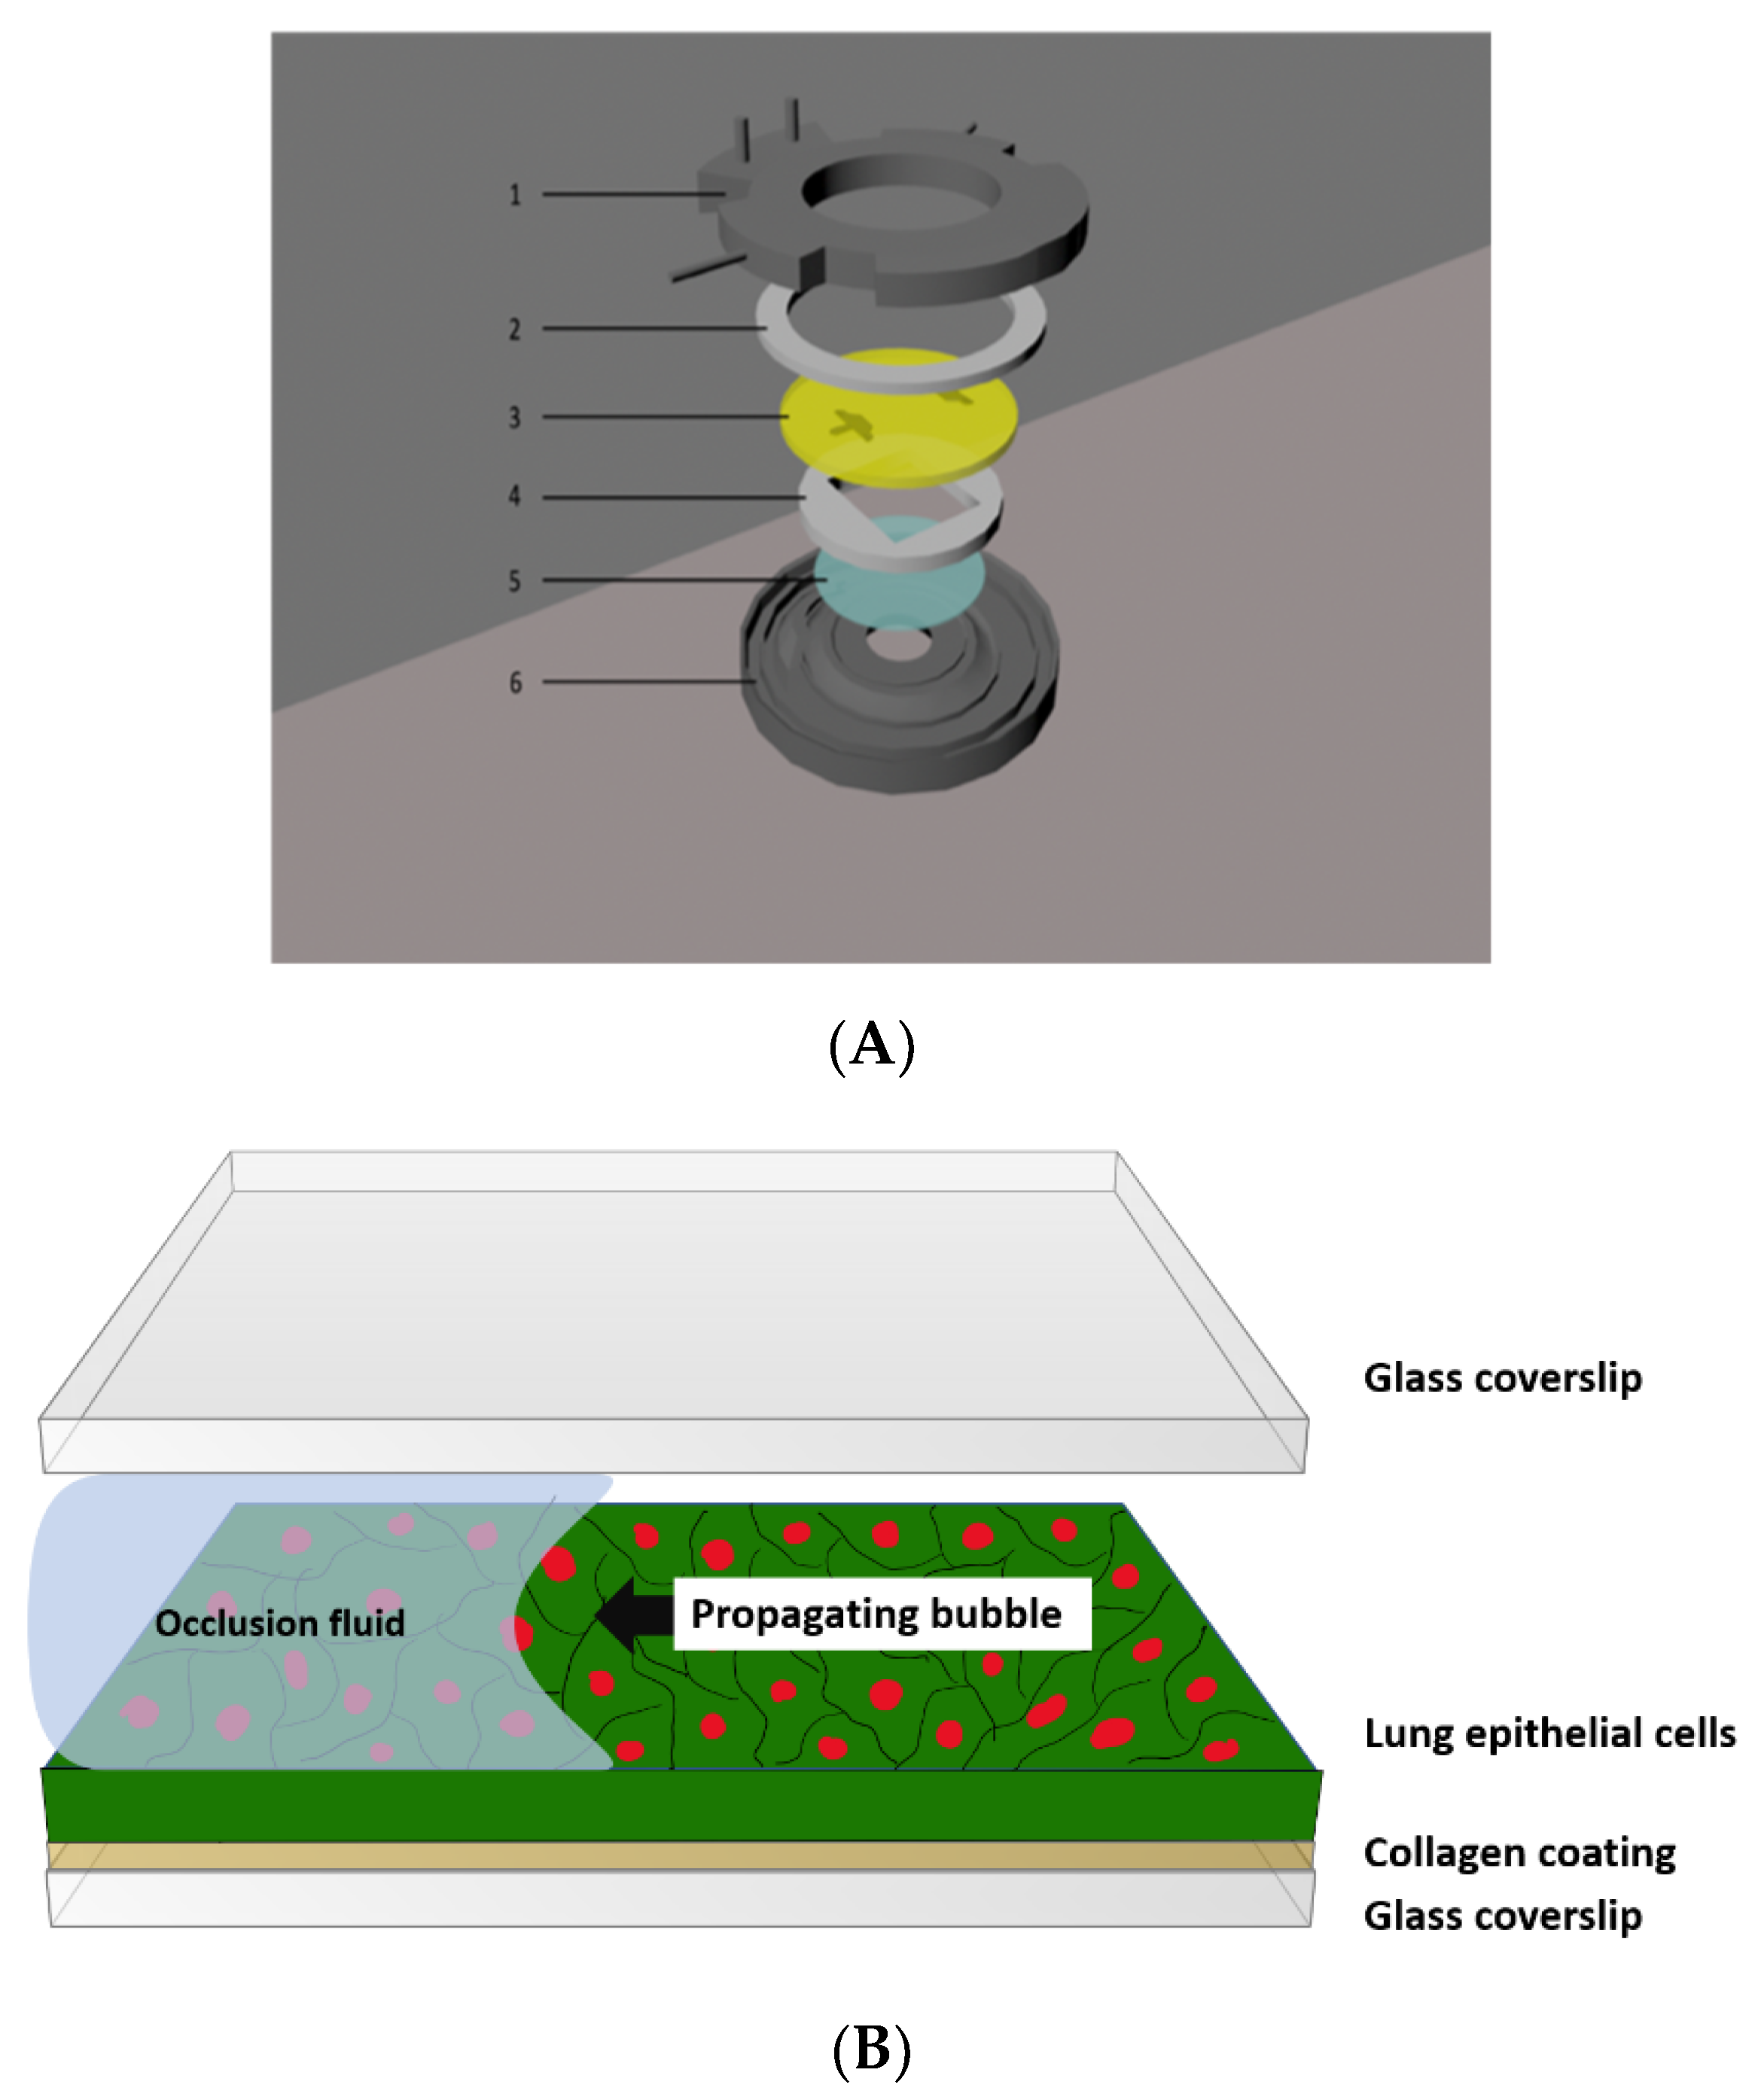
- To assemble the flow chamber, an upper, round, 30 mm hole gasket is placed under the upper half containing perfusion tubes (inlet and outlet tubes).
- Followed by a microaqueduct slide, a singular, lower, 14 × 22 mm rectangle gasket, a 40 mm cell-seeded lower cover glass, and a self-locking base are assembled.
- The upper half perfusion inlet tube is connected to the syringe pump to apply flow perfusion over the cells.
Flow Rate Calculation
2.3.2. Connecting the Syringe Pump to the Flow Chamber
- The upper white part has an inlet and outlet: connect one of the ends to 1/16” Tygon Tubing.
- Fill a syringe with warm phosphate buffered saline (PBS), which represents a high surface tension fluid, a characteristic of lung edema in ARDS.
- Place the syringe onto a syringe pump and connect the syringe to the flow chamber. Here, we used a CHEMYX model fusion 720 syringe pump.
- Turn on the syringe pump and set the syringe volume that is used in the experiment (syringe volume can be selected from built in selection with syringe brand, available in most syringe pumps).
- Set volume and flow rate.
- Once PBS comes out from the outlet, press “stop” and select “withdraw” so a bubble starts to propagate over the cells, exposing cells to bubble flow-induced stresses.Note: The fluid will be completely withdrawn from the chamber in a few seconds. The coverslip should be immediately placed in cell media or stained to prevent cell dryness.
- If needed, bubble propagation can be repeated multiple times to simulate multiple reopening events.
- When all PBS is withdrawn, stop the machine and disassemble the chamber (make sure when removing the coverslip that cells are facing upwards) to transfer the cover slip to a well for live/dead stain analysis. Alternatively, without disassembly, live/dead stain can be perfused to the chamber to perform cell staining in the chamber.
2.4. Quantification of the Cellular Injury after Bubble Propagations
- A conventional fluorescent live/dead stain kit from Thermo Fisher Scientific (Cat. No. L3224) is used to quantify the viability. For this assay, m/2000 dilution is made for calcein-AM (for identification of live cells) and ethidium homodimer 1 (for identification of dead cells), with a final concentration of 1 µM, in the serum-free media [13].
- Transfer the coverslip to a 50 mm petri dish and add ≈1–2 mL of the stain to the coverslip. The stain is light-sensitive so the plate containing the coverslip should be covered with aluminum foil.
- Incubate for 15 min at 37 °C.Note: Cells can be kept at room temperature if needed for this stain. We have shown that keeping the cells at room temperature for 15 min does not induce any additional cell death [12].
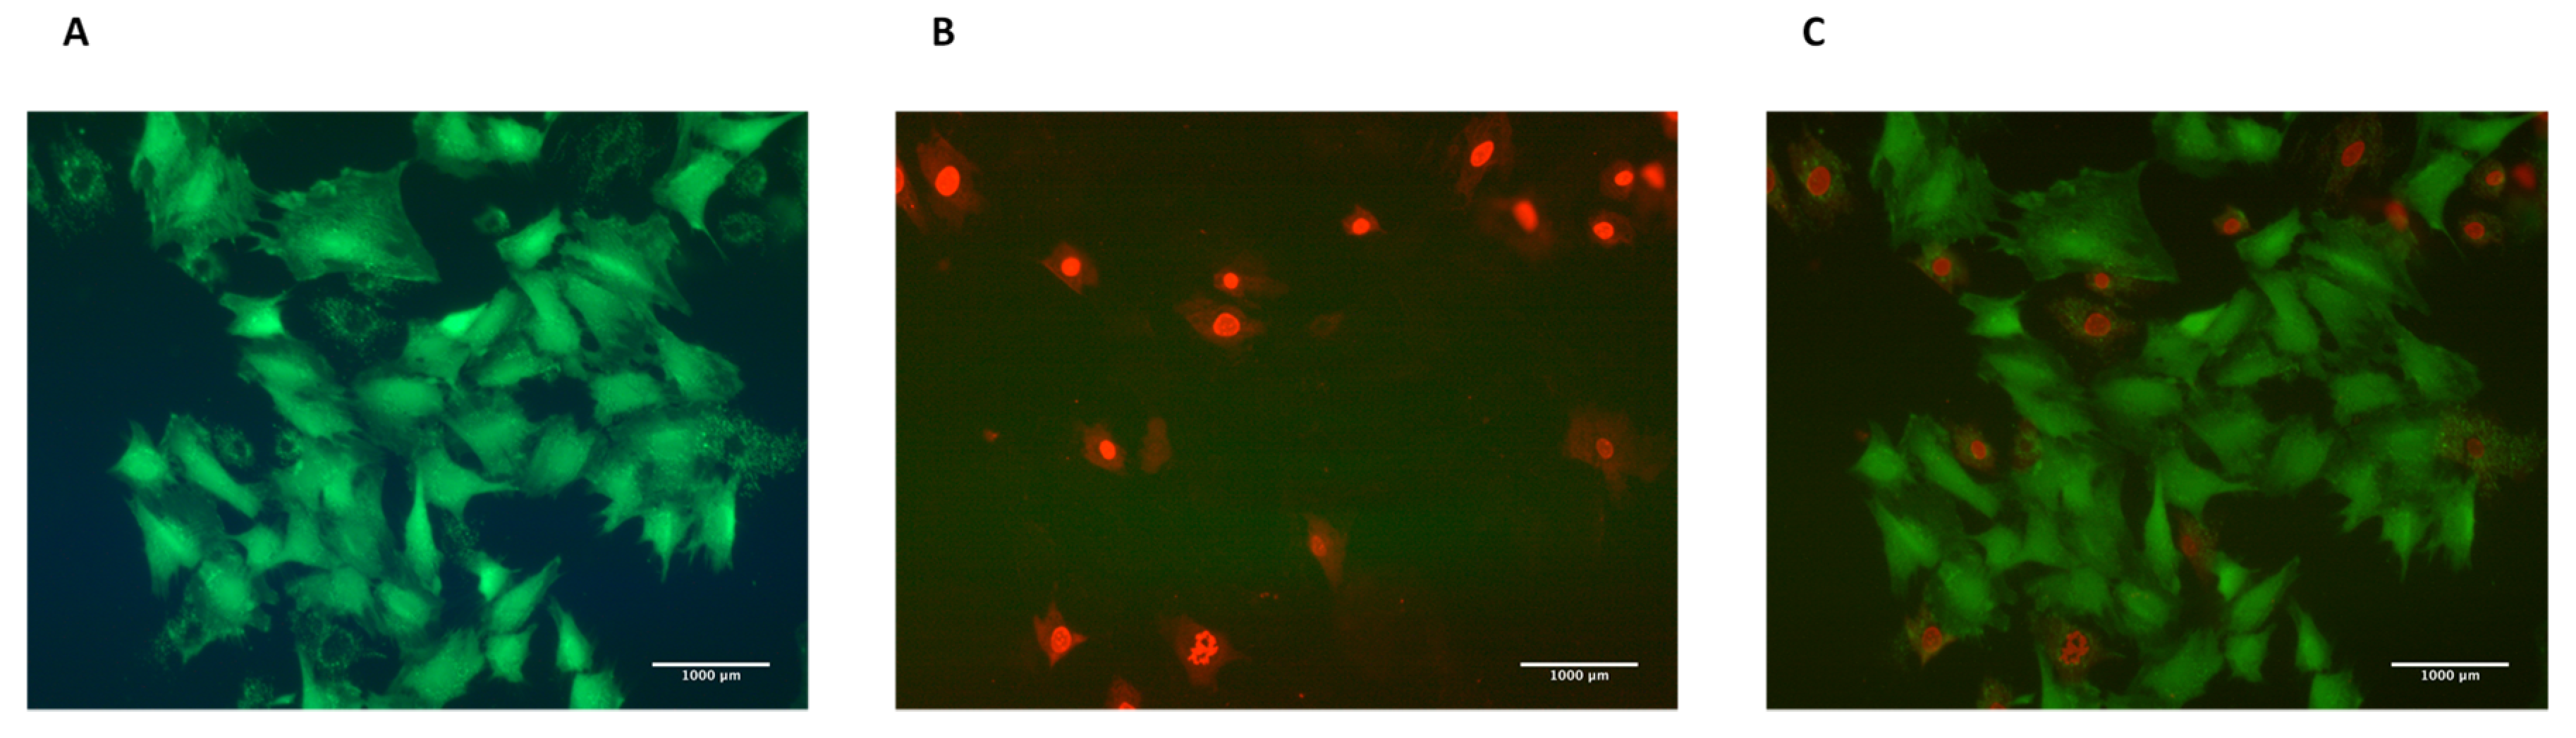
- Visualize the slide under a fluorescent microscope (GFP (Green Fluorescent Protein) filter for live cells and CY3 filter for dead cells). Figure 4 represents cells stained with Live/Dead assay.
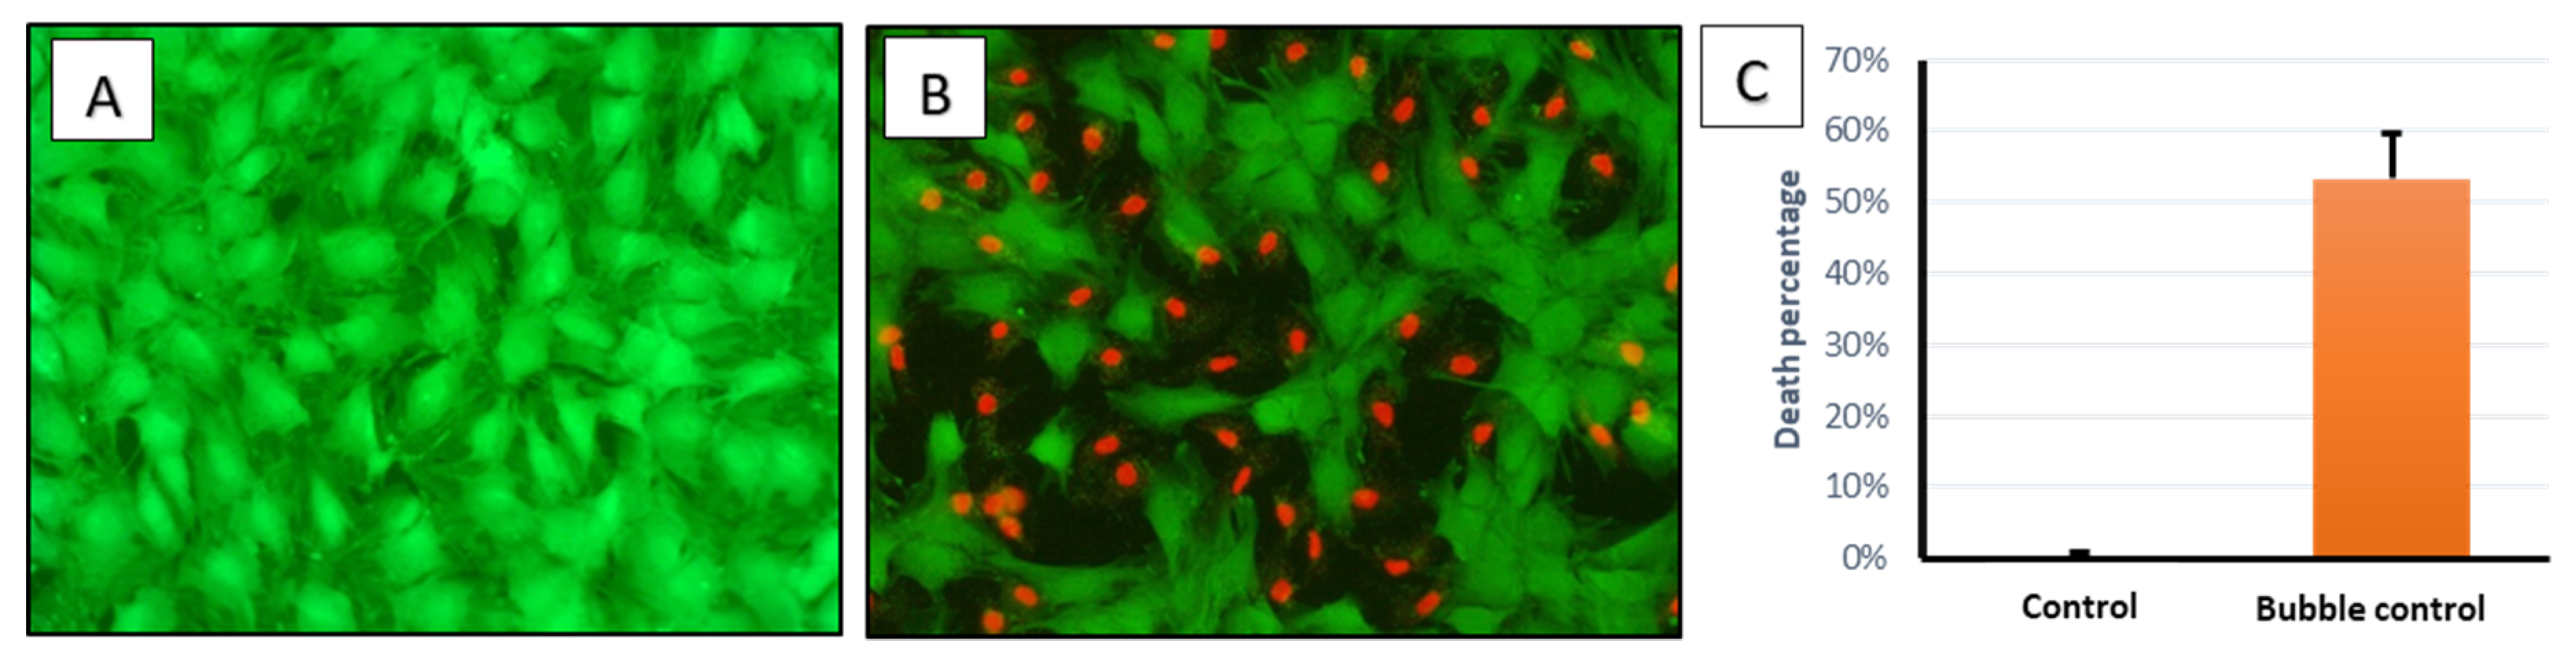
- Take 5–10 pictures for different fields. We usually use 10X or 20X objective to have a field of about 400–500 or 80–200 cells, respectively.Note: Fluorescent pictures should be taken from the middle portion of the channel to eliminate effects of walls on the sides. We have realized that more cells die in the regions close to side walls. Also, cell confluency is an important factor in cell injury for this type of perfusion experiment [14]. Therefore, to compare different experimental groups, it is advised to culture cells to the same confluency level.Note: For an identical field, one live image (green filter) and one dead image (red filter) are taken. These images are then merged to visualize live and dead cells in the same image for the studied field. Image acquisition software can be used for merging. Alternatively, ImageJ can be used for this step.
2.4.1. To Merge Images Using ImageJ
- Open the images (File → open → select the images).
- Change the images to 8-bit format (image → type→ 8-bit).
- Select image → color → merge channels.
- Choose the image name based on its color (dead cells’ image will be in the C1 (Channel1) and live cells’ image in C2 (Channel2)).
- Select “create a composite” → OK.
- Change the image to RGB (Red,Green,Blue) format (image → type → RGB color).
2.4.2. Counting Dead and Live Cells to Quantify Viability
- The total numbers of live and dead cells need to be determined to quantify cellular injury. A variety of software applications such as Metamorph, Image pro plus, and ImageJ can be used in an automated or manual way. We used ImageJ for this purpose
- Open ImageJ → File → open → select the photo → go to plugins → analyze → cell counter → select type 1 and start counting → results.
- To find the viability rate, use Equation (3):
3. Expected Results
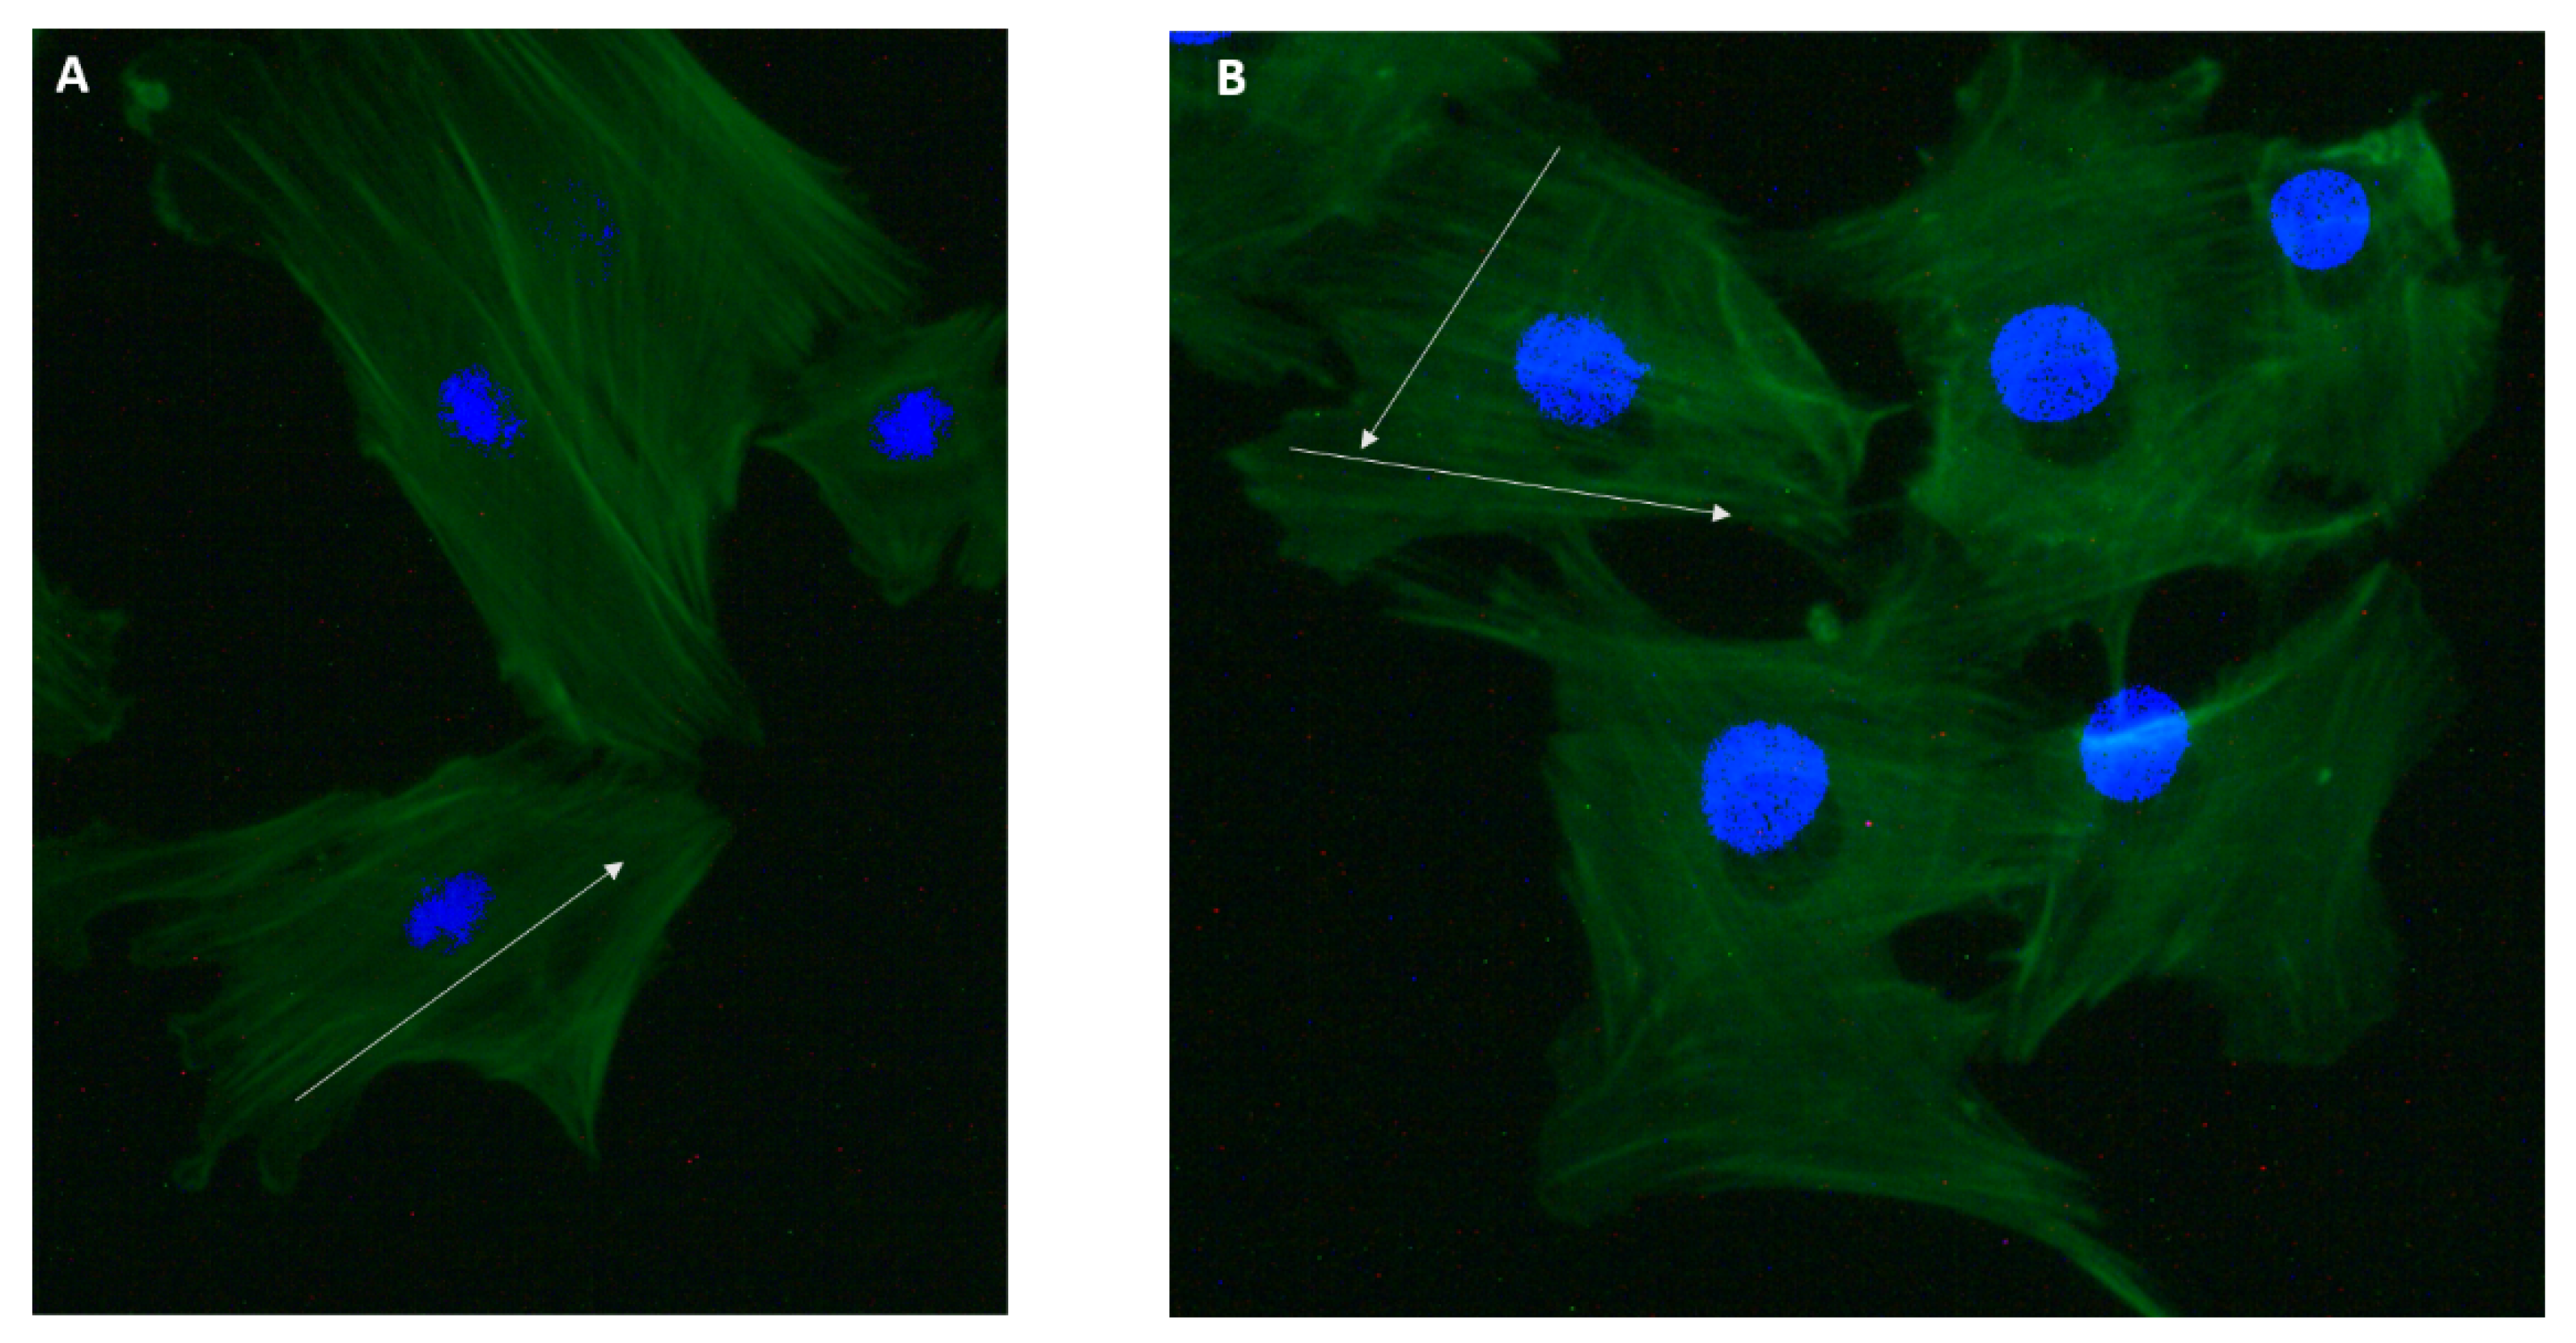
Effect of Mechanical Stress on Cytoskeletal Structure
4. Conclusions
Author Contributions
Funding
Conflicts of Interest
References
- DuFort, C.C.; Paszek, M.J.; Weaver, V.M. Balancing Forces: Architectural Control of Mechanotransduction. Nat. Rev. Mol. Cell Biol. 2011, 12, 308–319. [Google Scholar] [CrossRef] [PubMed] [Green Version]
- Chistiakov, D.A.; Orekhov, A.N.; Bobryshev, Y.V. Effects of Shear Stress on Endothelial Cells: Go with the Flow. Acta Physiol. 2016, 219, 382–408. [Google Scholar] [CrossRef]
- Ishihara, S.; Marcq, P.; Sugimura, K. From Cells to Tissue: A Continuum Model of Epithelial Mechanics. Phys. Rev. E 2017, 96, 22418. [Google Scholar] [CrossRef] [PubMed] [Green Version]
- Abraham, D.; Distler, O. How does endothelial cell injury start? The role of endothelin in systemic sclerosis. Arthritis Res. Ther. 2007, 9 (Suppl. 2), S2. [Google Scholar] [CrossRef] [Green Version]
- Lutter, R.; Spiteri, M. Current Perspectives in Epithelial Cell Injury and Repair: Consequences for Epithelial Functions. Eur. Respir. Rev. 2005, 14, 126–130. [Google Scholar] [CrossRef]
- Force, T.A.D.T. Acute Respiratory Distress Syndrome: The Berlin Definition. JAMA 2012, 307, 2526–2533. [Google Scholar]
- Ghadiali, S.N.; Gaver, D.P. Biomechanics of Liquid-Epithelium Interactions in Pulmonary Airways. Respir. Physiol. Neurobiol. 2008, 163, 232–243. [Google Scholar] [CrossRef] [PubMed] [Green Version]
- Biehl, M.; Kashiouris, M.G.; Gajic, O. Ventilator-Induced Lung Injury: Minimizing Its Impact in Patients With or at Risk for ARDS. Respir. Care 2013, 58, 927–937. [Google Scholar] [CrossRef] [PubMed] [Green Version]
- Yang, X.; Yu, Y.; Xu, J.; Shu, H.; Xia, J.; Liu, H.; Wu, Y.; Zhang, L.; Yu, Z.; Fang, M.; et al. Clinical Course and Outcomes of Critically Ill Patients with SARS-CoV-2 Pneumonia in Wuhan, China: A Single-Centered, Retrospective, Observational Study. Lancet Respir. Med. 2020, 8, 475–481. [Google Scholar] [CrossRef] [PubMed] [Green Version]
- Guan, W.; Ni, Z.; Hu, Y.; Liang, W.; Ou, C.; He, J.; Liu, L.; Shan, H.; Lei, C.; Hui, D.S.C.; et al. Clinical Characteristics of Coronavirus Disease 2019 in China. N. Engl. J. Med. 2020, 382, 1708–1720. [Google Scholar] [CrossRef] [PubMed]
- Marini, J.J.; Hotchkiss, J.R.; Broccard, A.F. Bench-to-Bedside Review: Microvascular and Airspace Linkage in Ventilator-Induced Lung Injury. Crit. Care 2003, 7, 435–444. [Google Scholar] [CrossRef] [PubMed] [Green Version]
- Xie, J.; Tong, Z.; Guan, X.; Du, B.; Qiu, H.; Slutsky, A.S. Critical Care Crisis and Some Recommendations during the COVID-19 Epidemic in China. Intensive Care Med. 2020, 46, 837–840. [Google Scholar] [CrossRef] [PubMed] [Green Version]
- Bhatraju, P.K.; Ghassemieh, B.J.; Nichols, M.; Kim, R.; Jerome, K.R.; Nalla, A.K.; Greninger, A.L.; Pipavath, S.; Wurfel, M.M.; Evans, L.; et al. COVID-19 in Critically Ill Patients in the Seattle Region—Case Series. N. Engl. J. Med. 2020, 382, 2012–2022. [Google Scholar] [CrossRef] [PubMed]
- Yalcin, H.C.; Perry, S.F.; Ghadiali, S.N. Influence of Airway Diameter and Cell Confluence on Epithelial Cell Injury in an in Vitro Model of Airway Reopening. J. Appl. Physiol. 2007, 103, 1796–1807. [Google Scholar] [CrossRef] [PubMed] [Green Version]
- Yalcin, H.C.; Hallow, K.M.; Wang, J.; Wei, M.T.; Ou-Yang, H.D.; Ghadiali, S.N. Influence of Cytoskeletal Structure and Mechanics on Epithelial Cell Injury during Cyclic Airway Reopening. Am. J. Physiol.-Lung Cell. Mol. Physiol. 2009, 297, 881–891. [Google Scholar] [CrossRef]
- Dailey, H.L.; Ricles, L.M.; Yalcin, H.C.; Ghadiali, S.N. Image-Based Finite Element Modeling of Alveolar Epithelial Cell Injury during Airway Reopening. J. Appl. Physiol. 2009, 106, 221–232. [Google Scholar] [CrossRef] [PubMed]
- Shurbaji, S.; Anlar, G.G.; Hussein, E.A.; Elzatahry, A.; Yalcin, H.C. Effect of Flow-Induced Shear Stress in Nanomaterial Uptake by Cells: Focus on Targeted Anti-Cancer Therapy. Cancers (Basel) 2020, 12, 1916. [Google Scholar] [CrossRef] [PubMed]
- Wei, M.-T.; Zaorski, A.; Yalcin, H.C.; Wang, J.; Hallow, M.; Ghadiali, S.N.; Chiou, A.; Ou-Yang, H.D. A Comparative Study of Living Cell Micromechanical Properties by Oscillatory Optical Tweezers. Opt. Express 2008, 16, 8594. [Google Scholar] [CrossRef] [PubMed]


© 2020 by the authors. Licensee MDPI, Basel, Switzerland. This article is an open access article distributed under the terms and conditions of the Creative Commons Attribution (CC BY) license (http://creativecommons.org/licenses/by/4.0/).
Share and Cite
Shurbaji, S.; Al-Ruweidi, M.K.A.A.; Ali, F.H.; Benslimane, F.M.; Yalcin, H.C. Application of a Flow-Induced Stress Wave and Investigation of Associated Injuries on Cell Monolayers Using a Parallel Plate Flow Chamber. Methods Protoc. 2020, 3, 65. https://0-doi-org.brum.beds.ac.uk/10.3390/mps3040065
Shurbaji S, Al-Ruweidi MKAA, Ali FH, Benslimane FM, Yalcin HC. Application of a Flow-Induced Stress Wave and Investigation of Associated Injuries on Cell Monolayers Using a Parallel Plate Flow Chamber. Methods and Protocols. 2020; 3(4):65. https://0-doi-org.brum.beds.ac.uk/10.3390/mps3040065
Chicago/Turabian StyleShurbaji, Samar, Mahmoud Khatib A. A. Al-Ruweidi, Fatma Hassan Ali, Fatiha M. Benslimane, and Huseyin C. Yalcin. 2020. "Application of a Flow-Induced Stress Wave and Investigation of Associated Injuries on Cell Monolayers Using a Parallel Plate Flow Chamber" Methods and Protocols 3, no. 4: 65. https://0-doi-org.brum.beds.ac.uk/10.3390/mps3040065