Predictive Quantitative Structure–Activity Relationship Modeling of the Antifungal and Antibiotic Properties of Triazolothiadiazine Compounds


Abstract
:1. Introduction
- Build structures;
- Calculate density functional theory properties and descriptors;
- Calculate 1D and 2D descriptors;
- Create a training set and test set;
- Apply the genetic function approximation method for descriptor identification;
- Develop mathematical models using suitable descriptors;
- Evaluate models using internal validation and external validation.
2. Materials and Methods
2.1. Date Set
2.2. Quantum Chemistry
2.3. Training and Test Sets
2.4. QSAR Study
3. Results and Discussion
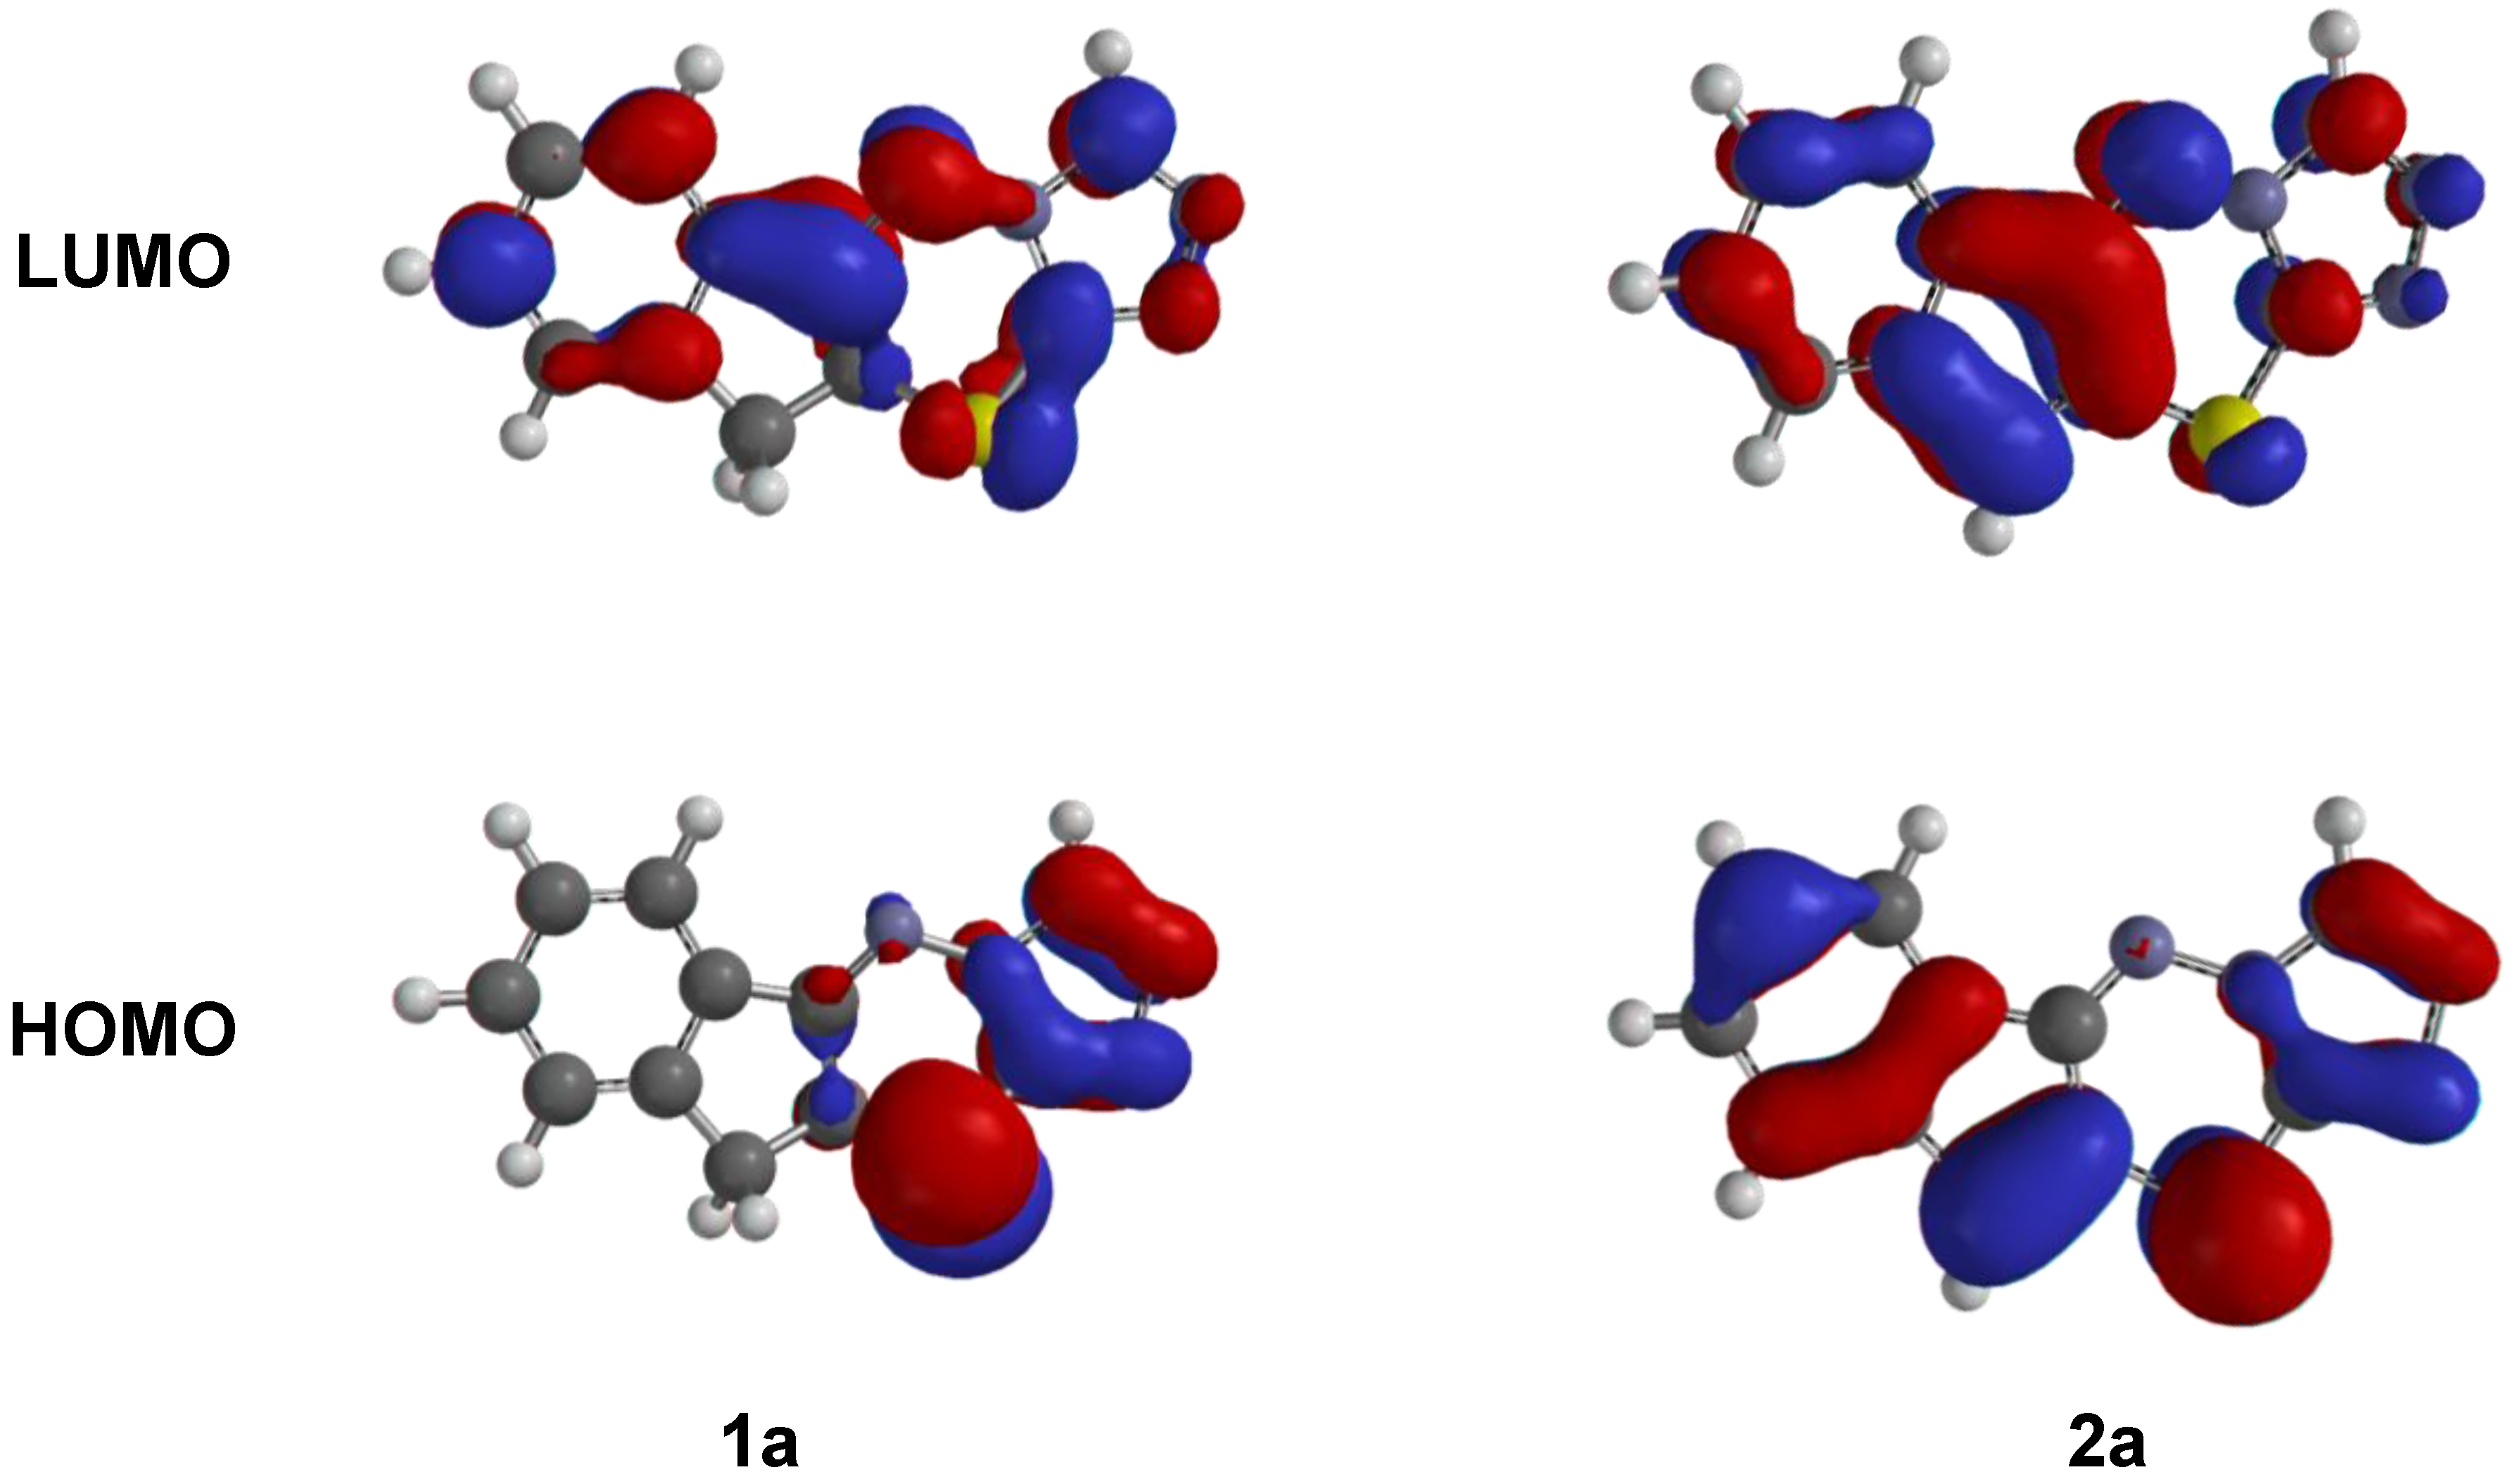
3.1. Chemical Structure
3.2. QSAR
4. Conclusions
Supplementary Materials
Author Contributions
Funding
Data Availability Statement
Acknowledgments
Conflicts of Interest
References
- Quintero, F.A.; Patel, S.J.; Muñoz, F.; Mannan, S. Review of Existing QSAR/QSPR Models Developed for Properties Used in Hazardous Chemicals Classification System. Ind. Eng. Chem. Res. 2012, 51, 16101–16115. [Google Scholar] [CrossRef]
- Muratov, E.N.; Bajorath, J.; Sheridan, R.P.; Tetko, I.; Filimonov, D.A.; Poroikov, V.; Oprea, T.I.; Baskin, I.I.; Varnek, A.; Roitberg, A.E.; et al. QSAR without borders. Chem. Soc. Rev. 2020, 49, 3525–3564. [Google Scholar] [CrossRef] [PubMed]
- Shahlaei, M. Descriptor selection methods in quantitative structure–activity relationship studies: A review study. Chem. Rev. 2013, 113, 8093–8103. [Google Scholar] [CrossRef] [PubMed]
- Jenssen, H.; Fjell, C.D.; Cherkasov, A.; Hancock, R.E.W. QSAR modeling and computer-aided design of antimicrobial pep-tides. J. Pept. Sci. 2008, 14, 110–114. [Google Scholar] [CrossRef]
- Thabit, A.K.; Crandon, J.L.; Nicolau, D.P. Antimicrobial resistance: Impact on clinical and economic outcomes and the need for new antimicrobials. Expert. Opin. Pharmacother. 2015, 16, 159–177. [Google Scholar] [CrossRef]
- World Health Organization. WHO Fact Sheet, Updated 15 February 2018. Available online: https://www.who.int/news-room/fact-sheets/detail/antimicrobial-resistance (accessed on 12 August 2020).
- Sharma, P.K. A Review: Antimicrobial Agents Based on Nitrogen and Sulfur Containing Heterocycles. Asian J. Pharm. Clin. Res. 2017, 10, 47–49. [Google Scholar] [CrossRef] [Green Version]
- Čačić, M.; Pavić, V.; Molnar, M.; Šarkanj, B.; Has-Schön, E. Design and synthesis of some new 1, 3, 4-thiadiazines with coumarin moieties and their antioxidative and antifungal activity. Molecules 2014, 19, 1163–1177. [Google Scholar] [CrossRef] [Green Version]
- Duchowicz, P.R.; Vitale, M.G.; Castro, E.A.; Fernandez, M.; Caballero, J. QSAR analysis for heterocyclic antifungals. Bioorg. Med. Chem. 2007, 15, 2680–2689. [Google Scholar] [CrossRef]
- Prakash, O.; Aneja, D.K.; Hussain, K.; Lohan, P.; Ranjan, P.; Arora, S.; Sharma, C.; Aneja, K.R. Synthesis and biological evalu-ation of dihydroindeno and indeno [1,2-e] [1,2,4]triazolo [3,4-b] [1,3,4]thiadiazines as antimicrobial agents. Eur. J. Med. Chem. 2011, 46, 5065–5073. [Google Scholar] [CrossRef]
- Zabka, M.; Pavela, R. Antifungal efficacy of some natural phenolic compounds against significant pathogenic and toxino-genic filamentous fungi. Chemosphere 2013, 93, 1051–1056. [Google Scholar] [CrossRef]
- Appell, M.; Tu, Y.-S.; Compton, D.L.; Evans, K.O.; Wang, L.C. Quantitative structure-activity relationship study for predic-tion of antifungal properties of phenolic compounds. J. Struct. Chem. 2020, 31, 1621–1630. [Google Scholar] [CrossRef]
- Fotso, G.W.; Ngameni, B.; Storr, T.E.; Ngadjui, B.T.; Mafu, S.; Stephenson, G.R. Synthesis of novel stilbene–coumarin deriva-tives and antifungal screening of monotes kerstingii-specialized metabolites against fusarium oxysporum. Antibiotics 2020, 9, 537. [Google Scholar] [CrossRef] [PubMed]
- Appell, M.; Bosma, W.B. Assessment of the electronic structure and properties of trichothecene toxins using density func-tional theory. J. Hazard. Mater. 2015, 288, 113–123. [Google Scholar] [CrossRef] [PubMed]
- Lima, M.A.S.; Oliveira, M.; da Conceição, F.; de Pimenta, A.T.Á.; Uchôa, P.K.S. Aspergillus niger: A hundred years of contri-bution to the natural products chemistry. J. Braz. Chem. Soc. 2019, 30, 2029–2059. [Google Scholar]
- Han, X.; Jiang, H.; Li, F. Dynamic ochratoxin A production by strains of Aspergillus niger intended used in food industry of China. Toxins 2019, 11, 122. [Google Scholar] [CrossRef] [Green Version]
- Valsecchi, I.; Stephen-Victor, E.; Wong, S.S.W.; Karnam, A.; Sunde, M.; Guijarro, J.I.; de Francisco, B.R.; Krüger, T.; Kniemeyer, O.; Brown, G.D.; et al. The role of rodA-conserved cysteine residues in the Aspergillus fumigatus conidial surface organization. J. Fungi 2020, 6, 151. [Google Scholar] [CrossRef]
- Xiang, F.; Zhao, Q.; Zhao, K.; Pei, H.; Tao, F. The Efficacy of Composite Essential Oils against Aflatoxigenic Fungus Aspergillus flavus in Maize. Toxins 2020, 12, 562. [Google Scholar] [CrossRef]
- Pitt, J., I. The current role of Aspergillus and Penicillium in human and animal health. J. Med. Vet. Mycol. 1994, 32, 17–32. [Google Scholar] [CrossRef]
- Wang, X.; Shen, Y.; Thakur, K.; Han, J.; Zhang, J.-G.; Hu, F.; Wei, Z.-J. Antibacterial activity and mechanism of ginger essen-tial oil against Escherichia coli and Staphylococcus aureus. Molecules 2020, 25, 3955. [Google Scholar] [CrossRef]
- Witek, K.; Latacz, G.; Kaczor, A.; Czekajewska, J.; Żesławska, E.; Chudzik, A.; Karczewska, E.; Nitek, W.; Kieć-Kononowicz, K.; Handzlik, J. Phenylpiperazine 5,5-Dimethylhydantoin Derivatives as First Synthetic Inhibitors of Msr(A) Efflux Pump in Staphylococcus epidermidis. Molecules 2020, 25, 3788. [Google Scholar] [CrossRef]
- Sivakumar, P.M.; Kumar, T.M.; Doble, M. Antifungal Activity, Mechanism and QSAR Studies on Chalcones. Chem. Biol. Drug Des. 2009, 74, 68–79. [Google Scholar] [CrossRef] [PubMed]
- Shao, Y.; Molnar, L.F.; Jung, Y.; Kussmann, J.; Ochsenfeld, C.; Brown, S.T.; Gilbert, A.T.; Slipchenko, L.V.; Levchenko, S.V.; O’Neill, D.P.; et al. Advances in methods and algorithms in a modern quantum chemistry program package. Phys. Chem. Phys. 2006, 8, 3172–3191. [Google Scholar] [CrossRef] [PubMed]
- Hypercube Inc. Hyperchem Professional 8.0.10; Hypercube Inc.: Gainesville, FL, USA, 2011. [Google Scholar]
- O’Boyle, N.M.; Banck, M.; James, C.A.; Morley, C.; Vandermeersch, T.; Hutchison, G.R. Open Babel: An open chemical toolbox. J. Cheminform. 2011, 3, 33. [Google Scholar] [CrossRef] [PubMed] [Green Version]
- Hong, H.; Xie, Q.; Ge, W.; Qian, F.; Fang, H.; Shi, L.; Su, Z.; Perkins, R.; Tong, W. Mold (2), molecular descriptors from 2D structures for chemoinformatics and toxicoinformatics. J. Chem. Inf. Model. 2008, 48, 1337–1344. [Google Scholar] [CrossRef] [PubMed]
- de Oliveira, D.B.; Gaudio, A.C. BuildQSAR: A new computer program for QSAR analysis. Quant. Struct.-Act. Relat. 2000, 19, 599–601. [Google Scholar] [CrossRef]
- Koopmans, T. Über die Zuordnung von Wellenfunktionen und Eigenwerten zu den Einzelnen Elektronen Eines Atoms. Physica 1934, 1, 104–113. [Google Scholar] [CrossRef]
- Parr, R.G.; Szentpály, L.V.; Liu, S. Electrophilicity Index. J. Am. Chem. Soc. 1999, 121, 1922–1924. [Google Scholar] [CrossRef]
- Domingo, L.R.; Ríos-Gutiérrez, M.; Pérez, P. Applications of the Conceptual Density Functional Theory Indices to Organic Chemistry Reactivity. Molecules 2016, 21, 748. [Google Scholar] [CrossRef] [Green Version]
- Martin, T.; Harten, P.; Young, D.M.; Muratov, E.N.; Golbraikh, A.; Zhu, H.; Tropsha, A. Does Rational Selection of Training and Test Sets Improve the Outcome of QSAR Modeling? J. Chem. Inf. Model. 2012, 52, 2570–2578. [Google Scholar] [CrossRef]
- Rogers, D.; Hopfinger, A.J. Application of Genetic Function Approximation to Quantitative Structure-Activity Relationships and Quantitative Structure-Property Relationships. J. Chem. Inf. Model. 1994, 34, 854–866. [Google Scholar] [CrossRef]
- Choi, S.-Y.; Shin, J.H.; Ryu, C.K.; Nam, K.-Y.; No, K.T.; Choo, H.-Y.P. The development of 3D-QSAR study and recursive partitioning of heterocyclic quinone derivatives with antifungal activity. Bioorg. Med. Chem. 2006, 14, 1608–1617. [Google Scholar] [CrossRef] [PubMed]
- Karadžić, M.Z.; Kovačević, S.Z.; Jevrić, L.R.; Podunavac-Kuzmanović, S.O. Chemometric and QSAR analysis of some thiadi-azines as potential antifungal agents. Acta Period. Technol. 2017, 48, 117–126. [Google Scholar] [CrossRef]
- Cortes, E.; Mora, J.; Marquez, E. Modelling the anti-methicillin-resistant Staphylococcus aureus (MRSA) activity of canna-binoids: A QSAR and docking study. Crystals 2020, 10, 692. [Google Scholar] [CrossRef]
- Bouarab-Chibane, L.; Forquet, V.; Lantéri, P.; Clément, Y.; Léonard-Akkari, L.; Oulahal, N.; Degraeve, P.; Bordes, C. Anti-bacterial properties of polyphenols: Characterization and QSAR (quantitative structure–activity relationship) models. Front. Microbiol. 2019, 10, 829. [Google Scholar] [CrossRef] [PubMed]
- Mor, S.; Pahal, P.; Narasimhan, B. Synthesis, characterization, antimicrobial activities and QSAR studies of some 10a-phenylbenzo[b]indeno[1,2-e][1,4]thiazin-11(10aH)-ones. Eur. J. Med. Chem. 2012, 53, 176–189. [Google Scholar] [CrossRef] [PubMed]
- Sabet, R.; Fassihi, A. QSAR Study of Antimicrobial 3-Hydroxypyridine-4-one and 3-Hydroxypyran-4-one Derivatives Using Different Chemometric Tools. Int. J. Mol. Sci. 2008, 9, 2407–2423. [Google Scholar] [CrossRef] [Green Version]
- Tropsha, A. Best Practices for QSAR Model Development, Validation, and Exploitation. Mol. Inform. 2010, 29, 476–488. [Google Scholar] [CrossRef]
- Alexander, D.L.J.; Tropsha, A.; Winkler, D.A. Beware of R2: Simple, Unambiguous Assessment of the Prediction Accuracy of QSAR and QSPR Models. J. Chem. Inf. Model. 2015, 55, 1316–1322. [Google Scholar] [CrossRef] [Green Version]


 | ||||||||||
|---|---|---|---|---|---|---|---|---|---|---|
| Compound | R1 | R2 | A. niger log(%MGI) | A. flavus log(%MGI) | Penicillium sp. %MGI | S. aureus pIC50 | B. subtilis pIC50 | E. coli DGI | P. aeruginosa log(DGI) | |
| 1 | 1a | -H | -H | 1.71 | 1.72 | 51.1 | 3.25 | 3.25 | ||
| 2 | 1b | -H | -CH3 | 1.73 | 1.71 | 55.5 | 2.98 | 3.28 | ||
| 3 | 1c | -H | -CH2CH3 | 1.77 | 1.74 | 57.7 | 4.20 | 3.90 | 18.3 | 1.26 |
| 4 | 1d | -H | -CH2CH2CH3 | 1.74 | 1.72 | 53.3 | 4.53 | 4.23 | 19.3 | 1.29 |
| 5 | 1e | -H | -CH(CH3)CH3 | 1.73 | 1.71 | 51.1 | 4.83 | 4.23 | 20.6 | 1.31 |
| 6 | 1f | -H | -Ph | 1.71 | 1.69 | 50.0 | 3.50 | 3.20 | 18.3 | 1.26 |
| 7 | 1g | -CH3 | -H | 1.80 | 1.82 | 62.5 | 4.48 | 5.08 | 22.3 | 1.35 |
| 8 | 1h | -CH3 | -CH3 | 1.83 | 1.84 | 67.7 | 4.51 | 5.11 | 20.6 | 1.31 |
| 9 | 1i | -CH3 | -CH2CH3 | 1.81 | 1.80 | 65.5 | 4.53 | 4.83 | 21.0 | 1.32 |
| 10 | 1j | -CH3 | -CH2CH2CH3 | 1.77 | 1.74 | 61.1 | 4.25 | 3.95 | 19.3 | 1.29 |
| 11 | 1k | -CH3 | -CH(CH3)CH3 | 1.80 | 1.79 | 65.5 | 4.85 | 4.55 | 21.6 | 1.33 |
| 12 | 1l | -CH3 | -Ph | 1.74 | 1.77 | 60.0 | 4.00 | 4.00 | 17.3 | 1.24 |
| 13 | 2a | -H | -H | 1.73 | 1.70 | 51.1 | 2.95 | 3.25 | ||
| 14 | 2b | -H | -CH3 | 1.70 | 1.69 | 52.5 | 2.97 | 2.97 | ||
| 15 | 2c | -H | -CH2CH3 | 1.69 | 1.66 | 50.0 | 3.30 | 3.30 | ||
| 16 | 2d | -H | -CH2CH2CH3 | 1.71 | 1.69 | 47.7 | 4.22 | 4.22 | 18.6 | 1.27 |
| 17 | 2e | -H | -CH(CH3)CH3 | 1.69 | 1.70 | 44.4 | 3.32 | 3.32 | ||
| 18 | 2f | -H | -Ph | 1.66 | 1.69 | 51.1 | 3.07 | 3.07 | ||
| 19 | 2g | -CH3 | -H | 1.85 | 1.84 | 66.6 | 4.18 | 4.78 | 20.6 | 1.31 |
| 20 | 2h | -CH3 | -CH3 | 1.73 | 1.70 | 51.1 | 3.60 | 3.60 | 18.6 | 1.27 |
| 21 | 2i | -CH3 | -CH2CH3 | 1.82 | 1.80 | 63.3 | 3.92 | 3.92 | 19.3 | 1.28 |
| 22 | 2j | -CH3 | -CH2CH2CH3 | 1.84 | 1.82 | 65.5 | 3.34 | 3.64 | 15.6 | 1.19 |
| 23 | 2k | -CH3 | -CH(CH3)CH3 | 1.82 | 1.79 | 63.3 | 3.34 | 3.64 | 15.0 | 1.18 |
| 24 | 2l | -CH3 | -Ph | 1.74 | 1.71 | 48.8 | 3.69 | 4.00 | 15.6 | 1.19 |
| εHOMO | εLUMO | Δε | μ | σ | η | χ | ω | ||
|---|---|---|---|---|---|---|---|---|---|
| 1 | 1a | −6.67 | −2.47 | 4.20 | −4.57 | 0.476 | 2.10 | 4.57 | 4.97 |
| 2 | 1b | −6.47 | −2.39 | 4.08 | −4.43 | 0.490 | 2.04 | 4.43 | 4.81 |
| 3 | 1c | −6.47 | −2.39 | 4.08 | −4.43 | 0.490 | 2.04 | 4.43 | 4.81 |
| 4 | 1d | −6.43 | −2.37 | 4.06 | −4.40 | 0.493 | 2.03 | 4.40 | 4.77 |
| 5 | 1e | −6.44 | −2.37 | 4.07 | −4.41 | 0.491 | 2.04 | 4.41 | 4.77 |
| 6 | 1f | −6.20 | −2.46 | 3.74 | −4.33 | 0.535 | 1.87 | 4.33 | 5.01 |
| 7 | 1g | −6.64 | −2.38 | 4.26 | −4.51 | 0.469 | 2.13 | 4.51 | 4.77 |
| 8 | 1h | −6.44 | −2.31 | 4.13 | −4.38 | 0.484 | 2.07 | 4.38 | 4.63 |
| 9 | 1i | −6.43 | −2.30 | 4.13 | −4.37 | 0.484 | 2.07 | 4.37 | 4.61 |
| 10 | 1j | −6.39 | −2.28 | 4.11 | −4.34 | 0.487 | 2.08 | 4.34 | 4.57 |
| 11 | 1k | −6.40 | −2.28 | 4.12 | −4.34 | 0.485 | 2.06 | 4.34 | 4.57 |
| 12 | 1l | −6.17 | −2.38 | 3.79 | −4.28 | 0.528 | 1.90 | 4.28 | 4.82 |
| 13 | 2a | −6.29 | −3.21 | 3.08 | −4.75 | 0.649 | 1.54 | 4.75 | 7.33 |
| 14 | 2b | −6.17 | −3.13 | 3.04 | −4.65 | 0.658 | 1.52 | 4.65 | 7.11 |
| 15 | 2c | −6.16 | −3.12 | 3.04 | −4.64 | 0.658 | 1.52 | 4.64 | 7.08 |
| 16 | 2d | −6.14 | −3.10 | 3.04 | −4.62 | 0.658 | 1.52 | 4.62 | 7.02 |
| 17 | 2e | −6.15 | −3.11 | 3.04 | −4.63 | 0.658 | 1.52 | 4.63 | 7.05 |
| 18 | 2f | −6.12 | −3.17 | 2.95 | −4.65 | 0.678 | 1.48 | 4.65 | 7.31 |
| 19 | 2g | −6.20 | −3.15 | 3.05 | −4.68 | 0.656 | 1.53 | 4.68 | 7.17 |
| 20 | 2h | −6.09 | −3.07 | 3.02 | −4.58 | 0.662 | 1.51 | 4.58 | 6.95 |
| 21 | 2i | −6.08 | −3.06 | 3.02 | −4.57 | 0.662 | 1.51 | 4.57 | 6.92 |
| 22 | 2j | −6.06 | −3.07 | 2.99 | −4.57 | 0.669 | 1.50 | 4.57 | 6.97 |
| 23 | 2k | −6.06 | −3.07 | 2.99 | −4.57 | 0.669 | 1.50 | 4.57 | 6.97 |
| 24 | 2l | −6.04 | −3.11 | 2.93 | −4.58 | 0.683 | 1.45 | 4.58 | 7.14 |
| Activity | Eq. | Equation | R2 | Q2LOO | n |
|---|---|---|---|---|---|
| A. niger | X1 | log(%MGI) = − 0.2158(GTSv6) − 17.6409(BELe8) − 0.2339(BEHp5) + 40.537 | 0.768 | 0.602 | 19 |
| A. flavus | X2 | log(%MGI) = 0.2485(MTam7) + 2.7052(BELe3) + 0.0738(#RCRR) − 4.9326 | 0.725 | 0.614 | 19 |
| Penicillium sp. | X3 | %MGI = −11844.7257(AVC5) − 0.0083(MTmp9) + 0.4168(CBtpc) + 843.168 | 0.735 | 0.622 | 19 |
| S. aureus | X4 | pIC50 = 1.8950(GTSe7) + 4.6320(BEHe7) − 4.2409(εHOMO) − 41.5777 | 0.746 | 0.604 | 19 |
| B. subtilis | X5 | pIC50 = −4.6029(GTSv3) + 2.0233(GTSe7) + 0.8941(Δε) + 0.5419 | 0.749 | 0.613 | 19 |
| E. coli | X6 | DGI = −13.9498(BEHm6) − 6.4231(εHOMO) + 85.321 | 0.763 | 0.617 | 12 |
| P. aeruginosa | X7 | log(DGI) = − 1.2342(GTap2) − 0.3167(εHOMO) + 0.4678 | 0.754 | 0.510 | 12 |
| X1 A. niger | X2 A. flavus | X3 Penicillium sp. | X4 S. aureus | X5 B. subtilis | X6 E. coli | X7 P. aeruginosa | |
|---|---|---|---|---|---|---|---|
| Training Set | |||||||
| R2 | 0.768 | 0.725 | 0.735 | 0.746 | 0.749 | 0.763 | 0.754 |
| Q2LOO | 0.602 | 0.614 | 0.622 | 0.604 | 0.613 | 0.617 | 0.510 |
| R2adj | 0.722 | 0.671 | 0.681 | 0.695 | 0.699 | 0.711 | 0.700 |
| SPRESS | 0.0393 | 0.0372 | 4.9296 | 0.4341 | 0.4315 | 1.495 | 0.0401 |
| n | 19 | 19 | 19 | 19 | 19 | 12 | 12 |
| s | 0.03 | 0.0313 | 4.130 | 0.348 | 0.347 | 1.176 | 0.028 |
| F | 16.56 | 13.21 | 13.84 | 14.68 | 14.94 | 14.52 | 13.84 |
| p | 0.0001 | 0.0002 | 0.0001 | 0.0001 | 0.0001 | 0.0015 | 0.0018 |
| X1 A. niger | X2 A. flavus | X3 Penicillium sp. | X4 S. aureus | X5 B. subtilis | X6 E. coli | X7 P. aeruginosa | |
|---|---|---|---|---|---|---|---|
| Test Set | |||||||
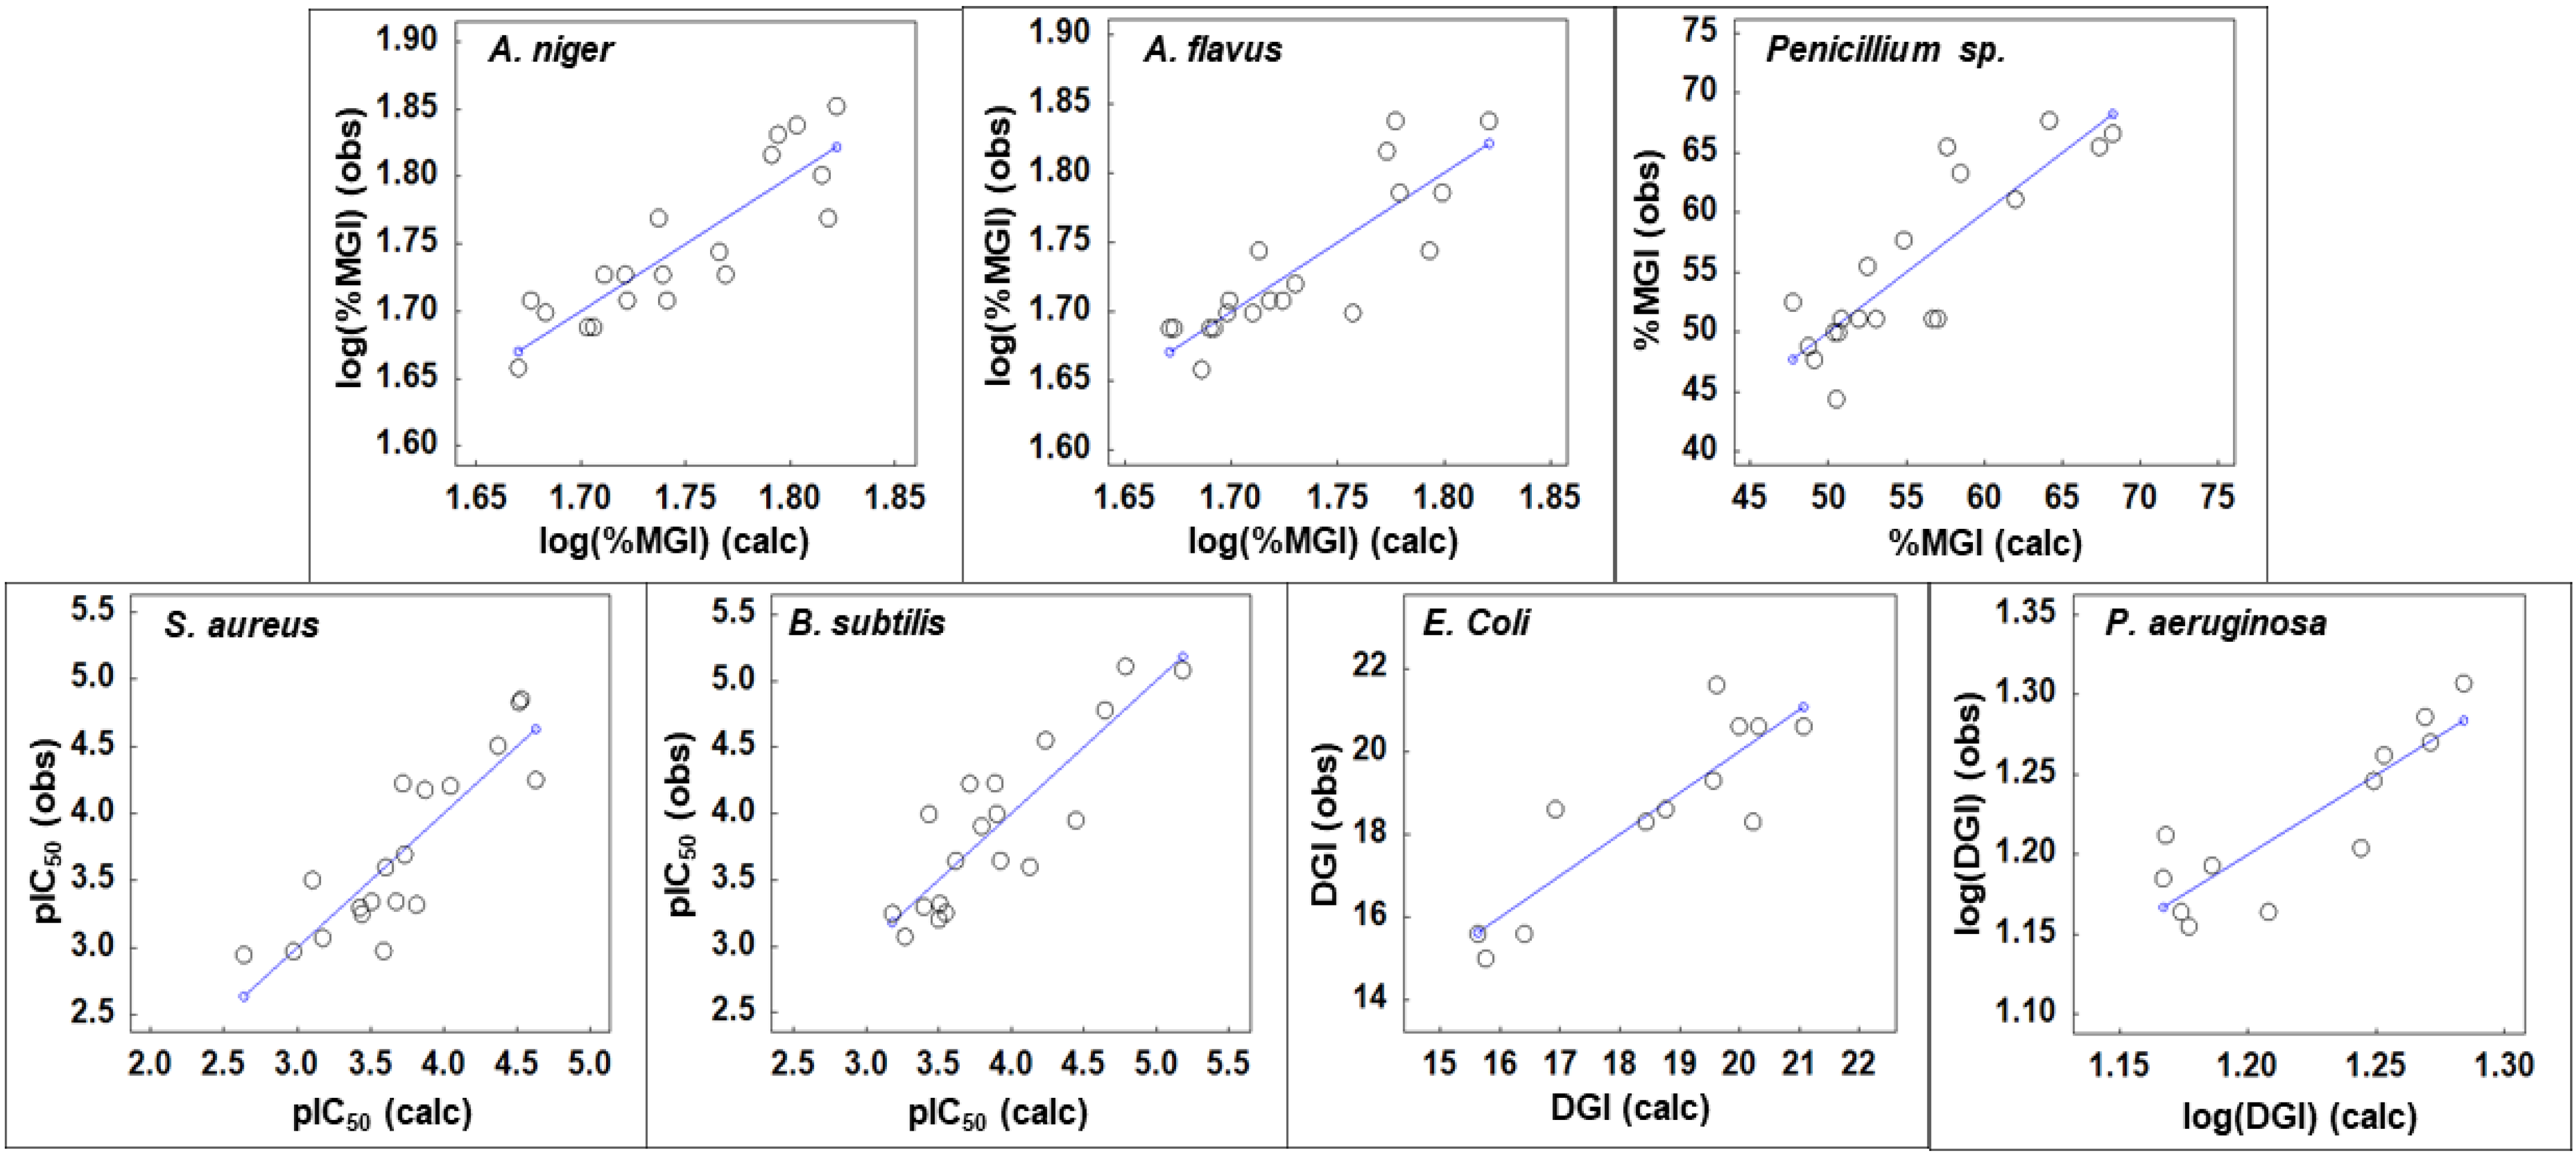
| Rext | 0.845 | 0.955 | 0.830 | 0.792 | 0.983 | 0.867 | 0.794 |
| R2ext | 0.713 | 0.911 | 0.688 | 0.627 | 0.966 | 0.751 | 0.631 |
| R2ext-adj | 0.618 | 0.882 | 0.584 | 0.502 | 0.956 | 0.668 | 0.508 |
| F | 7.47 | 30.90 | 6.62 | 5.04 | 87.44 | 9.06 | 5.13 |
| RMSE | 0.030 | 0.018 | 3.47 | 0.375 | 0.152 | 0.948 | 0.050 |
| MAE | 0.025 | 0.009 | 2.230 | 0.300 | 0.105 | 0.736 | 0.043 |
| MAPE | 1.4 | 0.5 | 3.7 | 7.0 | 2.4 | 4.0 | 3.4 |
| Test Set RTO | |||||||
| R2ext-RTO | 1 | 1 | 0.997 | 0.992 | 0.999 | 0.998 | 0.998 |
| F | 15,112 | 124,471 | 1456 | 526 | 3997 | 1710 | 2562 |
| n | 5 | 5 | 5 | 5 | 5 | 5 | 5 |
Publisher’s Note: MDPI stays neutral with regard to jurisdictional claims in published maps and institutional affiliations. |
© 2020 by the authors. Licensee MDPI, Basel, Switzerland. This article is an open access article distributed under the terms and conditions of the Creative Commons Attribution (CC BY) license (http://creativecommons.org/licenses/by/4.0/).
Share and Cite
Appell, M.; Compton, D.L.; Evans, K.O. Predictive Quantitative Structure–Activity Relationship Modeling of the Antifungal and Antibiotic Properties of Triazolothiadiazine Compounds. Methods Protoc. 2021, 4, 2. https://0-doi-org.brum.beds.ac.uk/10.3390/mps4010002
Appell M, Compton DL, Evans KO. Predictive Quantitative Structure–Activity Relationship Modeling of the Antifungal and Antibiotic Properties of Triazolothiadiazine Compounds. Methods and Protocols. 2021; 4(1):2. https://0-doi-org.brum.beds.ac.uk/10.3390/mps4010002
Chicago/Turabian StyleAppell, Michael, David L. Compton, and Kervin O. Evans. 2021. "Predictive Quantitative Structure–Activity Relationship Modeling of the Antifungal and Antibiotic Properties of Triazolothiadiazine Compounds" Methods and Protocols 4, no. 1: 2. https://0-doi-org.brum.beds.ac.uk/10.3390/mps4010002