
FeelMusic: Enriching Our Emotive Experience of Music through Audio-Tactile Mappings

1
Department of Engineering Mathematics, University of Bristol, Bristol BS8 1TH, UK
2
School of Psychological Science, University of Bristol, Bristol BS8 1TH, UK
*
Author to whom correspondence should be addressed.
Multimodal Technol. Interact. 2021, 5(6), 29; https://0-doi-org.brum.beds.ac.uk/10.3390/mti5060029
Submission received: 5 March 2021
/
Revised: 21 May 2021
/
Accepted: 24 May 2021
/
Published: 31 May 2021
(This article belongs to the Special Issue Musical Interactions)
Abstract
:We present and evaluate the concept of FeelMusic and evaluate an implementation of it. It is an augmentation of music through the haptic translation of core musical elements. Music and touch are intrinsic modes of affective communication that are physically sensed. By projecting musical features such as rhythm and melody into the haptic domain, we can explore and enrich this embodied sensation; hence, we investigated audio-tactile mappings that successfully render emotive qualities. We began by investigating the affective qualities of vibrotactile stimuli through a psychophysical study with 20 participants using the circumplex model of affect. We found positive correlations between vibration frequency and arousal across participants, but correlations with valence were specific to the individual. We then developed novel FeelMusic mappings by translating key features of music samples and implementing them with “Pump-and-Vibe”, a wearable interface utilising fluidic actuation and vibration to generate dynamic haptic sensations. We conducted a preliminary investigation to evaluate the FeelMusic mappings by gathering 20 participants’ responses to the musical, tactile and combined stimuli, using valence ratings and descriptive words from Hevner’s adjective circle to measure affect. These mappings, and new tactile compositions, validated that FeelMusic interfaces have the potential to enrich musical experiences and be a means of affective communication in their own right. FeelMusic is a tangible realisation of the expression “feel the music”, enriching our musical experiences.
1. Introduction
Music and touch are profound modes of emotive communication embedded in human cultures across the globe [1,2,3]. They are intrinsically linked to our social and cultural identities [4], causing measurable psychological and physiological changes [5]. With the power to move us both emotionally and physically, the combination of music and touch has the potential to enhance our experience of both and give rise to new modes of communication. The purpose of this study is to improve our understanding of our affective (emotional) responses to tactile sensations and explore audio-tactile mappings for the translation of music into touch, thereby informing the emerging field of haptic interfaces and wearables.
Mapping sound onto the tactile domain has been explored in a variety of projects for applications such as enhancing multi-sensory experiences in virtual reality (VR) environments [6] and improving the affective quality of digital touch [7], and as a means of sensory substitution for people with hearing loss [8]. It has been shown that the addition of full body vibration to a musical auditory experience increases the perceived volume of music [9] and improves the overall quality of experience for listeners [10]. There is also evidence to show that people are capable of matching audible frequencies to those presented as haptic vibrations [11] and that frequency perception of both auditory and tactile stimulation occurs in the same region of the sensory cortex [12]. These results indicate the potential of tactile media to be used as a means of augmenting and substituting musical audio.
A number of devices have been designed specifically for the translation of music or affective sound into tactile sensations. These include wearable devices to help people with hearing loss to experience music, such as CuteCircuit’s SoundShirt [13], dancing shoes that communicate rhythm [14], a wrist-worn device emphasising surrounding noises [15] and a collar that plays music from an iPod/phone [16]. Other wearable haptic interfaces include a vest [17,18] containing a vibrotactile array on the back relaying real-time data to the wearer subliminally, and a whole body suit [19] embedded with high-frequency transducers spread evenly across the limbs and a large low frequency transducer on the back onto which tactile pieces were composed directly for the haptic experience. This suit was tested by conducting a “tactile concert” in which audience members wore the device and experienced a series of pieces with different combinations of musical and tactile sensations.
Non-wearable interfaces include the emoti-chair [20,21] that processes musical input into discrete channels mapped to a vibrotactile display on the user’s back and an armchair and a sofa suite [22] with embedded voicecoil actuators to emulate the feeling of being at a concert or live performance.
What was hitherto not fully explored with these devices was whether the affective qualities of music can be effectively translated or enhanced by the tactile sensations. This is an important distinction to make, since our emotional response is arguably a key factor in why music is a compelling medium and means of communication. These devices all use some modified or filtered version of the original sound signal as the vibration output. However, features of the music such as melody and rhythm have been shown to influence our emotive response to music [23,24] and so translating these onto the haptic space may be more effective at evoking a corresponding affective response. It has been shown that there are consistent interpretations of auditory-tactile metaphorical mappings in both musically trained and musically untrained people [25]. For example, higher pitches are perceived as “sharper, rougher, harder, colder, drier and lighter than lower pitches”. However, previous studies have produced conflicting results, and in multiple cases a strong correlation was found between features such as pitch and roughness, but the correlation direction varied between participants [26]. A better understanding of the tactile affective space is needed to be able to use this information in the design of emotive haptic interfaces.
Investigating affective responses to music and tactile stimuli requires a quantifiable means of measuring emotion. Current models of emotion fall generally into one of two categories: the discrete model, defining “basic” emotions by characteristic descriptors such as anger, fear and enjoyment [27,28]; and the dimensional model, referred to as the “circumplex model of affect”, defining emotions as directions on a 2D space of valence (also referred to as pleasantness) and arousal (also referred to as intensity) [29]. Dimensional models such as this treat emotions as continuous and avoid the discrepancies in the interpretations of adjective meanings. There have been alternative forms of this 2D model [29,30,31], but the model of valence vs. arousal is the most frequently adopted and is generally described as being able to encompass all emotions. This model has been successfully used to classify affective responses to music [32].
A number of studies have used the circumplex model to record emotional responses to tactile stimuli [33,34,35,36,37,38,39,40] investigating the effects of features such as amplitude, frequency, duration and envelope of tactile sensations on wearer responses. A few trends are consistent between studies; as stimuli frequency increases, they are perceived as more intense and less pleasant and the energy of stimuli positively correlates to intensity. However, most studies found correlations to be specific to the individual—particularly in regard to valence. Responses were also dependant on the context of the tactile interaction: materials, location on the body, force, velocity and sex were all shown to influence response, which indicates the danger of generalising affective tactile sensations.
In this study we present FeelMusic, the projection of the emotive elements of music into the haptic domain. Instead of mapping an audio signal directly onto the device, as is common in the literature, we generate mappings of the rhythmic and melodic features of music, since these are elements that have been shown to impact our emotive response to music [23,24]. We implemented FeelMusic with a multi-modal wearable tactile interface “Pump-and-Vibe” and conducted a preliminary investigation into its ability to convey or enrich the emotive aspects of music.
2. Materials and Methods
Two exploratory experiments were conducted in this study. Experiment 1 was designed to gain a base understanding of the affective qualites of vibrotactile sensations and whether such stimuli can elicit a range of affects. This experiment reduced the tactile domain to an individual vibrotactile output (a tactor), thereby investigating the separate effects of frequency, amplitude and energy on affective response using the circumplex model.
The “Pump-and-Vibe” interface was subsequently developed to provide a haptic platform—a vibrotactile array with an arm squeezer—onto which FeelMusic mappings could be projected. A preliminary evaluation of the FeelMusic mappings was conducted in Experiment 2 to assess their ability to convey the emotive quality of a set of musical samples. In this experiment, participants’ recorded their responses with valence ratings and by selecting adjectives from Hevner’s circle. These experiments provide a foundational understanding of FeelMusic’s potential from which a more sophisticated interface can be developed and formally tested, incorporating the affective understanding of vibrotactile stimuli from Experiment 1 with the FeelMusic mappings from Experiment 2.
2.1. Experiment 1
2.1.1. Experiment Setup
The hardware was a single tactor (electromagnetic solenoid stimulator) made by “Dancer Design” [41] held in loose, but constant contact with the pad of the index finger of each participant’s non-dominant hand. Stimuli were output to the tactor via a National Instruments Data Acquisition device and verified to ensure no clipping occurred. In all cases, the output displacement of the tactor element closely approximated the input signal and was verified for all stimuli by using a potentiostat to measure current. Participants were invited to sit in a quiet room and wear sound-cancelling headphones to reduce all external or audible distractions during the experiment. Once the tactor was attached to the fingertip, the participant was asked to rest this hand palm-up beneath the table to reduce physical or visual disturbances. For each stimulus presented, the participant was asked to rate his/her response in the circumplex plane with the horizontal axis (unpleasant (−5) to pleasant (5)) and vertical axis (calm (−5) to intense (5)). The mouse position within the 700 by 700 pixel window was recorded when he/she clicked, and the x and y values were saved. The terms pleasantness and intensity were used with participants rather than valence and arousal, since they were more easily understood. Stimuli were presented in two blocks allowing for a 2 min break in between.
2.1.2. Participants
The participants were 20 undergraduate students from various academic backgrounds. Of the 20 participants, 12 were male and 8 were female, and all were right-hand dominant.
2.1.3. Experiment Stimuli
The stimuli for the experiment took a broad variety of forms that could be generated by well-defined parametrised waveforms. They were presented in two blocks. The first block contained sine wave and square wave stimuli with frequencies 2, 4, 8, 16, 32, 64 and 128 Hz and amplitudes 2, 3 and 4 V. These waveforms describe the displacement of the tactor element normal to the skin (tactor amplitude varied linearly with voltage to maximum displacement 2 mm at 6 V). The purpose of this set of stimuli was to investigate the respective effects of vibration frequency and amplitude on affective response. The values were decided through experimentation with the tactor to determine a range that gave a variety of sensations. The frequency values increased logarithmically, since it was found that lower frequencies are easier to differentiate than high frequencies, in accordance with Weber’s law [42].
These stimuli were repeated using both sine and square waveforms to verify whether correlations found between frequency or amplitude and participant responses were general or specific to the waveform type. In total this formed a set of 42 stimuli: 21 sine waves and 21 square waves of 1.5 s each, including all combinations of frequency and amplitude. The duration was 1.5 s to reflect the beat length in a slow (40 beats per min) song. To constrain the number of stimuli presented to participants, we did not parameterise duration as well, though this is an important consideration when translating these findings into tactile compositions with different rhythms.
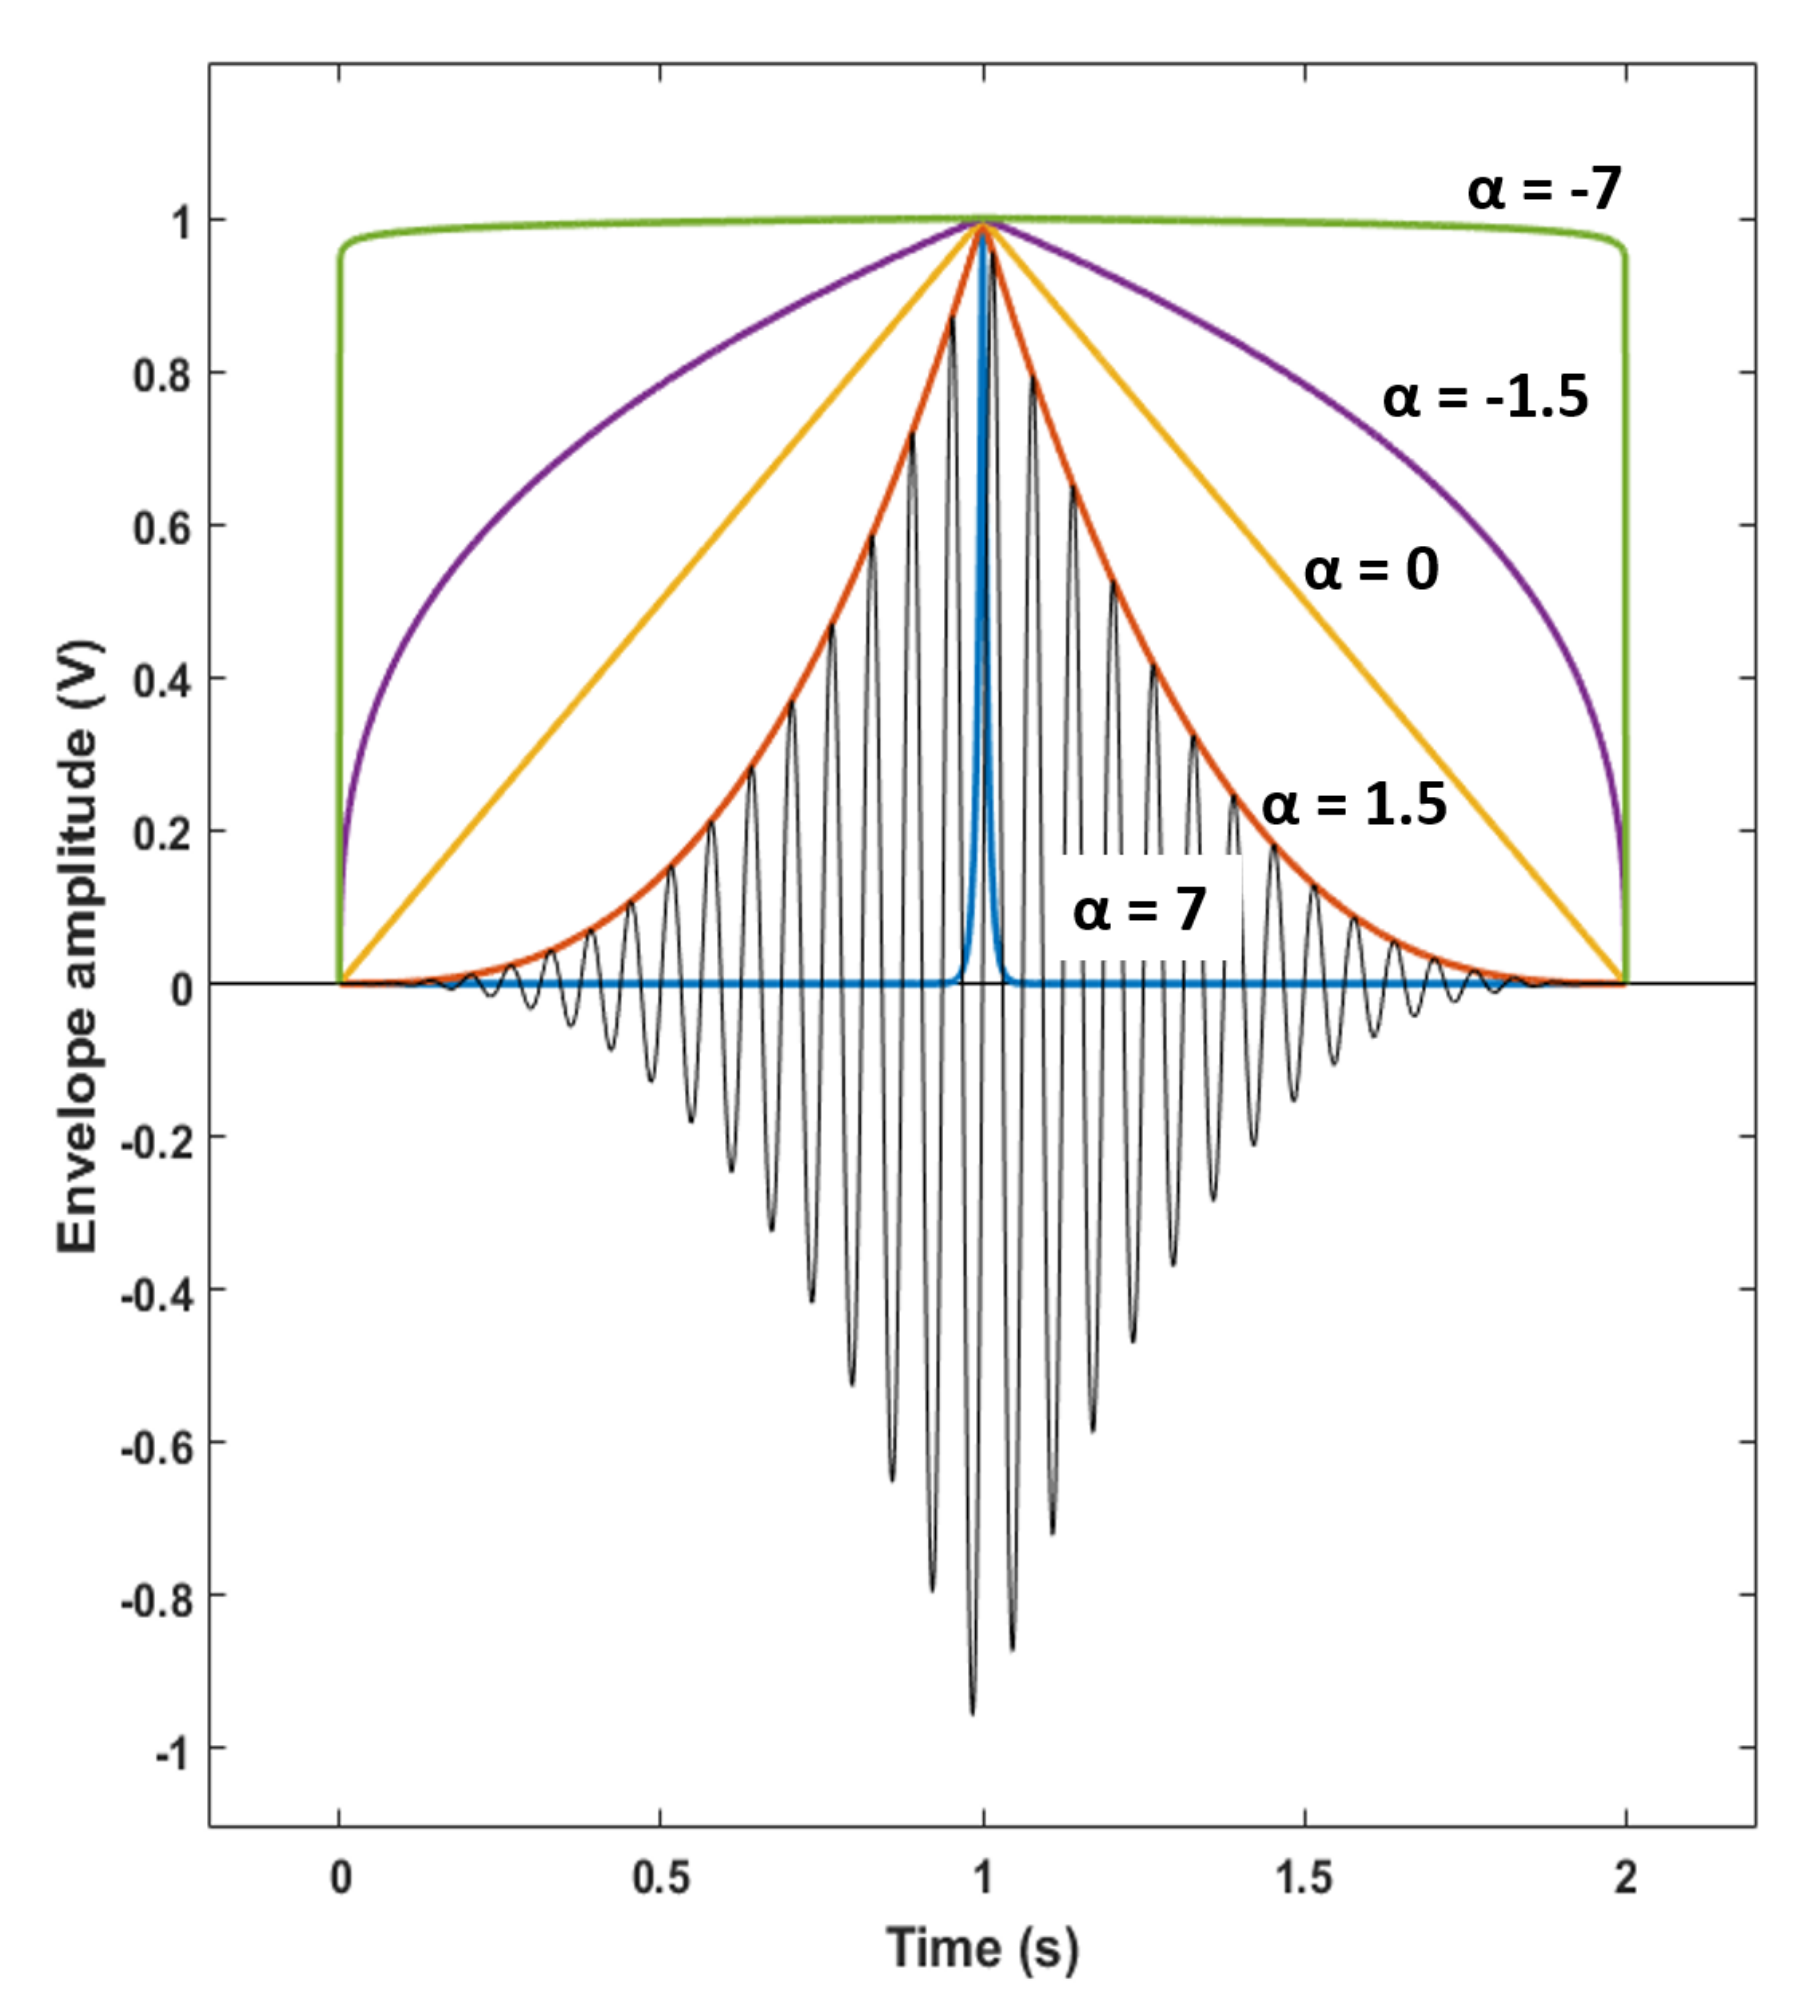
The second block of stimuli contained more complex and qualitatively varied waveforms with the aim of covering all areas of the circumplex space. A rich set of stimuli were created by multiplying a high-frequency sine wave with a parametrised envelope waveform as shown in Figure 1. The envelope types were simplified so as to have an increasing first half and a decreasing second half described by , where c is a constant defining the start time and is the control parameter taking the values −7, −1.5, 0, 1.5 and 7. The control envelopes were applied concurrently to all attributes of the stimuli. They were 2 s in duration (1 s increasing, 1 s decreasing). This duration was increased from 1.5 s (as in block 1) to 2 s to avoid clipping of the stimulus. Changing varies the onset and offset shape of the pulse, affecting the qualitative “sharpness” of the sensation as well as the energy of the stimuli. The effect of stimulus energy on affective response was evaluated using the stimuli in both blocks of the experiment.
The second block of stimuli also included 6 repeated stimuli to assess the consistency of participants in their responses to stimuli and to verify that they were able to differentiate between stimuli.
Experiment 1 provided valuable insight into our affective response to single-output vibrotactile stimuli. The results demonstrate that the stimuli elicited a range of affective responses and that participant responses were reliable. For the majority of participants, the perceived intensity of the stimulus was positively correlated with frequency, amplitude and energy, respectively. Pleasantness was more subjective to individual participants.
2.2. FeelMusic Interface Development
The next stage was to investigate musical-tactile mappings. To do this, a tactile interface with greater spatial capacity was required. Pump-and-Vibe was designed and fabricated to investigate how we respond to more complex tactile compositions and whether these compositions could potentially enrich or emulate music. Pump-and-Vibe is a wearable FeelMusic interface comprising of two modalities—fluidic actuation and vibration—that generate squeezing pressure on the upper arm and spatially-varied vibrotactile sensations on the forearm. This design is driven by the idea of conveying bass rhythms through the fluidic actuation and melody through the vibrotactile array. The device is designed to be worn like a sleeve, since the arm is an area of the body that is easily accessible, capable of detecting a wide range of haptic sensations [43] which are processed with greater emotional content than the skin of the hand [44]. In preliminary tests, users reportedly felt at ease wearing Pump-and-Vibe on the forearm, whereas a vest or device worn on the neck or ankles made some users uncomfortable which made it challenging to create a device compatible with all users, unless it was located on the forearm.
2.2.1. Pump-and-Vibe Design and Hardware
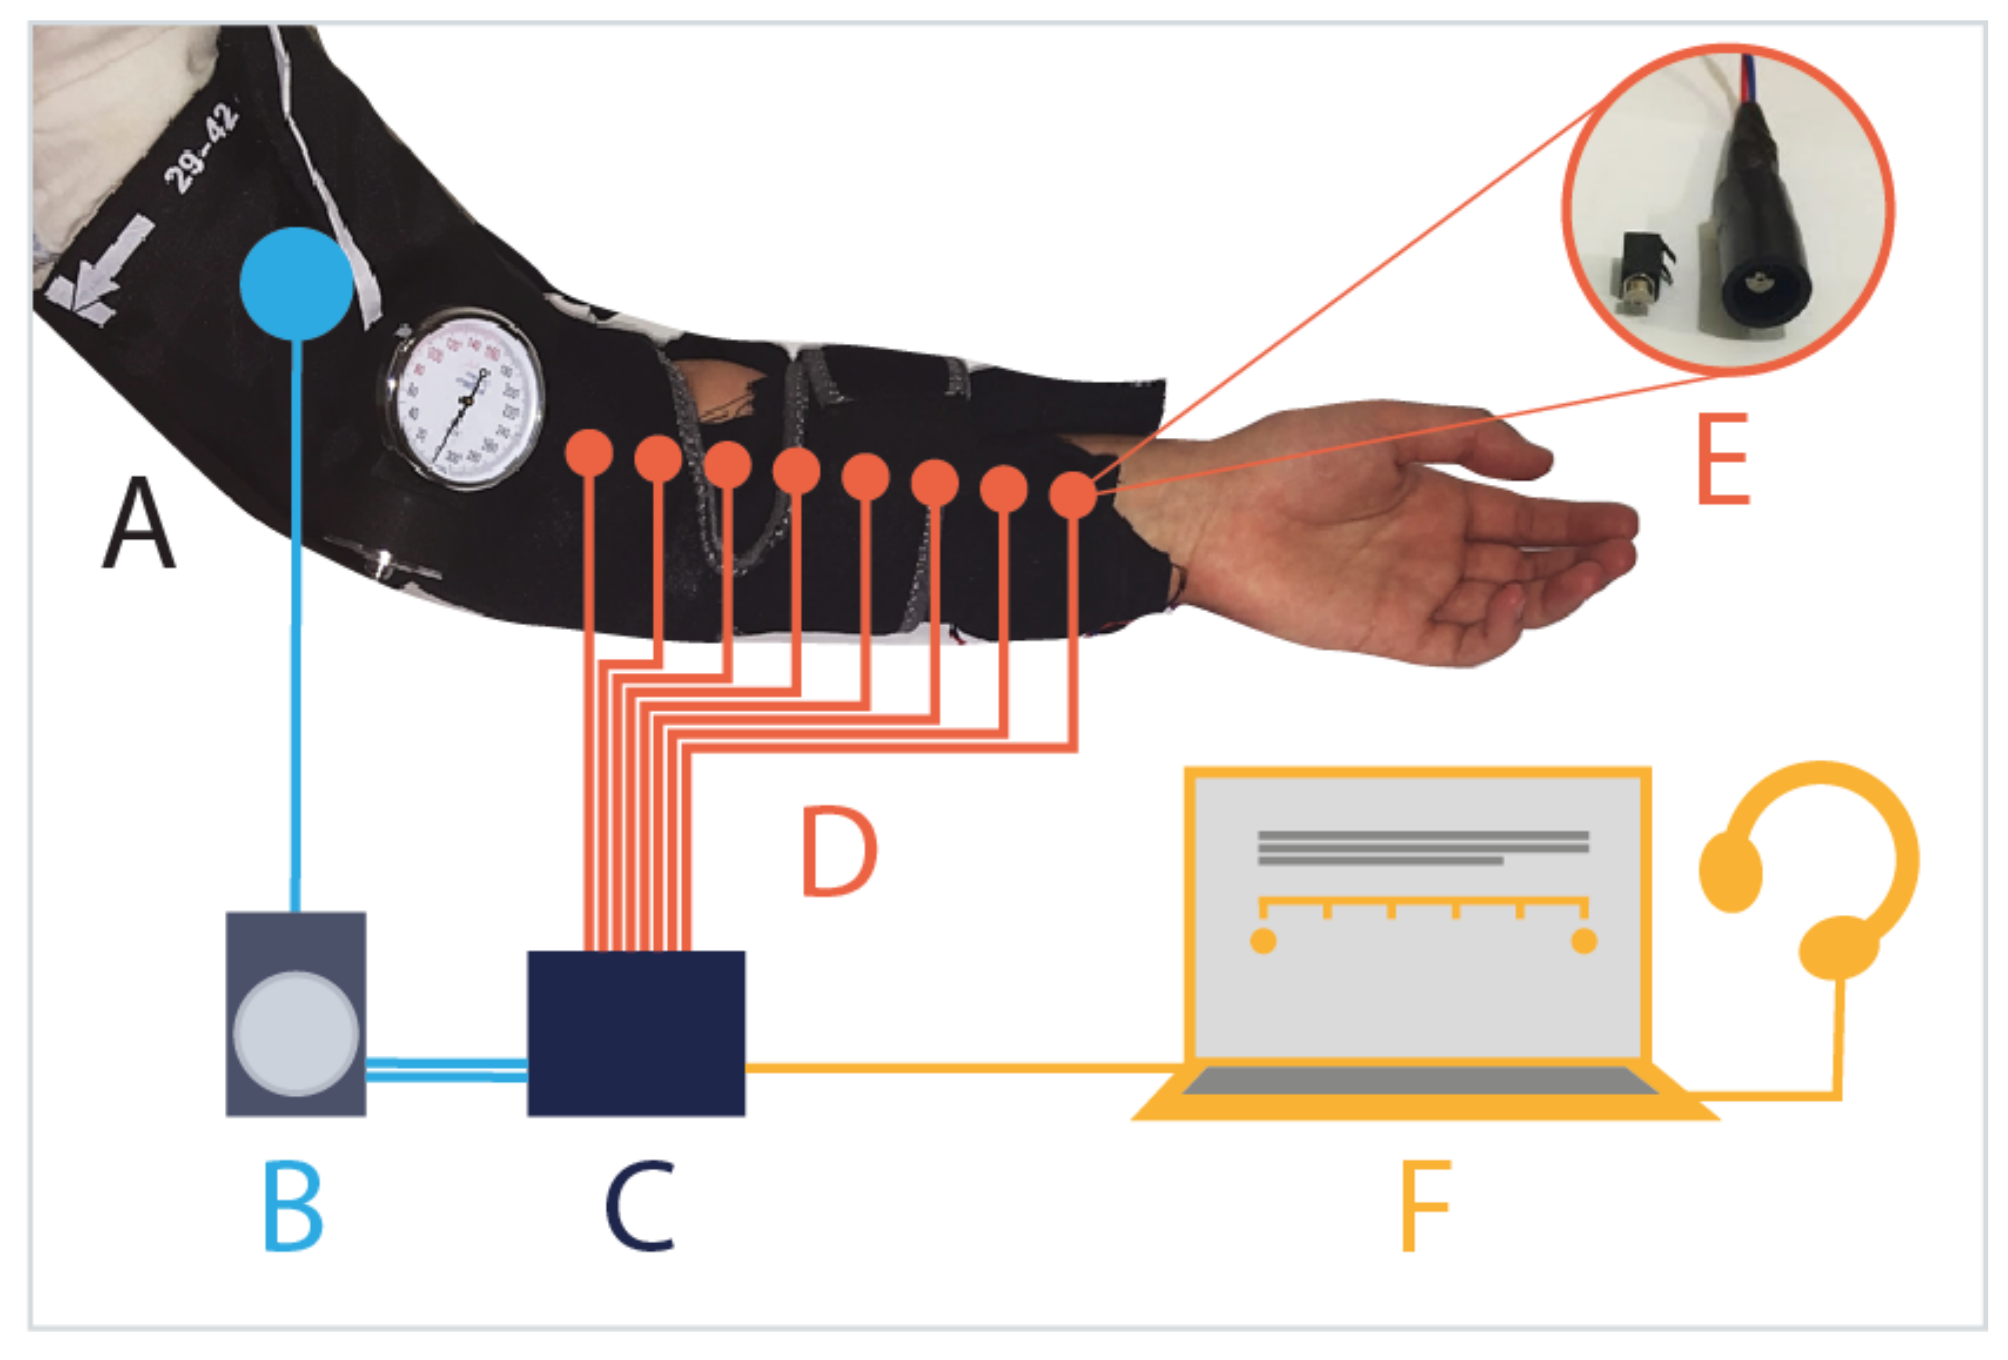
Pump-and-Vibe, as shown in Figure 2, is formed of a cotton sleeve with adjustable velcro straps and an array of inner sewn pockets into which vibration motors can be fitted. Eight vibration motors (ERM (cylindrical) motors, 3 V, 65 mA, 3000 RPM) encased in cylindrical, 1 cm diameter, hard plastic casings fit into an array of sleeve pockets and are thereby held against the skin. The plastic cases help to distribute the vibrations across the skin, and the cotton material reportedly felt more comfortable on the skin and softened the vibrations in comparison to attaching the plastic cases directly to the skin. The pockets allow the motors to be placed in a multitude of arrangements within the sleeve, such as spiralling around the forearm, in successive pairs or in one ordered line down the forearm. For the experiment the vibration motors were placed in one line down the length of the inner forearm, as this was the best position for consistency between participants while allowing for good spatial variation. Badde et al. [45] found that tactile spatial coding is complex and influenced by many factors. We aimed to minimise movement or visual feedback that might influence participant responses to the interface. Around the upper arm an inflatable cuff connected to an air pump (Airpo D2028B 12 V) forms a squeezing element that can apply pressure rhythmically to the upper arm. This allowed for an extra dimension of tactile sensation, capable of low frequency sensations that the vibration motors cannot create. The range of pressure used for the squeezing element was 30–50 mmHg, and for safety and comfort, it was ensured that the pressure was never high for periods longer than a couple of seconds. The physical squeezing sensation captures the wearer’s attention and is more comparable to natural touch than the vibration motors.
An Arduino Leonardo board with three stacked Motor Shields sets the speed of each motor and the air pump, thereby generating the desired intensity or pressure at 10 ms intervals. Motor and pump outputs for each stimulus of the experiment were prepared on a PC and written to a text file as an array of numbers. These stimulus files were copied to a micro SD card, and the card was then inserted into the SD card shield attached to the ICSP pins of the Arduino. When commanded via serial to start, the Arduino would then read a line of values directly from the relevant stimuli text file and use them to update the motor speeds at each time step. This was faster and more consistent than controlling the motors via serial communication from the PC.
The form factor of Pump-and-Vibe was guided by the musical concepts of a low-fidelity bass rhythm supporting a high-fidelity, detailed melody. The squeezer on the upper arm conveys the bass features through low-fidelity sensation. The 8 motors convey high-fidelity melodic features, inspired by the eight notes in an octave. The forearm is sensitive to high-fidelity information and the linear arrangement allowed for position to relate to pitch. This form factor provided sufficient bandwidth to display music-tactile mappings, allowing us to conduct this exploratory investigation into FeelMusic.
2.2.2. Pump-and-Vibe as a FeelMusic Interface
Pump-and-Vibe was developed to initially investigate the concept of FeelMusic and its potential applications. Although Experiment 2 was designed to test Pump-and-Vibe primarily as an enrichment of music, we were also interested in its potential as a replacement for music and as a whole new sensory medium. To explore the new FeelMusic interaction principle, a range of stimuli were created that include tactile mappings of music onto Pump-and-Vibe as well as new tactile compositions.
2.3. Mapping Music onto Pump-and-Vibe
There are many possible methods of mapping music into tactile sensations. As the tactile space becomes better understood, increasingly sophisticated mappings can be devised and tailored to the individual. Most of the existing devices designed to map music into haptic sensation use some modified or reduced version of the raw audio signal as the vibration input. For Pump-and-Vibe we chose instead to map quantifiable and recognisable features of the music such as rhythm and melody to convey the key qualitative information of the music. Since these features of music are linked to our emotive response [23], we hypothesised that the same would be true in our response to haptic sensation as touched on in previous studies [35,46]. Perceptually, these higher-order features may integrate more easily into music-related affective processing by being an “entry point” to existing sensory processes, as Schumann and O’Regan discuss in the context of sensory substitution [47] and Rizza et al. discuss in the context of tactile speech aids [48]. Other key benefits of this method include its potential to be automated and the avoidance of a two-stage mapping of music first into the affective space—which is not yet well understood—and then from the affective space to the tactile space.
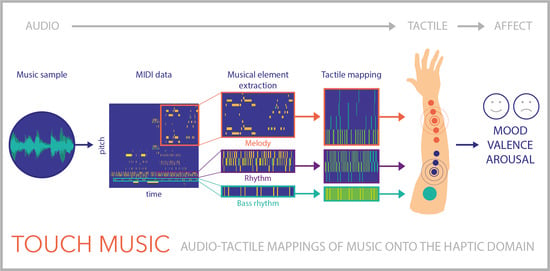
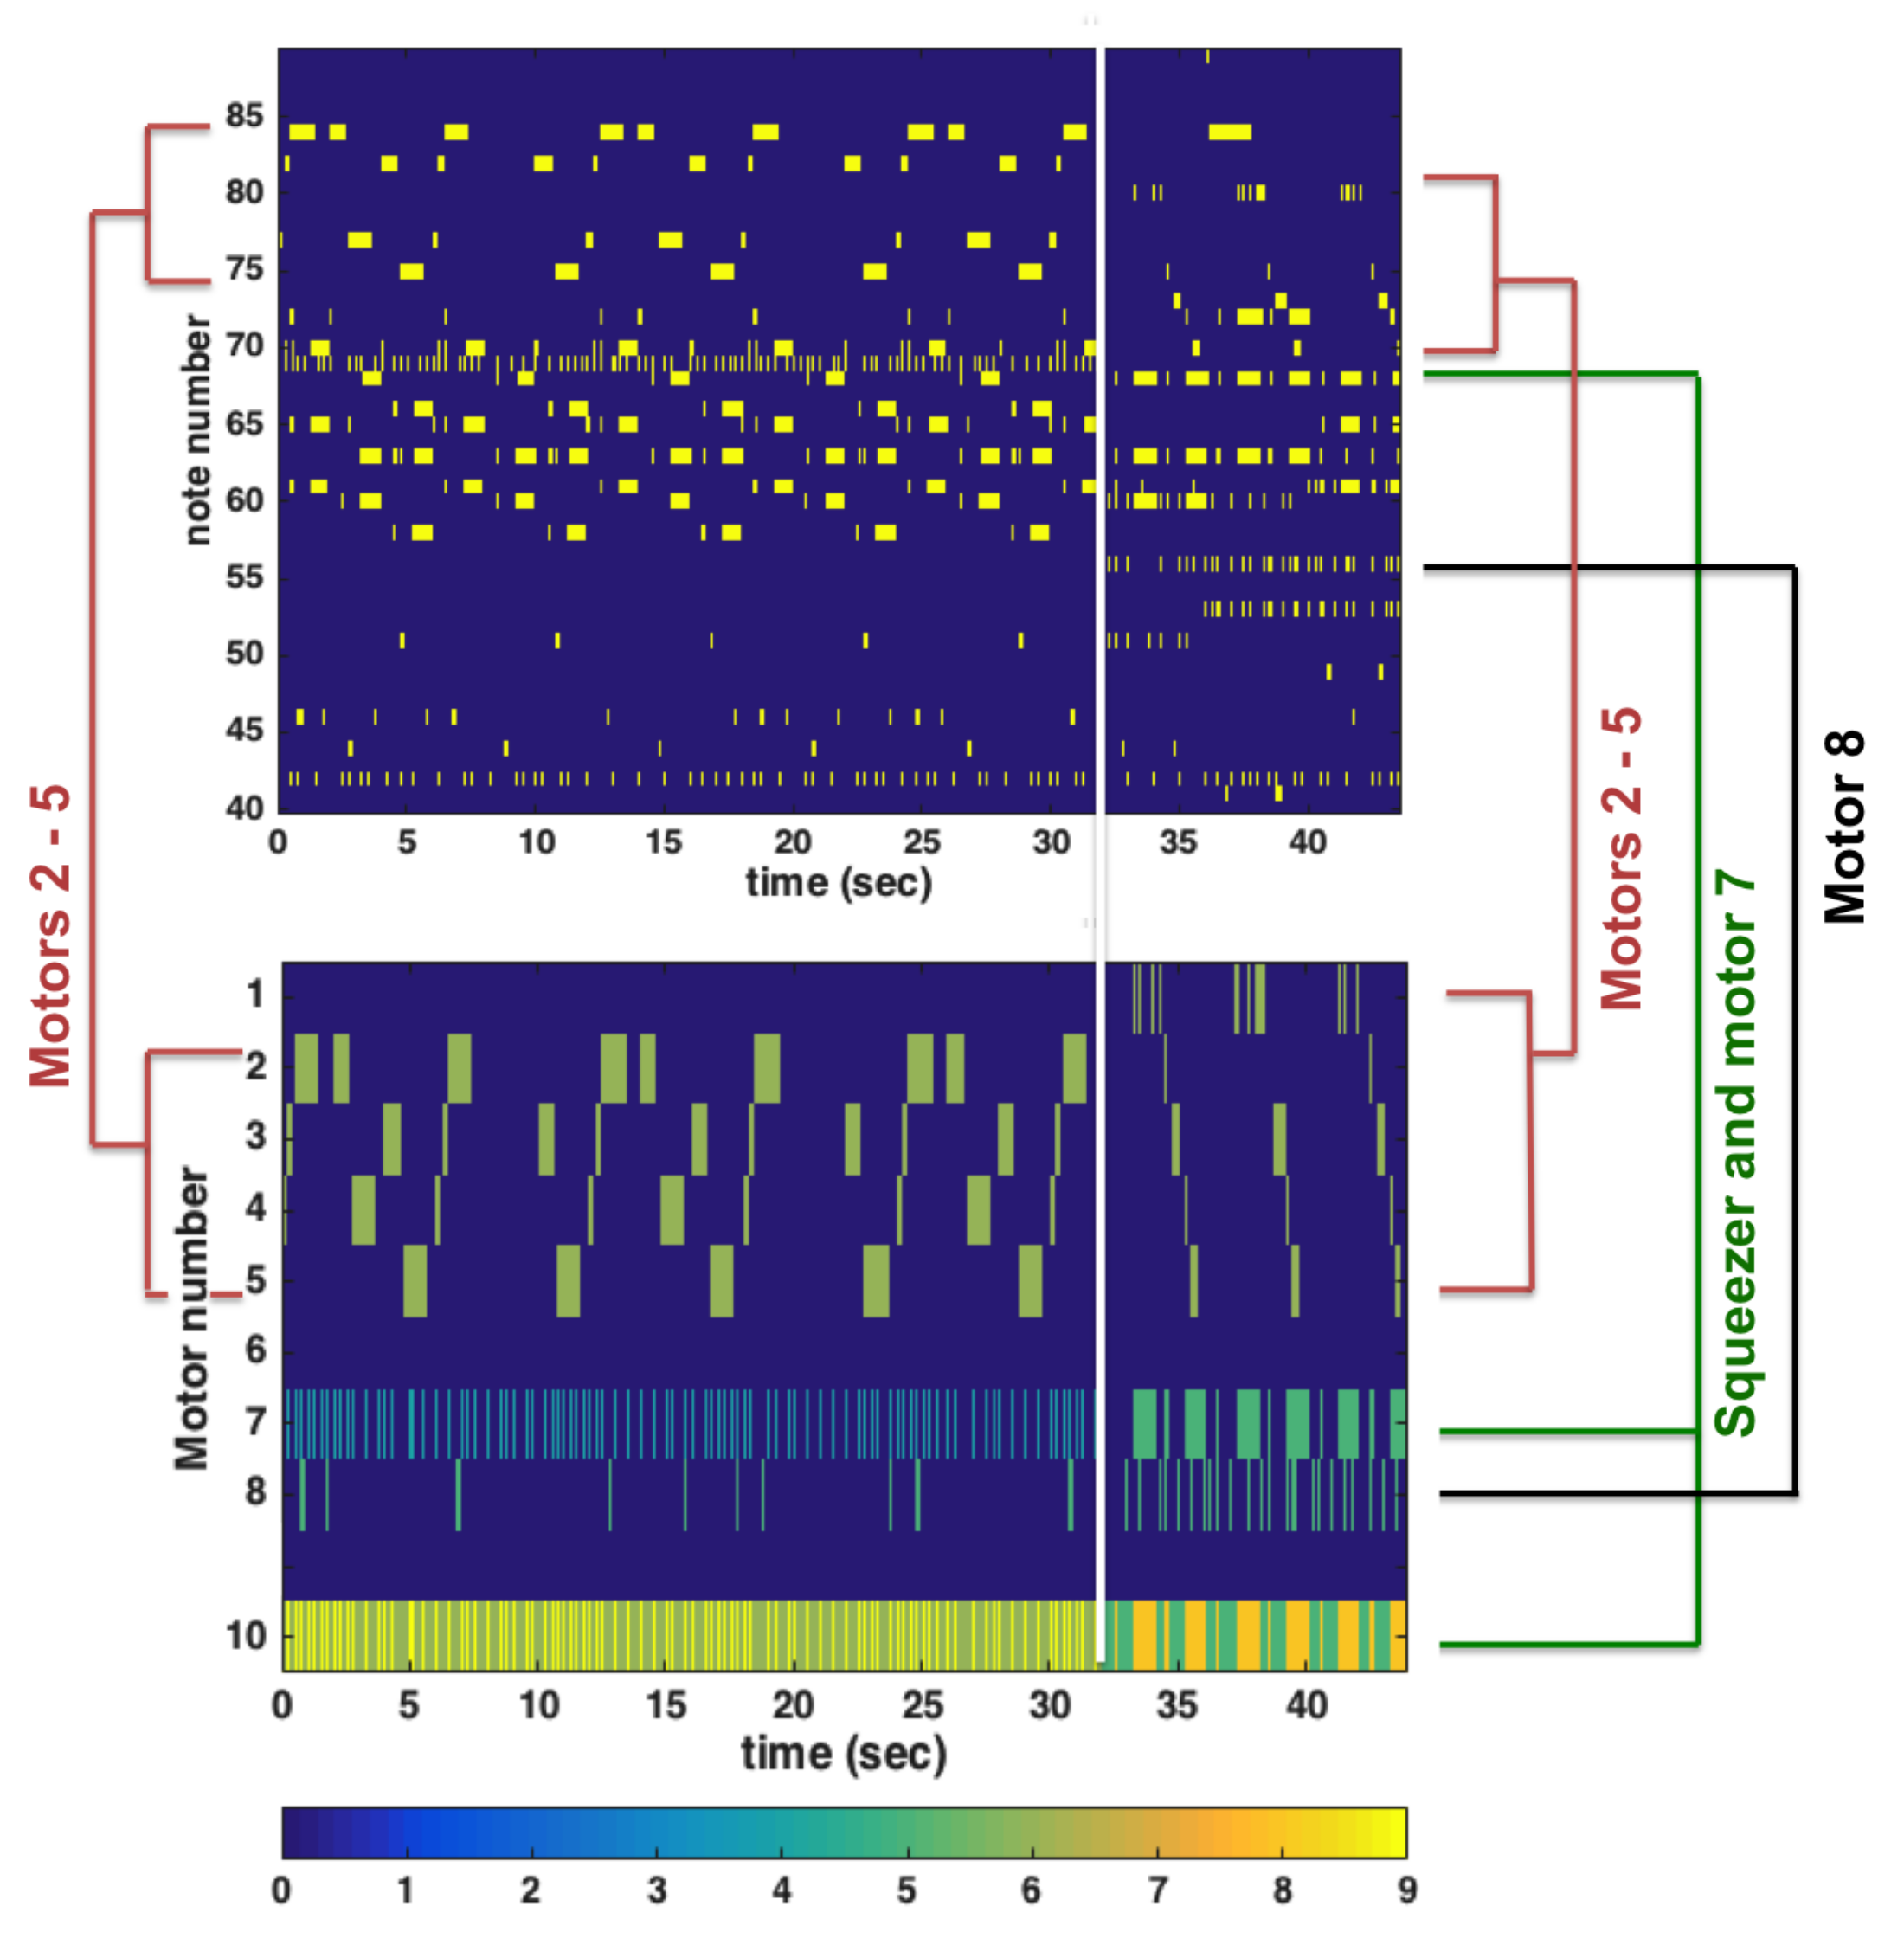
A protocol was designed for generating FeelMusic mappings of music samples. The protocol specific to Pump-and-Vibe, as illustrated in Figure 3, was used to generate mappings between original mp3 samples of music taken from a stock website (mp3 files provided in the data repository [49]) and an array of intensities to control the Pump-and-Vibe motors and squeezer. This mapping was generated and tested on music samples with clear rhythmic and melodic features. The first step in extracting information from music samples was to convert the original mp3 file to MIDI using an online converter (MIDI files provided in the data repository [49]). A package [50] was then used to read the MIDI file into Matlab allowing the extraction of note intensity and timings from each sample. The squeezer element of Pump-and-Vibe was designed to convey low pitch and low frequency elements of a piece while the spatially varied motors are capable of conveying faster rhythms and melodies. Using this principle, the fundamental bass rhythm was identified in each MIDI file and mapped onto the range of pressures available on the upper arm squeezer. Figure 4 demonstrated this for an instrumental sample of the song “Ashes to Ashes”. Quicker rhythms and percussion that were not suitable for the squeezer were mapped onto the 3 motors closest to the squeezer on low power to add detail to the rhythm section without overpowering the melody (motors 7 and 8 in Figure 4). The key melody was then identified and mapped onto the remaining 5 motors by assigning a note to each motor in order of pitch so that pitch related to position on the forearm. The pitch of these notes was not accurately represented due to the low resolution of motors, but the rhythm and change in pitch could be represented. The power supplied to the vibration motors correlated with the volume of the music. All of these combined with the squeezer values formed an array of intensities for each 10 ms time step that could be saved to a text file and implemented by the Arduino. Our decision to use a 10 ms resolution could introduce a frequency artefact into the stimuli that could cause clipping of notes within the music. However, these effects were not perceptible and 10 ms lies within the temporal window for multisensory integration and perceived synchronicity of stimuli [51,52].
Composing Novel Tactile Pieces for Pump-and-Vibe
Along with FeelMusic mappings, a set of 8 tactile stimuli were composed directly for Pump-and-Vibe. The compositions had two components—a rhythm implemented on the squeezer and a pattern of vibration on the motors. For the motors, two variables defined the vibrotactile sensation—spatial position on the forearm and intensity. These tactile compositions are an initial venture into the different types of sensation that can be generated by Pump-and-Vibe. Simple, rhythmic patterns were chosen to compare with the more complex structures of the tactile mappings from music.
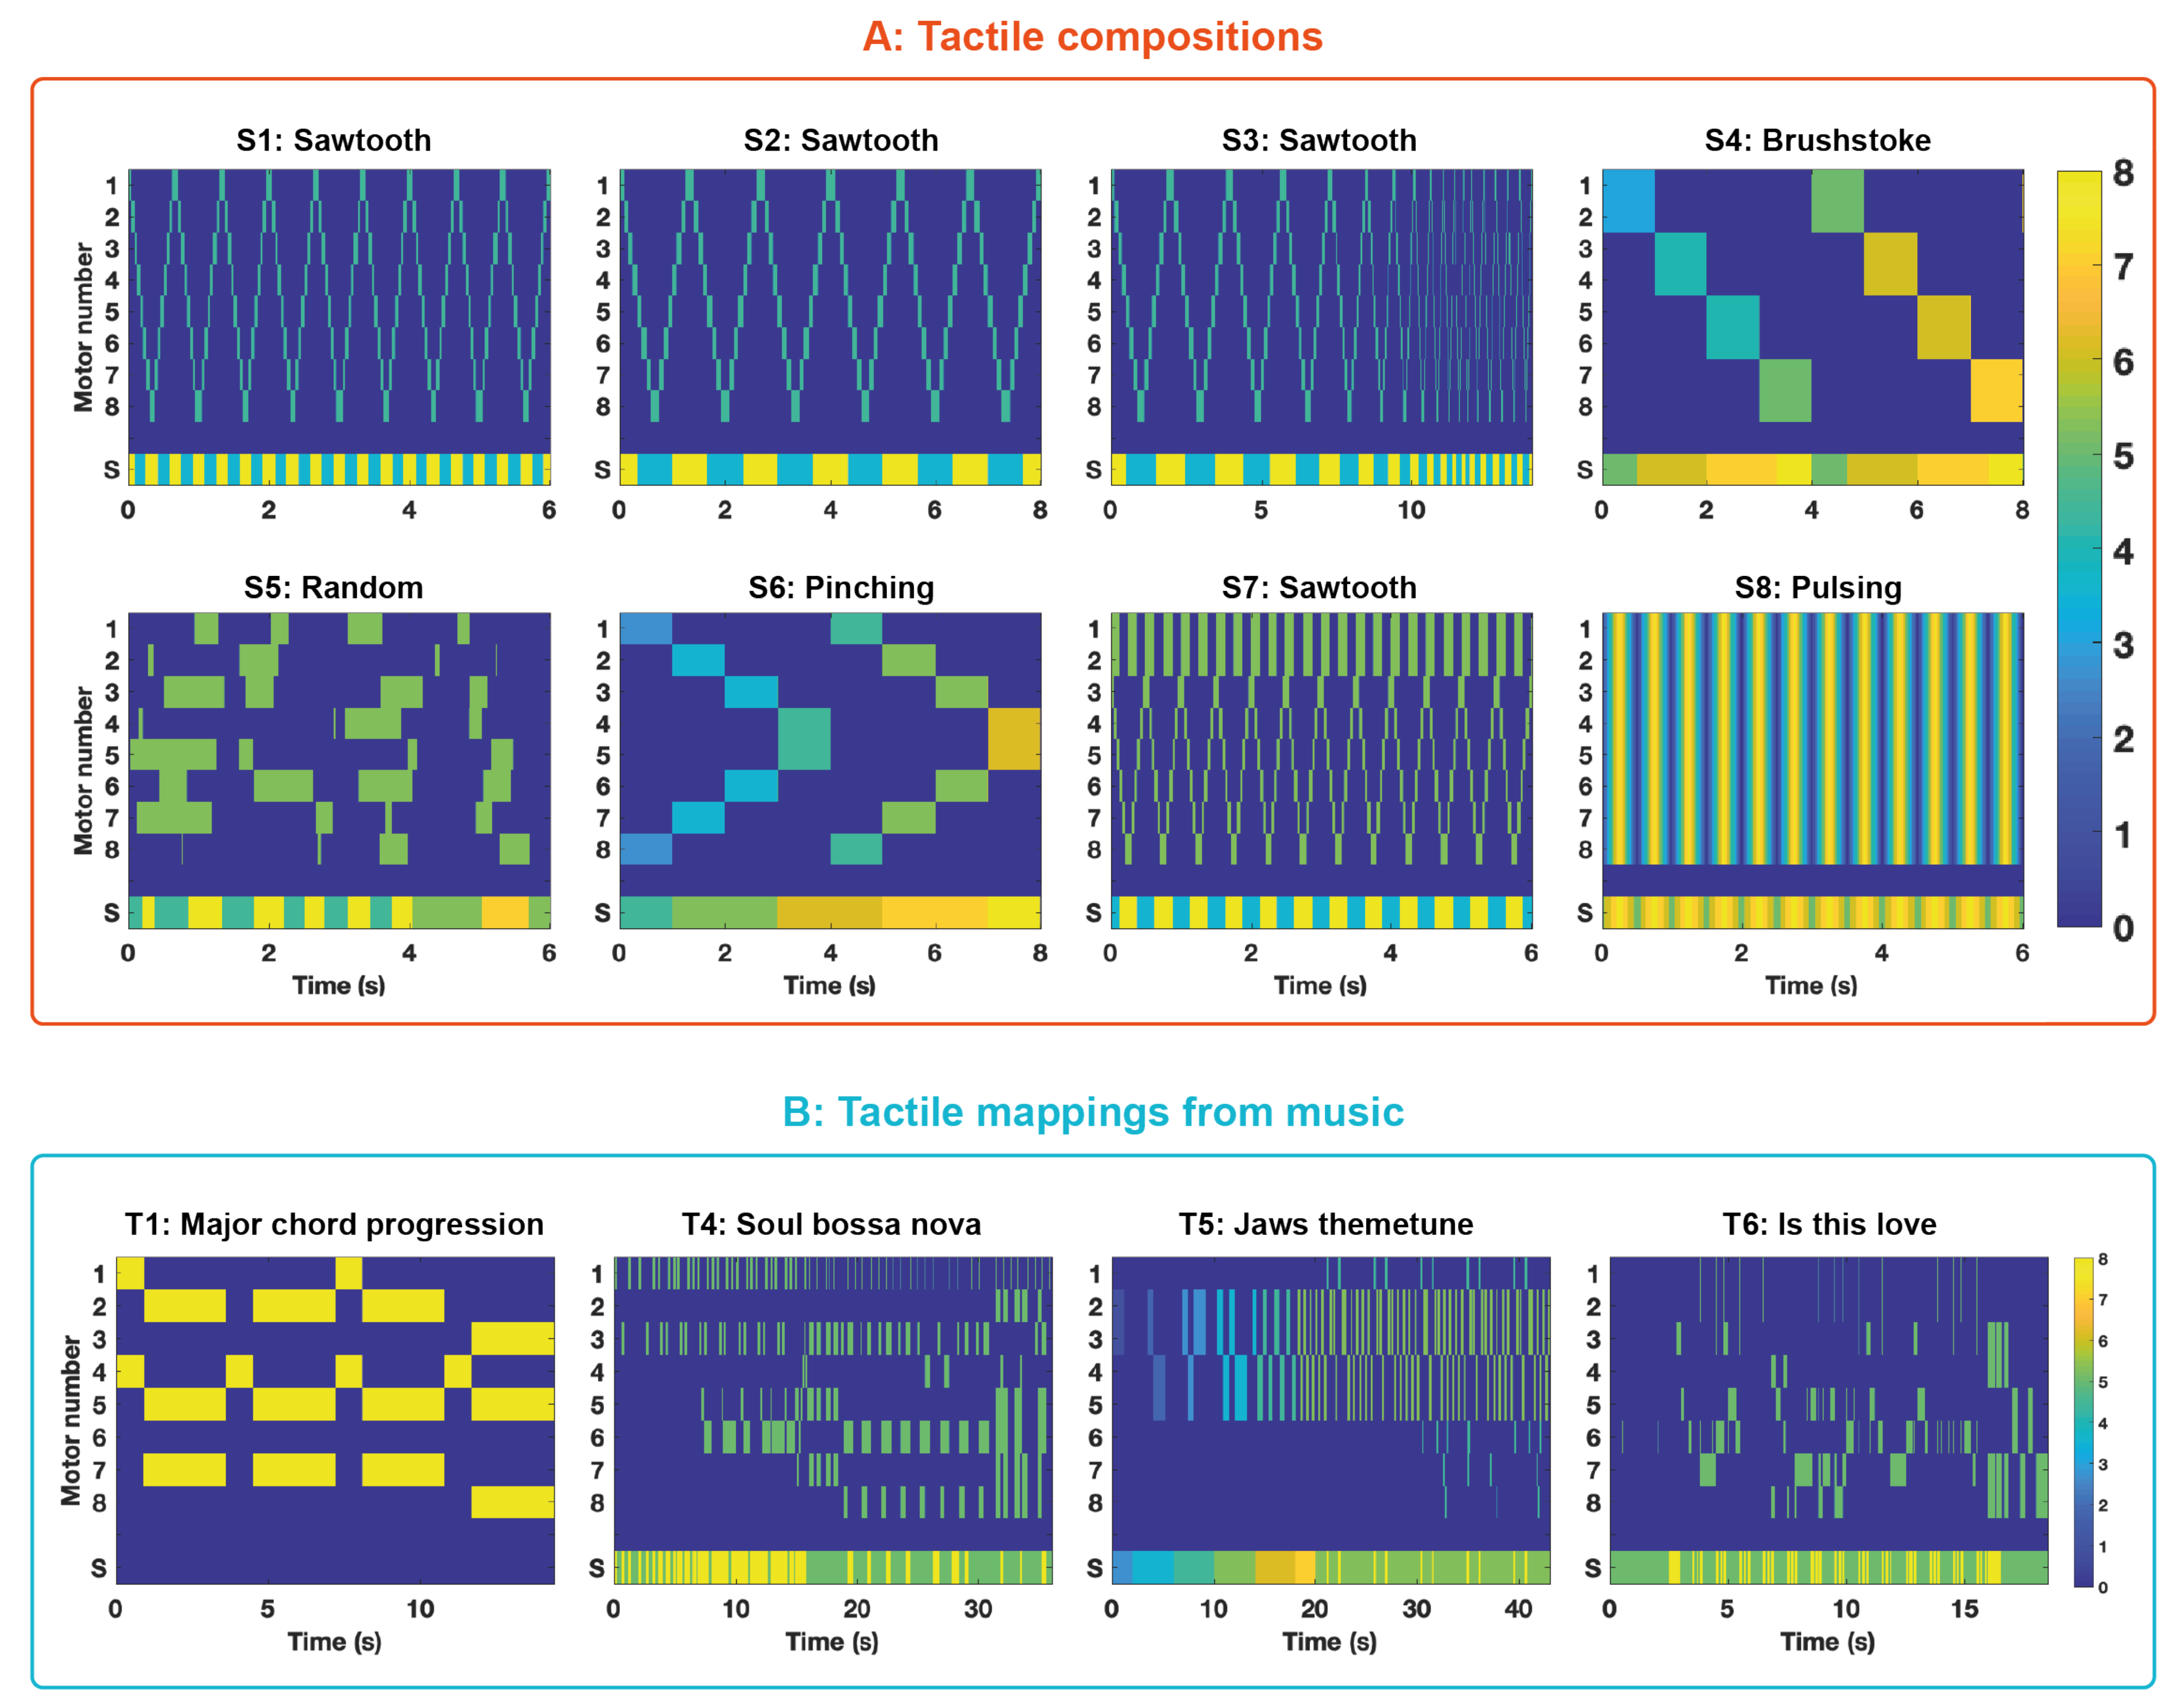
As can be seen in Figure 5A, compositions S1, S2, S3 and S7 were variations on a sawtooth waveform travelling up and down the arm, with the squeezer running at the same or double frequency in time with the motors. This movement of vibration was meant to replicate the sensation of brushing or stroking the arm. S4 was a slower, more deliberate stroking sensation with increasing intensity, and S6 was equal in pace and intensity to S4 but designed to replicate a pinching motion on the forearm. S5 was a randomly generated pattern of motors switching on and off to compare with these other patterns of sensation. The squeezer also randomly pulsed for S5, but it was ensured that these pulses did not allow the squeezer to reach a pressure outside the comfortable range. The final composition, S8, pulsed all 8 motors on and off in unison.
2.4. Experiment 2
2.4.1. Experiment Stimuli
In total, 28 stimuli were presented to participants, split into four groups. The first group was a set of 7 music samples (M1–M7), as listed in Table 1. These were presented as auditory-only stimuli. The music samples were instrumental to avoiding any additional interpretation of lyrics and chosen to have clear rhythms and melodies that could be mapped onto tactile sensations. They were selected manually from a range of genres with the aim of eliciting a variety of affective responses as found by Imbir et al. [53]. Two of the music samples were not selected by genre, but were simple chord progressions in major and minor keys. The second group was a set of 7 tactile mappings (T1–T7) generated from these music samples using the FeelMusic mapping protocol, except for T7, which was a randomly generated tactile sample as a comparison. These were presented to the participants as tactile-only stimuli. Tactile mappings T1, T4, T5 and T6 are shown in Figure 5B. The third group (S1–S8) is a separate set of 8 tactile samples composed by hand for Pump-and-Vibe, as shown in Figure 5A. The fourth group (C1–C7) is the combined presentation of the music samples (M1–M7) with their respective tactile mappings (T1–T7).
2.4.2. Experimental Setup
In a quiet room, the participants were given over-ear noise-cancelling headphones to block out external sound and asked to use a laptop and USB mouse to rank the sensations they felt or heard via an interactive questionnaire. Participants were asked to wear Pump-and-Vibe on their non-dominant arm and were given three test samples before being presented with stimuli to introduce them to the sensations created by the interface. For each stimulus, participants were asked to rate the sound or sensation on a Likert integer scale of −5 (very unpleasant) to 5 (very pleasant). Due to an error in data collection, arousal/intensity responses were not recorded and so the data contain valence responses instead of the full circumplex model. Stimuli were presented in three blocks: music only (M1–M7), tactile stimuli only (including both tactile mappings T1–T7 and compositions S1–S8) and then combinations of music and tactile stimuli (C1–C7). In each block, stimulus order was randomised per participant. The stimulus blocks were not randomised across participants. The music stimuli were presented first. Since the music samples came from well-known songs, some of which participants may have been familiar with, presenting the music samples first ensured that all participants had a degree of familiarity with the music before receiving the tactile stimuli. This potentially created some carry-over effects of the music onto the tactile stimuli. We considered that, at this exploratory stage of testing, the possible effects of participants having a cognitive association with music were negligible, especially considering that the primary aim was for the tactile stimuli to be an addition to, and enrichment of, music rather than a replacement of music.
To add a greater depth to participant responses, a subset of 12 participants were also asked to choose three adjectives to describe each stimulus. These adjectives were chosen from a specified list created using Hevner’s adjective circle [54] which contains eight groups of adjectives specific to emotions evoked by music. The original circle has varied group sizes, so only six words from each group were used here to avoid any choice bias. These are shown in Table 2 in their eight groupings. While there is no quantifiable measure of affective distance between the groups of words, they are ordered such that neighbouring groups are related and the eight groups can be aligned within the circumplex model—groups 2 and 6 relate to unpleasant and pleasant respectively, while groups 4 and 8 relate to low and high intensity respectively. This means that we can define a successful mapping from music to touch as one that inspires adjectives in the same or close groups from Hevner’s circle. The participants were presented with the adjectives in a randomised, unbiased order.
2.4.3. Participants
There were 20 participants in total, 9 female and 11 male, who were between 20 and 70 years old. All were right-hand dominant.
3. Results
3.1. Experiment 1 Results
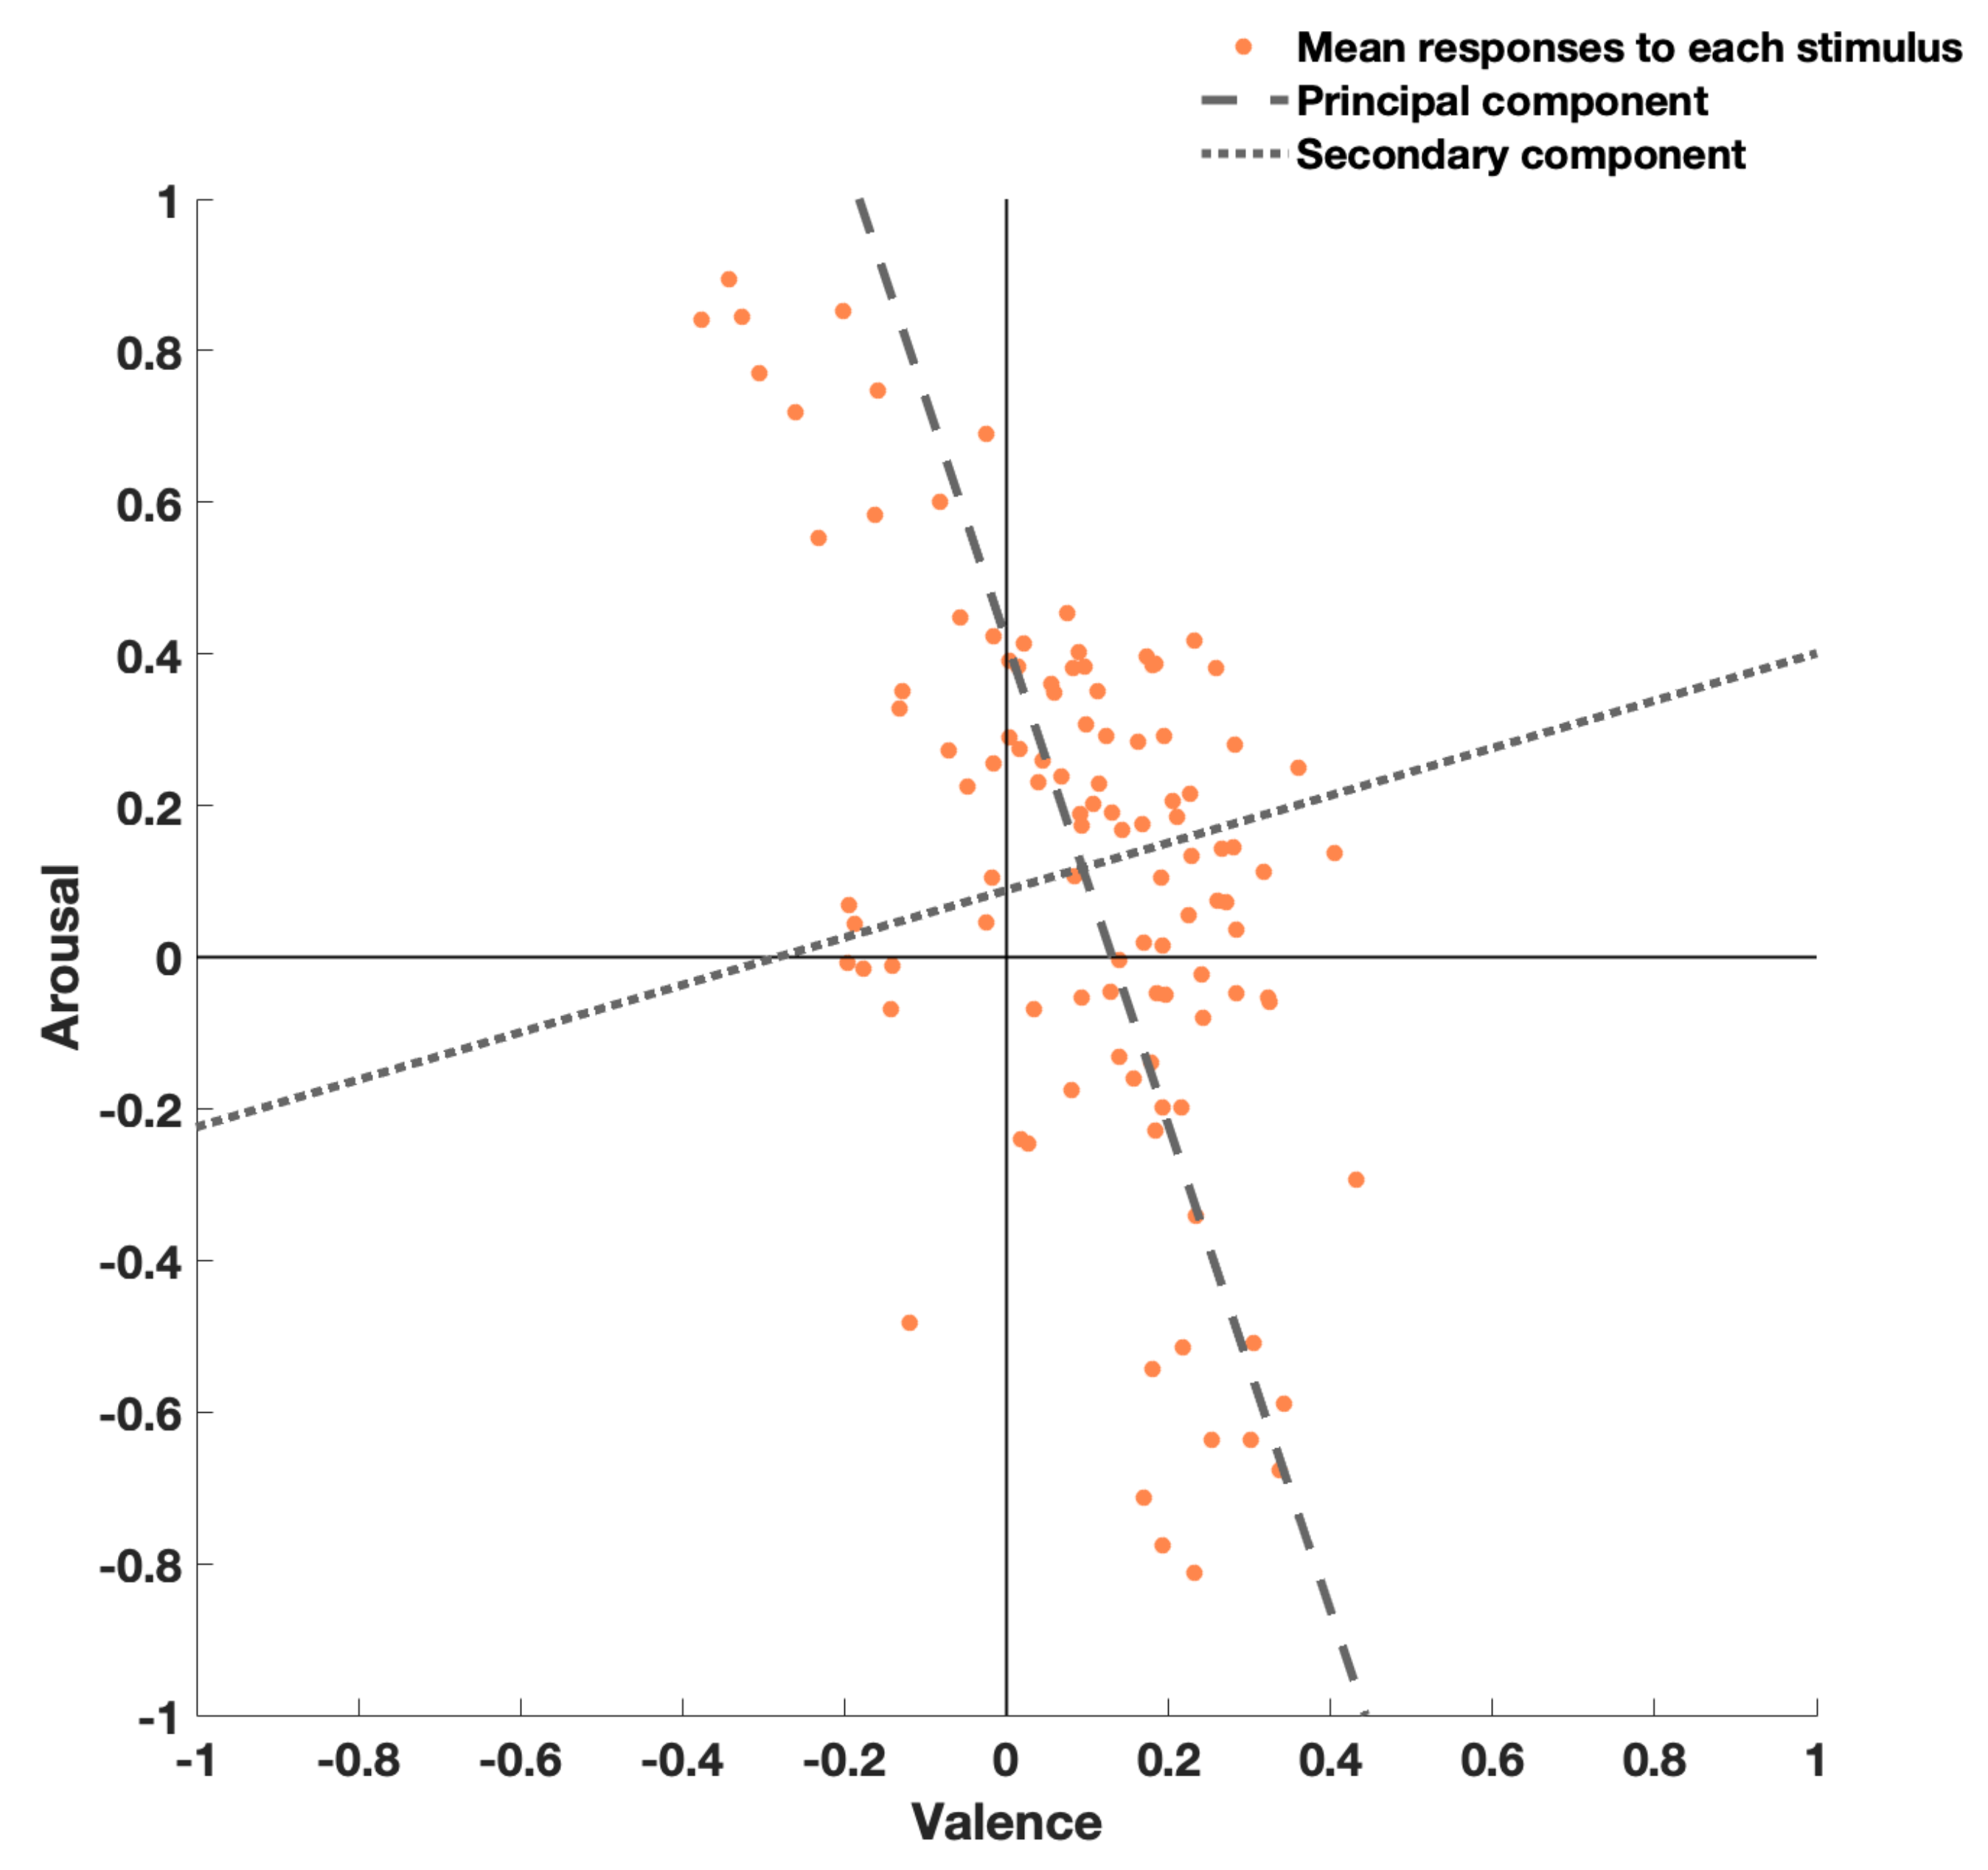
Although we consider this study to be exploratory, we used inferential statistics to give an indication of where future confirmatory analysis might be useful. In all statistics we used a 0.05 alpha level with multiple comparison correction when multiple tests were conducted. The stimuli successfully generated responses across the whole circumplex plane of arousal (perceived intensity) and valence (perceived pleasantness). The principal component vector of the mean responses across participants to each stimulus has gradient for intensity and pleasantness, as shown in supplementary Figure A1 in Appendix A. This indicates that there is generally a negative correlation between the perceived intensity and perceived pleasantness of localised single-output vibrotactile stimuli, with greater variance in perceived intensity. The mean standard deviation (std) across all stimuli for pleasantness was 0.23, and for intensity it was 0.19. The mean 95% confidence interval was 0.92 in the pleasantness dimension and 0.76 in the intensity dimension, an area close to one quadrant of the circumplex space. While this is a high variance in responses, the variance was high across participants and not for individuals; the six repeated stimuli had a significantly reduced standard deviation per participant compared to their responses to all stimuli (mean reduction of 0.16 for std of pleasantness responses and 0.12 for std of intensity responses), which is evidence that participants were able to differentiate between stimuli and had consistent affective responses.
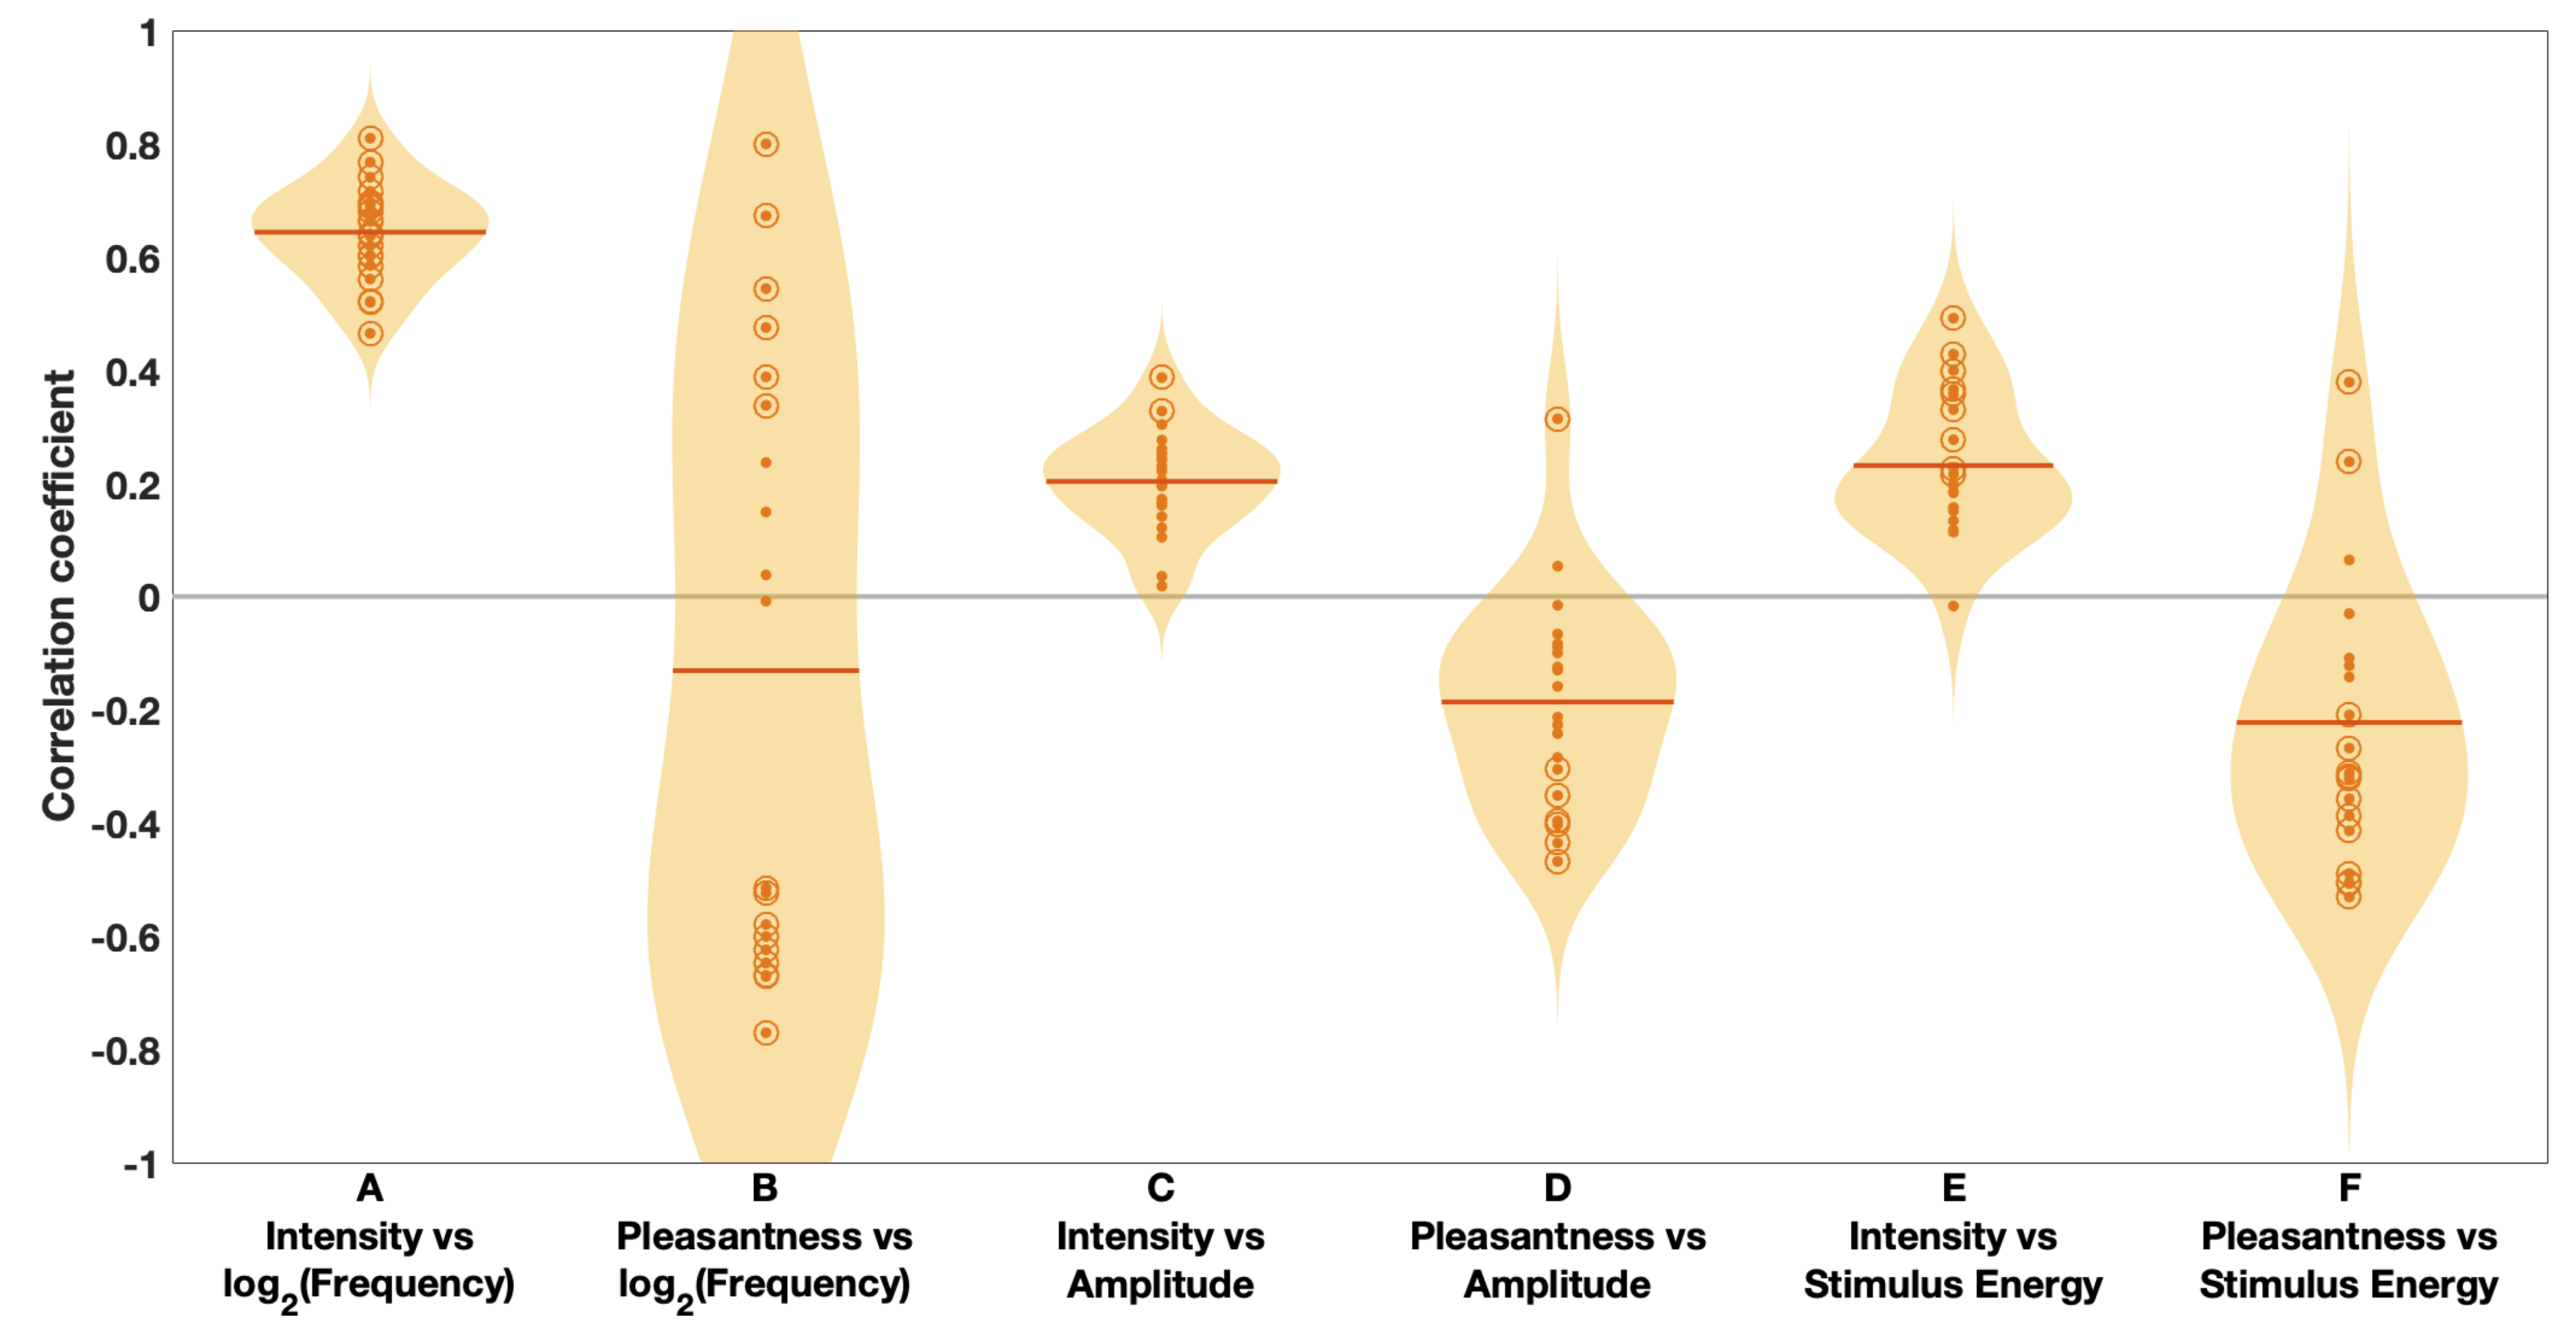
Correlation coefficients of perceived intensity and perceived pleasantness against across all square wave and sine wave stimuli for all participants are shown in Figure 6A,B respectively. There was a positive correlation between intensity and for all participants (mean 0.643, std 0.087). For pleasantness, 10 of the 20 participants had negative correlations between pleasantness and , and 6 had a positive correlation. As is clear in Figure 6, the participants are split into two groups, resulting in no overall correlation (mean −0.131, std 0.542). Since 16 of 20 participants had significant correlation scores, this could indicate that stimulus frequency influences pleasantness responses, but that this is subjective to the individual.
Correlation coefficients of perceived intensity and perceived pleasantness against wave amplitude for sine and square wave stimuli are shown in Figure 6C,D. All 20 participants had a positive correlation coefficient between intensity and stimulus amplitude (mean 0.203, std 0.092), but only two of these were significant. A similar result was found for the mean correlation between pleasantness and amplitude (mean −0.186, std 0.189), except the relation was negative and there is greater variance among participants’ results.
Correlation coefficients of intensity and pleasantness against stimulus energy for sine wave, square wave and envelope stimuli are shown in Figure 6E,F. Of the 20 participants, 19 had a positive correlation between intensity and stimulus energy (mean 0.206, std 0.137), of which 9 reached statistical significance. 17 of 20 participants had a negative correlation between pleasantness and stimulus energy (mean −0.209, std 0.247), of which 14 reached statistical significance.
Square wave stimuli elicited higher intensity responses than sine wave stimuli with a mean increase of 0.51 (std 0.24), whereas they elicited lower pleasantness responses with a mean decrease of 0.24 (std 0.13) compared to sine wave stimuli.
3.2. Experiment 2 Results
The experiment resulted in pleasantness responses to all stimuli for all 20 participants, feedback from all participants and adjective responses to all stimuli for 12 participants.
3.2.1. Pleasantness Responses to Pump-and-Vibe
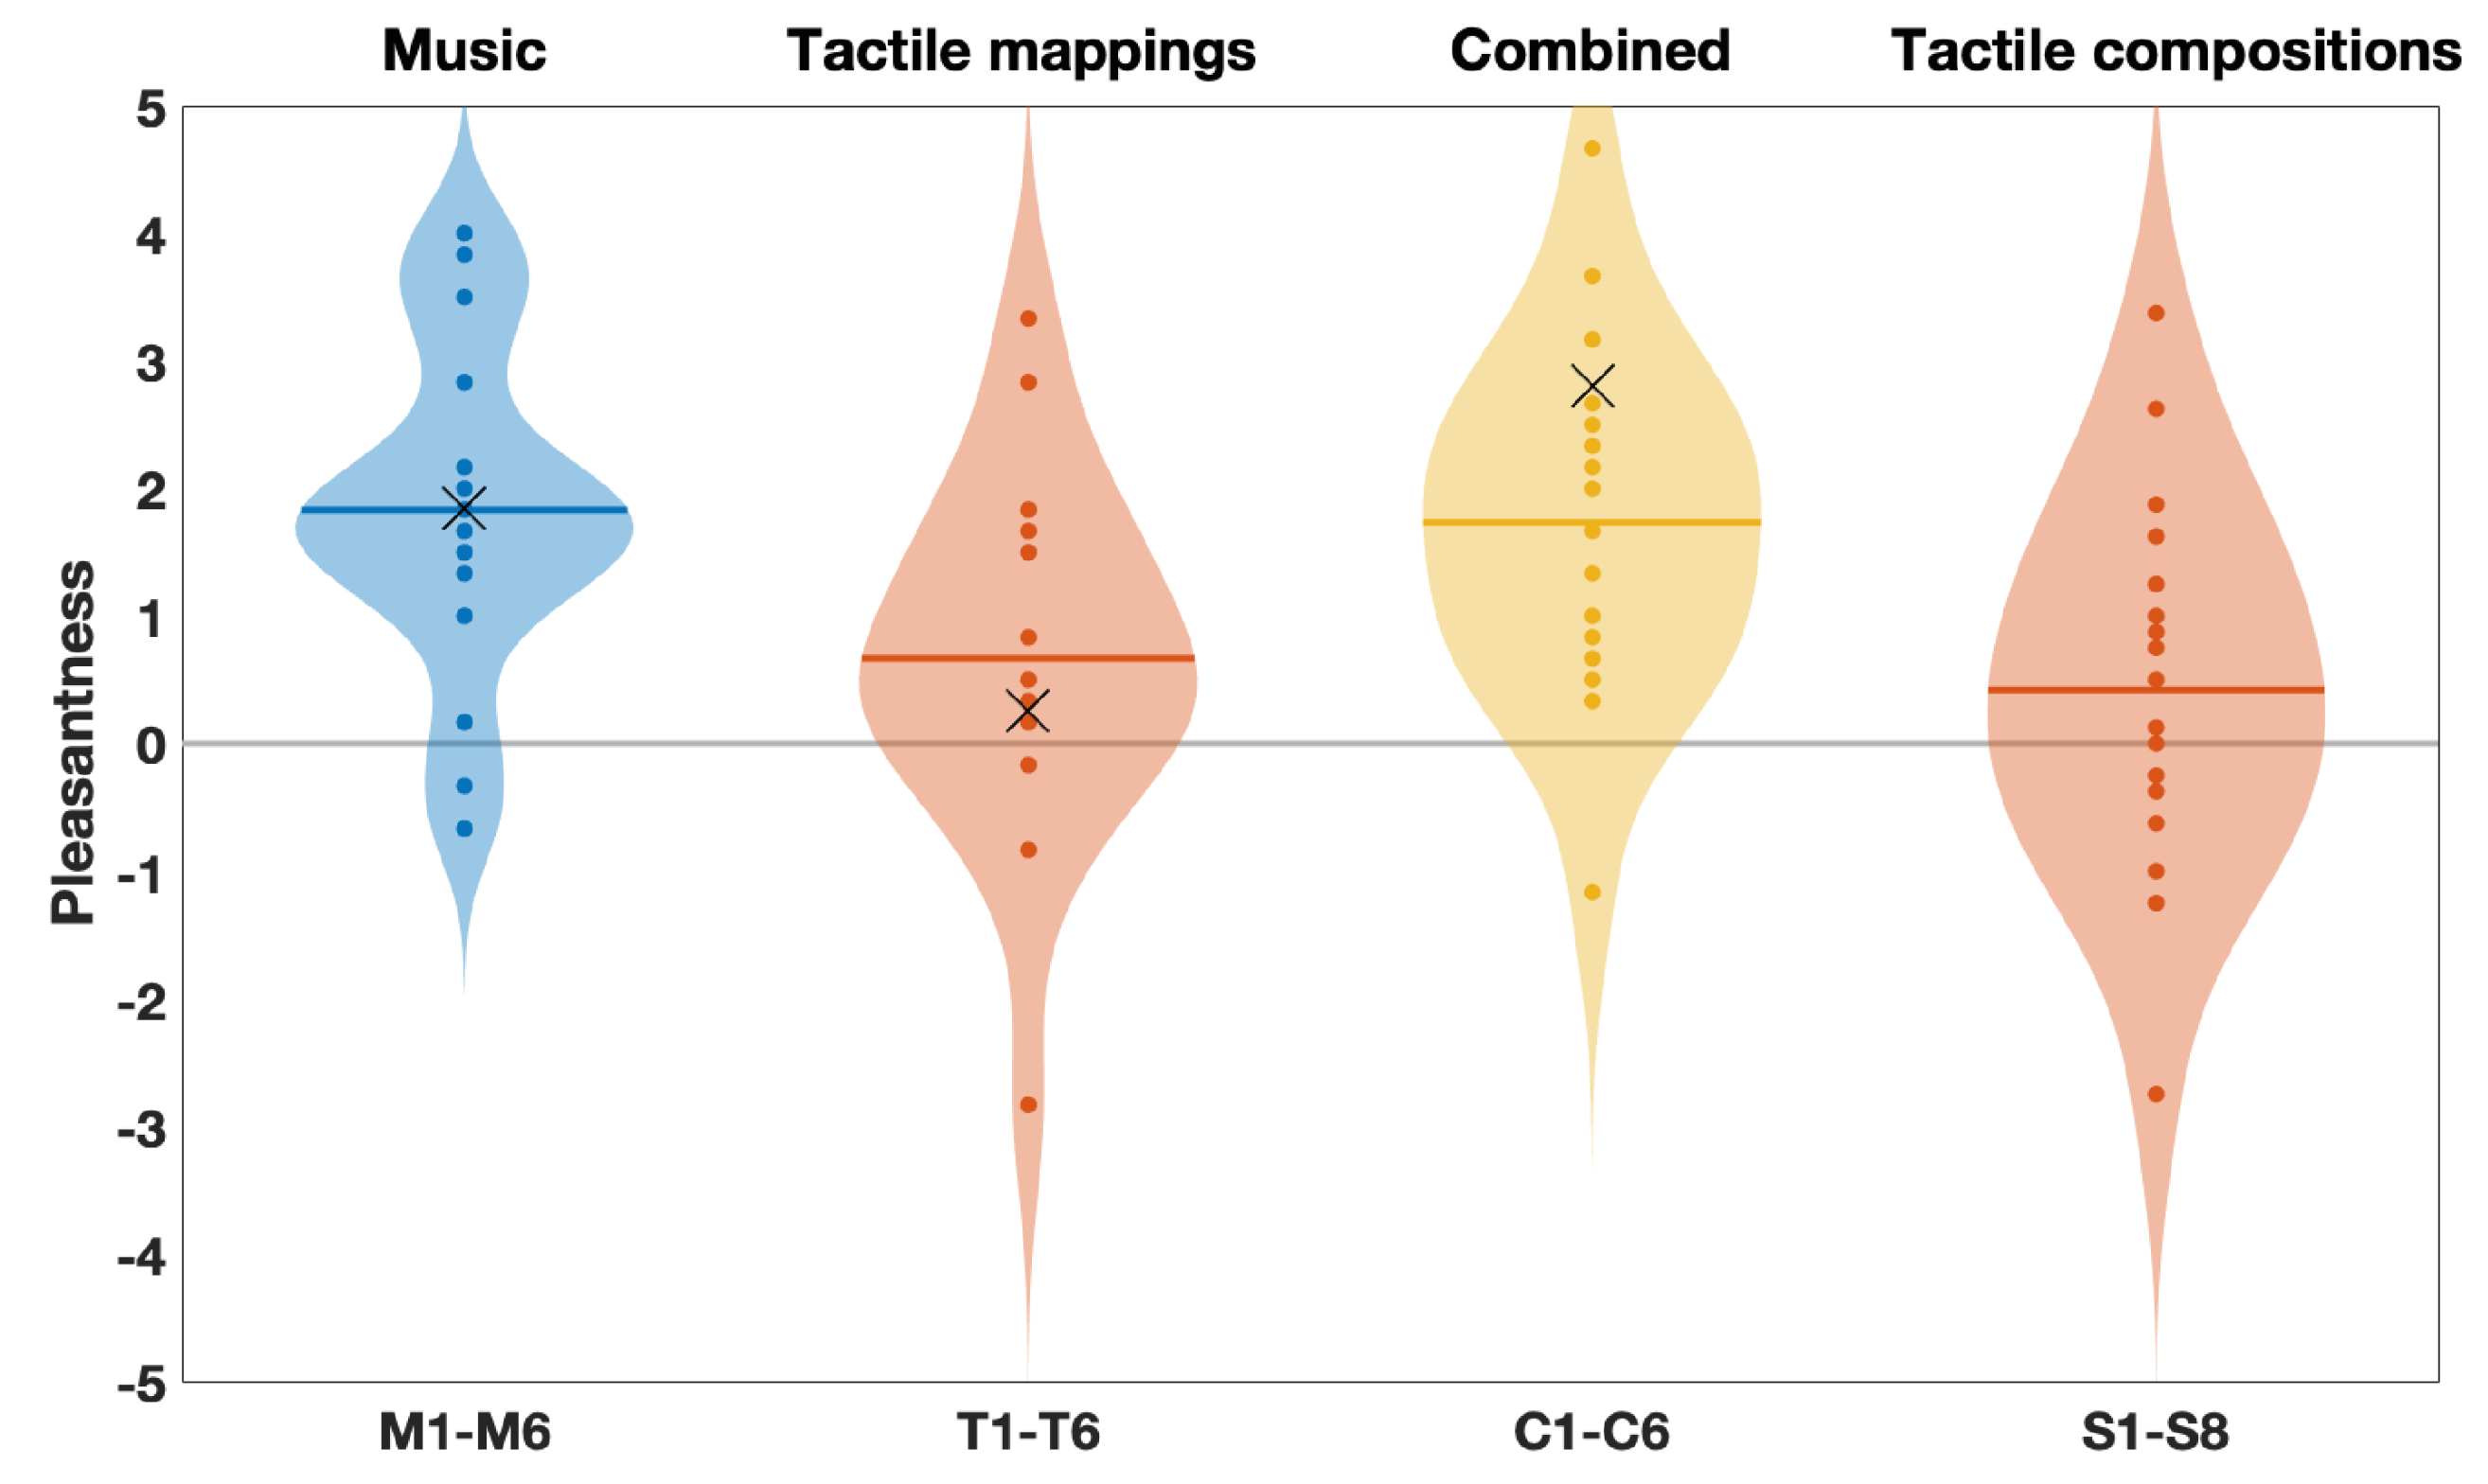
Mean pleasantness results per stimulus group are shown in Figure 7. Without arousal responses we cannot use the full circumplex model of affect, but pleasantness still provides useful qualitative data for comparing stimuli. Across all participants the mean pleasantness was 1.836 (std 1.095) for music stimuli (M1–M7), 0.607 (std 1.353) for tactile mappings (T1–T7), 0.419 (std 1.467) for tactile compositions (S1–S8) and 1.889 (std 1.294) for combined music and tactile stimuli (C1–C7). A t-test indicated that both groups of tactile stimuli (T and S) were statistically lower in pleasantness than the responses to music (M) and combination (C) stimuli, whereas these two (M and C) were not statistically different. Since the tactile mappings did not elicit the same pleasantness response in the users, the mappings may be limited. However, this difference could also be caused by a baseline difference between the modalities—music being familiar compared to the tactile device which is novel and unknown. When combined, the tactile sensations did not alter responses to music, indicating that the tactile mappings did not alter the perceptions of the music, although it is not possible to discern from this if they were actively coherent with the music or if uni-modal dominance was occurring.
It was found that the pleasantness responses to the tactile mappings (T1–T6) and tactile compositions (S1–S8) were statistically similar and both greater than 0. While these responses suggest that the tactile stimulations as such are pleasant, independent of musical pleasantness, Figure 7 suggests that the mappings are more complex, since the spread of the data has increased, with more negative (less pleasant) responses than the music.
3.2.2. Adjective Responses to Pump-and-Vibe
To get more detailed information than the pleasantness responses, 12 of the participants recorded three adjectives from the subsets of Hevner’s adjective circle in Table 2 to describe their emotive response to each stimulus. The data were in the form of three words per stimulus which were converted into numerical values according to which group, 1 to 8, of the adjective circle they were attributed to.
Participants chose the adjectives from a printed 3-column list that was randomised per participant. Each participant’s list was used for the duration of the experiment. They did not mark their responses on the list, but the listed order of the adjectives may have affected each participant’s responses. It was expected that they would choose words from the same or neighbouring groups in the Hevner circle. For example, if a participant found a stimulus “Happy” (group 6), it was expected that their other chosen adjectives would be similar (such as “Joyous” or “Playful”) and come from group 6 or neighbouring groups rather than adjectives from a qualitatively opposing group (such as “Sad” or “Tragic”). This was verified by calculating a weighted value for each response according to how similar the three chosen adjectives were according to the Hevner groupings. A weighted sum was calculated for each set of three adjectives with a value of 4 for every pair of words in the same group, 2 for a pair in neighbouring groups and 1 for a pair of words two groups apart. By this method, three words in the same group results in the highest outcome of 12; two words in the same group and the third in the neighbouring group results in 8; and so on. These values were calculated for all stimuli and all participants. The mean value for participant results was 5.94 (5.82 for music M1–M7, 5.83 for tactile mappings T1–T7, 5.95 for combined C1–C8 and 6.05 for the composed tactile stimuli S1–S8), higher than the expected mean if these adjectives were chosen randomly (mean 3.65 across ten repetitions). This demonstrates that participants were not randomly selecting adjectives but had emotive responses to individual musical and tactile stimuli that they were able to recognise and associate with the adjectives from Hevner’s circle. However, as previously discussed, we cannot be certain that these responses to the tactile-only stimuli were direct emotional interpretations of the sensations or whether they were influenced by associations with the preceding music stimuli. Further experimentation is needed to clarify this. In either case, we suggest that this is a promising outcome; in the former case this demonstrates that the tactile presentations are capable of conveying emotional information in their own right, and in the latter case this demonstrates that the musical mappings were recognisable in the tactile-only stimuli and associated with the respective music stimuli.
4. Discussion
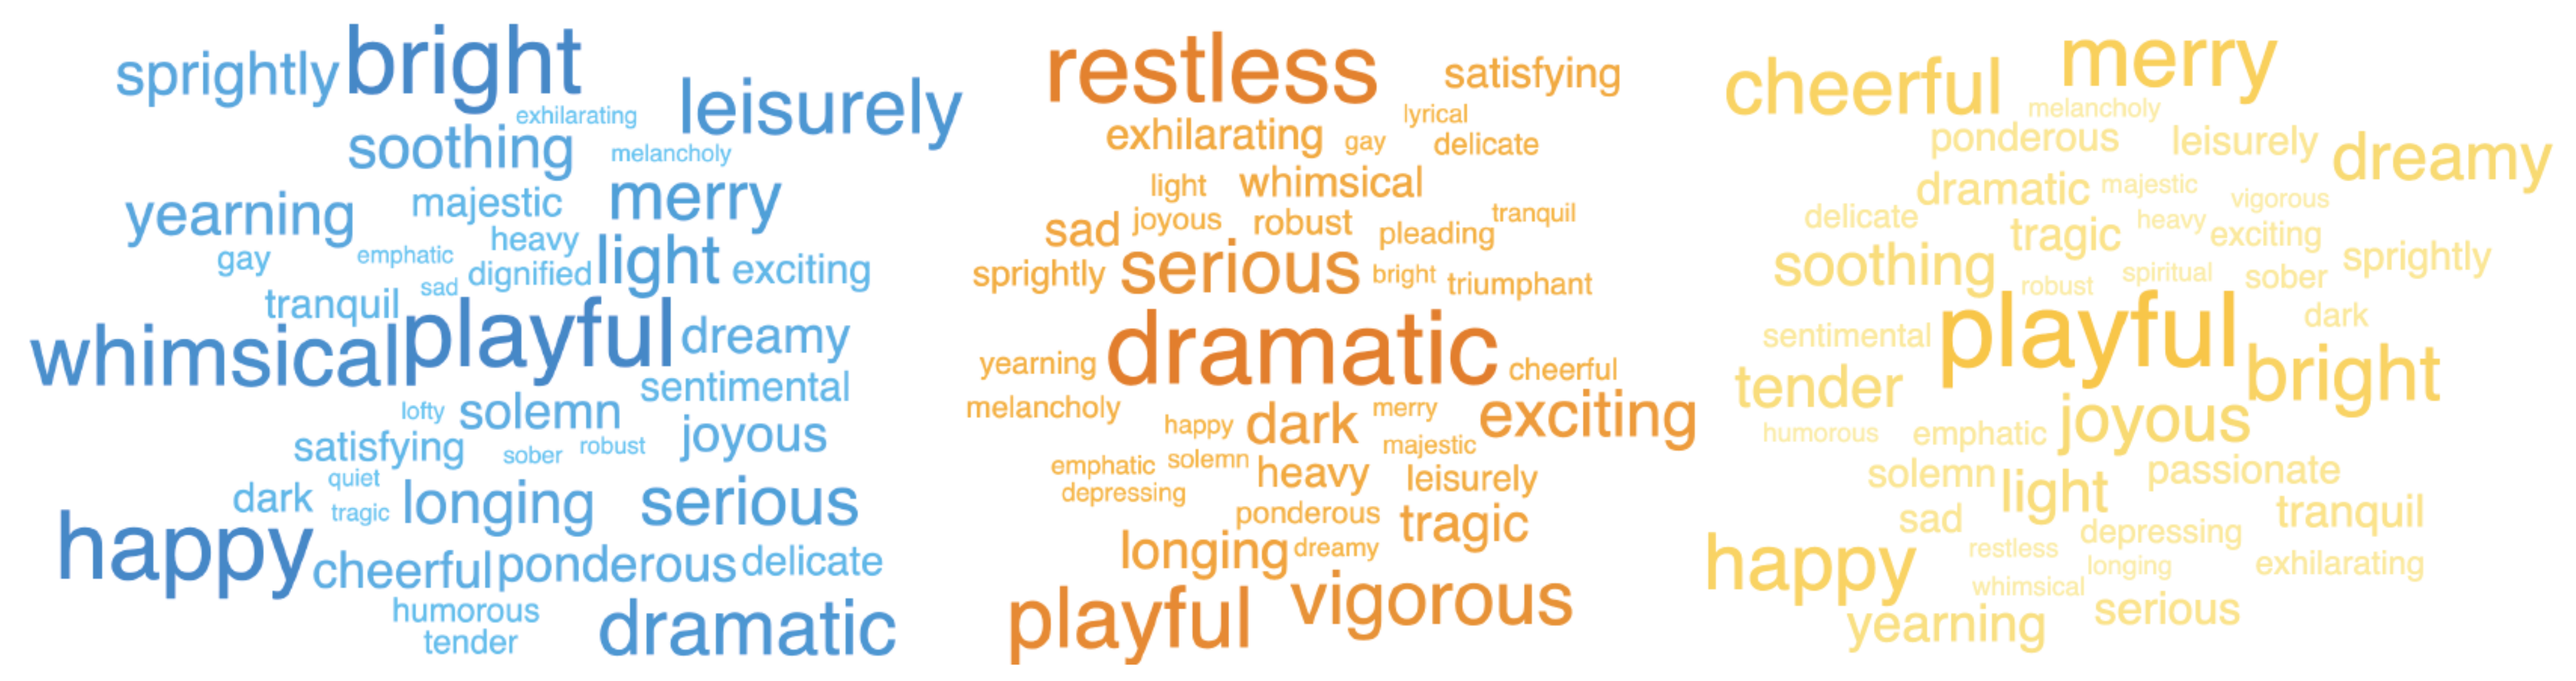
As an initial analysis of results, the adjectives chosen by participants for each group of stimuli are listed and their frequencies of occurrence were recorded. Figure 8 illustrates the adjectives chosen by participants to describe the different types of stimuli with frequency indicated by size. “Playful” was consistently frequently chosen across groups. For the music and combined stimuli, the majority of adjectives were positive, including “Happy”, “Playful” and “Bright”; and they both shared “Yearning”, “Soothing” and “Light”. The combined stimuli seemed to be less ”whimsical", ”Leisurely”, “Sprightly”, “Serious” and “Dramatic”, but more “Cheerful”, “Tender”, “Dreamy” and “Joyous”. The tactile stimuli seemed to evoke higher intensity adjectives, with an active or physical aspect to them, such as “Restless”, “Vigorous”, “Dramatic” and “Exciting”. The tactile stimuli also had increased occurrences of “Serious”, “Dark”, “Tragic”, “Exhilarating” and “Satisfying”.
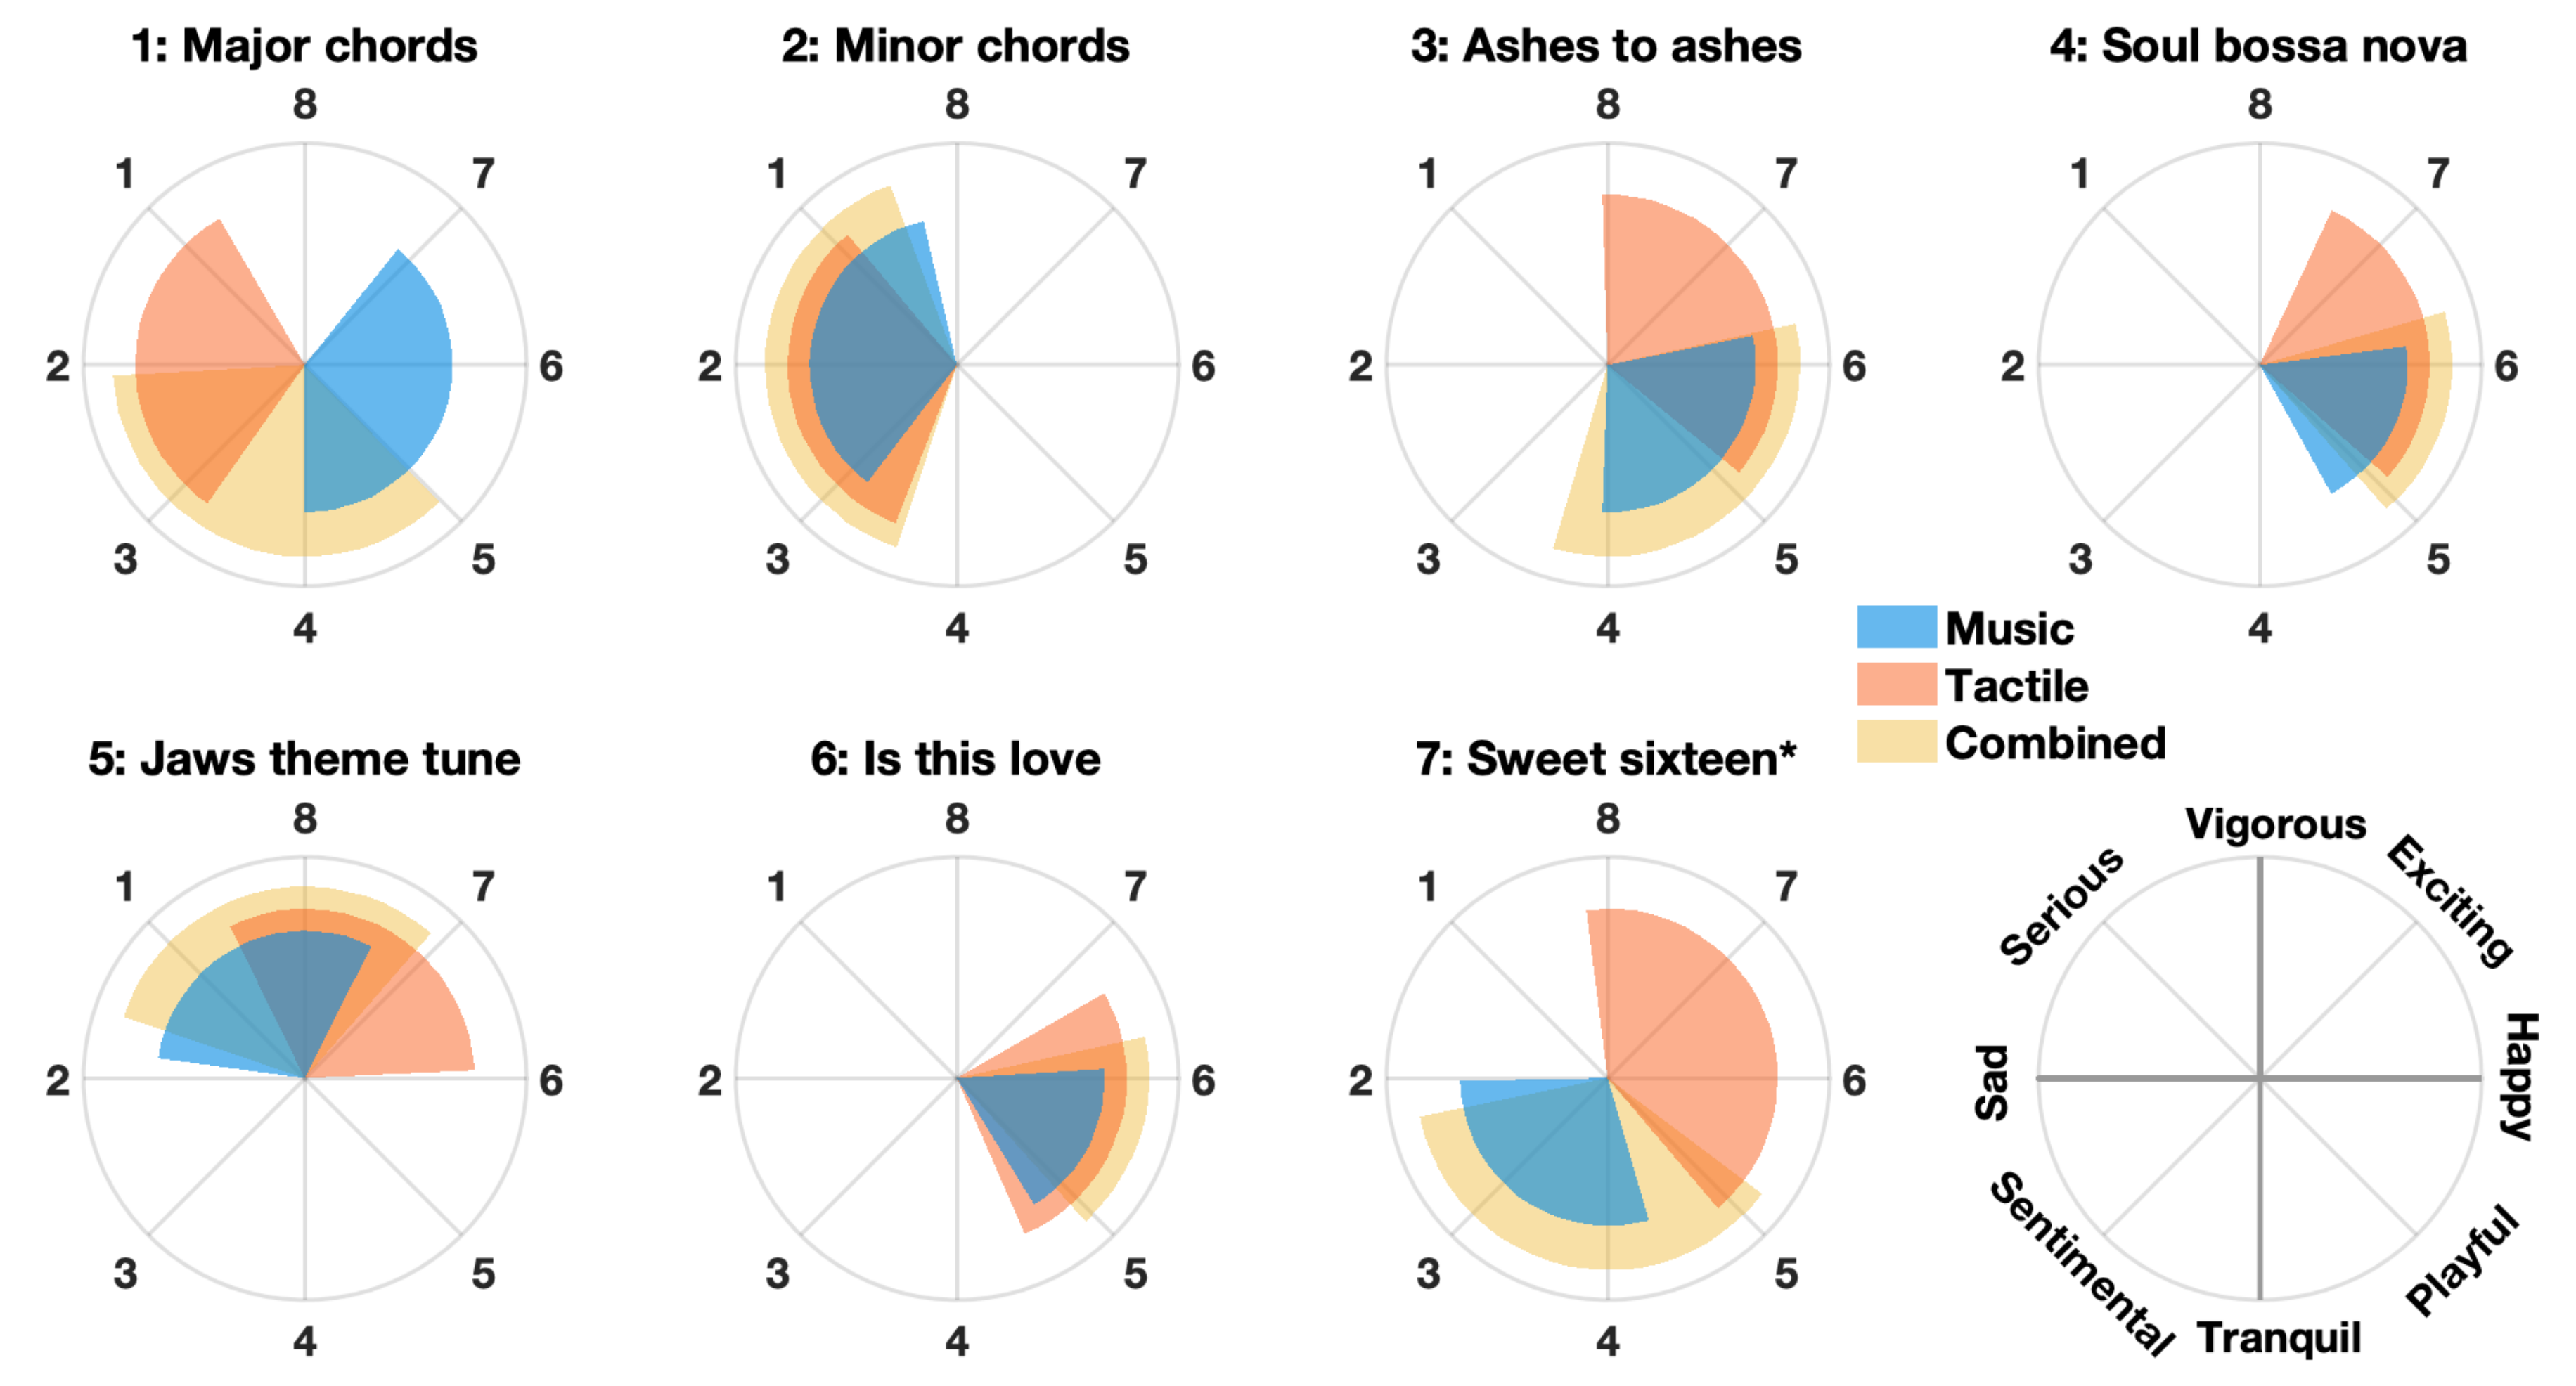
While this illustration indicates differences in the emotive responses of participants to the musical (M1–M6), tactile (T1–T6) and combined stimuli (C1–C6), the adjectives chosen for musical stimuli were found to be statistically similar to the corresponding tactile or combined stimuli on average (excluding M7, T7 and C7, since these did not use a mapping). This was calculated by finding the circular mean of the three adjectives selected by participants for each stimulus and then calculating the differences between this for the three types of stimulus: music, tactile and combined. To illustrate this, Figure 9 shows the distribution—one standard deviation either side of the mean—of participant responses for each song and each stimulus type. The similarities between stimulus type were verified by the Watson–Williams test for equal circular means shown in Table 3.
Looking at the responses to music in Figure 9, the adjective responses of participants are spread across the circumplex space. For songs M2 (minor chords) and M6 (Is this Love), the music samples; tactile mappings T2 and T6; and combined presentations C2 and C6 all had equal responses, as verified in Table 3 by a Watson–Williams test for circular data. This indicates a successful mapping of these songs. For M3 (Ashes to Ashes), M4 (Soul Bossa Nova) and M5 (Jaws theme), the combined presentations C3, C4 and C5 had equal responses, suggesting that the tactile mappings were coherent with the music, or at least not altering the perceptions of the music. The tactile mappings T3, T4 and T5 are less than a quarter rotation out of coherence with M3, M4 and M5, a difference of one or two positions in the Hevner circle. For songs 3 and 4 this difference is an increase in intensity for the tactile mappings. For song 5 (Jaws theme), this difference is an increase in pleasantness for the tactile mapping. This could be due to the existing unpleasant connotations of the music from the film Jaws that are not present for the tactile mapping.
For M1 (major chords) and M7 (Sweet Sixteen) there is a clear mismatch between responses to these music samples and the tactile mappings T1 and T7. For M7 this is a positive result, since T7 was a randomly generated pattern of haptic sensations and not mapped from the music. The clear difference between M7 and T7 and the increased standard deviation of T7 responses lend validation to T2–T6 being successful mappings. For M1, the difference in responses flags an important aspect of the tactile mappings that needs to be taken into account. This aspect is the key or tone of a piece of music. The major chord progression (M1) and minor chord progression (M2) have very similar rhythmic and melodic aspects when projected into the tactile domain, as this is verified by the similarity of T1 and T2 responses. However, the change of key from major to minor completely changes the emotive response of the listener from positive to negative as demonstrated by M1 and M2 responses. This difference in affective response to key change is likely to be influenced by learned experience [55] and culture [56], effects that are not present for the new medium of tactile sensation generated by Pump-and-Vibe.
The tactile compositions (S1–S8) produced a similar range of adjective responses from participants as for the tactile mappings (T1–T7). The distributions of adjective responses within the Hevner groupings were very similar for the two types of stimuli, except that group 7 (“Exciting”, “Dramatic”, etc.) was the modal adjective group for tactile compositions while groups 5 (“Playful”, “Sprightly”, etc.) and 6 (“Happy”, “Joyous”, etc.) were modal for the tactile mappings. Adjectives such as “Vigorous”, “Dramatic”, “Restless” and “Exciting” frequently occurred. Table 4 shows popular responses to the tactile compositions, which demonstrates a similarity between S1, S2, S3 and S7, the variations of a sawtooth waveform up and down the forearm. These compositions were perceived as “Dramatic”, “Vigorous”, “Restless” sensations. The slower stroking stimuli S4 and S6 were perceived as “Sad”, “Yearning” and “Tragic”. The pulsing of all motors in unison for S8 generated “Vigorous” and “Dramatic” sensations that were perceived as “Serious”, “Robust” and “Heavy”.
4.1. Participant Comments and Experiment Limitations
It was common feedback from participants that the adjectives provided—taken from the Hevner adjective circle of emotions evoked by music—were not easily applicable to the tactile sensations. Additional words supplied by participants included “insistent”, “rhythmic”, “interesting” and “active” relating to motion and physical presence. This could suggest that a new list of adjectives needs to be created for tactile sensations, because we perceive them differently, or that more exposure to FeelMusic haptic sensations as an affective medium is needed prior to being able to relate them to these adjectives. Alternatively, it could be due to the reduction in complexity of the musical samples when mapped onto Pump-and-Vibe.
Informal comments on the Pump-and-Vibe offered by participants included “picks up the drama of the music”, “interesting”, “better with the music”, “faster rhythms are more interesting”, “clever”, “ticklish”, “a greater variety of tactile sensations would be nice”, “unusual”, “difficult to judge without comparison”. It seemed that there was a general enthusiasm for the device, but the lack of previous exposure to this new type of medium made it challenging for participants to quantify their responses.
A frequent comment was that the “Jaws” theme-tune was enhanced by the tactile sensations which added intensity and tension to the music. This gives rise to the possibility of using tactile sensations to enrich cinematic experiences, particularly in genres such as thriller, horror and action. A number of participants also actively commented that they recognised a few of the music samples from the tactile sensations alone, suggesting that the mappings were able to convey accurate representations of the music to the wearers.
The participants that enjoyed the sensations, particularly when combined with music, indicated that a more sophisticated device using the same principles could be very effective to enhance or add interest to music. Several commented that the experience could enrich listening to music at home by adding an element of physical interaction similar to the feeling of being at a live music performance, particularly for genres such as heavy metal where the physical sensation is powerful during live performances.
4.2. Future Work
In this exploratory study we have discussed a preliminary investigation into mapping music onto the haptic domain using features such as rhythm, melody and volume. Our findings suggest that this method and medium have potential. Our future work will focus on conducting confirmatory experiments with a larger population and wider range of stimuli to formally evaluate FeelMusic mappings, informed by the findings of this study. This larger experiment will include a wider range of music stimuli that are produced, selected and evaluated for affect through prior testing. Therefore, the tactile stimuli can be presented to participants without potential prior knowledge of the associated music.
We will develop a more sophisticated Pump-and-Vibe interface that incorporates vibrotactile stimulation with variable amplitudes and frequencies, like the tactor used in Experiment 1, and explore different spatial arrangements of these. This will allow for more nuanced sensations to be generated informed by the affective results of Experiment 1. By developing and evaluating the music samples first, we can compare different types of mappings. For example, the frequency of vibration sensations could correspond to the volume of the music or to the perceived intensity of the music (given the positive correlation found between frequency and intensity in Experiment 1). We will also compare these feature-based mappings to a signal-based mapping to verify whether the FeelMusic mappings are more effective at conveying affect.
Beyond this experiment, we aim to further develop the concept of FeelMusic. Music is a rich medium, influenced by our learned experience and culture, and by aspects such as genre, lyrics and instruments used. FeelMusic lacks this existing framework and therefore presents an exciting opportunity to consciously develop this new medium as a sensory experience in its own right. We will explore tactile compositions further as a medium separate to music. This could include enabling people to compose, share and evaluate their own tactile pieces.
5. Conclusions
Two exploratory experiments were carried out to investigate affective responses to tactile sensations and validate the potential of FeelMusic as an emotive medium.
Experiment 1 extended our understanding of the emotive aspects of localised vibrotactile stimuli, demonstrating that they can elicit affective responses across the whole circumplex space. Our results show that emotive responses are highly varied across individuals, but there are correlations between features such as frequency, amplitude and energy of stimuli and affective response that are universal. Perceived intensity was generally consistent across participants, whereas pleasantness was far more subjective. Since vibrotactile sensations are frequently used in haptic interfaces, this study demonstrates that the affective aspects of such interfaces should be an important design consideration.
Experiment 2 demonstrated that FeelMusic tactile mappings of rhythmic and melodic features were capable of evoking emotive responses that correlated with their musical counterparts. For two of six music mappings, the participants’ responses (valence responses and adjective responses) were equal across the music, tactile mappings and combined presentations of these. For a further three of the six music mappings, the combined stimuli elicited equal responses to the music, whereas the tactile-only stimuli elicited different responses; a difference of only one or two positions in the Hevner circle was present for the adjective responses. The remaining music mapping (of the six) elicited different responses from each of the music, tactile and combined presentations. This music sample was only differentiated from another sample by being major in key, rather than minor, which seemed to alter the affective response to the music but not to the tactile sensation. This demonstrates that representing key as well as rhythm and melody should be an important consideration in future FeelMusic mappings.
Experiment 2 found that the tactile sensations, both mapped and composed, were generally considered to be equally pleasant. However, there was a difference in how participants responded to the two types of stimuli using the adjectives from Hevner’s circle. The composed stimuli were most often described by adjectives from group 7 (“Exciting”, “Dramatic”, etc.), whereas the stimuli mapped from music were most often described by adjectives from groups 5 (“Playful”, “Sprightly”, etc.) and 6 (“Happy”, “Joyous”, etc.).
The results, especially comments from participants, indicate that FeelMusic interfaces such as Pump-and-Vibe have the potential to enrich music, enhance cinematic experiences and act as means of emotive communication, but this needs further investigation. The coherence found between respective musical and tactile stimuli in this experiment may have been influenced by cognitive associations with the music. In addition, the combined auditory and tactile presentation of stimuli may have elicited equal responses to the music due to associative dominance. Future work will formally investigate a wider range of FeelMusic mappings using novel music samples that have been characterised for affect in a preliminary control test. Formal tests using these mappings will investigate different feature-based mappings and compare these to signal-based mappings.
Author Contributions
Conceptualisation, A.H., J.L. and J.R.; methodology, A.H., J.R. and C.K.; software, A.H.; validation, A.H., J.R. and C.K.; formal analysis, A.H.; investigation, A.H.; resources, A.H., J.R. and C.K.; data curation, A.H.; writing—original draft preparation, A.H.; writing—review and editing, J.R. and C.K.; visualization, A.H.; supervision, J.L., J.R. and C.K.; project administration, A.H.; funding acquisition, J.R. All authors have read and agreed to the published version of the manuscript.
Funding
A.H. is supported through the EPSRC Doctoral Training Partnership, grant EP/N509619/1. J.R. is supported by the Royal Academy of Engineering as a Chair in Emerging Technologies and by the EPSRC through grants EP/M020460/1, EP/R02961X/1, EP/S026096/1 and EP/T020792/1.
Institutional Review Board Statement
The study was conducted according to the guidelines of the Declaration of Helsinki, and approved by the Faculty of Science Ethics Committee of University of Bristol in 2016.
Informed Consent Statement
Informed written consent was obtained from all subjects involved in the study.
Data Availability Statement
Data are available at the University of Bristol data repository, data.bris, at https://0-doi-org.brum.beds.ac.uk/10.5523/bris.1vj7fcw8m7gzl2uo35fsb3l4zn (accessed on 20 May 2021).
Conflicts of Interest
The authors declare no conflict of interest. The funders had no role in the design of the study; in the collection, analyses, or interpretation of data; in the writing of the manuscript, or in the decision to publish the results.
Abbreviations
The following abbreviations are used in this manuscript:
| MDPI | Multidisciplinary Digital Publishing Institute |
| DOAJ | Directory of open access journals |
Appendix A
Figure A1.
Mean responses of participants to each stimulus in Experiment 1, including principal and secondary components of principal component analysis.
Figure A1.
Mean responses of participants to each stimulus in Experiment 1, including principal and secondary components of principal component analysis.

Figure A2.
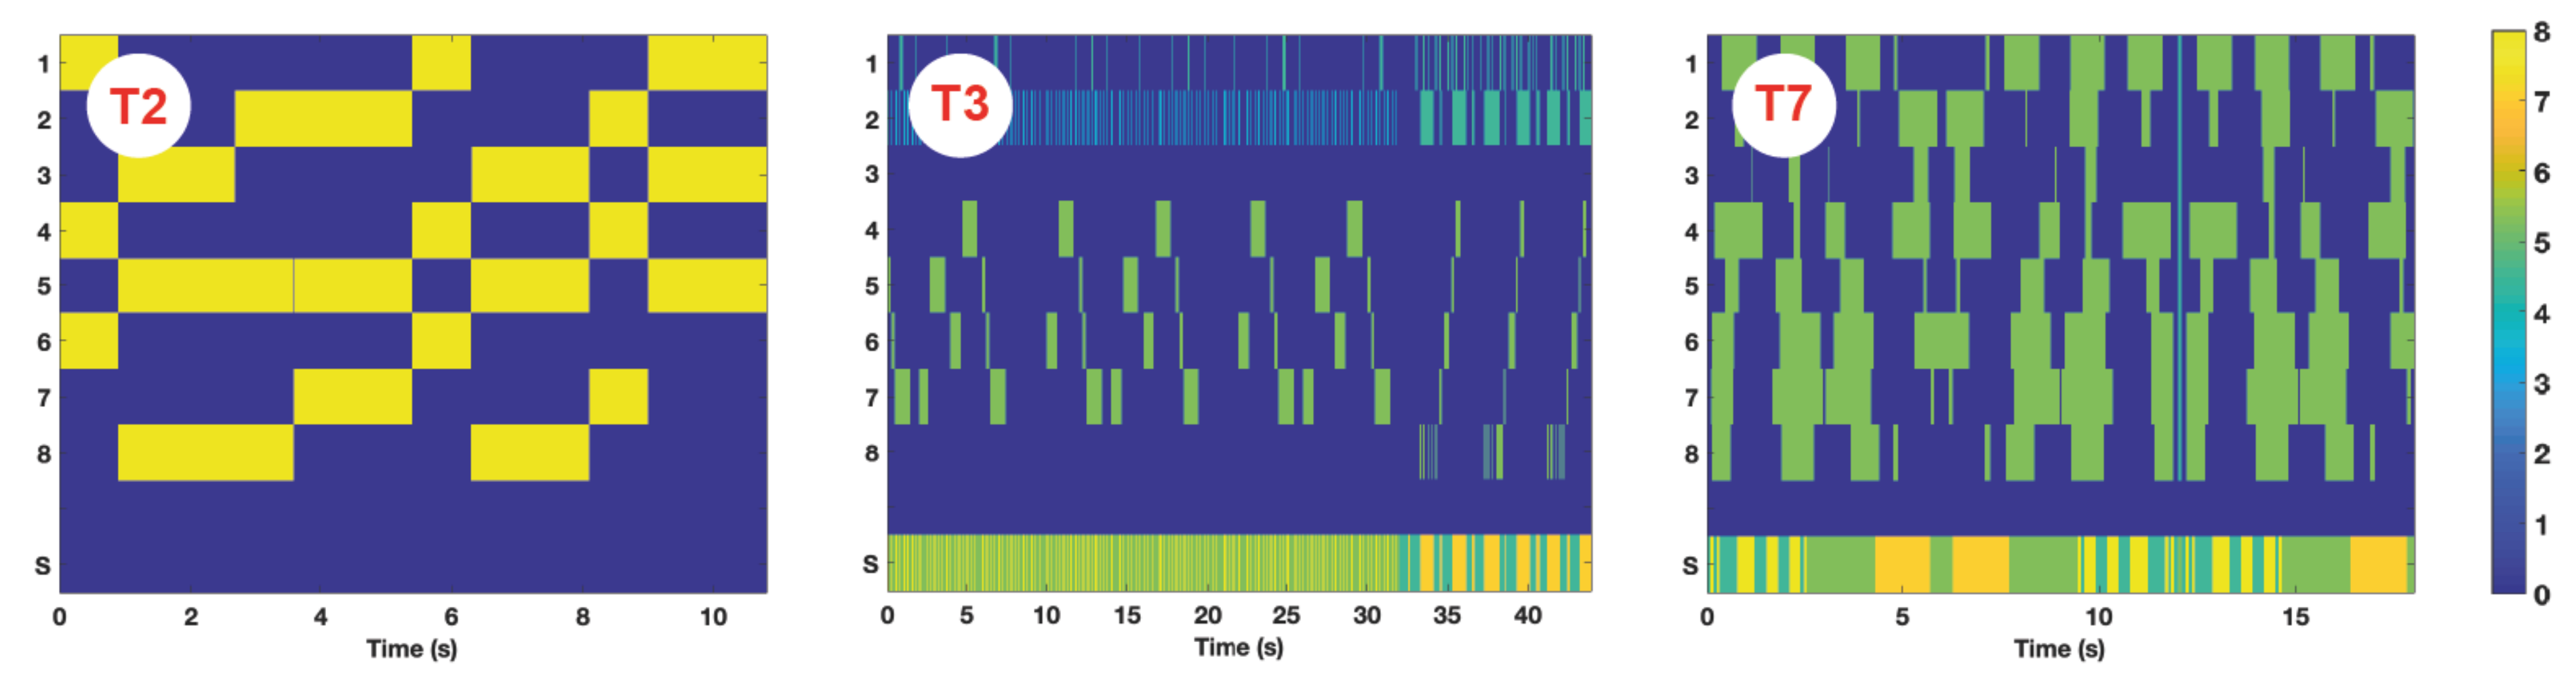
The tactile mappings T2 (Minor chord progression), T3 (Ashes to Ashes) and T7 (randomised pattern). Intensity is shown by hue, motors 1–8 are the vibration motors along the forearm, S is the squeezer on the upper arm.
Figure A2.
The tactile mappings T2 (Minor chord progression), T3 (Ashes to Ashes) and T7 (randomised pattern). Intensity is shown by hue, motors 1–8 are the vibration motors along the forearm, S is the squeezer on the upper arm.

References
- Fritz, T.; Jentschke, S.; Gosselin, N.; Sammler, D.; Peretz, I.; Turner, R.; Friederici, A.D.; Koelsch, S. Universal recognition of three basic emotions in music. Curr. Biol. 2009, 19, 573–576. [Google Scholar] [CrossRef] [PubMed] [Green Version]
- Clayton, M. The Cultural Study of Music: A Critical Introduction; Routledge: London, UK, 2013. [Google Scholar]
- Field, T. Touch for socioemotional and physical well-being: A review. Dev. Rev. 2010, 30, 367–383. [Google Scholar] [CrossRef]
- MacDonald, R.; Kreutz, G.; Mitchell, L. Music, Health, and Wellbeing; Oxford University Press: Oxford, UK, 2013. [Google Scholar]
- Gomez, P.; Danuser, B. Affective and physiological responses to environmental noises and music. Int. J. Psychophysiol. 2004, 53, 91–103. [Google Scholar] [CrossRef] [PubMed]
- Hoffman, H.G. Physically touching virtual objects using tactile augmentation enhances the realism of virtual environments. In Proceedings of the IEEE 1998 Virtual Reality Annual International Symposium (Cat. No. 98CB36180), Atlanta, GA, USA, 14–18 March 1998; pp. 59–63. [Google Scholar]
- Eid, M.A.; Al Osman, H. Affective haptics: Current research and future directions. IEEE Access 2015, 4, 26–40. [Google Scholar] [CrossRef]
- Bach-Y-Rita, P. Tactile sensory substitution studies. Ann. N. Y. Acad. Sci. 2004, 1013, 83–91. [Google Scholar] [CrossRef] [Green Version]
- Merchel, S.; Leppin, A.; Altinsoy, E. Hearing with your body: The influence of whole-body vibrations on loudness perception. In Proceedings of the 16th International Congress on Sound and Vibration (ICSV), Kraków, Poland, 5–9 July 2009; Volume 4. [Google Scholar]
- Merchel, S.; Altinsoy, M.E. The influence of vibrations on musical experience. J. Audio Eng. Soc. 2014, 62, 220–234. [Google Scholar] [CrossRef]
- Altinsoy, M.E.; Merchel, S. Cross-modal frequency matching: Sound and whole-body vibration. In Proceedings of the International Workshop on Haptic and Audio Interaction Design; Springer: Berlin, Germany, 2010; pp. 37–45. [Google Scholar]
- Pérez-Bellido, A.; Barnes, K.A.; Yau, J.M. Auditory and tactile frequency representations overlap in parietal operculum. Perception 2016, 45, 333. [Google Scholar]
- CuteCircuit. Sound Shirt. 2016. Available online: http://cutecircuit.com/soundshirt/ (accessed on 19 September 2019).
- Yao, L.; Shi, Y.; Chi, H.; Ji, X.; Ying, F. Music-touch shoes: Vibrotactile interface for hearing impaired dancers. In Proceedings of the ACM Fourth International Conference on Tangible, Embedded, and Embodied Interaction; Association for Computing Machinery: New York, NY, USA, 2010; pp. 275–276. [Google Scholar]
- Allwood, J. Real-Tme Sound to Tactile Mapping. 2010. Available online: http://www.coroflot.com/jackjallwood/outer-ear (accessed on 19 September 2019).
- Podzuweit, F. Music for Deaf People. 2010. Available online: http://www.coroflot.com/frederik/Music-for-deaf-people (accessed on 19 September 2019).
- Novich, S.D.; Eagleman, D.M. A vibrotactile sensory substitution device for the deaf and profoundly hearing impaired. In Proceedings of the IEEE Haptics Symposium (HAPTICS), Houston, TX, USA, 23–26 February 2014; p. 1. [Google Scholar]
- Eagleman, D. Sensory Substitution. 2015. Available online: https://www.eagleman.com/research/sensory-substitution (accessed on 19 September 2019).
- Gunther, E.; OModhrain, S. Cutaneous grooves: Composing for the sense of touch. J. New Music Res. 2003, 32, 369–381. [Google Scholar] [CrossRef] [Green Version]
- Karam, M.; Branje, C.; Nespoli, G.; Thompson, N.; Russo, F.A.; Fels, D.I. The emoti-chair: An interactive tactile music exhibit. In Proceedings of the ACM CHI’10 Extended Abstracts on Human Factors in Computing Systems, Atlanta, GA, USA, 10–15 April 2010; pp. 3069–3074. [Google Scholar]
- Karam, M.; Russo, F.A.; Fels, D.I. Designing the model human cochlea: An ambient crossmodal audio-tactile display. IEEE Trans. Haptics 2009, 2, 160–169. [Google Scholar] [CrossRef]
- Jack, R.; McPherson, A.; Stockman, T. Designing tactile musical devices with and for deaf users: A case study. In Proceedings of the International Conference on the Multimodal Experience of Music, Sheffield, UK, 23–25 March 2015. [Google Scholar]
- Gomez, P.; Danuser, B. Relationships between musical structure and psychophysiological measures of emotion. Emotion 2007, 7, 377. [Google Scholar] [CrossRef] [Green Version]
- Peretz, I.; Gagnon, L.; Bouchard, B. Music and emotion: Perceptual determinants, immediacy, and isolation after brain damage. Cognition 1998, 68, 111–141. [Google Scholar] [CrossRef]
- Eitan, Z.; Rothschild, I. How music touches: Musical parameters and listeners audio-tactile metaphorical mappings. Psychol. Music 2011, 39, 449–467. [Google Scholar] [CrossRef]
- Peeva, D.; Baird, B.; Izmirli, O.; Blevins, D. Haptic and sound correlations: Pitch, Loudness and Texture. In Proceedings of the IEEE Eighth International Conference on Information Visualisation, London, UK, 16 July 2004; pp. 659–664. [Google Scholar]
- Vant Klooster, A.R.; Collins, N. In A State: Live Emotion Detection and Visualisation for Music Performance. In Proceedings of the NIME, London, UK, 30 June–3 July 2014; pp. 545–548. [Google Scholar]
- Ekman, P. An argument for basic emotions. Cognit. Emot. 1992, 6, 169–200. [Google Scholar] [CrossRef]
- Russell, J.A. A circumplex model of affect. J. Pers. Soc. Psychol. 1980, 39, 1161. [Google Scholar] [CrossRef]
- Watson, D.; Wiese, D.; Vaidya, J.; Tellegen, A. The two general activation systems of affect: Structural findings, evolutionary considerations, and psychobiological evidence. J. Pers. Soc. Psychol. 1999, 76, 820. [Google Scholar] [CrossRef]
- Thayer, R.E. The Origin of Everyday Moods: Managing Energy, Tension, and Stress; Oxford University Press: Oxford, UK, 1997. [Google Scholar]
- Ritossa, D.A.; Rickard, N.S. The relative utility of pleasantness and liking dimensions in predicting the emotions expressed by music. Psychol. Music 2004, 32, 5–22. [Google Scholar] [CrossRef]
- Yoo, Y.; Yoo, T.; Kong, J.; Choi, S. Emotional responses of tactile icons: Effects of amplitude, frequency, duration, and envelope. In Proceedings of the 2015 IEEE World Haptics Conference (WHC), Evanston, IL, USA, 22–26 June 2015; pp. 235–240. [Google Scholar]
- Salminen, K.; Surakka, V.; Lylykangas, J.; Raisamo, J.; Saarinen, R.; Raisamo, R.; Rantala, J.; Evreinov, G. Emotional and behavioral responses to haptic stimulation. In Proceedings of the ACM SIGCHI Conference on Human Factors in Computing Systems, Yokohama, Japan, 8–13 May 2008; pp. 1555–1562. [Google Scholar]
- Kryssanov, V.V.; Cooper, E.W.; Ogawa, H.; Kurose, I. A computational model to relay emotions with tactile stimuli. In Proceedings of the IEEE 2009 3rd International Conference on Affective Computing and Intelligent Interaction and Workshops, Amsterdam, The Netherlands, 10–12 September 2009; pp. 1–6. [Google Scholar]
- Takahashi, K.; Mitsuhashi, H.; Murata, K.; Norieda, S.; Watanabe, K. Feelings of animacy and pleasantness from tactile stimulation: Effect of stimulus frequency and stimulated body part. In Proceedings of the 2011 IEEE International Conference on Systems, Man, and Cybernetics, Anchorage, AK, USA, 9–12 October 2011; pp. 3292–3297. [Google Scholar]
- Essick, G.K.; McGlone, F.; Dancer, C.; Fabricant, D.; Ragin, Y.; Phillips, N.; Jones, T.; Guest, S. Quantitative assessment of pleasant touch. Neurosci. Biobehav. Rev. 2010, 34, 192–203. [Google Scholar] [CrossRef]
- Bianchi, M.; Valenza, G.; Serio, A.; Lanata, A.; Greco, A.; Nardelli, M.; Scilingo, E.P.; Bicchi, A. Design and preliminary affective characterization of a novel fabric-based tactile display. In Proceedings of the 2014 IEEE Haptics Symposium (HAPTICS), Houston, TX, USA, 23–26 February 2014; pp. 591–596. [Google Scholar]
- Swindells, C.; MacLean, K.E.; Booth, K.S.; Meitner, M. A case-study of affect measurement tools for physical user interface design. In Proceedings of the Graphics Interface 2006; Canadian Information Processing Society: Mississauga, ON, Canada, 2006; pp. 243–250. [Google Scholar]
- Suk, H.J.; Jeong, S.H.; Hang, T.; Kwon, D.S. Tactile sensation as emotion elicitor. Kansei Eng. Int. 2009, 8, 147–152. [Google Scholar] [CrossRef]
- Design, D. Tactor. 2019. Available online: http://www.dancerdesign.co.uk/products/tactor.html (accessed on 19 September 2019).
- Francisco, E.; Tannan, V.; Zhang, Z.; Holden, J.; Tommerdahl, M. Vibrotactile amplitude discrimination capacity parallels magnitude changes in somatosensory cortex and follows Weberś Law. Exp. Brain Res. 2008, 191, 49. [Google Scholar] [CrossRef]
- Vallbo, Å.; Olausson, H.; Wessberg, J. Unmyelinated afferents constitute a second system coding tactile stimuli of the human hairy skin. J. Neurophysiol. 1999, 81, 2753–2763. [Google Scholar] [CrossRef] [Green Version]
- Ackerley, R.; Saar, K.; McGlone, F.; Backlund Wasling, H. Quantifying the sensory and emotional perception of touch: Differences between glabrous and hairy skin. Front. Behav. Neurosci. 2014, 8, 34. [Google Scholar] [CrossRef] [PubMed] [Green Version]
- Badde, S.; Heed, T. Towards explaining spatial touch perception: Weighted integration of multiple location codes. Cognit. Neuropsychol. 2016, 33, 26–47. [Google Scholar] [CrossRef] [PubMed] [Green Version]
- Ravaja, N.; Harjunen, V.; Ahmed, I.; Jacucci, G.; Spapé, M.M. Feeling touched: Emotional modulation of somatosensory potentials to interpersonal touch. Sci. Rep. 2017, 7, 40504. [Google Scholar] [CrossRef] [PubMed] [Green Version]
- Schumann, F.; O’Regan, J.K. Sensory augmentation: Integration of an auditory compass signal into human perception of space. Sci. Rep. 2017, 7, 42197. [Google Scholar] [CrossRef] [Green Version]
- Rizza, A.; Terekhov, A.V.; Montone, G.; Olivetti-Belardinelli, M.; O’Regan, J.K. Why early tactile speech aids may have failed: No perceptual integration of tactile and auditory signals. Front. Psychol. 2018, 9, 767. [Google Scholar] [CrossRef] [Green Version]
- Rossiter, J. Pump and Vibe. 2021. Available online: https://0-data-bris-ac-uk.brum.beds.ac.uk/data/dataset/1vj7fcw8m7gzl2uo35fsb3l4zn (accessed on 20 May 2021). [CrossRef]
- Schutte, K. MathWorks File Exchange; MathWorks: Natick, MA, USA, 2009. [Google Scholar]
- Occelli, V.; Spence, C.; Zampini, M. Audiotactile interactions in temporal perception. Psychon. Bull. Rev. 2011, 18, 429–454. [Google Scholar] [CrossRef] [Green Version]
- Adelstein, B.D.; Begault, D.R.; Anderson, M.R.; Wenzel, E.M. Sensitivity to haptic-audio asynchrony. In Proceedings of the 5th International Conference on Multimodal Interfaces, Vancouver, BC, Canada, 5–7 November 2003; pp. 73–76. [Google Scholar]
- Imbir, K.; Gołąb, M. Affective reactions to music: Norms for 120 excerpts of modern and classical music. Psychol. Music 2017, 45, 432–449. [Google Scholar] [CrossRef]
- Hevner, K. Expression in music: A discussion of experimental studies and theories. Psychol. Rev. 1935, 42, 186. [Google Scholar] [CrossRef]
- Gregory, A.H.; Worrall, L.; Sarge, A. The development of emotional responses to music in young children. Motiv. Emot. 1996, 20, 341–348. [Google Scholar] [CrossRef]
- Gregory, A.H.; Varney, N. Cross-cultural comparisons in the affective response to music. Psychol. Music 1996, 24, 47–52. [Google Scholar] [CrossRef]
Figure 1.
Illustrating how the stimuli in block 2 of Experiment 1 were created. The amplitude represents the displacement of the tactile actuator element used in Experiment 1 to produce precise sensations at a single location on the fingertip. Envelope functions (described by ) are shown for . Increasing and decreasing parts of the envelope function are concatenated to create a set of entire envelopes. Final waveform demonstrated with a 12 Hz sine wave for .

Figure 2.
Pump-and-Vibe device and experimentAL setup for Experiment 2. A: Pump-and-Vibe interface worn by a participant. B: An air pump powers the Squeezer surrounding the upper arm. C: An Arduino controls the pump and motors. D: Eight vibration motors are arranged linearly along the forearm. E: Casings protect the motors and spread vibration. F: A laptop records participant responses and sends serial commands to the Arduino while simultaneously playing music stimuli via headphones.

Figure 3.
Schematic of the FeelMusic mapping process for projecting music onto Pump-and-Vibe.

Figure 4.
Tactile mapping for music sample M3, “Ashes to Ashes” onto the Pump-and-Vibe interface. Top panel: Section of notes extracted from original MIDI file. Bottom panel: Tactile mapping for this sample. Colour indicates intensity for motors 1–8, 1 being closest to the wrist and 8 closest to the elbow, and the squeezer is labelled 10. The white line separates a transition in the music that was reflected by altering the mapping between the two sections.

Figure 5.
The Pump-and-Vibe tactile stimuli generated for Experiment 2. Panel (A) shows the tactile compositions S1–S8 (composed manually for Pump-and-Vibe); sawtooth variations (S1,S2,S3,S7), stroking motion (S4), pinching motion (S6), pulsing (S8) and random activation (S5). Panel (B) shows four of the tactile mappings generated from music samples with major chord progressions (T1), Soul Bossa Nova (T4), Jaws theme (T5) and Is this Love (T6). Intensity is shown by hue, motors 1–8 are the vibration motors along the forearm, S is the squeezer on the upper arm.

Figure 6.
Results of Experiment 1. (A–D) Correlation coefficients (per participant) of perceived intensity and pleasantness against stimulus frequency () and amplitude across all sine and square wave stimuli (frequency = 2, 4, 8, 16, 32, 64 and 128 Hz; and amplitude = 2, 3 and 4 V). (E,F) Correlation coefficients of perceived intensity and pleasantness against stimulus energy for all square wave, sine wave and envelope stimuli. Small markers show individual participant correlation coefficients; circled markers indicate coefficients that are significant (p-value ≤ 0.05); shaded regions show violin plots of all results.

Figure 7.
Results of Experiment 2 with Pump-and-Vibe. Mean pleasantness response of each participant across the music stimuli (M1–M6, auditory only), tactile music mappings (T1–T6, tactile only), combined stimuli (C1–C6, auditory and tactile) and tactile compositions (S1–S8, tactile only). M7, T7 and C7 are shown separately with X markers since T7 is a randomly generated mapping.

Figure 8.
Results of Experiment 2 with Pump-and-Vibe. Adjectives chosen by participants for (left to right): music stimuli M1–M6 (auditory only, shown in blue); tactile stimuli T1–T6 (tactile only, shown in orange); combined stimuli C1–C6 (auditory and tactile, shown in yellow). Text size relates directly to frequency of occurrence.

Figure 9.
Results of Experiment 2 with Pump-and-Vibe. Distributions of the adjectives given by participants in response to the stimuli according to Hevner’s adjective circle. The 3 adjectives each participant chose per stimulus were categorised by group (1–8) and the circular mean taken. Polar plots (1–7) for each song show one standard deviation around the mean of all participant adjective responses to each song for music only (M1–M7), tactile only (T1–T7) and combined presentations (C1–C7). The categories 1–8 are presented in the corresponding location on the circumplex plane as illustrated in the bottom-right panel. * For song 7 the tactile element T7 was randomly generated and not mapped from M7.


Table 1.
The list of stimuli presented to participants. Stimuli were randomised per participant, but combined stimuli were presented last so as not to bias the responses to the separate music and tactile stimuli.
Table 1.
The list of stimuli presented to participants. Stimuli were randomised per participant, but combined stimuli were presented last so as not to bias the responses to the separate music and tactile stimuli.
| Modality | Stimuli |
|---|---|
| Auditory | Short music samples |
| M1: Major chord progression * | |
| M2: Minor chord progression * | |
| M3: Ashes to Ashes, David Bowie * | |
| M4: Soul Bossa Nova, Quincy Jones * | |
| M5: Main title (Jaws theme), John Williams * | |
| M6: Is this Love, Bob Marley * | |
| M7: Sweet sixteen, BB King * | |
| Tactile | Mappings of music onto the Pump-and-Vibe (see Figure 5B) |
| T1: Tactile mapping of M1 | |
| T2: Tactile mapping of M2 | |
| T3: Tactile mapping of M3 | |
| T4: Tactile mapping of M4 | |
| T5: Tactile mapping of M5 | |
| T6: Tactile mapping of M6 | |
| T7: Random tactile sensations (see S5) | |
| Tactile | Compositions for the Pump-and-Vibe (see Figure 5A) |
| S1: Fast sawtooth stroking effect | |
| S2: Slower stroking effect | |
| S3: Increasing speed stroking | |
| S4: Slow progression, increasing intensity | |
| S5: Random pulses | |
| S6: Pinching effect, increasing intensity | |
| S7: Fast sawtooth with pulsing | |
| S8: All motors pulsing simultaneously | |
| Combined | Combination of music and tactile mappings |
| C1: M1 played with T1 | |
| C2: M2 played with T2 | |
| C3: M3 played with T3 | |
| C4: M4 played with T4 | |
| C5: M5 played with T5 | |
| C6: M6 played with T6 | |
| C7: M7 played with T7 (not matching) |
* Music clips are provided in the supporting documents, they are all instrumental samples.
Table 2.
The eight adjective groups presented to participants in Experiment 2, taken from Hevner’s adjective circle.
Table 2.
The eight adjective groups presented to participants in Experiment 2, taken from Hevner’s adjective circle.
| 1 | 2 | 3 | 4 |
| Serious | Sad | Sentimental | Tranquil |
| Dignified | Melancholy | Tender | Leisurely |
| Lofty | Depressing | Dreamy | Satisfying |
| Sober | Heavy | Longing | Lyrical |
| Solemn | Tragic | Yearning | Quiet |
| Spiritual | Dark | Pleading | Soothing |
| 5 | 6 | 7 | 8 |
| Playful | Happy | Exciting | Vigorous |
| Humorous | Joyous | Dramatic | Robust |
| Sprightly | Gay | Passionate | Emphatic |
| Light | Merry | Exhilarated | Ponderous |
| Delicate | Cheerful | Restless | Majestic |
| Whimsical | Bright | Triumphant | Exalting |
Table 3.
Results of a parametric Watson–Williams multi-sample test for equal means to compare stimuli types music (M), tactile (T) and combined (C) across participants for the 7 songs shown in Figure 9. Reject for small p values; results in bold indicate accepted.
Table 3.
Results of a parametric Watson–Williams multi-sample test for equal means to compare stimuli types music (M), tactile (T) and combined (C) across participants for the 7 songs shown in Figure 9. Reject for small p values; results in bold indicate accepted.
| Song | p-Value for Hypothesis : | ||
|---|---|---|---|
| A: Major chords | 0.000 | 0.001 | 0.001 |
| B: Minor chords | 0.281 | 0.585 | 0.719 |
| C: Ashes to Ashes | 0.001 | 0.683 | 0.001 |
| D: Soul Bossa Nova | 0.002 | 0.210 | 0.018 |
| E: Jaws theme | 0.001 | 0.437 | 0.007 |
| F: Is this love | 0.381 | 0.203 | 0.969 |
| G: Sweet sixteen | 0.000 | 0.209 | 0.000 |
Table 4.
The adjectives chosen by more than one participant in response to each tactile composition (S1–S8) as shown in Figure 5A.
Table 4.
The adjectives chosen by more than one participant in response to each tactile composition (S1–S8) as shown in Figure 5A.
| Stimulus | Modal Adjectives |
|---|---|
| S1 | Exciting, Restless, Vigorous |
| S2 | Restless, Dramatic, Playful, Cheerful, Bright |
| S3 | Restless, Dramatic, Exciting, Vigorous, Playful, Exhilarating |
| S4 | Yearning, Sad, Leisurely, Sober, Light |
| S5 | Restless, Vigorous, Playful, Exciting, Heavy |
| S6 | Sad, Tragic, Solemn |
| S7 | Vigorous, Restless, Dramatic, Emphatic, Bright, Exhilarating |
| S8 | Vigorous, Dramatic, Robust, Serious, Heavy |
Publisher’s Note: MDPI stays neutral with regard to jurisdictional claims in published maps and institutional affiliations. |
© 2021 by the authors. Licensee MDPI, Basel, Switzerland. This article is an open access article distributed under the terms and conditions of the Creative Commons Attribution (CC BY) license (https://creativecommons.org/licenses/by/4.0/).
Share and Cite
MDPI and ACS Style
Haynes, A.; Lawry, J.; Kent, C.; Rossiter, J. FeelMusic: Enriching Our Emotive Experience of Music through Audio-Tactile Mappings. Multimodal Technol. Interact. 2021, 5, 29. https://0-doi-org.brum.beds.ac.uk/10.3390/mti5060029
AMA Style
Haynes A, Lawry J, Kent C, Rossiter J. FeelMusic: Enriching Our Emotive Experience of Music through Audio-Tactile Mappings. Multimodal Technologies and Interaction. 2021; 5(6):29. https://0-doi-org.brum.beds.ac.uk/10.3390/mti5060029
Chicago/Turabian StyleHaynes, Alice, Jonathan Lawry, Christopher Kent, and Jonathan Rossiter. 2021. "FeelMusic: Enriching Our Emotive Experience of Music through Audio-Tactile Mappings" Multimodal Technologies and Interaction 5, no. 6: 29. https://0-doi-org.brum.beds.ac.uk/10.3390/mti5060029