Article

Colloidally Stable P(DMA-AGME)-Ale-Coated Gd(Tb)F3:Tb3+(Gd3+),Yb3+,Nd3+ Nanoparticles as a Multimodal Contrast Agent for Down- and Upconversion Luminescence, Magnetic Resonance Imaging, and Computed Tomography

1
Institute of Macromolecular Chemistry, Czech Academy of Sciences, 162 06 Prague 6, Czech Republic
2
Institute of Physiology, Czech Academy of Sciences, 142 20 Praha 4, Czech Republic
3
Center for Advanced Preclinical Imaging (CAPI), First Faculty of Medicine, Charles University, 120 00 Prague 2, Czech Republic
*
Authors to whom correspondence should be addressed.
Preclinical imaging.
Submission received: 27 November 2020 / Revised: 8 January 2021 / Accepted: 13 January 2021 / Published: 16 January 2021
(This article belongs to the Special Issue Nanomaterials for Contrast Agent and Biomedical Imaging)

Abstract

:
Multimodal imaging, integrating several modalities including down- and up-conversion luminescence, T1- and T2(T2*)-weighted MRI, and CT contrasting in one system, is very promising for improved diagnosis of severe medical disorders. To reach the goal, it is necessary to develop suitable nanoparticles that are highly colloidally stable in biologically relevant media. Here, hydrophilic poly(N,N-dimethylacrylamide-N-acryloylglycine methyl ester)-alendronate-[P(DMA-AGME)-Ale]-coated Gd(Tb)F3:Tb3+(Gd3+),Yb3+,Nd3+ nanoparticles were synthesized by a coprecipitation method in ethylene glycol (EG) followed by coating with the polymer. The particles were tho-roughly characterized by a dynamic light scattering (DLS), transmission electron microscopy (TEM), Fourier-transform infrared spectroscopy (FTIR), thermogravimetric analysis (TGA), X-ray energy dispersive spectroscopy (EDAX), selected area electron diffraction (SAED), elemental ana-lysis and fluorescence spectroscopy. Aqueous particle dispersions exhibited excellent colloidal stability in water and physiological buffers. In vitro toxicity assessments suggested no or only mild toxicity of the surface-engineered Gd(Tb)F3:Tb3+(Gd3+),Yb3+,Nd3+ particles in a wide range of concentrations. Internalization of the particles by several types of cells, including HeLa, HF, HepG2, and INS, was confirmed by a down- and up-conversion confocal microscopy. Newly developed particles thus proved to be an efficient contrast agent for fluorescence imaging, T1- and T2(T2*)-weighted magnetic resonance imaging (MRI), and computed tomography (CT).

1. Introduction

With the rapid development of science and technology, multimodal imaging is attracting increasing attention because it can integrate advantages of different imaging modes in one system and improve the efficiency of diagnosis and biomedical research [1]. Multimodal imaging can thus overcome limitations of single imaging platforms, such as spatial and temporal resolution, depth penetration or sensitivity. These limitations are inherent in routine clinical investigations, including magnetic resonance imaging (MRI), positron emission tomography, computed tomography (CT), optical fluorescence imaging (FI), and sonography. Multimodal imaging plays also an important role in recognition of the tumor border and may help effectively guide the surgical resection in clinical practice dealing with cardiovascular, neuropsychiatric, and other disorders [1,2,3].
In these medical applications, the nanoparticles are often used, which have advantage of a large surface area to be functionalized with multimodal reporters and targe-ting vectors. Examples of nanosized particles used in imaging technologies include dendrimers, liposomes, gold, silver, quantum dots, iron oxides, silica, as well as lanthanides [2,4]. Among the lanthanide-based platforms for fluorescence imaging (FI), a special attention is paid to fluorides, because they have lower vibrational energy than oxides, and consequently, the quenching of the exited state of Ln cations is minimized, which results in high quantum efficiency of the luminescence [5]. In recent years, a lot of research has been focused on application of down- (DC) and up-conversion (UC) lanthanide fluorides [3,4,6,7]. Compared to traditionally used fluorescent organic dyes and quantum dots, lanthanide-based fluorides have a number of advantages, such as sharp emission bandwidth, long lifetime, tunable emission, high photostability, low cytotoxicity, and low background autofluorescence for DC and UC fluorescence. They are also interesting as contrast agents for MRI and CT due to paramagnetic properties and X-ray contrast [8]. Combining fluorescence with magnetic and X-ray properties of lanthanides is attractive, because greater sensitivity and resolution of FI complement MRI and CT. Particularly, MRI is superior for imaging of soft tissues because of abundance of protons, whereas X-ray CT is a powerful tool for detection of hard body parts with high electron densities. Moreover, CT is available for patients with metal implants, whereas MRI not, and MRI does not use ionizing radiation and iodinated contrast agents, in contrast to X-ray CT. Therefore, combination of FI, MRI, and CT introduces great benefits both for clinical diagnosis and biomedical research.
A lot of effort is required to develop multipurpose nanoparticles with several pro-perties combined in a single particle. To date, various nanosized contrast enhancing agents have been reported, such as Fe [9,10,11], Au [4,12], Mn, or lanthanides [2,13,14], which are suitable for dual or multimodal FI, MRI, and CT imaging; however, only lanthanides have been demonstrated to be promising for ultrahigh field MRI [15,16]. More-over, lanthanide-based X-ray contrast agents are less nephrotoxic compared to the clinically used iodinated compounds [17]. Among the lanthanide ions, Yb3+, Gd3+, and Tb3+ play a special role due to a short electronic relaxation time and large effective magnetic moment (μeff = 7.9–9.7 μB), which makes them promising as potential T1 or T2(T2*) MRI contrast agents [18]. In addition, they have a large atomic number and high K-edge energy (~50–60 keV), which renders large X-ray attenuation coefficient. This well matches with the X-ray spectra used in clinical CT, thus enabling both high intrinsic contrast and rather low radiation exposure to the patients. Moreover, Tb3+ ions have attracted a particular attention due to their highly efficient green photoluminescence and a long luminescence lifetime, which results in applications in biochemical imaging without any autofluorescence background [19]. As Tb3+ does not have energy levels, which can directly absorb NIR light, Nd3+ and Yb3+ is the best choice to obtain UC luminescence in Tb3+-doped systems [20]. Moreover, unique optical properties of Nd and Yb have been the focus of numerous investigations for application in semiconductors and magnetic devices [4,21]. Introduction of Nd3+ ions in the host lattice increases the saturation magnetization of the nanoparticles. Co-doping of fluoride host with Yb3+ and Gd3+ ions can efficiently change transverse relaxivity and optimize both longitudinal and transverse relaxivities for T1/T2 dual-weighted MRI [22]. Advantage of Gd3+ ions lies in their very low leaching from the particles in water [23]. Gd-, Tb-, Yb-, and Nd-based particles are more stable than other MRI contrast agents, such as chelates, providing a particularly useful platform for the design of multimodal imaging nanoprobes.
Generally, Gd- and Tb-based fluoride nanoparticles can be prepared by thermal decomposition, coprecipitation, complex-assisted hydrothermal methods, or reverse micelle and microwave-assisted techniques [24]. Nevertheless, post-synthesis heat treatment and functionalization are required in some of these methods in order to make the particles water-dispersible; however, this often leads to formation of very toxic byproducts. Typical advantages of precipitation in glycol-based media (e.g., ethylene glycol—EG or glycerol) are the capping abilities of glycols, their low toxicity compared to other organic solvents, and simplicity of the procedure [25]. EG is also used to control the particle size and morphology, as well as to prevent particle aggregation [26]. Preventing of aggregation could offer precise regulation of the physicochemical properties of the nanomaterials in any bio-application, as well as in vivo safety.
One of the main challenges for applications of nanoparticles in biological media is to control the surface chemistry by introduction of specific coatings that have to be nontoxic, biocompatible, and allow binding of drugs, proteins, enzymes, antibodies, or nucleotides. This is associated with other requirements: (i) stabilization of nanoparticles in biological media at a high salt concentration, (ii) introduction of functional groups on the surface for further modification, and finally (iii) prevention of immediate uptake by the macrophages. Functionalization of nanoparticles additionally changes their properties and affects bioactivity. Hence, the right choice of the coating material with defined physicochemical and biochemical properties is extremely important to render the nanoparticles applicable in nanomedicine. For this purpose, different strategies have been reported, including the use of stabilizers, such as poly(ethylene glycol), poly(N–isopropylacrylamide), polyvinylpyrrolidone, poly(vinyl alcohol), poly(4-styrenesulfonic acid-co-maleic acid), and poly(N,N-dimethylacrylamide) [14,27,28]. Polyacrylamides seem to be a smart choice as a nanoparticle coating, as they provide not only colloidal stability in biological media, but also thermoresponsive behavior.
In this report, we present co-doping of fluoride contrast agents with Gd3+, Tb3+, Yb3+, and Nd3+ ions to provide DC/UC luminescence, MRI, and CT contrast. We have synthesized copolymers of N,N-dimethylacrylamide and N-acryloylglycine methyl ester (AGME) as a coating, which not only provided biocompatibility, but also long-term colloidal stability in physiological media, such as phosphate-buffered saline (PBS) or sodium acetate. In vitro cytotoxicity and intracellular uptake of the particles was investigated using primary and cancer cell lines by PrestoBlue™ reagent and confocal microscopy, respectively. Different modalities of in vivo imaging on model mice then proved applicability of the particles for multimodal contrasting, in particular T1- and T2*-weighted MRI, computed tomography, and fluorescence imaging.

2. Materials and Methods

2.1. Materials

Chloride hexahydrates of terbium(III), neodymium(III), ytterbium(III), and gadoli-nium(III) (99.99%), sodium tetrafluoroborate, phosphate-buffered saline (PBS), and N,N’-bis(2,3-dihydroxypropyl)-5-[N-(2,3-dihydroxypropyl)acetamido]-2,4,6-triiodoisophthal-amide (Iohexol) were obtained from Sigma-Aldrich (St. Louis, MO, USA). Ethanol (99%), ethylene glycol (EG), acetic and hydrochloric acids were obtained from Lach-Ner (Neratovice, Czech Republic). Sodium hydroxide and sodium chloride were purchased from Lachema (Brno, Czech Republic). Sodium acetate (NaAc) buffer (pH 5) was prepared from sodium hydroxide and acetic acid. Gibco™ penicillin-streptomycin, CellMask™ deep red and PrestoBlue™ cell viability reagents were obtained from Thermo Fisher Scientific (Waltham, MA, USA). Sulfo-Cyanine7 NHS ester (Cy7) was purchased from Lumiprobe (Hannover, Germany). Isoflurane was obtained from Baxter (San Juan, Puerto Rico). Alendronate-modified poly(N,N-dimethylacrylamide-co-N-acryloylglycine methyl ester) [P(DMA-AGME)-Ale; Mw = 11,000 g/mol] (Figure 1) was synthesized according to previously published procedure [29]. All chemicals were used directly without further purification. Ultrapure Q-water ultra-filtered on a Milli-Q Gradient A10 system (Millipore; Molsheim, France) was used in all experiments.

2.2. Synthesis of Gd(Tb)F3:Tb3+(Gd3+),Yb3+,Nd3+ Nanoparticles

Lanthanide fluoride nanoparticles were prepared by a coprecipitation method in EG. In a typical procedure, P(DMA-AGME)-Ale (10−4–10−2 mg/mL) was dissolved in EG (10 mL) with magnetic stirring to form a clear solution, to which 1 mmol of lanthanide chlorides (GdCl3·6H2O, TbCl3·6H2O, YbCl3·6H2O, and NdCl3·6H2O) was added. After vigorous stirring for 30 min, EG (3 mL) containing NaBF4 (3 mmol) was added dropwise and the mixture was kept at 75 °C (optionally 100 or 140 °C) for 3.5 h with stirring. The solution was cooled in air to room temperature (RT), the precipitate was separated by centrifugation (14,500 rpm; 30 min) and washed with water and ethanol several times. Finally, the product, denoted as Gd(Tb)F3:Tb3+(Gd3+),Yb3+,Nd3+@P(DMA-AGME)-Ale, was dispersed in 5 mL of water. One part of the dispersion was dried at 23 °C for 3 days under vacuum to obtain a sample for physicochemical analysis. Typical particles used in the experiments had molar composition GdF3:10%Tb3+,5%Yb3+,5%Nd3+ and TbF3:20%Gd3+,5%Yb3+,5%Nd3+.

2.3. Modification of GdF3:Tb3+,Yb3+,Nd3+@P(DMA-AGME)-Ale Nanoparticles with Cy7-Ale

Cy7-NHS (1 mg) was added to Ale (3.2 mg; tenfold molar excess) solution in PBS (1 mL) and the mixture was aged at RT for 24 h in the dark resulting in Cy7-Ale. The purified P(DMA-AGME)-Ale-coated GdF3:Tb3+,Yb3+,Nd3+ particles (30 mg/mL) were reacted with Cy7-Ale (l mg/mL) in PBS (pH 7.4) at RT overnight in the dark. Unbound Cy7 was removed by washing with PBS and water using centrifugation.

2.4. Characterization of Nanoparticles

The particle morphology was examined on a Tecnai Spirit G2 transmission electron microscope (TEM; FEI; Brno, Czech Republic). Particle size distribution characterized by dispersity (Ð) was obtained by counting 300 particles from the TEM micrographs to determine the number-(Dn) and weight-average particle diameter (Dw) [29]:
Ð = Dw/Dn,
Dn = ∑Ni Di/∑Ni
Dw = ∑Ni Di4/∑Ni Di3
where Di and Ni are the diameter and number of i-th particle, respectively. TEM microscope was equipped with an EDX energy dispersive spectrometer (EDAX; Mahwah, NJ, USA) used for analysis of the elemental composition of the nanoparticles. The crystal structure was verified by a selected area electron diffraction (SAED) as described in our previous work [30].
Dynamic light scattering (DLS) measurements (Zetasizer Ultra; Malvern, UK) provided the hydrodynamic diameter (Dh) and polydispersity (PD) calculated from the cumulant analysis of the intensity autocorrelation, assuming a single particle size mode. Single exponential fit was applied to the autocorrelation function and the polydispersity was derived from the width of the assumed Gaussian distribution. Thermogravimetric analysis (TGA) of the particles was performed with a Perkin Elmer TGA 7 analyzer (Norwalk, CT, USA) over the temperature range 30–850 °C at a constant heating rate of 10 °C/min under nitrogen atmosphere. Content of Gd3+, Tb3+, Nd3+, and Yb3+ was determined using a SPECTRO XEPOS energy-dispersive X-ray fluorescence spectrometer (SPECTRO Analytical Instruments; Kleve, Germany) on samples digested with HNO3 in a Biotage Initiator microwave reactor (Biotage; Uppsala, Sweden). Emission and excitation spectra were recorded with a FS5 Edinburgh Instruments spectrofluorometer (Edinburgh, UK) coupled with UV and 980 nm CW laser with 2 W output power (MDL-III-980).

2.5. In Vitro Cytotoxicity

Cytotoxicity of particles was tested using cancer and primary cell lines. Human cervical adenocarcinoma (HeLa cell line) and primary human dermal fibroblasts (HF cell line), kindly provided by Dr. Mělková and Dr. Dvořánková, respectively, the First Faculty of Medicine, Charles University, Prague, were cultivated in Dulbecco’s Modified Eagle Medium (DMEM) supplemented with 10% heat-inactivated fetal bovine serum (FBS) and 1% Gibco™ penicillin-streptomycin at 37 °C under 5% CO2 atmosphere. The cells (5 × 10³ of HeLa or 8 × 10³ of HF cells) were seeded onto 96-well flat-bottom plates (TPP; Prague, Czech Republic) in the medium (100 μL) for 24 h, aqueous dispersion of Gd(Tb)F3:Tb3+(Gd3+),Yb3+,Nd3+@P(DMA-AGME)-Ale nanoparticles (0.016–2 mg/mL) was added, cultivation continued for 72 h, and PrestoBlue™ (10 μL) was added for 3.5 h with HeLa or for 4 h with HF cells. The active component of the PrestoBlueTM reagent (resa-zurin) was reduced to the highly fluorescent resorufin only in viable cells. Fluorescence was measured on a Synergy Neo plate reader (Bio-Tek; Prague, Czech Republic). As a control, cells in the absence of particles were used. For statistical analysis, GraphPad Prism software was used. The experiments were repeated two times in triplicates.

2.6. Downconversion Confocal Laser Scanning Microscopy

In the investigation of uptake of the nanoparticles by HeLa and HF cells, they were seeded at a density of 150,000 cells per mL of culture medium on a glass dish with 4 chambers (20 mm microwell, cover glass with thickness 0.13–0.16 mm; Bio-Port Europe; Prague, Czech Republic) and cultivated at 37 °C for 24 h in 5% CO2 atmosphere. P(DMA-AGME)-Ale-coated Gd(Tb)F3:Tb3+(Gd3+),Yb3+,Nd3+ nanoparticles (1 mg/mL) were then added and incubated with the cells for 24 h, which was followed by washing with PBS and labeling with CellMaskTM deep red plasma membrane marker (1 µg/mL) at RT for 15 min. The cells were then washed with PBS twice and visualized using an FV10-ASV Olympus laser scanning confocal microscope equipped with a 60× oil immersion objective (Olympus; Prague, Czech Republic). The nanoparticles were detected at 405 nm excitation with 450–550 nm emission filter, while the plasma membrane was detected at 485 nm excitation with 520–600 nm emission filter.

2.7. Upconversion Confocal Laser Scanning Microscopy

Human hepatocellular carcinoma HepG2 (ECACC 85011430) cells were cultivated in DMEM with 3 mM glutamine, 10% (v/v) fetal calf serum, 10 mM HEPES, 100 IU/mL peni-cillin, streptomycin (100 μg/mL), and 5 mM glucose at 37 °C in humidified air with 5% CO2. Rat insulinoma INS-1E cells (kindly provided by Prof. Maechler, University of Geneva, or purchased from AddexBio, cat. No. C0018009; San Diego, CA, USA) were cultured in 11 mM glucose and RPMI 1640 medium supplemented with 5% (v/v) fetal calf serum, 10 mM HEPES, 1 mM pyruvate, 50 µM mercaptoethanol, 50 IU/mL penicillin, and 50 mg/mL streptomycin. The cells were cultured on poly(L-lysine)-coated glass coverslips in DMEM (2 mL) for 2 days, incubated with GdF3:Tb3+,Yb3+,Nd3+@P(DMA-AGME)-Ale particle dispersion (200 μL; 10 mg/mL) for 24 h, transferred to a thermostable chamber at 37 °C under 5% CO2 atmosphere, and finally observed in a Leica TCS SP8 AOBS confocal inverted fluorescence microscope (Wetzlar, Germany) equipped with a HC PL APO 63×/1.20 NA W CORR CS2, WD = 0.3 mm, objective. For the measurement of upconversion luminescence, the particles were excited by a Chameleon Ultra I pulsed infrared tunable laser with wavelength range 690–1040 nm, maximum output power 4 W, pulse frequency 80 MHz, pulse width ~140 fs, and laser intensity controlled by electrooptical EOM modulator (Coherent; Santa Clara, CA, USA) and attenuator at 808 and 980 nm excitation. CellMask™ deep red-stained cell plasma membranes were visualized in a standard fluorescence confocal microscope with excitation and emission at 649 and 666 nm, respectively, using a WLL2 supercontinuous pulsed laser (NKT Photonics; Birkerød, Denmark) with an average laser power ~1.5 mW.

2.8. In Vitro Longitudinal (T1) and Transversal Relaxation (T2) and Relaxivity (r1,2) Measurement

Aqueous dispersions of Gd(Tb)F3:Tb3+(Gd3+),Yb3+,Nd3+@P(DMA-AGME)-Ale nanoparticles doped with different concentrations of Gd3+, Tb3+, Nd3+, and Yb3+ were subjected to MR relaxometry. T1 and T2 relaxation times responsible for contrast in MR images were measured on a 0.5 T Minispec relaxometer (Bruker BioSpin, Ettlingen, Germany). Relaxation times (T1,2) were converted to relaxivity rates (R1,2) and, after deducting the contribution of water, related to the actual lanthanide concentration c:
R1,2 = 1/T1,2
r1,2 = (1/T1,2 − 1/T1,2water)/c
Relaxation times of GdCl3, TbCl3, NdCl3, and YbCl3 solutions were measured and respe-ctive relaxivities were calculated for comparison.

2.9. In Vivo Magnetic Resonance Imaging (MRI)

The mice (CD1; two animals in each group; obtained from the Center for Experimental Biomodels, First Faculty of Medicine, Charles University, Prague, Czech Republic) were scanned both before and 0.5, 2, 5, 24, 96, and 168 h after retroorbital administration of the Gd(Tb)F3:Tb3+(Gd3+),Yb3+,Nd3+@P(DMA-AGME)-Ale nanoparticles (120 µL, 27 mg/mL of PBS). MR images were obtained using an MR imager Icon (Bruker BioSpin; Ettlingen, Germany) working at 1 T magnetic field. The animals were placed on a heated bed with a whole-body radiofrequency coil. Vital functions were monitored during the scanning and two sequences with different weighting were used to obtain coronal slices of the mouse body: (i) T1-weighted gradient echo sequence (with a weak T2*-weighting), echo time TE 3 ms, repetition time TR 100 ms, flip angle 80°, matrix 128 × 256, field of view FOV 25 × 50 mm, slice thickness 1 mm, and number of acquisitions NA 32; (ii) a strongly T2*-weighted gradient echo sequence, TE 8 ms, TR 400 ms, flip angle 60°, NA 8, and the same geometry. A relative signal intensity was calculated as a ratio of the signal in the given organ (liver, spleen, kidney) and the signal in the thigh muscle, which was less vascularized and without substantial nanoparticle deposition. Mice were anesthetized by passive inhalation of isoflurane in air (3% for induction and 1.5–2% for maintenance) for both administration of the nanoparticles and MRI examination.
The animal experiments were performed in accordance with national and international guidelines for laboratory animal care and were approved by the Laboratory Animal Care and Use Committee of the First Faculty of Medicine, Charles University, and the Ministry of Education, Youth and Sports of the Czech Republic (MSMT-34384/2019-2).

2.10. In Vitro and In Vivo CT Investigation and Imaging

X-ray attenuation of aqueous dispersions of Gd(Tb)F3:Tb3+(Gd3+),Yb3+,Nd3+@P(DMA-AGME)-Ale nanoparticles (0–35 mg/mL) doped with different concentrations of Gd3+, Tb3+, Nd3+, and Yb3+ ions and in vivo CT imaging of mice (CD1) were done using a precli-nical Albira imager (Bruker BioSpin; Ettlingen, Germany). Mice were monitored prior to contrast injection with the following settings: CT bed 125 mm, 45 kV, 400 μA, high quality mode, time >1 h with two rotations of gantry (each 1000 projections). 3D images were reconstructed by filtered back projection with voxel size of 0.125 mm. GdF3:Tb3+,Yb3+,Nd3+@P(DMA-AGME)-Ale nanoparticles (120 μL, 27 mg/mL of PBS) were administered retro-orbitally to mice under isoflurane anesthesia (1.5%, 1.5 mL/min) and then again after 24 h. Mice were measured 48 h after the first administration of the particles and the resulting images were compared. Volume of the liver and kidneys was calculated in terms of average X-ray attenuation values (Hounsfield units HU).

2.11. In Vivo Optical Imaging

Biodistribution of GdF3:Tb3+,Yb3+,Nd3+@P(DMA-AGME)-Ale-Cy7 nanoparticles (120 µL of dispersion; 27 mg of particles per mL of PBS) was determined by in vivo fluorescence imaging in two CD1 mice scanned before, immediately after, and 2, 5, 24, 96, and 168 h after retroorbital injection. The mice were shaved on the left side of the body before scanning and anesthetized by 3% isoflurane (2% isoflurane to maintain anesthesia). Fluorescence intensity was measured by an optical Xtreme in vivo imager (Bruker; Ettlingen, Germany) using the excitation filter 750 nm and the emission filter 830 nm. After the measurement, mice were sacrificed by cervical dislocation, selected organs (liver, kidneys, lungs, spleen, and heart) were removed and measured for fluorescence intensity using the same settings. The greyscale adjustments were performed using open source image processing software ImageJ, v. 1.52p (National Institutes of Health; Bethesda, MD, USA).

3. Results and Discussion

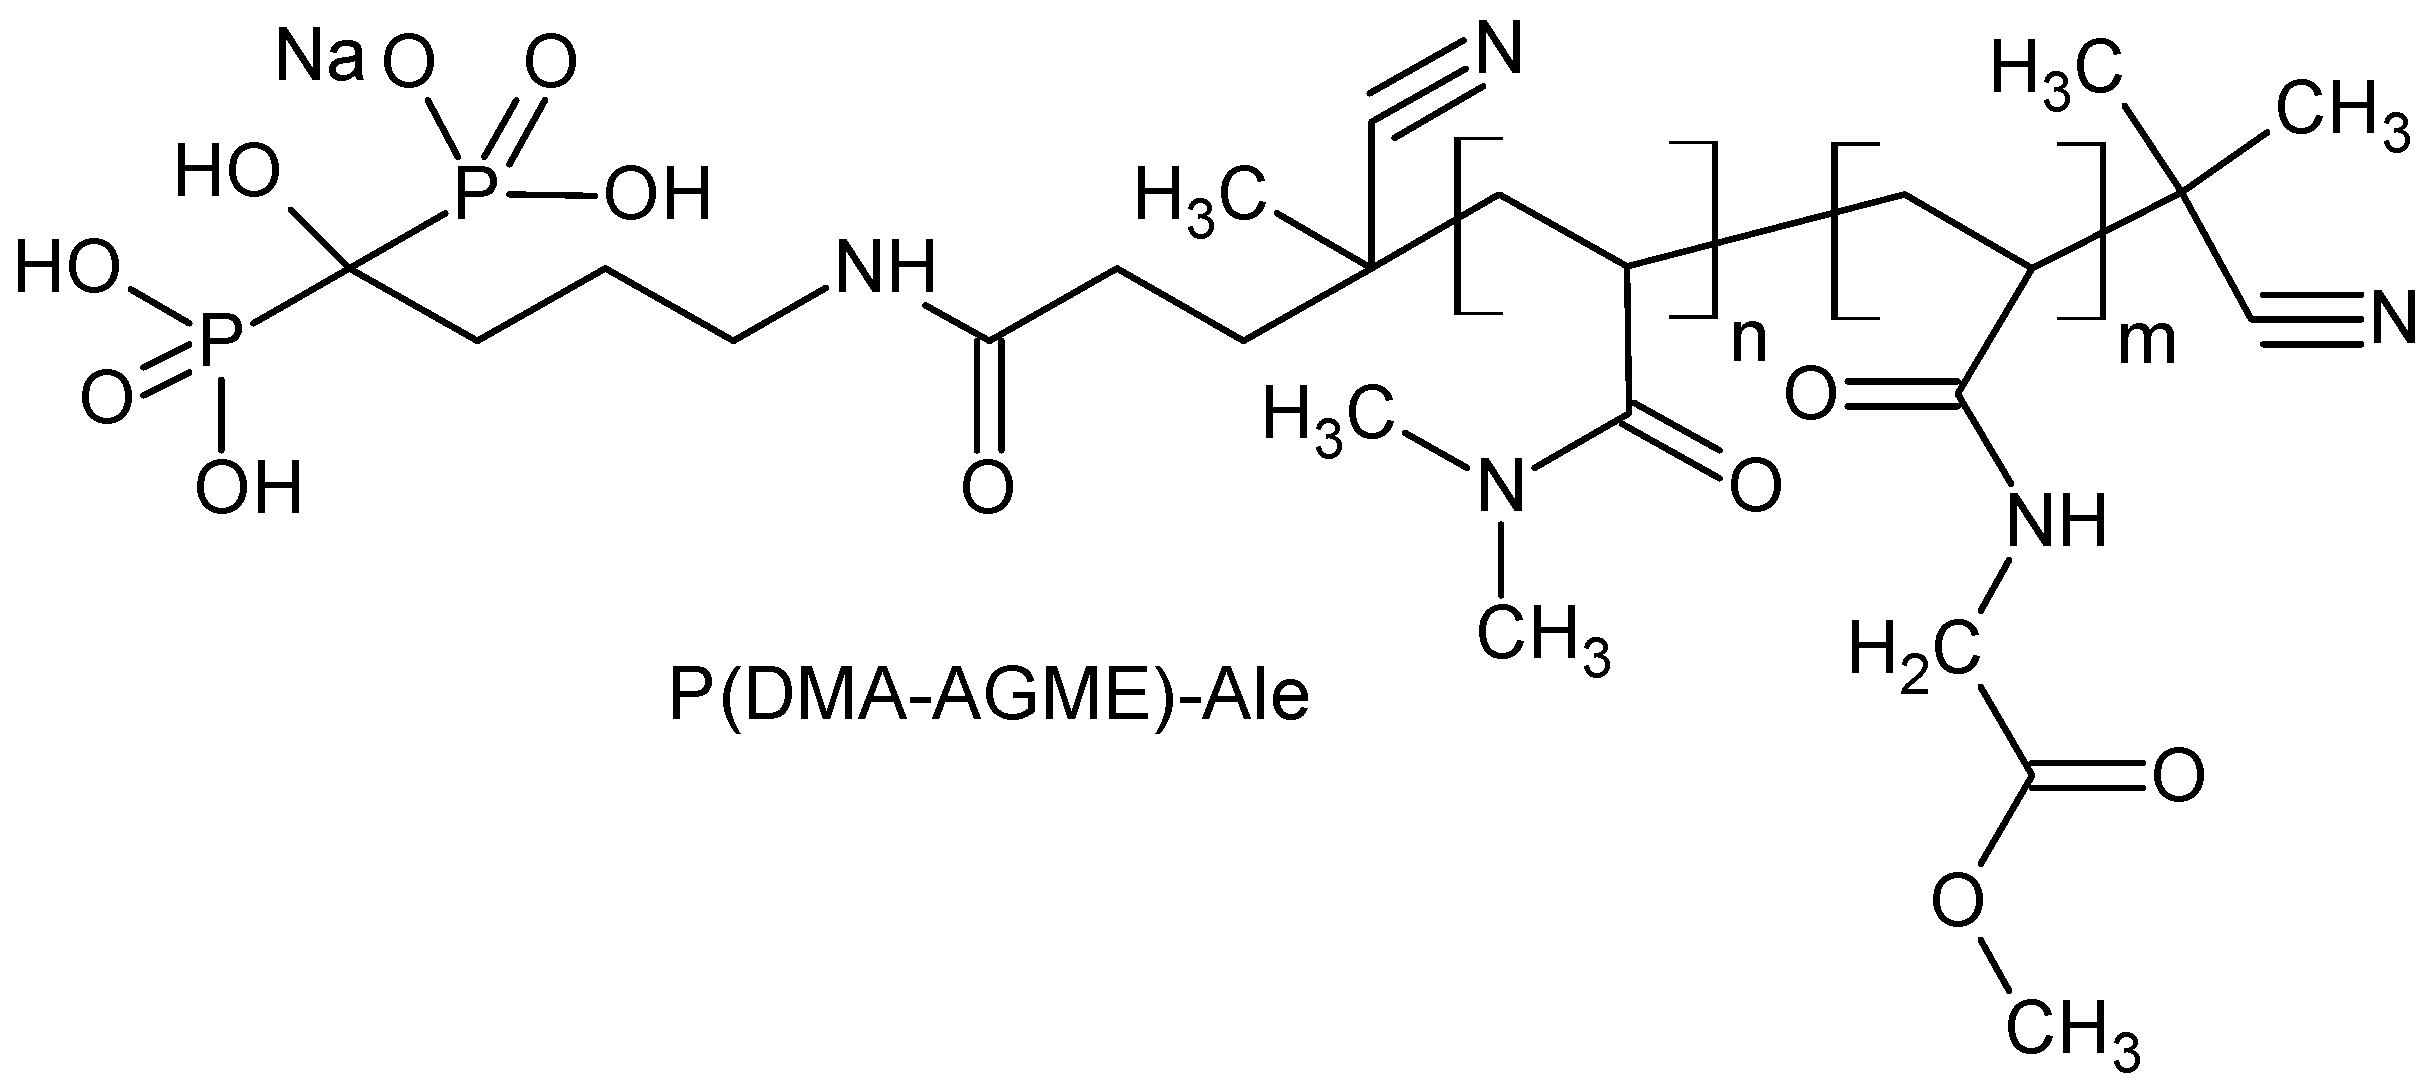
3.1. Synthesis of Gd(Tb)F3:Tb3+(Gd3+),Yb3+,Nd3+@P(DMA-AGME)-Ale Nanoparticles

Gd(Tb)F3:Tb3+(Gd3+),Yb3+,Nd3+ nanoparticles were obtained by a one-step coprecipitation of lanthanide salts using EG solvent and water-soluble P(DMA-AGME)-Ale copolymer as a capping agent to control the morphology and colloidal stability. In the system, Gd3+ served as T1-weighted MRI contrast agent, while Tb3+ with a short electronic relaxation time enhanced T2 relaxation. Co-doping of Tb3+ with Yb3+ was selected to shift the up-conversion emission under 980 nm, while doping with paramagnetic Nd3+ ions was chosen to absorb photons at 808 nm. Advantage of poly(N,N-dimethylacrylamide) (PDMA) coating consisted in that it has been already successfully used in biomedicine, including MRI and drug delivery systems, due to its excellent hydrophilicity and biocompatibility [29,31,32]. Last but not least, N,N-dimethylacrylamide (DMA) is easy to copolymerize with various functional comonomers to introduce reactive groups for subsequent attachment of biomolecules. DMA was copolymerized with AGME, methyl ester groups of which can be easily transformed to hydrazone, commonly used pH-sensitive linkage for attachment of anticancer drug (e.g., doxorubicin). P(DMA-AGME)-Ale copolymer was synthesized by a simple radical copolymerization [29]. Preliminary experiments showed that the concentration of P(DMA-AGME)-Ale in EG has to be >10−2 mg/mL to obtain nanoparticles stable in water and/or PBS. In comparison, P(DMA-AGME)-coated nanoparticles prepared in water precipitated immediately after transfer in water or PBS. However, size, dispersity, and colloidal stability of GdF3 nanoparticles is known to be controlled by a combination of a stabilizing agent (e.g., PSSMA) and EG [8,33]. To investigate the effect of the stabilizer concentration in EG on colloidal stability of the Gd(Tb)F3-based nanoparticles, they were prepared with different amounts of PDMA of various molar mass (Table S1; Supporting Data). Increasing concentrations of polymer in EG increased the colloidal stability of particles. Preferred Mw of PDMA reached 8000 or 1.1 × 10⁴ g/mol to efficiently stabilize the nanoparticles in buffer solutions, which agreed with literature data [29]. PDMA of Mw = 1.1 × 10⁴ g/mol was then selected for all other experiments in this study.
Hydrodynamic size of P(DMA-AGME)-Ale-coated GdF3:Tb3+,Yb3+,Nd3+ and TbF3:Gd3+,Yb3+,Nd3+ nanoparticles in water was 74 and 82 nm, respectively, with a rather narrow polydispersity PD ~0.075, (Table 1, Figure 2a). Narrow particle size distribution is important in terms of controllable physicochemical and biological properties and reproducibility of the results [34]. ζ-potential of the nanoparticles was slightly positive (1–2 mV), which could support their internalization in the cells that are typically negatively charged. Hydrodynamic size of both particle types in PBS and sodium acetate (NaAc) buffers was recorded also as a function of time (Figure 2b). The nanoparticle size increased by 30–40 nm after 24 h in PBS and then remained constant during two weeks without any sign of sedimentation. Moreover, coating with P(DMA-AGME)-Ale colloidally stabilized the Gd(Tb)F3:Tb3+(Gd3+),Yb3+,Nd3+ nanoparticles in NaAc buffer for more than month without any sign of aggregation. Investigation of the effect of the reaction temperature on the colloidal stability of the particles revealed that the hydrodynamic dia-meters of GdF3:Tb3+,Yb3+,Nd3+@P(DMA-AGME)-Ale nanoparticles increased with increasing temperature from 75 to 140 °C, documenting worsening of the colloidal stability (Figure S1). Colloidal instability of the particles synthesized at 140 °C was observed in PBS (pH = 7.4; Dh = 791 nm, PD = 0.19), while the particles synthesized at 100 °C were stable for one week (Dh = 244 nm, PD = 0.2).
To further investigate colloidal stability of GdF3:Tb3+,Yb3+,Nd3+@P(DMA-AGME)-Ale nanoparticles, their hydrodynamic size and ζ-potential were measured at different ionic strengths of NaCl solutions and different pHs of PBS (Figure 3). No significant size and ζ-potential changes were observed in PBS. Slightly negative ζ-potential of the particles (−3 till −5 mV) in all series of PBS can be explained by suppression of particle charges by ionic strength of PBS. In the dependence of Dh of the particles on concentration of NaCl, the size slightly increased at concentration of 1 mol/L due to partial particle aggregation (Figure 3c). Let us note that no significant increase of hydrodynamic particle size was observed at biological concentration of NaCl (100–150 mM) [35]. Colloidal stability of the particles was also studied by the evolution of ζ-potential with increasing ionic strength (Figure 3d). However, the absolute value of the ζ-potential increased with increasing NaCl concentration probably due to partial particle aggregation as confirmed in the dependence of the hydrodynamic particle diameter on NaCl concentration (Figure 3c). The surface charge of nanoparticles in biological media is a crucial aspect for many potential applications. It can facilitate in vivo circulation of negatively charged particles in the body or support uptake of positively charged particles by the cells [36].
The morphology, size, and size distribution of P(DMA-AGME)-Ale-coated GdF3:Tb3+,Yb3+,Nd3+ and TbF3:Gd3+,Yb3+,Nd3+ nanoparticles prepared in EG were analyzed by TEM (Figure 4). The small crystalline nanoparticles with sizes <5 nm (high magnification TEM micrographs are shown in Figure S2) tended to form 51 nm and 59 nm aggregates, respectively (Figure 4a,d; Table 1) with a rather low dispersity (Ð ~1.15). The elemental analysis (TEM/EDX; Figure 4b,e) confirmed the expected elemental composition, including low concentration of ions in GdF3:Tb3+,Yb3+,Nd3+ and TbF3:Gd3+,Yb3+,Nd3+ particles; the strong peaks of C and Cu originated from the supporting carbon-coated copper grids, onto which the nanoparticles were deposited. The comparison of experimental selected-area electron diffraction (TEM/SAED) with theoretically calculated powder X-ray diffraction patterns (PXRD) confirmed that the crystalline structures corresponded to orthorhombic GdF3 and TbF3 modifications (Figure 4c,f). The positions of TEM/SAED diffractions corresponded precisely to the positions of theoretically calculated PXRD diffractions. However, the experimental TEM/SAED diffraction intensities were somewhat different from the calculated PXRD intensities. The reason is that PXRD patterns were calculated for the random orientation of the crystals, while our results suggested that both GdF3 and TbF3 formed thin flat nanoplatelets that tended to lay on the carbon film on their small facets oriented in such a way that their shortest unit cell parameter was parallel with the electron beam. This corresponded to the preferred orientation of the nanocrystals with zone axis [uvw] = [001]. According to Weiss zone law (WZL: hu + kv + lw = 0, where h, k, l are diffraction indexes and u, v, w are the indexes of the zone axis [37], the strongest diffractions should be of the type [hk0], i.e., their last diffraction index should be zero (because in our case the WZL takes a simple form: hu + kv + lw = h0 + k0 + l1 = l = 0). This was in perfect agreement with the TEM/SAED results, as for both GdF3 (Figure 4c) and TbF3 (Figure 4f), the hk0 SAED diffractions were stronger than corresponding PXRD diffractions, while the intensive hkl PXRD diffractions exhibited almost negligible intensity in the experimental SAED patterns.
FTIR spectroscopy and TGA characterized the P(DMA-AGME)-Ale-coated Gd(Tb)F3:Tb3+(Gd3+),Yb3+,Nd3+ nanoparticle surface (Figure S3). Successful modification of the nanoparticles was documented by the FTIR spectra, where characteristic P(DMA-AGME)-Ale peaks included absorption band at 1620 cm−1 ascribed to ν(C=O) stretching vibrations of the amide groups and peaks at 2925 and 2860 cm−1 were attributed to νas(CH3) asymmetric and νs(CH2) symmetric stretching vibrations (Figure S3a). Peak at 1745 cm−1 was ascribed to ν(C=O) stretching vibrations of the ester group of N-acryloylglycine methylester. According to TGA of P(DMA-AGME)-Ale-coated TbF3:Gd3+,Yb3+,Nd3+ and GdF3:Tb3+,Yb3+,Nd3+ particles, amount of P(DMA-AGME)-Ale polymer on the surface was 8.3 and 5.3 wt.%, respectively (Figure S3b). Weight losses (~6.5 wt.%) observed upon heating from RT to ~300 °C were ascribed to evaporation of water and EG.

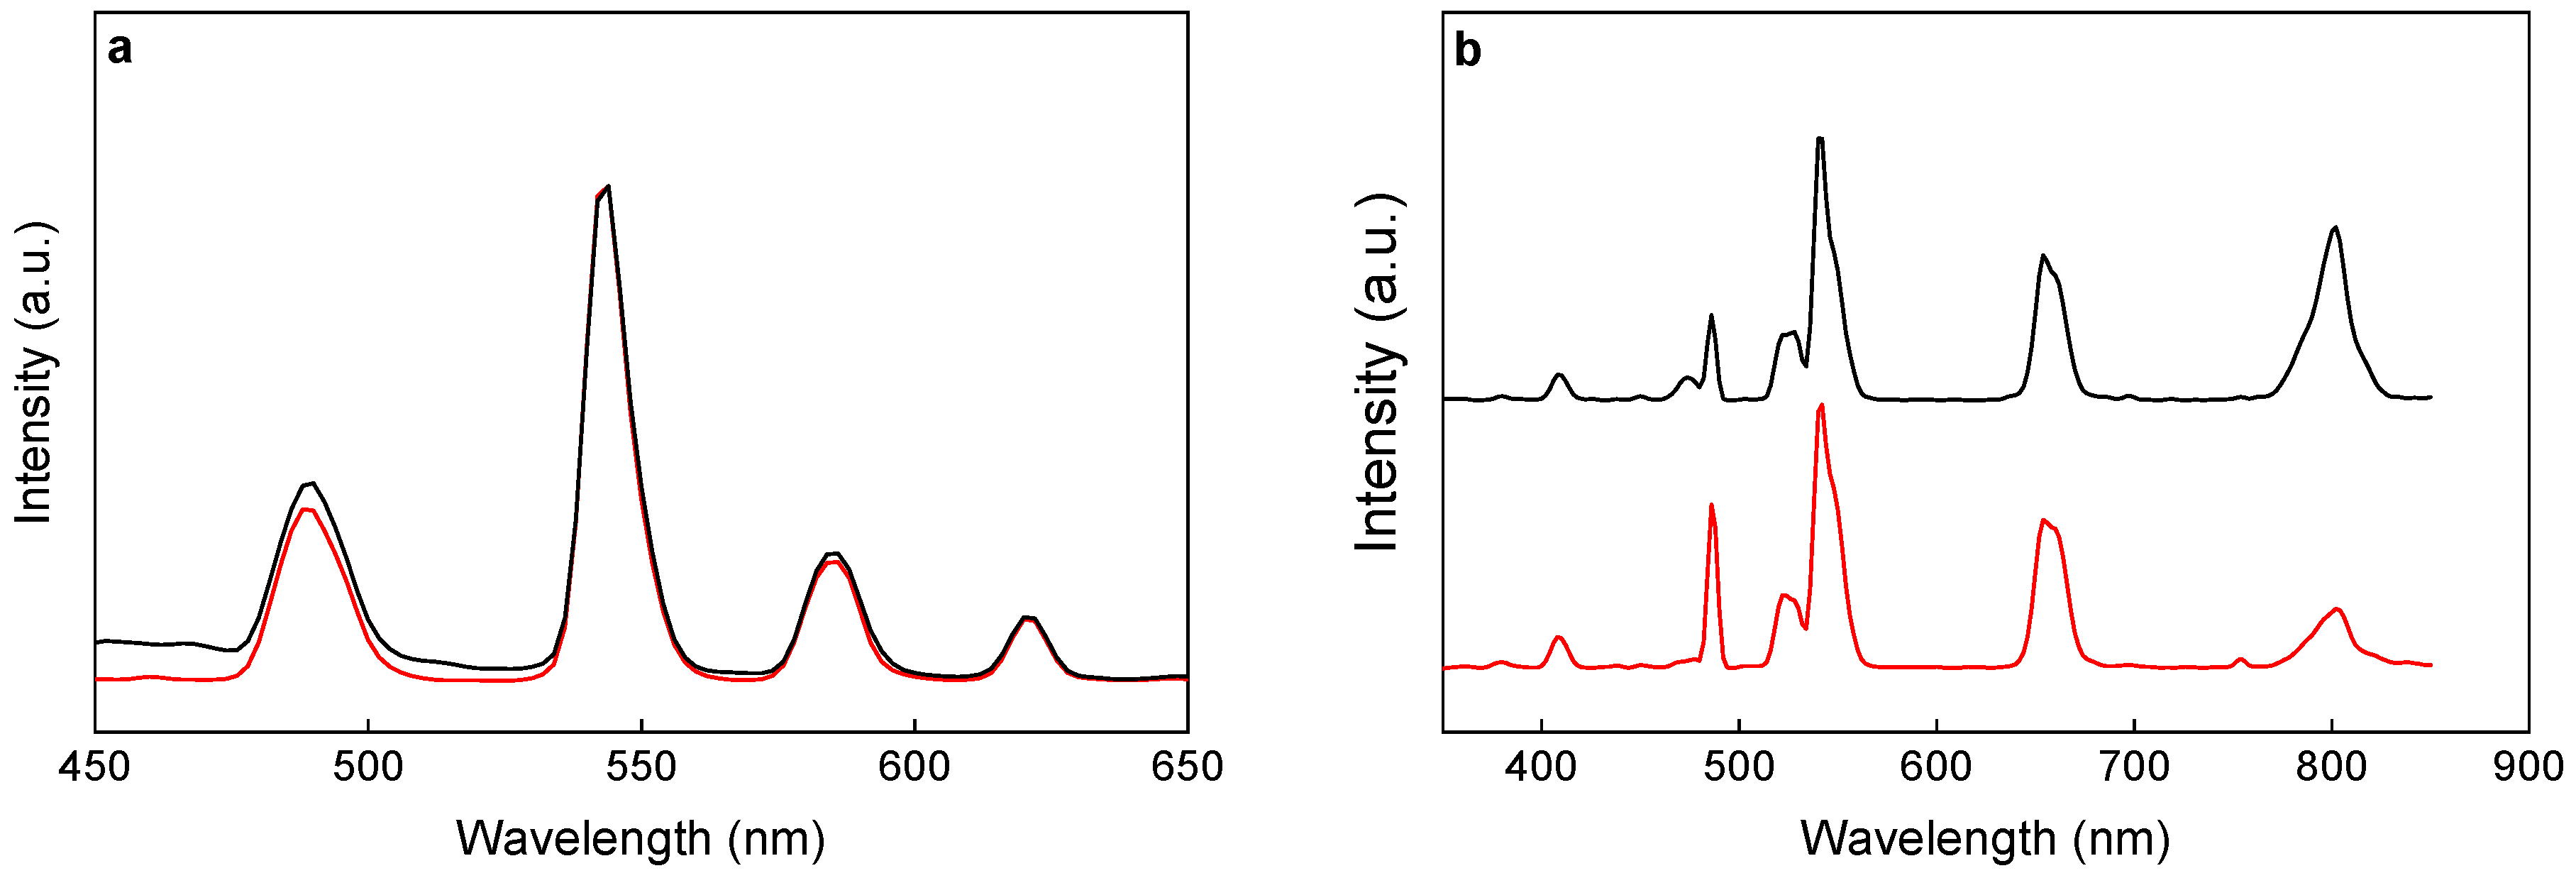
3.2. Down- and Upconversion Luminescence of Gd(Tb)F3:Tb3+(Gd3+),Yb3+,Nd3+@P(DMA-AGME)-Ale Nanoparticles

Luminescence properties of P(DMA-AGME)-Ale-coated Gd(Tb)F3:Tb3+(Gd3+),Yb3+,Nd3+ nanoparticles were determined by the excitation and emission spectra (Figure 5, Figures S3 and S4). The excitation spectra of Tb3+- and Gd3+-containing nanoparticles exhibited the downconversion emission of Tb3+ due to 5D47F5 transition at 544 nm (Figure S4a). The excitation peaks at 284 (5I6), 302 (5H6), 318 (5D0), 340 (5G2), 350 (5D2), 368 (5G6), 378 (5D3), and 484 (5D4) nm originated from the transitions of 7F6 ground state to different excited states of Tb3+ [38]. The excitation peak at 272 nm was ascribed to 8S7/26I7/2 transition of Gd3+ [8]. Upon excitation at 272 (for GdF3:Tb3+) and 350 nm (for TbF3:Gd3+), the emission spectrum of the nanoparticles displayed blue, green, and red bands attributed to 5D47F6 (490 nm), 5D47F5 (544 nm), 5D47F4 (586 nm), and 5D47F3 (620 nm) transitions of the characteristic Tb3+ emission (Figure 5a). It is important that the TbF3-based nanoparticles can be excited by almost all wavelengths in the range of 250–400 nm (Figure S4b).
Unique spectral properties of Tb3+-doped UC nanocrystals can offer several simultaneous emissions compared to one emission of conventional biolabels, since the proportion of blue, green, and red emissions radiating from the same 5D4 state is unchanged for all pump powers. Any spectral differences induced by living tissues can be used to probe their scattering and absorption coefficients [39]. Both Tb3+ and Nd3+ up-conversion emission was observed under 980 nm excitation (Figure 5b). The upconversion emission spectra of the nanoparticles displayed green, yellow, and bands attributed to 4G9/24I9/2 (520–530 nm), 4G9/24I13/2/4G7/24I11/2 (555 nm), and 4F5/24I9/2 (790–820 nm) transitions of the characteristic Nd3+ emissions [20] and bands corresponding to 5D37F5 (408 nm), 5D47F6 (488 nm) and 5D47F5 (542 nm) transitions of Tb3+ [40]. The upconversion spectra of P(DMA-AGME)-Ale-coated GdF3:Tb3+,Yb3+,Nd3+ and TbF3:Gd3+,Yb3+,Nd3+ nanoparticles synthesized under the same conditions but with different concentrations of Tb3+ ions (Figure S5) showed that cooperative emission from a pair of excited Yb3+ ions strongly depended on Tb3+ content, which agreed with literature data [41]. The emission from Tb3+, caused by cooperative energy transfer (CET) from Yb3+, was clearly observed in each sample. The peak intensities at 488 nm increased with increasing Tb3+ concentration indicating that upconversion luminescence of the Yb3+–Yb3+ pair was involved in CET. Enhanced Tb3+ doping led to a decrease of CET efficiency of Tb3+ to Yb3+ ions, as the average distance decreased, which lowered intensity of Tb3+ emissions. As a result, the emission band at 488 nm originated not directly from the Yb3+–Yb3+ pair, but from Tb3+ at low doping concentration. Furthermore, the emission of Nd3+ at 796 nm and dominant green emission of Tb3+ at 542 nm were detected for both P(DMA-AGME)-Ale-coated GdF3:Tb3+,Yb3+,Nd3+ (10% Tb) and TbF3:Gd3+,Yb3+,Nd3+ nanoparticles (70% Tb). In the spectra of the other particles (0, 20, 40, 50 and 90% Tb), the emission intensity of Tb3+ and Nd3+ was rather low.

3.3. Cytotoxicity of Gd(Tb)F3:Tb3+(Gd3+),Yb3+,Nd3+@P(DMA-AGME)-Ale Nanoparticles

As the main goal in the design of new nanoparticles is to use them as a multimodal imaging agent in various bioapplications, it is crucial to assess their biocompatibility. The PrestoBlue™ viability tests after incubation of the HeLa and HF cells with P(DMA-AGME)-Ale-coated both GdF3:Tb3+,Yb3+,Nd3+ and TbF3:Gd3+,Yb3+,Nd3+ nanoparticles showed similar trends (Figure S6). The nanoparticles (1 mg/mL) were not cytotoxic for HF cells, but the higher concentration (2 mg/mL) significantly decreased viability to 80%. The viability of HeLa cells slightly, but nonsignificantly, decreased at particle concentrations of 0.5 and 1 mg/mL and it decreased significantly (to 40%) at 2 mg/mL. The TbF3:Gd3+,Yb3+,Nd3+ nanoparticles were slightly more cytotoxic for HeLa cells than the GdF3:Tb3+,Yb3+,Nd3+ ones at the highest concentration. However, the viability HeLa cells in the presence of nanoparticles at the highest concentration (2 mg/mL) was lower (~40%) than that of HF cells (80%). The difference in viability between the cells can be induced by at least twice faster proliferation rate of HeLa cells compared to HF cells, which are primary slowly proliferating cells. The faster growing HeLa cells are thus more sensitive to the cytotoxic effect of the nanoparticles. Strategies to reduce unwanted side-effects of the particles at high concentration are in progress, including their encapsulation by another polymer, grafting of lanthanide chelates on the particles, ligand exchange, etc.

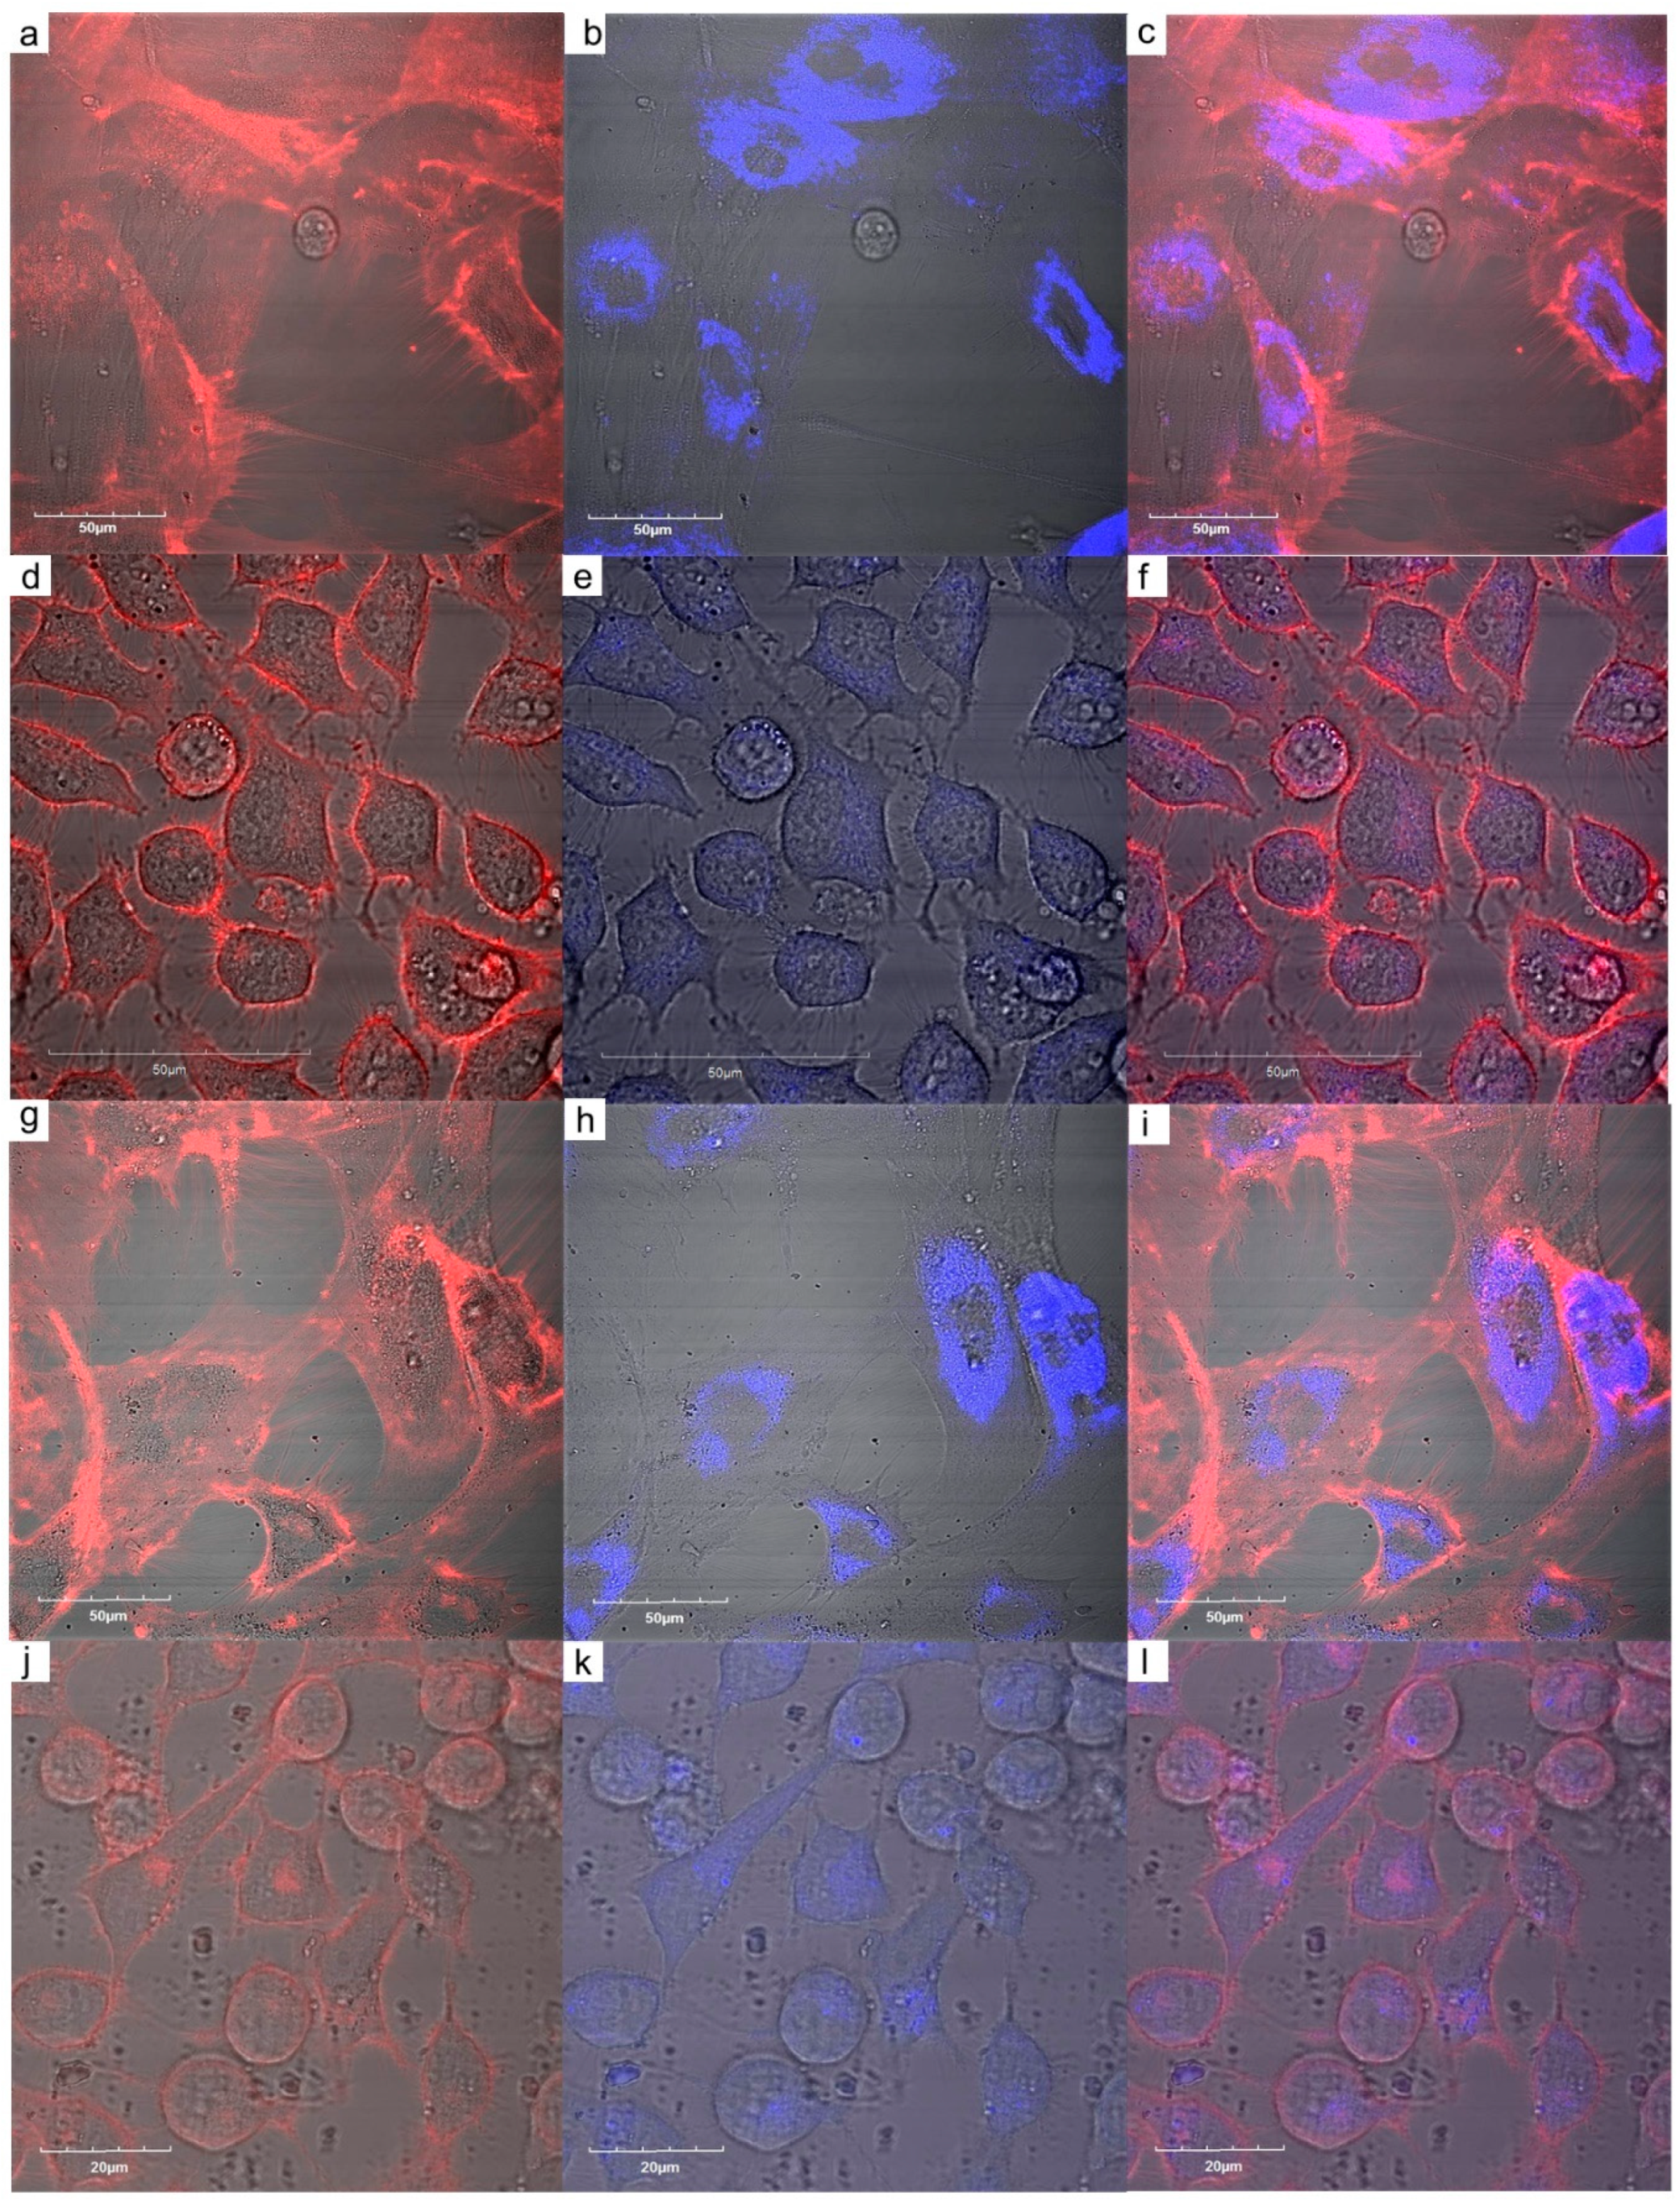
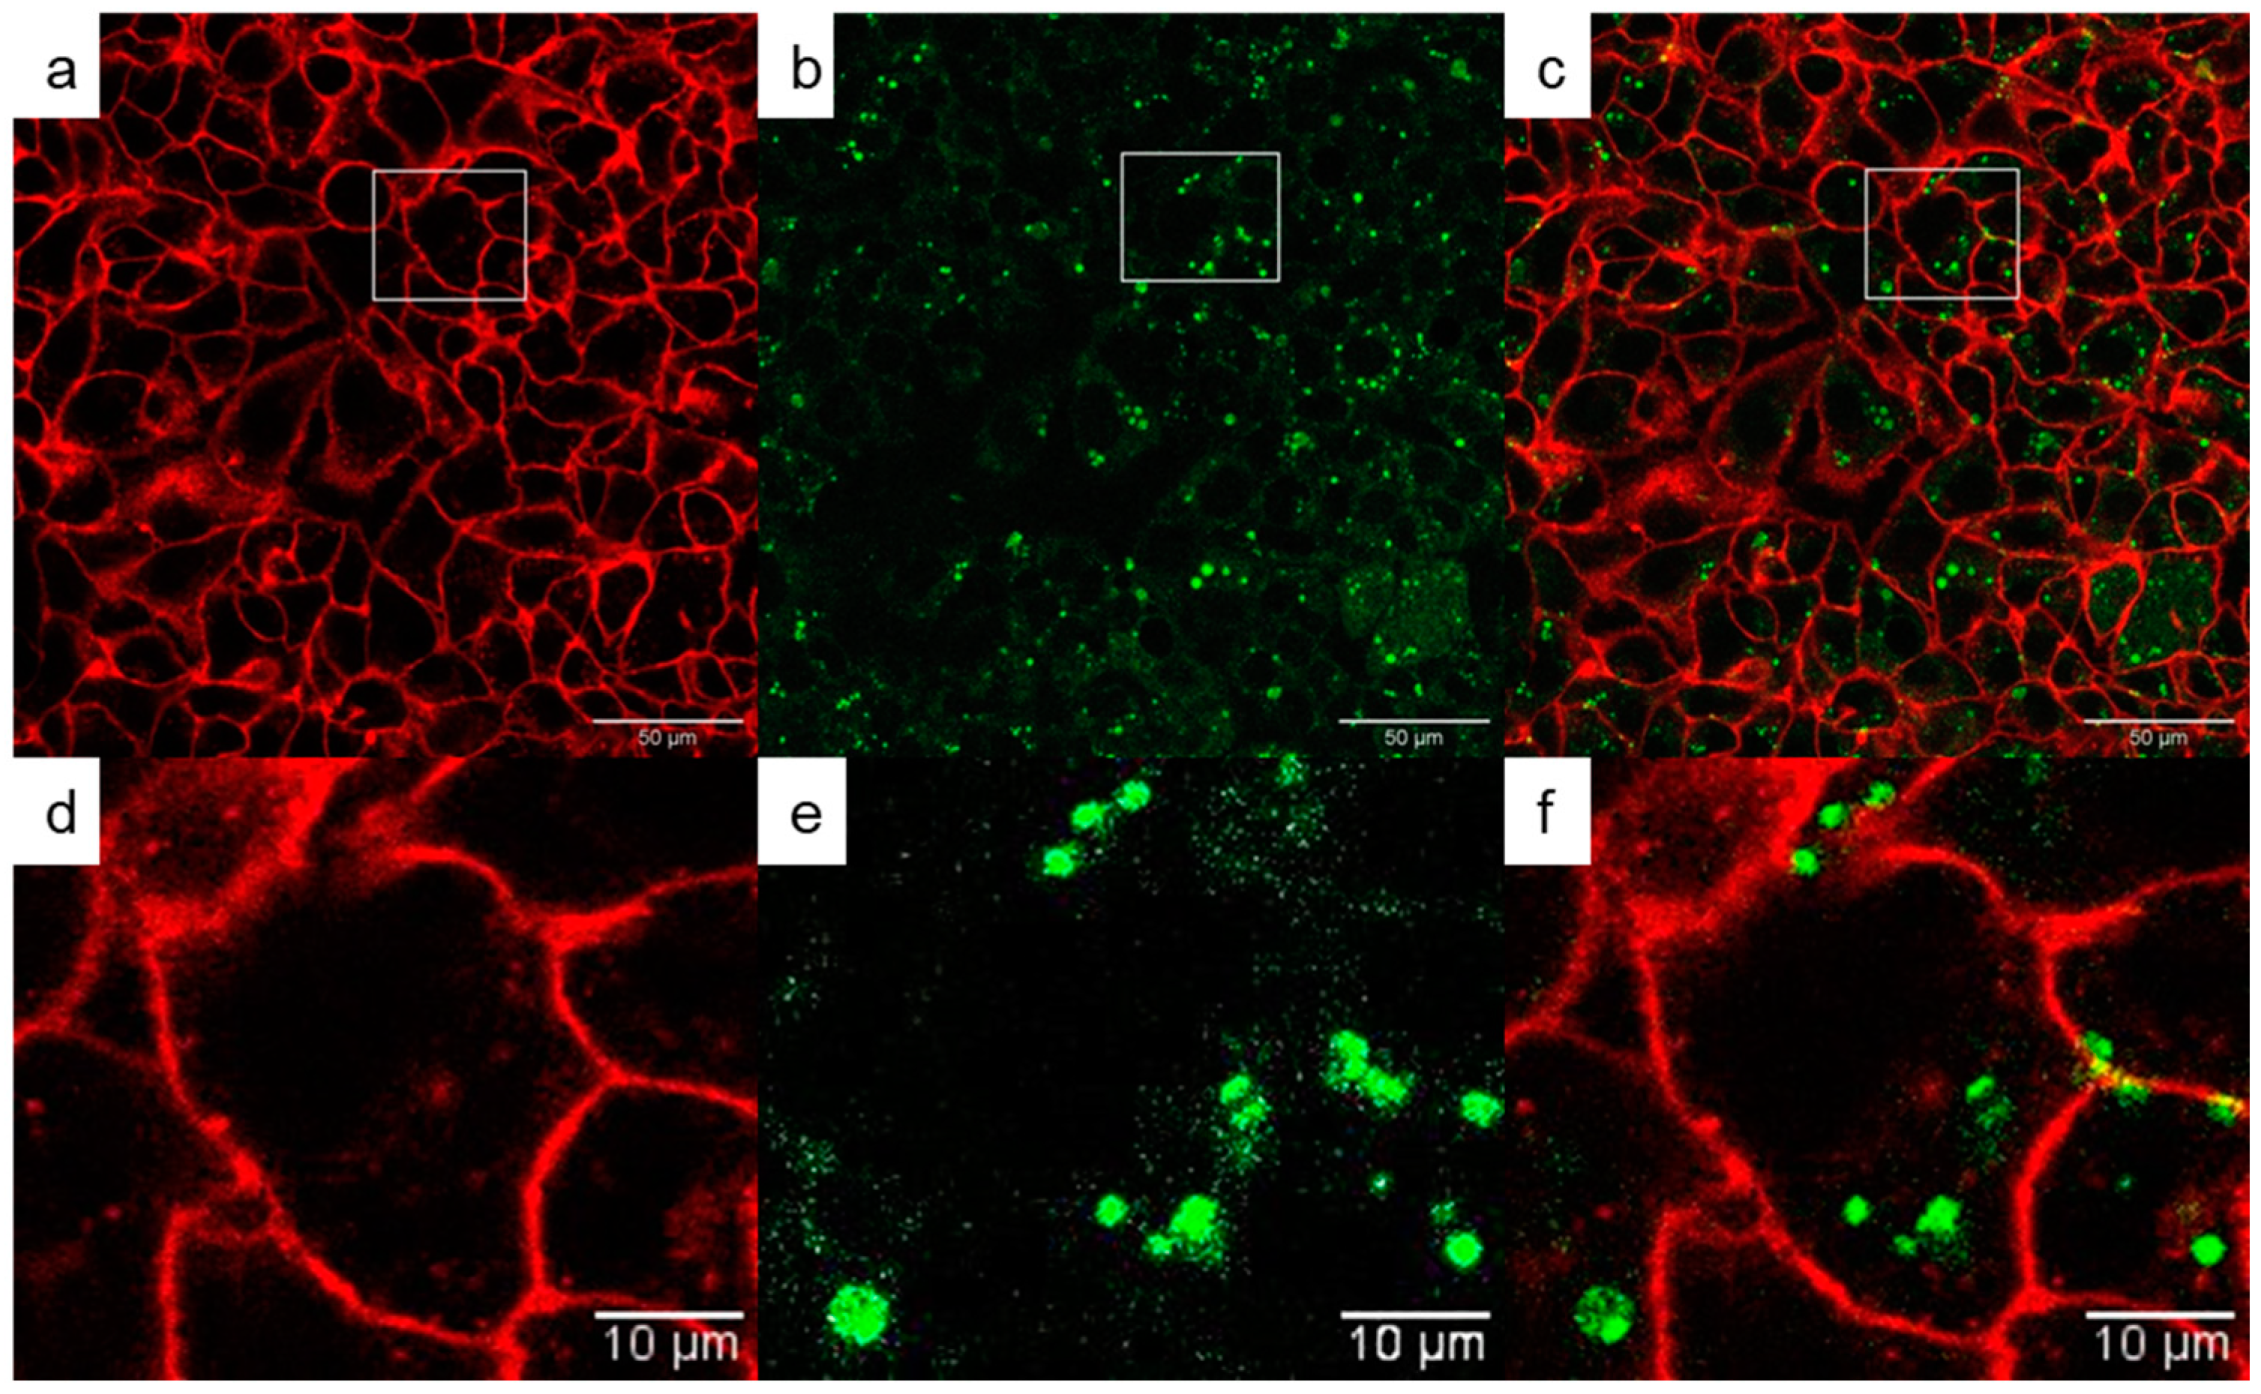
3.4. Intracellular Uptake of Gd(Tb)F3:Tb3+(Gd3+),Yb3+,Nd3+@P(DMA-AGME)-Ale Nanoparticles Determined by Laser Scanning Confocal Microscopy

Hela and HF cells were incubated for 24 h with Gd(Tb)F3:Tb3+(Gd3+),Yb3+,Nd3+@P(DMA-AGME)-Ale nanoparticles that were visualized intracellularly (Figure 6). There was a strong difference in intensity of particle signal between HeLa (Figure 6d–f,j–l) and HF cells (Figure 6a–c,g–i) in confocal micrographs, which could be caused by the different uptake of primary and cancer cells. The other fact that can also play a role consists in different accumulation of the nanoparticles in HF and HeLa cells. As already stated above, the proliferation rate of HF cells is significantly slower than that of HeLa cells and because we used the same particle concentration for treatment of both cell types, in the case of slowly growing HF cells, their number was lesser compared to smaller HeLa cells. For the sake of comparison, laser scanning confocal micrographs of HF and HeLa cells before and after treatment with (Gd)TbF3:Tb3+(Gd3+),Yb3+,Nd3+@P(DMA-AGME)-Ale nanoparticles were shown in Figure S7.
In investigation of biodistribution of the particles within the cells, their further two types were used, HepG2 (cancer cells of human liver tumor) and INS-1E cells from rat insulinoma, which is a tumor of the pancreas derived from beta cells secreting insulin. In vitro labeling of living HepG2 and INS cells after 24 h of incubation with upconverting Gd(Tb)F3:Tb3+(Gd3+),Yb3+,Nd3+@P(DMA-AGME)-Ale nanoparticles was demonstrated by confocal microscopy at 808 nm pulsed excitation with 140 fs (Figure 7 and Figure S8); cell membranes were stained with CellMask™ deep red. The particles were engulfed by the cells already after 2 h of incubation; however, 24-h incubation was selected in further experiments as it ensured complete internalization. Comparing of the emission spectra of neat nanoparticles with those in cells (Figure S9) showed the nanoparticles localized in the HepG2 and INS cells as demonstrated within the xy confocal plane. The particles were distributed in the cell cytosol.

3.5. MR Relaxometry of Gd(Tb)F3:Tb3+(Gd3+),Yb3+,Nd3+@P(DMA-AGME)-Ale Nanoparticles

Nanoparticle relaxivities of aqueous Gd(Tb)F3:Tb3+(Gd3+),Yb3+,Nd3+@P(DMA-AGME)-Ale nanoparticle dispersions were summarized in the Table 2. While the whole crystal structure contributed to high T2 relaxation, T1 relaxation depended predominantly on Gd3+ content in the nanoparticles. If Gd3+ was absent, the r1 relaxivity was very low, as other lanthanide ions (Nd3+, Tb3+, Yb3+) had negligible effect on T1 relaxation time compared to Gd3+ (data not shown). Nevertheless, even a small amount of Gd3+ in the crystal significantly increased r1 relaxivity. Interestingly, particles without Gd3+ had a high r2/r1 ratio due to very low r1, while their r2 remained comparable to that of Gd-containing particles. The MR relaxivity was comparable to that of commercial contrast agents based on gadolinium chelates, such as Gd-DTPA (r1 = 3.7 mM−1 s−1 and r2 = 5.8 mM−1 s−1). Somewhat smaller relaxivity of the Gd(Tb)F3:Tb3+(Gd3+),Yb3+,Nd3+@P(DMA-AGME)-Ale nanoparticles (per Ln3+ ions) can be explained by lower accessibility of inner ions, which lowered water exchange as a main contributor to r1. Interestingly, the particles with low Gd content revealed higher r1 relaxivity than expected with respect to Gd concentration. Doping of Yb3+, Nd3+, and Tb3+ ions into GdF3 nanoparticles contributed to relaxivity mechanisms and provided facile strategy for synthesis of new T1/T2 dual-weighted contrast Ln3+-based agents, which agreed with literature [22].

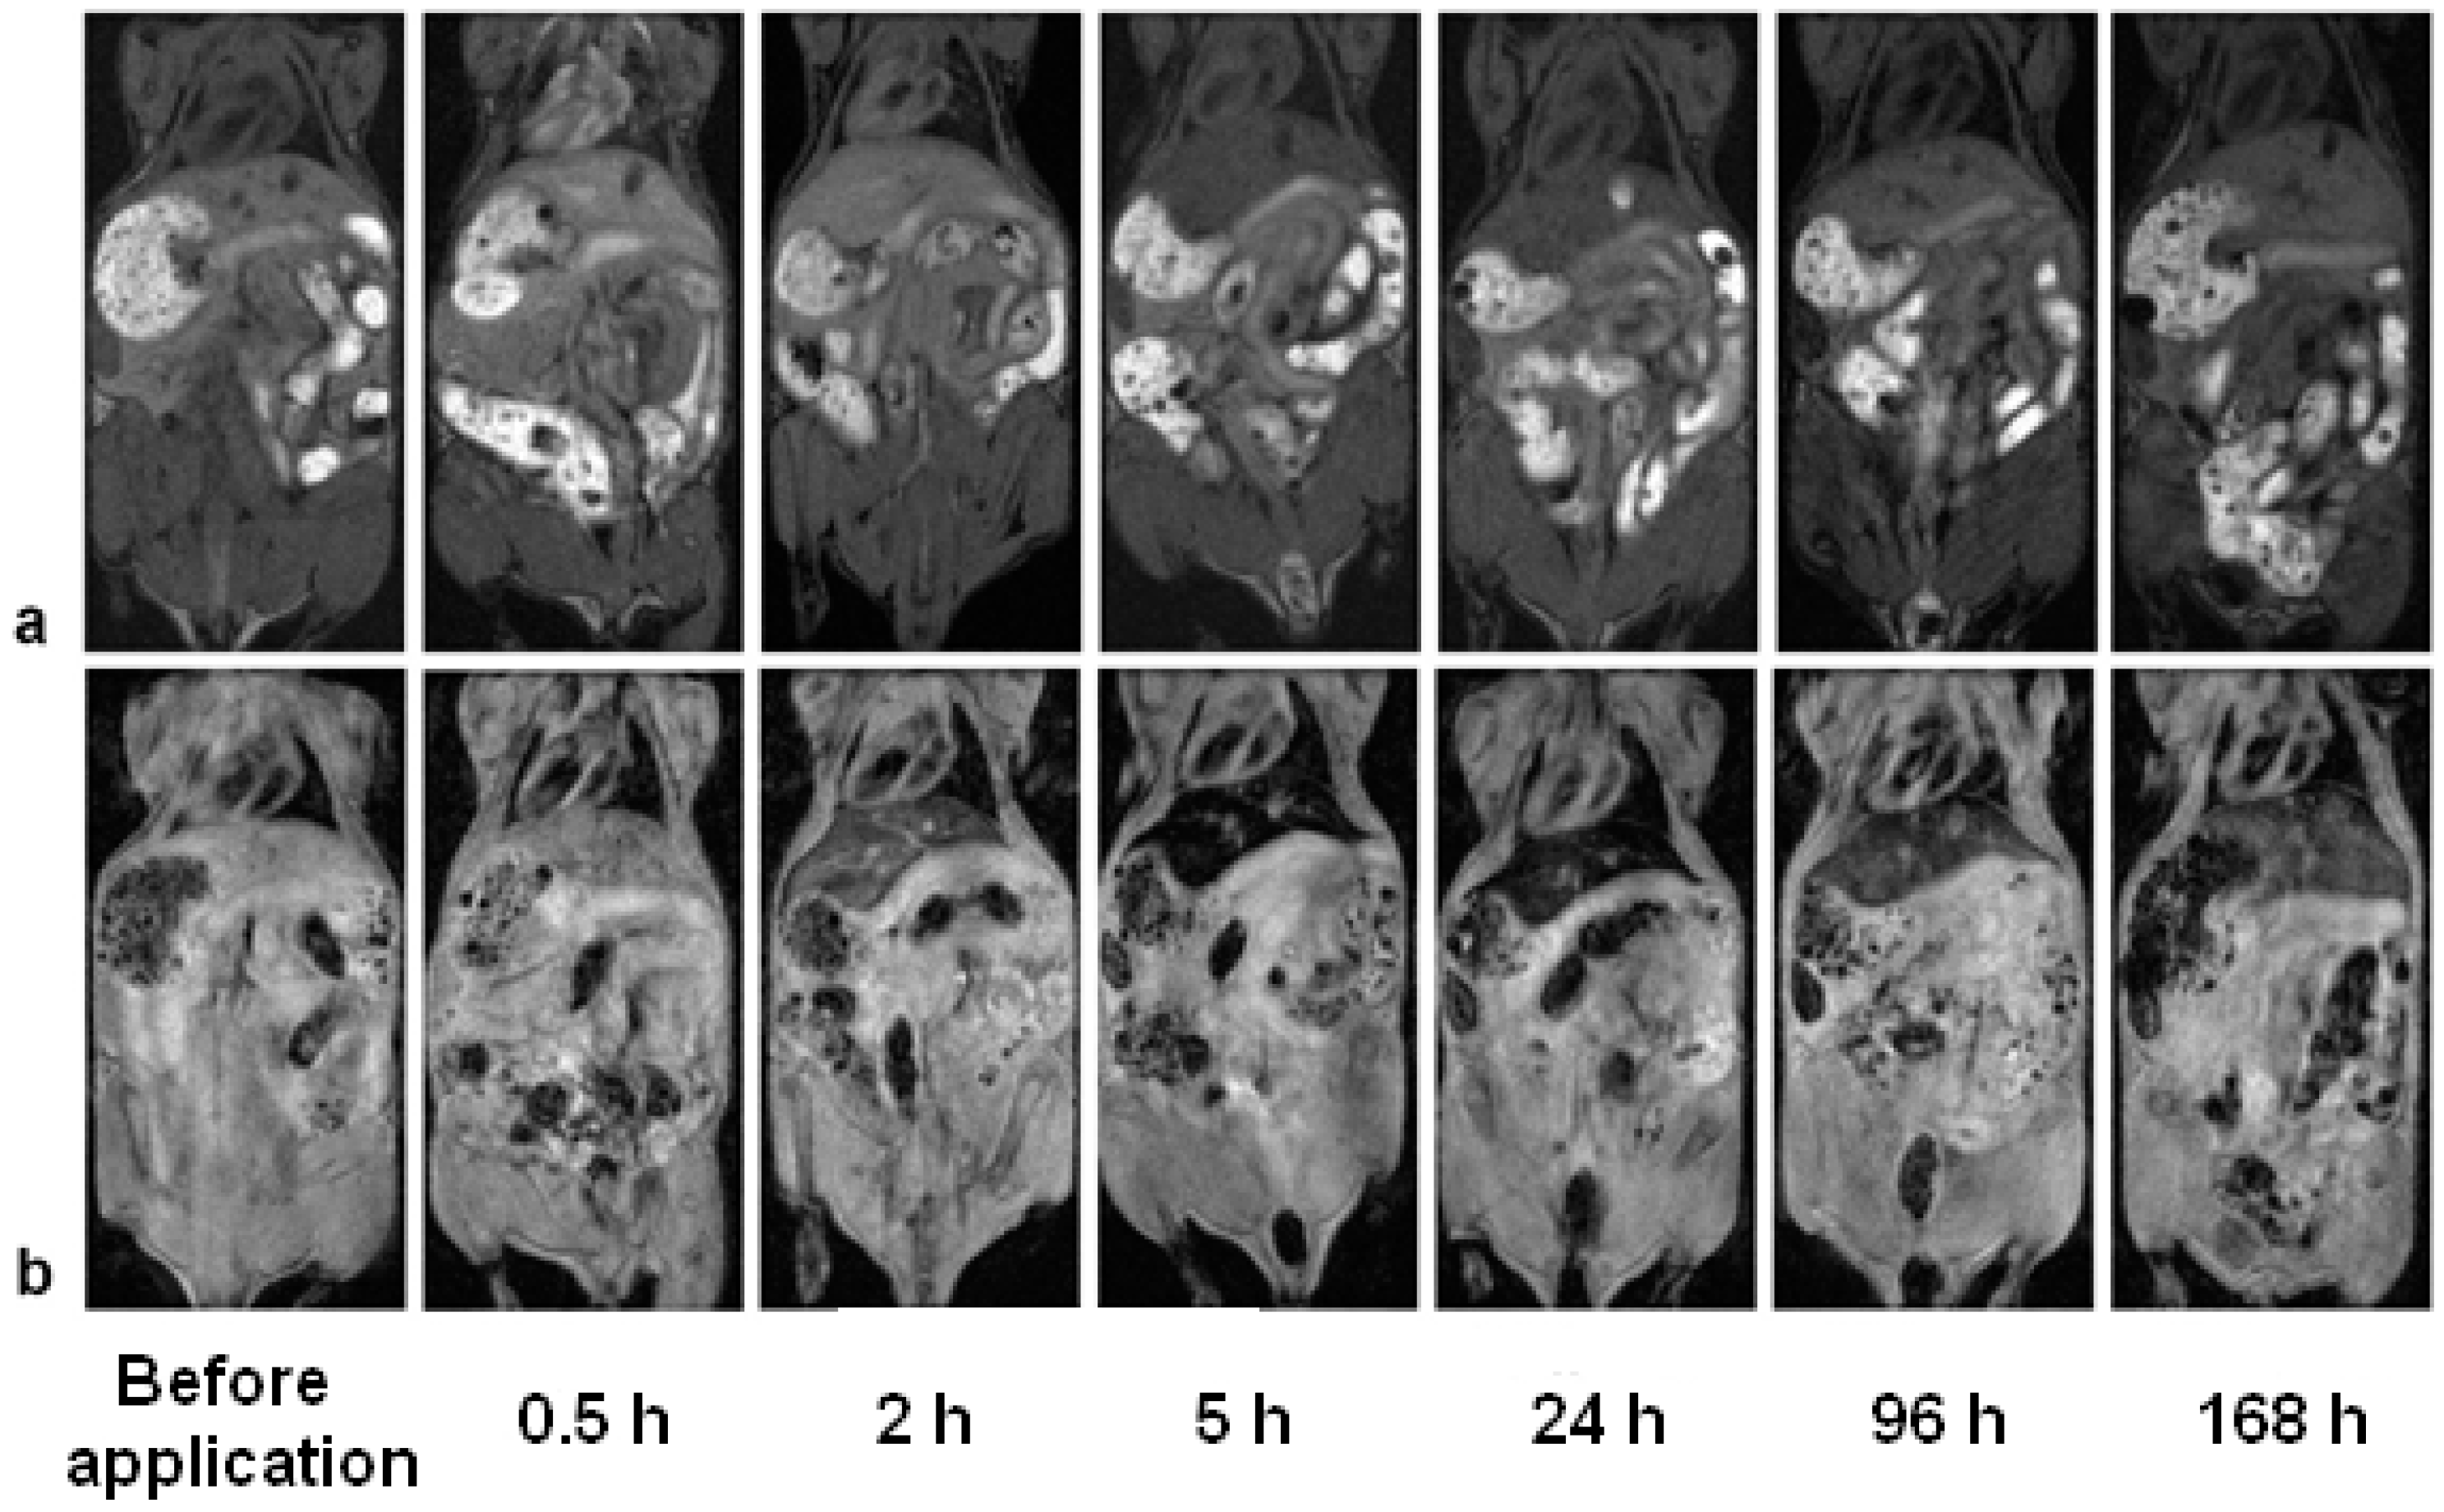
3.6. In Vivo MR Imaging of Gd(Tb)F3:Tb3+(Gd3+),Yb3+,Nd3+@P(DMA-AGME)-Ale Nanoparticles

Gd(Tb)F3:Tb3+(Gd3+),Yb3+,Nd3+@P(DMA-AGME)-Ale nanoparticles were investigated in vivo as a T1- and T2-weighted MRI contrast agent. When TbF3:Gd3+,Yb3+,Nd3+@P(DMA-AGME)-Ale nanoparticles (with low r1 and high r2 relaxivity) were administered into the blood stream of experimental mice, a small increase of the signal was immediately visible on T1-weighted images in the liver (Figure 8a). Signal darkening after 5 h might be explained by a weak T2* effect, which probably outweighed the T1 effect, as the nanoparticles slowly accumulated (and possibly aggregated) in the liver. This hypothesis was supported by T2*-weighted images (Figure 8b). Accumulation of the nanoparticles was manifested by a strong hypointense signal in the liver and spleen with a maximum between 5 and 24 h after the administration. Then, slow recovery of the signal was observed, which corresponded to a gradual excretion of the nanoparticles from the organism.
Gd3+ ions in the nanoparticles enhanced the T1-weighted MRI of mice. Application of GdF3:Tb3+,Yb3+,Nd3+@P(DMA-AGME)-Ale nanoparticles with high r1 and r2 relaxivities caused a hyperintense signal on T1-weighted images in the liver, spleen (Figure 9a), and kidneys immediately after the administration. T2*-weighted images (Figure 9b) revealed a strong hypointense signal in the liver and spleen, again delayed by several hours. The T2* signal in the kidneys was not significantly affected.
Relative signal evolution after administration of Gd(Tb)F3:Tb3+(Gd3+),Yb3+,Nd3+@P(DMA-AGME)-Ale nanoparticles in the mice was shown in Figure S10. Small changes were observed only in T1 signal after TbF3:Gd3+,Yb3+,Nd3+@P(DMA-AGME)-Ale administration (Figure S10a), while application of GdF3:Tb3+,Yb3+,Nd3+@P(DMA-AGME)-Ale particles caused a substantial T1 signal increase in the liver, spleen, and kidneys shortly after the administration, which was followed by a drop back to original values within 5 h (Figure S10c). Relative T2* signal dropped in the liver and spleen within 5 h after application of both TbF3:Gd3+,Yb3+,Nd3+ (Figure S10b) and GdF3:Tb3+,Yb3+,Nd3+ nanoparticles (Figure S10d). Recovery to normal values started 24 h post injection and was very slow, the signal was lowered even after one week. No substantial change of T2* was observed in the kidneys.
The observed time delay between the maximum of the hyperintense signal on T1-weighted images and minimum of the hypointense signal on T2*-weighted images might reflect redistribution of the nanoparticles in the organism (Figure 8 and Figure 9 and Figure S10). We hypothesize that the initial hyperintense signal on T1-weighted images corresponded rather to nanoparticle circulation in the blood vessels, while late onset of hypointensities on T2*-weighted images reflected accumulation of the nanoparticles in the liver and spleen tissue, and possibly also particle aggregation, leading to a stronger T2* effect.

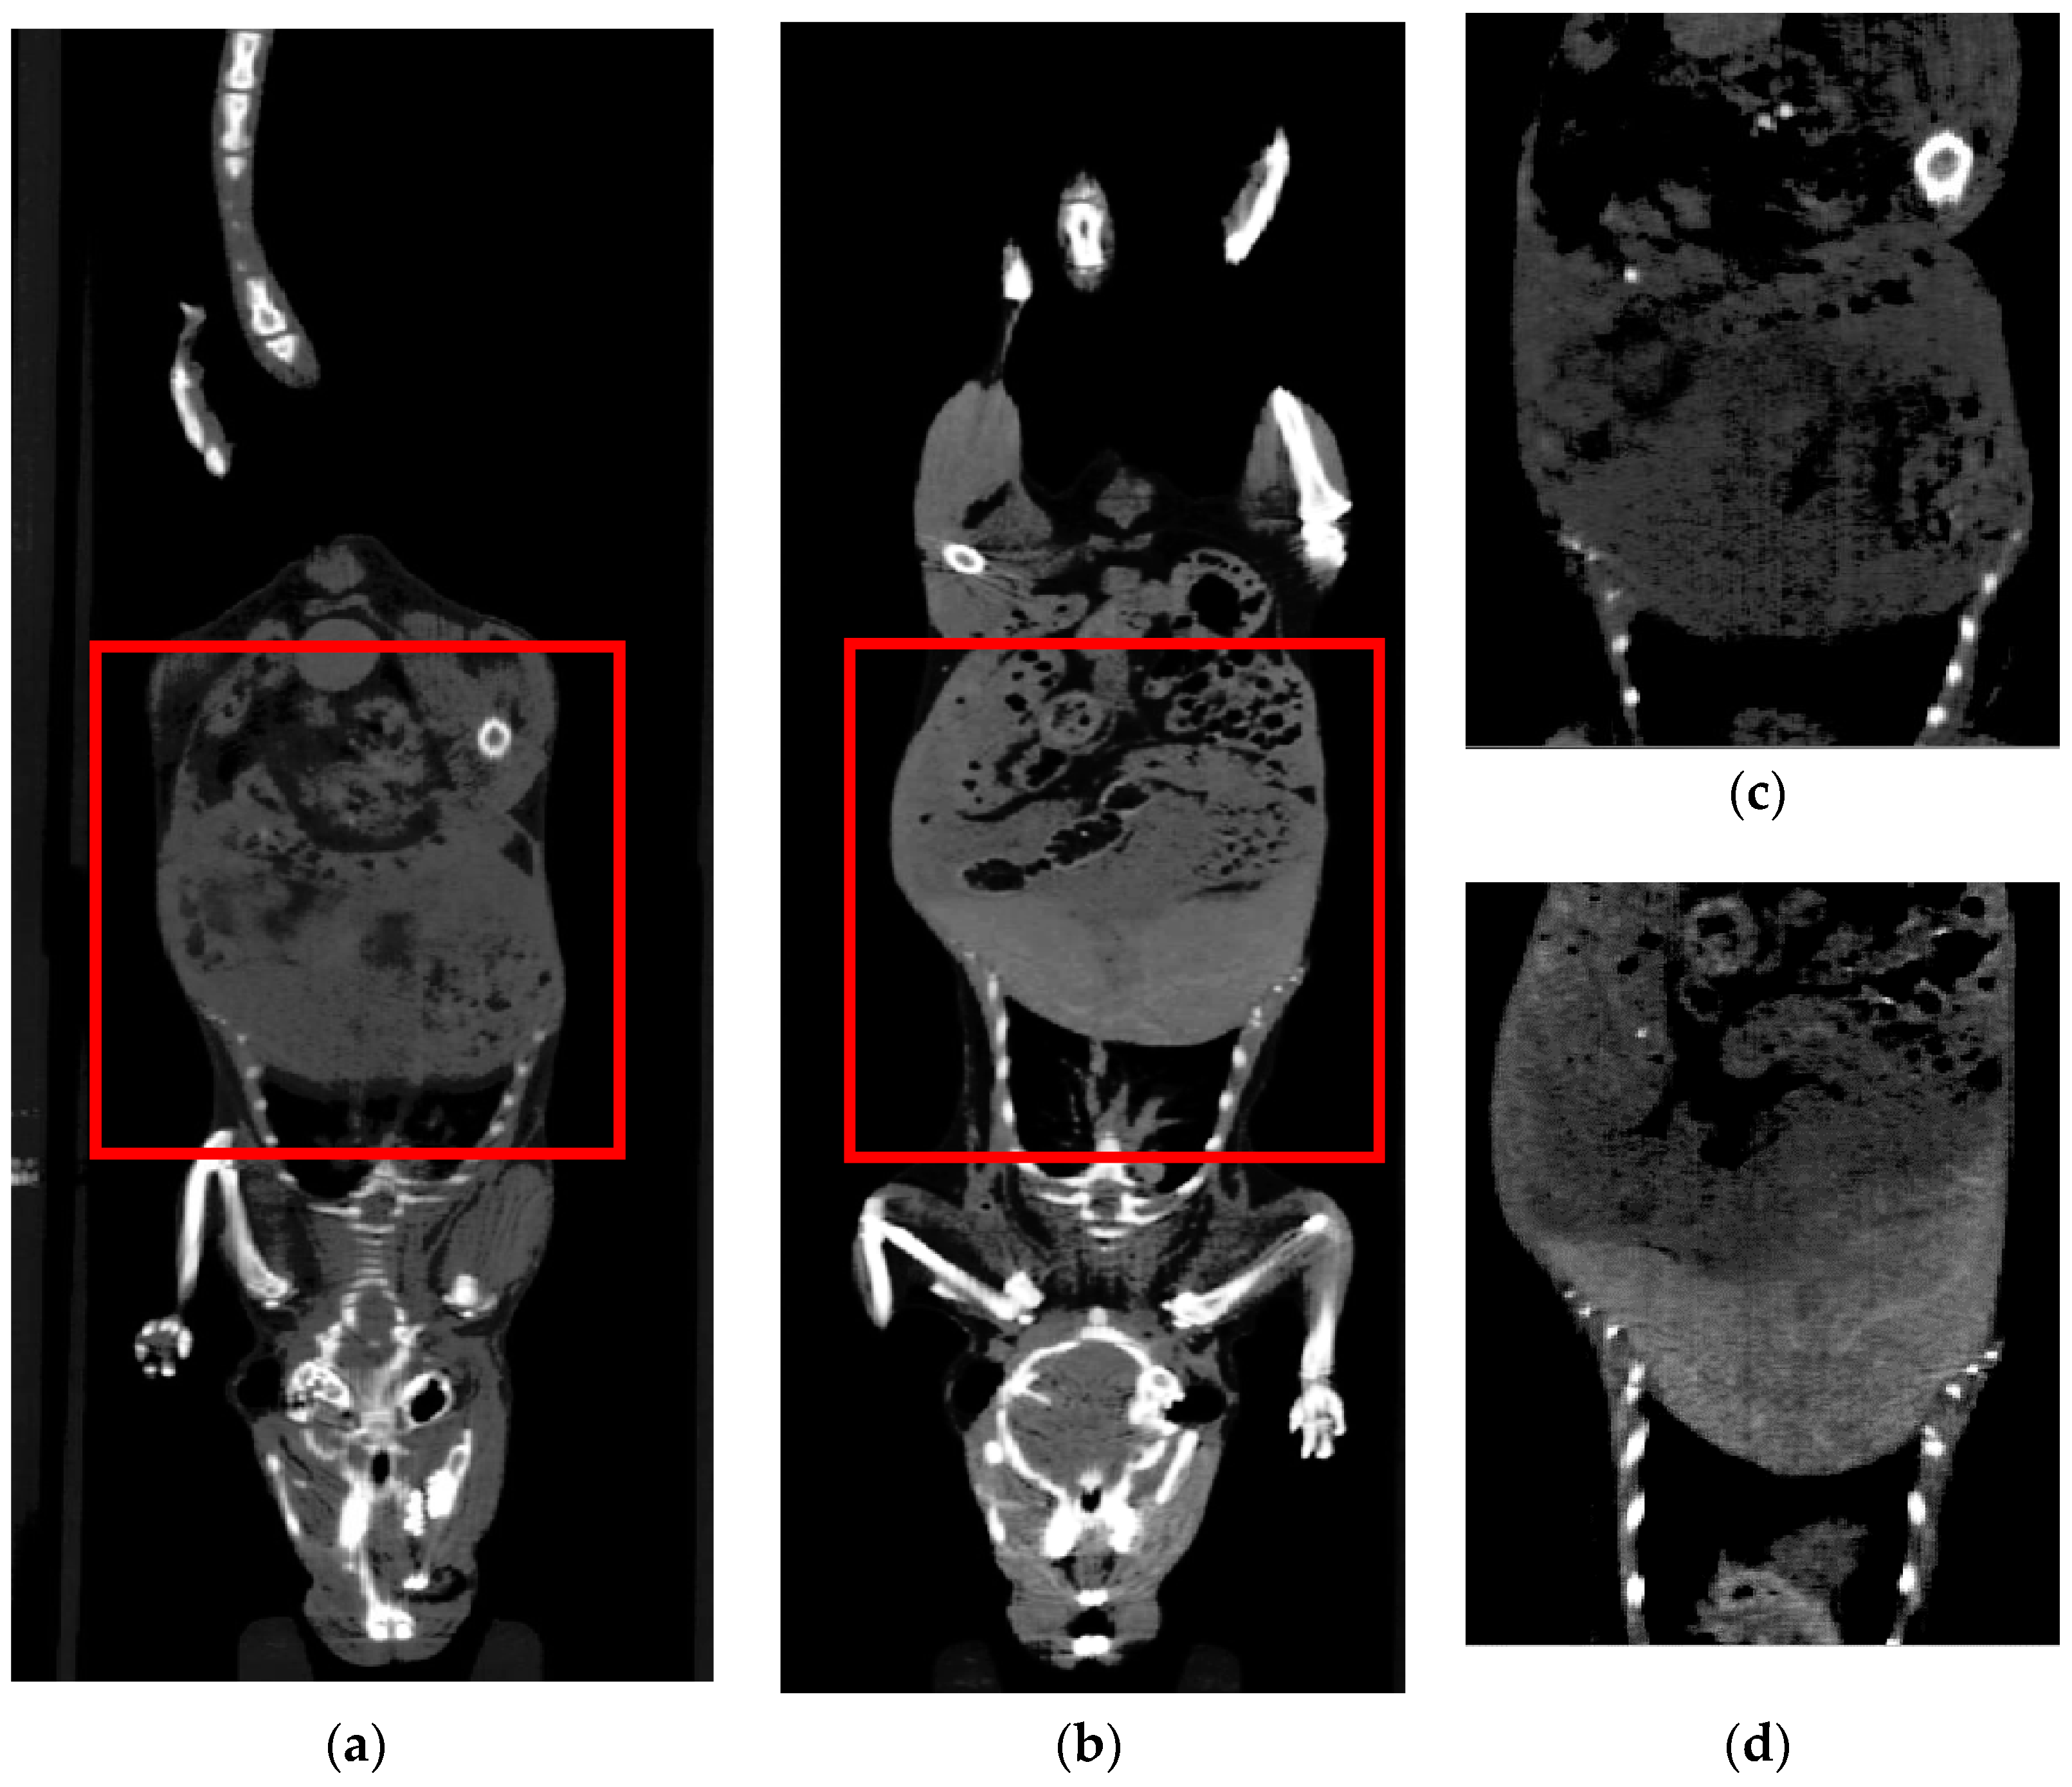
3.7. In Vitro and In Vivo CT Investigation and Imaging of Gd(Tb)F3:Tb3+(Gd3+),Yb3+,Nd3+@P(DMA-AGME)-Ale Nanoparticles

Capability of Gd(Tb)F3:Tb3+(Gd3+),Yb3+,Nd3+@P(DMA-AGME)-Ale nanoparticles as a CT contrast agent was evaluated at different concentrations and constant energy of 45 keV (Figure S11). Enhanced signals of the CT images were observed with the increasing concentration of the particles. While the CT value of water amounted to 3 Hounsfield units (HU), that of the particles increased linearly with their concentrations (Figure S11). Undoped GdF3 nanoparticles and Nd3+- or Yb3+-doped GdF3 showed a weaker signal, while combination of Tb3+, Gd3+, Nd3+, and Yb3+ ions in one particle enhanced the signals. Compared to clinically used Iohexol CT contrast agent dispersed in water at different concentrations, Gd(Tb)F3:Tb3+(Gd3+),Yb3+,Nd3+@P(DMA-AGME)-Ale nanoparticles showed higher X-ray attenuation at the same concentrations due to a higher K-edge energy. In the dependence of CT values on the particle concentration, slopes of the P(DMA-AGME)-Ale-coated TbF3:Gd3+,Yb3+,Nd3+ and GdF3:Tb3+,Yb3+,Nd3+ nanoparticles were 9.6 and 8.5, respectively, which was more than for clinical Iohexol (4.8). Compared to another commercial agent Iodine, X-ray attenuation of Tb- or Gd-based fluorides was quite similar to those published previously [42,43]. Our lanthanide nanoparticles thus show a great promise as a novel CT contrast agent that is expected to have a superior performance in clinical practice.
Nanoparticles with high atomic number of elements can absorb the X-rays to distinguish organs and bones in the CT diagnostics. For in vivo CT imaging, mice were scanned before and after the injection of GdF3:Tb3+,Yb3+,Nd3+@P(DMA-AGME)-Ale nanoparticles with the best X-ray attenuation value. To investigate in vivo applicability of the GdF3:Tb3+,Yb3+,Nd3+@P(DMA-AGME)-Ale nanoparticles (3 mg/day) as a long-term contrast agent in CT imaging, they were twice retro-orbitally administered in mice. CT images of pre-injected mice (Figure 10a,c) and mice after two particle injections (Figure 10b,d) were compared in coronal projection slices, displaying an enhanced CT signal in the liver and kidneys after second injection of the particles (i.e., 48 h after beginning of the experiment). CT values for the liver and kidneys increased to 152 and 143 HU from original 102 and 119 HU, respectively (Figure S12), suggesting that the GdF3:Tb3+,Yb3+,Nd3+@P(DMA-AGME)-Ale nanoparticles are useful as a long-term CT contrast imaging agent.

3.8. In Vivo Optical Imaging of GdF3:Tb3+,Yb3+,Nd3+@P(DMA-AGME)-Ale-Cy7 Nanoparticles

The GdF3:Tb3+,Yb3+,Nd3+@P(DMA-AGME)-Ale nanoparticles were conjugated with the fluorescent dye, sulfocyanine7-Ale (Cy7-Ale), to visualize their in vivo accumulation in the mice body using an Xtreme imaging system. After the conjugation, ξ-potential of the particles decreased from 2 to −5 mV and the hydrodynamic diameter increased from 81 nm (PD = 0.02) to 99 nm (PD = 0.19). The typical fluorescence of Cy7-modified Gd(Tb)F3:Tb3+(Gd3+),Yb3+,Nd3+@P(DMA-AGME)-Ale nanoparticles was observed under excitation and emission at 750 and 780 nm, respectively (Figure S13). In vivo optical imaging of mice after administration of the GdF3:Tb3+,Yb3+,Nd3+@P(DMA-AGME)-Ale-Cy7 nanoparticles revealed their circulation in the blood, and in particular, slow accumulation in the liver and spleen (Figure 11). The signal in the liver and spleen increased mainly within first 24 h. The nanoparticles were then slowly excreted as manifested by decreasing fluorescence, especially 96 h after administration of the particles. Finally, the mice were sacrificed immediately after the last in vivo scanning; fluorescence imaging revealed presence of the nanoparticles in selected excised mouse organs, mainly in the liver and spleen (Figure S14). It should be noted that Cy7-Ale-conjugated GdF3:Tb3+,Yb3+,Nd3+@P(DMA-AGME)-Ale nanoparticles appeared to be chemically stable in vivo, as the dye did not desorb from them and was not found in urine, when mouse was monitored 2 h after retroorbital administration.

4. Conclusions

To the best of our knowledge, there are so far no reports on co-doping of fluoride contrast agents with Gd3+, Tb3+, Yb3+, and Nd3+ ions to provide DC/UC luminescence, MRI, and CT contrast in one system. Hence, we synthesized GdF3 and TbF3 nanoparticles doped with Ln3+ ions, such as Gd3+, Tb3+,Yb3+, and Nd3+, by employing a one-step coprecipitation of respective lanthanide chlorides in EG. Thanks to introduction of hydrophilic P(DMA-AGME)-Ale coating, aqueous dispersions of the nanoparticles were generally highly colloidally stable during weeks till months. In particular, the TbF3:Gd3+,Yb3+,Nd3+@P(DMA-AGME)-Ale nanoparticles exhibited down- and upconverting luminescence properties simultaneously with magnetic properties suitable for T2*-weighted MRI. In contrast, GdF3:Tb3+,Yb3+,Nd3+@P(DMA-AGME)-Ale nanoparticles provided sufficient signal in down- and upconversion cellular imaging and contrast enhancement in both T1- and T2-weighted MRI and CT. Combination of down- and upconversion luminescence with magnetic properties and X-ray attenuation into a single nanoparticle thus demonstrated feasibility of P(DMA-AGME)-Ale-coated Gd(Tb)F3:Tb3+(Gd3+),Yb3+,Nd3+ nanoparticles for multimodal imaging. In vitro cell investigations then showed that the particles were efficiently internalized by the primary and cancer cells (HeLa, HF, HepG2, and INS) without entering the nuclei. Distribution of the particles in the cytoplasm was cell type-dependent, they were negligibly cytotoxic for the primary non-cancerogenic cells and more toxic for cancer cells; this is especially important for future in vivo bioimaging of severe medical disorders. For in vivo experiments, a fluorescent dye Cy7 was bound to the Gd(Tb)F3:Tb3+(Gd3+),Yb3+,Nd3+@P(DMA-AGME)-Ale nanoparticles to enhance fluorescence imaging. The conjugated particles were then trackable by MRI, CT, and FI. The in vivo imaging revealed nanoparticle biodistribution mainly in the liver and spleen of mice. Last but not least, excitation at 808 nm provides opportunity to achieve deeper living tissue penetration and thanks to the upconversion emission at 650 nm, future immobilization of a proper photosensitizer will enable application of P(DMA-AGME)-Ale-coated Gd(Tb)F3:Tb3+(Gd3+),Yb3+,Nd3+ nanoparticles in photodynamic therapy of tumors.

Supplementary Materials

The following are available online at https://0-www-mdpi-com.brum.beds.ac.uk/2079-4991/11/1/230/s1, Figure S1: Dependence of hydrodynamic diameter Dh of GdF3:Tb3+,Yb3+,Nd3+@P(DMA-AGME)-Ale nanoparticles in water on time of storage. The particles were synthesized at 100 or 140 °C. Figure S2: High magnification TEM micrographs of P(DMA-AGME)-Ale-coated (a) GdF3:Tb3+,Yb3+,Nd3+ and (b) TbF3:Gd3+,Yb3+,Nd3+ nanoparticles. The insets display the very small individual particles with sizes <~5 nm. Figure S3: (a) FTIR spectra and (b) TGA and DTGA (differential thermogravimetric analysis) of P(DMA-AGME)-Ale-coated GdF3:Tb3+,Yb3+,Nd3+ (black) and TbF3:Gd3+,Yb3+,Nd3+ nanoparticles (red). Figure S4: (a) DC excitation spectra of P(DMA-AGME)-Ale-coated GdF3:Tb3+,Yb3+,Nd3+ (red) and TbF3:Gd3+,Yb3+,Nd3+ nanoparticles (black); (b) DC emission spectra TbF3:Gd3+,Yb3+,Nd3+@P(DMA-AGME)-Ale nanoparticles excited at different wavelengths. Figure S5: UC photoluminescence emission spectra of P(DMA-AGME)-Ale-coated GdF3:Tb3+,Yb3+,Nd3+ and TbF3:Gd3+,Yb3+,Nd3+ nanoparticles doped with different concentrations of Gd3+ and Tb3+ ions; 980 nm excitation, particle concentration 1 mg/mL, and power density 5 W/cm2. Figure S6: Cytotoxicity of P(DMA-AGME)-Ale-coated GdF3:Tb3+,Yb3+,Nd3+ (black) and TbF3:Gd3+,Yb3+,Nd3+ nanoparticles (red) incubated with Hela (dashed line) and HF cells (solid line) for 72 h. Figure S7: Laser scanning confocal micrographs of (a–c) HF and (d–f) HeLa cells (a,d) before (negative control) and after treatment with (b,e) TbF3:Gd3+,Yb3+,Nd3+@P(DMA-AGME)-Ale and (c,f) GdF3:Tb3+,Yb3+,Nd3+@P(DMA-AGME)-Ale nanoparticles. Figure S8: (a–f) Confocal micrographs of biodistribution of TbF3:Gd3+,Yb3+,Nd3+@P(DMA-AGME)-Ale nanoparticles in INS cells at 808 nm excitation with a laser power of 30–50 mW. (d–f) Detailed micrographs of (a–c). (a,d) CellMask™ deep red-stained cell membrane, (b,e) nanoparticles (green), and (c,f) overlay of (a,b) and (d,e), respectively. Figure S9: Emission spectra of pure GdF3:Tb3+,Yb3+,Nd3+@P(DMA-AGME)-Ale nanoparticles (black) and nanoparticles localized in the HepG2 cells (red). Figure S10: (a,c) Relative T1 and (b,d) T2* signal evolution in the liver, kidney (medulla and cortex), and spleen after administration of P(DMA-AGME)-Ale-coated (a,b) TbF3:Gd3+,Yb3+,Nd3+ and (c,d) GdF3:Tb3+,Yb3+,Nd3+ nanoparticles in mice. Figure S11: Dependence of CT value of Gd(Tb)F3:Tb3+(Gd3+),Yb3+,Nd3+@P(DMA-AGME)-Ale nanoparticles and Iohexol on the concentration. HU - Hounsfield units. Figure S12: Relative signal evolution of the CT contrast (HU) in the liver and kidneys calculated from pre-injection to 48 h post-injection of GdF3:Tb3+,Yb3+,Nd3+@P(DMA-AGME)-Ale nanoparticles. Error bars represent the standard deviation from two independent images. Figure S13: Photoluminescence spectra of Cy7-modified Gd(Tb)F3:Tb3+(Gd3+),Yb3+,Nd3+@P(DMA-AGME)-Ale nanoparticles. Figure S14: Fluorescence imaging of the excised mouse organs 168 h after administration of GdF3:Tb3+,Yb3+,Nd3+@P(DMA-AGME)-Ale-Cy7 nanoparticles. Table S1: Characterization of GdF3@PDMAnanoparticles.

Author Contributions

Conceptualization, O.S. and D.H.; the synthesis and characterization of nanoparticles, O.S.; the synthesis and characterization of polymers, V.O.; TEM, EDAX and SAED, M.Š.; elemental analysis, O.T.; modification with Cy7, V.L.; in vitro cytotoxicity, M.F. and O.J.; confocal imaging, O.J., H.E. and P.J.; in vivo biological experiments, J.P., A.M., V.H.; original draft preparation, O.S., V.H.; review and editing, V.H., D.H., P.J., L.Š.; supervision, D.H., L.Š.; project administration and funding acquisition, D.H., O.S. and L.Š. All authors have read and agreed to the published version of the manuscript.

Funding

This research was funded by the Czech Science Foundation, No. 19-00676S. The in vivo imaging experiments were supported by the MEYS CR (LM2018129 Czech-BioImaging) and the European Regional Development Fund (CZ.02.01./0.0./0.0./16_013/0001775). V.L. thanks to the support by the MEYS CR (No. LTC19032 INTER-COST).

Data Availability Statement

The data presented in this study are available on request from the corresponding author (O.S.).

Acknowledgments

The confocal imaging was done at the BioImaging Facility, Institute of Physiology, CAS, supported by the MEYS CR (LM2018129 Czech BioImaging).

Conflicts of Interest

The authors declare no conflict of interest. The funders had no role in the design of the study; in the collection, analyses, or interpretation of data; in the writing of the manuscript, or in the decision to publish the results.

References

  1. Walter, A.; Paul-Gilloteaux, P.; Plochberger, B.; Sefc, L.; Verkade, P.; Mannheim, J.G.; Slezak, P.; Unterhuber, A.; Marchetti-Deschmann, M.; Ogris, M.; et al. Correlated multimodal imaging in life sciences: Expanding the biomedical horizon. Front. Phys. 2020, 8, 1–28. [Google Scholar] [CrossRef]
  2. Li, X.; Zhang, X.N.; Li, X.D.; Chang, J. Multimodality imaging in nanomedicine and nanotheranostics. Cancer Biol. Med. 2016, 13, 339–348. [Google Scholar] [CrossRef] [PubMed] [Green Version]
  3. Burke, B.P.; Cawthorne, C.; Archibald, S.J. Multimodal nanoparticle imaging agents: Design and applications. Phil. Trans. R. Soc. A 2017, 375, 20170261. [Google Scholar] [CrossRef] [PubMed]
  4. Key, J.; Leary, J.F. Nanoparticles for multimodal in vivo imaging in nanomedicine. Int. J. Nanomed. 2014, 9, 711–726. [Google Scholar]
  5. Rodriguez-Liviano, S.; Nunez, N.O.; Rivera-Fernández, S.; de la Fuente, J.M.; Ocana, M. Ionic liquid mediated synthesis and surface modification of multifunctional mesoporous Eu:GdF3 nanoparticles for biomedical applications. Langmuir 2013, 29, 3411–3418. [Google Scholar] [CrossRef] [PubMed]
  6. Wang, D.-Y.; Ma, P.-C.; Zhang, J.-C.; Wang, Y.-H. Efficient down- and up-conversion luminescence in Er3+–Yb3+ co-doped Y7O6F9 for photovoltaics. ACS Appl. Energy Mater. 2018, 1, 447–454. [Google Scholar] [CrossRef]
  7. Qin, X.; Zhang, X.; Zhang, W.; Li, C.; Zhu, C. Facile synthesis of NaYF4:Ln/NaYF4:Eu composite with up-conversion and down-shifting luminescence. J. Photochem. Photobiol. A 2020, 391, 112388. [Google Scholar] [CrossRef]
  8. Shapoval, O.; Kaman, O.; Hromádková, J.; Vavřík, D.; Jirák, D.; Machová, D.; Parnica, J.; Horák, D. Multimodal PSSMA-functionalized GdF3:Eu3+(Tb3+) nanoparticles for luminescence imaging, MRI, and X-ray computed tomography. ChemPlusChem 2019, 84, 1135–1139. [Google Scholar] [CrossRef] [PubMed]
  9. Branca, M.; Pelletier, F.; Cottin, B.; Ciuculescu, D.; Lin, C.C.; Serra, R.; Mattei, J.G.; Casanove, M.J.; Tan, R.; Respaud, M.; et al. Design of FeBi nanoparticles for imaging applications. Faraday Discuss. 2014, 175, 97–111. [Google Scholar] [CrossRef]
  10. Liang, S.Y.; Zhou, Q.; Wang, M.; Zhu, Y.H.; Wu, Q.Z.; Yang, X.L. Water-soluble L-cysteine-coated FePt nanoparticles as dual MRI/CT imaging contrast agent for glioma. Int. J. Nanomed. 2015, 10, 2325–2333. [Google Scholar]
  11. Carril, M.; Fernández, I.; Rodríguez, J.; García, I.; Penadés, S. Gold-coated iron oxide glyconanoparticles for MRI, CT, and US multimodal imaging. Part. Part. Syst. Char. 2013, 31, 81–87. [Google Scholar] [CrossRef]
  12. Alric, C.; Taleb, J.; Le Duc, G.; Mandon, C.; Billotey, C.; Le Meur-Herland, A.; Brochard, T.; Vocanson, F.; Janier, M.; Perriat, P.; et al. Gadolinium chelate coated gold nanoparticles as contrast agents for both X-ray computed tomography and magnetic resonance imaging. J. Am. Chem. Soc. 2008, 130, 5908–5915. [Google Scholar] [CrossRef] [PubMed]
  13. Dong, H.; Du, S.R.; Zheng, X.-Y.; Lyu, G.M.; Sun, L.D.; Li, L.D.; Zhang, P.Z.; Zhang, C.; Yan, C.H. Lanthanide nanoparticles: From design toward bioimaging and therapy. Chem. Rev. 2015, 115, 10725–10815. [Google Scholar] [CrossRef] [PubMed]
  14. Passuello, T.; Pedroni, M.; Piccinelli, F.; Polizzi, S.; Marzola, P.; Tambalo, S.; Conti, G.; Benati, D.; Vetrone, F.; Bettinelli, M.; et al. PEG-capped, lanthanide doped GdF3 nanoparticles: Luminescent and T2 contrast agents for optical and MRI multimodal imaging. Nanoscale 2012, 4, 7682–7689. [Google Scholar] [CrossRef] [PubMed] [Green Version]
  15. Biju, S.; Gallo, J.; Banobre-Lopez, M.; Manshian, B.; Soenen, S.; Himmelreich, U.; Vander Elst, L.; Parac-Vogt, T. A magnetic chameleon: Biocompatible lanthanide nanoparticles with magnetic field dependent properties as contrast agents for MRI and optical imaging in biological window. Chem. Eur. J. 2018, 24, 7388–7397. [Google Scholar] [CrossRef]
  16. Ni, D.L.; Zhang, J.W.; Bu, W.B.; Zhang, C.; Yao, Z.; Xing, H.; Wang, J.; Duan, F.; Liu, Y.; Fan, W.; et al. PEGylated NaHoF4 nanoparticles as contrast agents for both X-ray computed tomography and ultra-high field magnetic resonance imaging. Biomaterials 2016, 76, 218–225. [Google Scholar] [CrossRef] [PubMed]
  17. Donati, T.; Wilson, J.; Kölbel, T.; Clough, R.E. Modern diagnostics for type B aortic dissection. Gefasschirurgie 2015, 20, 420–427. [Google Scholar] [CrossRef] [Green Version]
  18. Viswanathan, S.; Kovacs, Z.; Green, K.N.; Ratnakar, S.J.; Sherry, A.D. Alternatives to gadolinium-based metal chelates for magnetic resonance imaging. Chem. Rev. 2010, 110, 2960–3018. [Google Scholar] [CrossRef] [Green Version]
  19. Zhang, L.; Yang, R.; Zou, H.; Shen, X.; Zheng, J.; Wei, W. High-efficiency simultaneous three-photon absorption upconversion luminescence of a terbium-doped germanate glass. Jpn. J. Appl. Phys. 2016, 55, 122402. [Google Scholar] [CrossRef]
  20. Prorok, K.; Pawlyta, M.; Stręk, W.; Bednarkiewicz, A. Energy migration up-conversion of Tb3+ in Yb3+ and Nd3+ codoped active-core/active-shell colloidal nanoparticles. Chem. Mater. 2016, 28, 2295–2300. [Google Scholar] [CrossRef]
  21. Subramanian, M.; Thakur, P.; Gautam, S.; Chae, K.H.; Tanemura, M.; Hihara, T.; Vijayalakshmi, S.; Soga, T.; Kim, S.S.; Asokan, K. Investigations on the structural, optical and electronic properties of Nd doped ZnO thin films. J. Phys. D 2009, 42, 105410. [Google Scholar] [CrossRef]
  22. Yi, Z.; Li, X.; Lu, W.; Liu, H.; Zeng, S.; Hao, J. Hybrid lanthanide nanoparticles as a new class of binary contrast agents for in vivo T1/T2 dual-weighted MRI and synergistic tumor diagnosis. J. Mater. Chem. B 2016, 4, 2715–2722. [Google Scholar] [CrossRef] [PubMed]
  23. Abdesselem, M.; Schoeffel, M.; Maurin, I.; Ramodiharilafy, R.; Autret, G.; Clément, O.; Tharaux, P.L.; Boilot, J.P.; Gacoin, T.; Bouzigues, C.; et al. Multifunctional rare-earth vanadate nanoparticles: Luminescent labels, oxidant sensors, and MRI contrast agents. ACS Nano 2014, 8, 11126–11137. [Google Scholar] [CrossRef] [PubMed]
  24. Sharma, R.K.; Mudring, A.-V.; Ghosh, P. Recent trends in binary and ternary rare-earth fluoride nanophosphors: How structural and physical properties influence optical behavior. J. Lumin. 2017, 189, 44–63. [Google Scholar] [CrossRef]
  25. Feldmann, C. Polyol-mediated synthesis of nanoscale functional materials. Adv. Funct. Mater. 2003, 13, 101–107. [Google Scholar] [CrossRef]
  26. Dang, T.M.D.; Le, T.T.T.; Fribourg-Blanc, E.; Dang, M.C. Influence of surfactant on the preparation of silver nanoparticles by polyol method. Adv. Nat. Sci. Nanosci. Nanotechnol. 2012, 3, 035004. [Google Scholar] [CrossRef]
  27. Schubert, J.; Chanana, M. Coating matters: Review on colloidal stability of nanoparticles with biocompatible coatings in biologi-cal media, living cells and organisms. Curr. Med. Chem. 2018, 25, 4553–4586. [Google Scholar] [CrossRef]
  28. Gao, J.; Ran, X.; Shi, C.; Cheng, H.; Cheng, T.; Su, Y. One-step solvothermal synthesis of highly water-soluble, negatively charged superparamagnetic Fe3O4 colloidal nanocrystal clusters. Nanoscale 2013, 5, 7026–7033. [Google Scholar] [CrossRef]
  29. Oleksa, V.; Macková, H.; Patsula, V.; Dydowitzová, A.; Janoušková, O.; Horák, D. Doxorubicin-conjugated iron oxide nanoparticles: Surface engineering and biomedical investigation. ChemPlusChem 2020, 85, 1156–1163. [Google Scholar] [CrossRef]
  30. Kostiv, U.; Engstová, H.; Krajnik, B.; Šlouf, M.; Proks, V.; Podhorodecky, A.; Ježek, P.; Horák, D. Monodisperse core-shell NaYF4:Yb3+/Er3+@NaYF4:Nd3+-PEG-GGGRGDSGGGY-NH2 nanoparticles excitable at 808 and 980 nm: Design, surface engineering, and application in life sciences. Front. Chem. 2020, 8, 497. [Google Scholar] [CrossRef]
  31. Zasonska, B.A.; Boiko, N.; Horák, D.; Klyuchivska, O.; Macková, H.; Beneš, M.; Babič, M.; Trchová, M.; Hromádková, J.; Stoika, R. The use of hydrophilic poly(N,N-dimethylacrylamide) for promoting engulfment of magnetic γ-Fe2O3 nanoparticles by mammalian cells. J. Biomed. Nanotechnol. 2013, 9, 479–491. [Google Scholar] [CrossRef] [PubMed]
  32. Gregori, M.; Bertani, D.; Cazzaniga, E.; Orlando, A.; Mauri, M.; Bianchi, A.; Re, F.; Sesana, S.; Minniti, S.; Francolini, M.; et al. Investigation of functionalized poly(N,N-dimethylacrylamide)-block-polystyrene nanoparticles as novel drug delivery system to overcome the blood–brain barrier in vitro. Macromol. Biosci. 2015, 15, 1687–1697. [Google Scholar] [CrossRef] [PubMed]
  33. Poul, L.; Ammar, S.; Jouini, N.; Fievet, F.; Villain, F. A synthesis of inorganic compounds (metal, oxide and hydroxide) in polyol medium: A versatile route related to the sol-gel process. J. Sol-Gel. Sci. Tech. 2003, 26, 261–265. [Google Scholar] [CrossRef]
  34. Clayton, K.N.; Salameh, J.W.; Wereley, S.T.; Kinzer-Ursem, T.L. Physical characterization of nanoparticle size and surface mo-dification using particle scattering diffusometry. Biomicrofluidics 2016, 10, 054107. [Google Scholar] [CrossRef] [PubMed] [Green Version]
  35. Moore, T.L.; Rodriguez-Lorenzo, L.; Hirsch, V.; Balog, S.; Urban, D.; Jud, C.; Rothen-Rutishauser, B.; Lattuada, M.; Petri-Fink, A. Nanoparticle colloidal stability in cell culture media and impact on cellular interactions. Chem. Soc. Rev. 2015, 44, 6287–6305. [Google Scholar] [CrossRef] [Green Version]
  36. Porfire, A.; Achim, M.; Tefas, L.; Sylvester, B. Liposomal nanoformulations as current tumor-targeting approach to cancer therapy. In Liposomes; Catala, A., Ed.; Intech: London, UK, 2018. [Google Scholar] [CrossRef] [Green Version]
  37. Andrews, K.W.; Dyson, D.J.; Keown, S.R. Interpretation of Electron Diffraction Patterns; Plenum Press: New York, NY, USA, 1967. [Google Scholar]
  38. Mishra, K.; Singh, S.K.; Singh, A.K.; Rai, M.; Gupta, B.P.; Rai, S.B. New perspective in garnet phosphor: Low temperature synthesis, nanostructures, and observation of multimodal luminescence. Inorg. Chem. 2014, 53, 9561–9569. [Google Scholar] [CrossRef]
  39. Liang, H.J.; Chen, G.Y.; Li, L.; Liu, Y.; Qin, F.; Zhang, Z.G. Upconversion luminescence in Yb3+/Tb3+-codoped monodisperse NaYF4 nanocrystals. Opt. Commun. 2009, 282, 3028–3031. [Google Scholar] [CrossRef]
  40. Zhang, W.J.; Chen, Q.J.; Qian, Q.; Zhang, Q.Y.; Jiang, Z.H. Cooperative energy transfer in Tb3+/Yb3+- and Nd3+/Yb3+/Tb3+-codoped oxyfluoride glasses. Phys. B Condens. Matter. 2010, 405, 1062–1066. [Google Scholar] [CrossRef]
  41. Debasu, M.L.; Ananias, D.; Pinho, S.L.C.; Geraldes, C.F.G.C.; Carlos, L.D.; Rocha, J. (Gd,Yb,Tb)PO4 up-conversion nanocrystals for bimodal luminescence–MR imaging. Nanoscale 2012, 4, 5154–5162. [Google Scholar] [CrossRef]
  42. Zhang, P.; He, Y.; Liu, J.; Feng, J.; Sun, Z.; Lei, P.; Yuan, Q.; Zhang, H. Core-shell BaYbF5:Tm@BaGdF5:Yb,Tm nanocrystals for in vivo trimodal UCL/CT/MR imaging. RSC Adv. 2016, 6, 14283–14289. [Google Scholar] [CrossRef]
  43. Zheng, X.; Wang, Y.; Sun, L.; Chen, N.; Li, L.; Shi, S.; Malaisamy, S.; Yan, C. TbF3 nanoparticles as dual-mode contrast agents for ultrahigh field magnetic resonance imaging and X-ray computed tomography. Nano Res. 2016, 9, 1135–1147. [Google Scholar] [CrossRef]
Figure 1. Chemical structure of alendronate-modified poly(N,N-dimethylacrylamide-co-N-acryloylglycine methyl ester).
Nanomaterials 11 00230 g001
Figure 2. Dependence of hydrodynamic diameter Dh of P(DMA-AGME)-Ale-coated GdF3:Tb3+,Yb3+,Nd3+ (red) and TbF3:Gd3+,Yb3+,Nd3+ nanoparticles (black) in (a) water and (b) PBS and NaAc buffers. The particles were prepared at reaction temperature 75 °C.
Nanomaterials 11 00230 g002
Figure 3. Dependence of (a,c) hydrodynamic diameter Dh and (b,d) ζ-potential of GdF3:Tb3+,Yb3+,Nd3+@P(DMA-AGME)-Ale nanoparticles on (a,b) pH and (c,d) NaCl concentration.
Nanomaterials 11 00230 g003
Figure 4. Characterization of P(DMA-AGME)-Ale-coated (ac) GdF3:Tb3+,Yb3+,Nd3+ and (df) TbF3:Gd3+,Yb3+,Nd3+ nanoparticles. (a,d) TEM micrographs of the nanoparticles with insets showing their diffraction patterns, (b,e) TEM/EDX spectra, and (c,f) comparison of experimental selected electron diffraction patterns (TEM/SAED) with calculated powder X-ray diffraction patterns (PXRD) of orthorhombic GdF3 and TbF3 structures; the hk0 diffractions, which were stronger in TEM/SAED than in PXRD due to preferred orientation of nanocrystals, are marked with bold font.
Nanomaterials 11 00230 g004
Figure 5. (a) DC and (b) UC photoluminescence emission spectra of P(DMA-AGME)-Ale-coated GdF3:Tb3+,Yb3+,Nd3+ (red) and TbF3:Gd3+,Yb3+,Nd3+ nanoparticles (black) excited at (a) 272 nm (for GdF3:Tb3+) or 350 nm (for TbF3:Gd3+) and (b) 980 nm; particle concentration 1 mg/mL and power density of up-conversion luminescence 5 W/cm2.
Nanomaterials 11 00230 g005
Figure 6. Intracellular uptake of (af) TbF3:Gd3+,Yb3+,Nd3+@P(DMA-AGME)-Ale and (gl) GdF3:Tb3+,Yb3+,Nd3+@P(DMA-AGME)-Ale nanoparticles by (df,jl) Hela and (ac,gi) HF cells. (a,d,g,j) CellMask™ deep red-stained cell membranes were visualized in red channel and (b,e,h,k) nanoparticles were visualized in blue channel. (c,f,i,l) Both channels were merged.
Nanomaterials 11 00230 g006
Figure 7. (af) Confocal micrographs of distribution of GdF3:Tb3+,Yb3+,Nd3+@P(DMA-AGME)-Ale nanoparticles in HepG2 cells at 808 nm excitation with a laser power of 30–50 mW. (df) Detailed micrographs of (ac). (a,d) CellMask™ deep red-stained cell membrane, (b,e) nanoparticles (green), and (c,f) overlay of (a,b) and (d,e), respectively.
Nanomaterials 11 00230 g007
Figure 8. (a) T1- and (b) T2*-weighted MR images of the mouse before retroorbital administration of TbF3:Gd3+,Yb3+,Nd3+@P(DMA-AGME)-Ale nanoparticles and in several time intervals after the administration. (a) The signal in the liver on the T1-weighted image moderately increased shortly after the administration due to a weak T1 effect, while (b) the signal on the T2*-weighted MR image of the liver and spleen substantially decreased due to nanoparticle accumulation in the organs. The nanoparticles were slowly excreted from the liver after one day of post-administration; however, signal hypointensity was noticeable even one week after the administration.
Nanomaterials 11 00230 g008
Figure 9. (a) T1-weighted and (b) T2*-weighted MR images of the mouse before retroorbital admi-nistration of GdF3:Tb3+,Yb3+,Nd3+@P(DMA-AGME)-Ale nanoparticles and in several time intervals after the administration. (a) The signal in the liver on the T1-weighted image substantially increased shortly after the administration due to a strong T1 effect, while (b) the signal on the T2*-weighted MR image in the liver and spleen decreased due to nanoparticle accumulation in the organs. Slow excretion of the nanoparticles from the liver was observed after one day post-admi-nistration.
Nanomaterials 11 00230 g009
Figure 10. Coronal CT images of the mouse (a,c) before and (b,d) after administration of GdF3:Tb3+,Yb3+,Nd3+@P(DMA-AGME)-Ale nanoparticles; (c,d) enlarged CT view of the abdomen.
Nanomaterials 11 00230 g010
Figure 11. In vivo fluorescence imaging of the mouse after retroorbital administration of GdF3:Tb3+,Yb3+,Nd3+@P(DMA-AGME)-Ale-Cy7 nanoparticles.
Nanomaterials 11 00230 g011
Table 1. Characterization of the nanoparticles.
ParticlesDn
(nm)
ÐDh
(nm)
PDξ-Potential
(mV)
GdF3:Tb3+,Yb3+,Nd3+
@P(DMA-AGME)-Ale
591.16740.082
TbF3:Gd3+,Yb3+,Nd3+
@P(DMA-AGME)-Ale
511.15820.071
Dn—number-average particle diameter (TEM); Зdispersity (TEM); Dh—hydrodynamic diameter (DLS); PD—polydispersity (DLS).
Table 2. Relaxometry of aqueous Gd(Tb)F3:Tb3+(Gd3+),Yb3+,Nd3+@P(DMA-AGME)-Ale nanoparticle dispersions measured at 23 °C.
Particles[Gd3+]
mmol/mL
[Tb3+]
mmol/mL
[Yb3+]
mmol/mL
[Nd3+]
mmol/mL
∑ [Ln3+]
mmol/mL
r1
(mM−1 s−1)
r2
(mM−1 s−1)
r2/r1
GdF3143.5---143.5 1.05 ± 0.051.27 ± 0.021.21
GdF3:10%Yb3+133.5-16.6-150.11.41 ± 0.101.66 ± 0.021.18
GdF3:10%Nd3+130.6--14.0144.61.34 ± 0.051.63 ± 0.041.22
GdF3:5%Yb3+,5%Nd3+125.2-6.59.9141.61.54 ± 0.081.86 ± 0.041.21
GdF3:20%Tb3+,5%Yb3+,5%Nd3+92.427.86.910.6137.71.29 ± 0.021.59 ± 0.031.23
GdF3:40%Tb3+,5%Yb3+,5%Nd3+63.252.66.29.5131.51.07 ± 0.011.77 ± 0.011.65
TbF3:40%Gd3+,5%Yb3+,5%Nd3+58.560.26.510.1135.31.09 ± 0.012.34 ± 0.082.16
TbF3:20%Gd3+,5%Yb3+,5%Nd3+30.8103.88.27.6150.40.69 ± 0.031.03 ± 0.021.51
TbF3:5%Yb3+,5%Nd3+-125.2710.8143.00.04 ± 0.012.01 ± 0.0157.9
Publisher’s Note: MDPI stays neutral with regard to jurisdictional claims in published maps and institutional affiliations.

