Article

Effect of Nanoparticles on the Thermal Stability and Reaction Kinetics in Ionic Nanofluids

by
Adela Svobodova-Sedlackova
1,2,
Sergio Huete-Hernández
1,
Alejandro Calderón
3,
Camila Barreneche
1,
Pablo Gamallo
1,2 and
Ana Inés Fernandez
1,*
1
Departament de Ciència de Materials i Química Física, Universitat de Barcelona, C/Martí i Franqués 1, 08028 Barcelona, Spain
2
Institut de Química Teòrica i Computacional, IQTCUB, Universitat de Barcelona, C/Martí i Franqués 1, 08028 Barcelona, Spain
3
Departament d’Enginyeria Mecànica, Universitat Rovira i Virgili, Av. Paisos Catalans 26, 43007 Tarragona, Spain
*
Author to whom correspondence should be addressed.
Nanomaterials 2022, 12(10), 1777; https://0-doi-org.brum.beds.ac.uk/10.3390/nano12101777
Submission received: 21 April 2022 / Revised: 16 May 2022 / Accepted: 17 May 2022 / Published: 23 May 2022

Abstract

:
Nowadays, the incorporation of nanoparticles into thermal fluids has become one of the most suitable strategies for developing high-performance fluids. An unconventional improvement of thermo–physical properties was observed with the addition of 1% wt. of nanoparticles in different types of fluids, such as molten salts, allowing for the design of more thermally efficient systems using nanofluids. Despite this, there is a lack of knowledge about the effect that nanoparticles produce on the thermal stability and the decomposition kinetics of the base fluid. The present study performs IR- and UV-vis spectroscopy along with thermogravimetric analysis (TGA) of pure nitrate and nitrate based nanofluids with the presence of SiO2 and Al2O3 nanoparticles (1% wt.). The results obtained support that nanoparticles accelerate the nitrate to nitrite decomposition at temperatures below 500 °C (up to 4%), thus confirming the catalytic role of nanoparticles in nanofluids.

1. Introduction

The incorporation of suspended nanoparticles (NPs) into a fluid has become a suitable strategy for improving the thermo–physical properties of fluids; this concept, defined as a nanofluid (NF), was first introduced in 1995 by Choi et al. [1], who showed that the thermal conductivity of water and ethylene glycol increased by adding Al2O3 or CuO NPs; since then, many efforts have been devoted to the development of NFs as well as to the understanding of some exceptional properties exhibited by them [2,3]. More precisely, one of the aspects that attracted the scientific interest is the abnormal improvement of the specific heat capacity (Cp) observed in NFs; thus, a large number of publications indicate Cp increments up to 40% when low concentrations of NPs are incorporated into the fluid [4], around 1% wt. According to this, and to the fact that material’s energy density is determined by the product of Cp and the fluid density, the heat capacity becomes one of the most relevant design parameters in industrial applications allowing to reach more compact and effective heat transfer systems using NFs. Consequently, NFs open the door to the next generation of heat transfer fluids (HTF) with better thermal performance than the traditional fluids such as water, oils, molten salts or ethylene glycol, solving their relatively poor heat transfer characteristics. In the last years, NFs have been incorporated in many applications such as solar energy [5,6], geothermal [7], heat exchange [7], oil recovery [8,9], lubricants [10,11], refrigeration [12], desalination [13] or CO2 capture [14], among others.
Specifically, the incorporation of NFs as a thermal energy storage (TES) medium in concentrate solar power (CSP) plants would improve the storage efficiency and thus, it may contribute to the possibility of reducing the volume of the storage tanks, involving an important material cost reduction [15,16,17]. Molten salts and particularly solar salt (i.e., a eutectic mixture of sodium and potassium nitrate) was the most commercially used TES material in CSP plants. Molten salt-based NFs are widely studied in the literature [18,19,20,21], showing a high Cp enhancement. For example, Y. Huang et al. [22] report Cp enhancements up to 168% after adding MgO NPs into the solar salt; however, the majority of publications report Cp enhancements up to 30% adding NPs at different concentrations into molten salts systems like Li2CO3/K2CO3 + 1% wt. SiO2 [23], NaNO3/KNO3 + 0.8% wt. Al2O3 [24], KNO3/NaNO2/NaNO3 + 0.07% wt. Al2O3 [25], NaNO3 + 1% wt. SiO2 [4] and Ca(NO3)2/KNO3/NaNO3/LiNO3 + 0.5% wt. SiO2 [26], among others. Nevertheless, some studies show just the opposite trend [27,28,29]; it is the case of the studies carried out by Q. Xie et al. [30], M. A. Hassan et al. [31] or M. C. Lu et al. [32], in which a decrease in Cp was reported by the addition of NPs in molten salts. Hence, there are no clear trends regarding the effect of Cp enhancement due to the addition of nanoparticles in the heat transfer fluid.
Another relevant parameter for the implementation of NFs in industrial applications is their thermal stability (i.e., solar salts for TES in CSP stations work from 250 to 400 °C). Pramod et al. [33] demonstrated that NPs in molten salts help to improve their thermal stability. Contrarily, no significant changes were observed by p. Myers et al. [34] and P. Andreu-Cabedo et al. [35] adding CuO or SiO2 NPs into molten salts, respectively. The thermal stability of solar salts (a eutectic mixture of NaNO3 (60%)-KNO3 (40%)) is directly related to the nitrate-nitrite conversion; therefore, more precise experiments are needed to understand the effect of NPs on the kinetics of the thermal decomposition. Likewise, monitoring the decomposition rate of nitrates (i.e., nitrites formation) is essential to control the NF’s stability as the nitrite formation contributes to salt decomposition and to increase corrosion rates in the storage systems; this aspect is very relevant due to the high corrosion caused by salts in the metallic components of CSP facilities [36,37,38].
This work aims at studying the effect of introducing NPs in the sodium nitrate salt thermal stability. For this propose, IR and UV spectroscopic techniques have been used for determining the nitrite concentration in aqueous solution in the temperature range from 100 to 500 °C. Furthermore, thermogravimetric analysis was performed to study the weight loss, temperature decomposition and reaction kinetics through representative samples of two types of NaNO3 based NFs (NaNO3 + 1% wt. SiO2 and NaNO3 + 1% wt. Al2O3) in the same range of temperatures for evaluating the degree of nitrites formation and the temperature stability of the samples; other techniques, such as electron microscopy, were also used for characterizing the NPs.

2. Materials and Methods

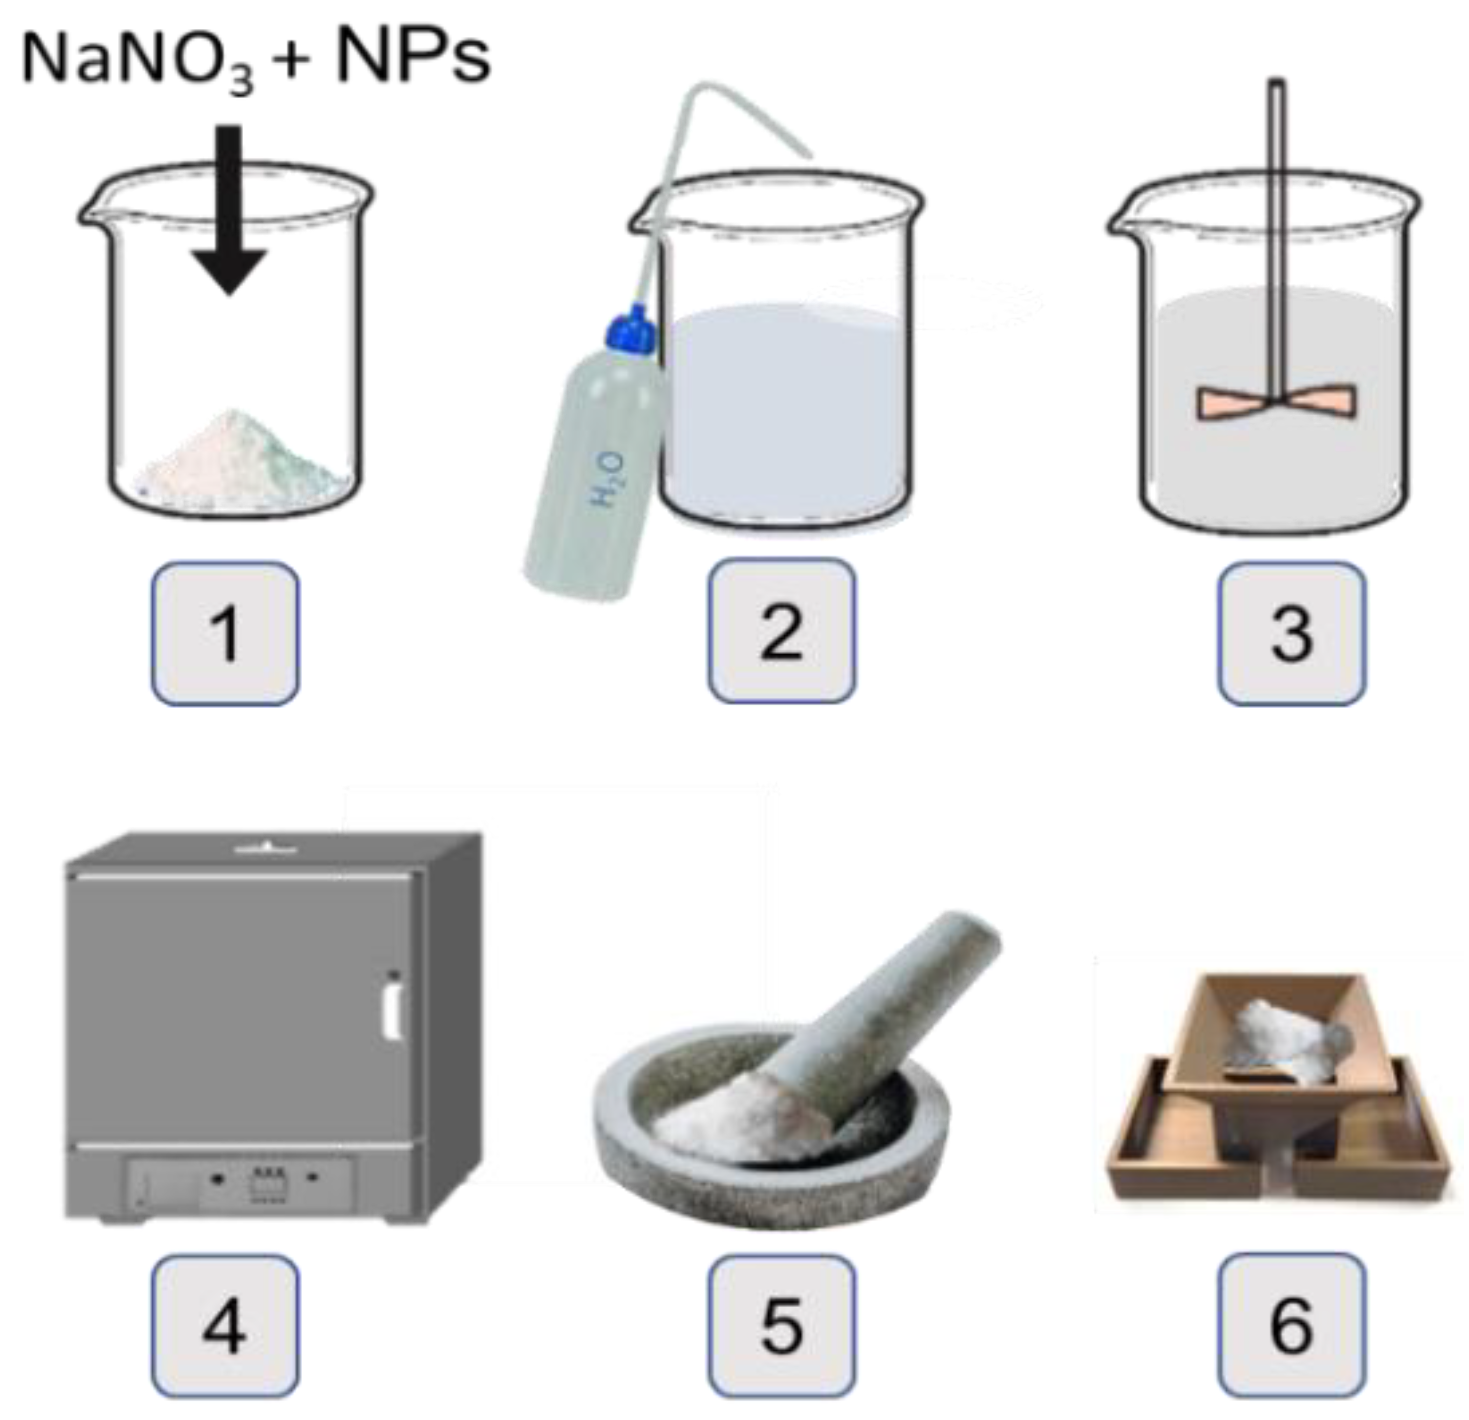
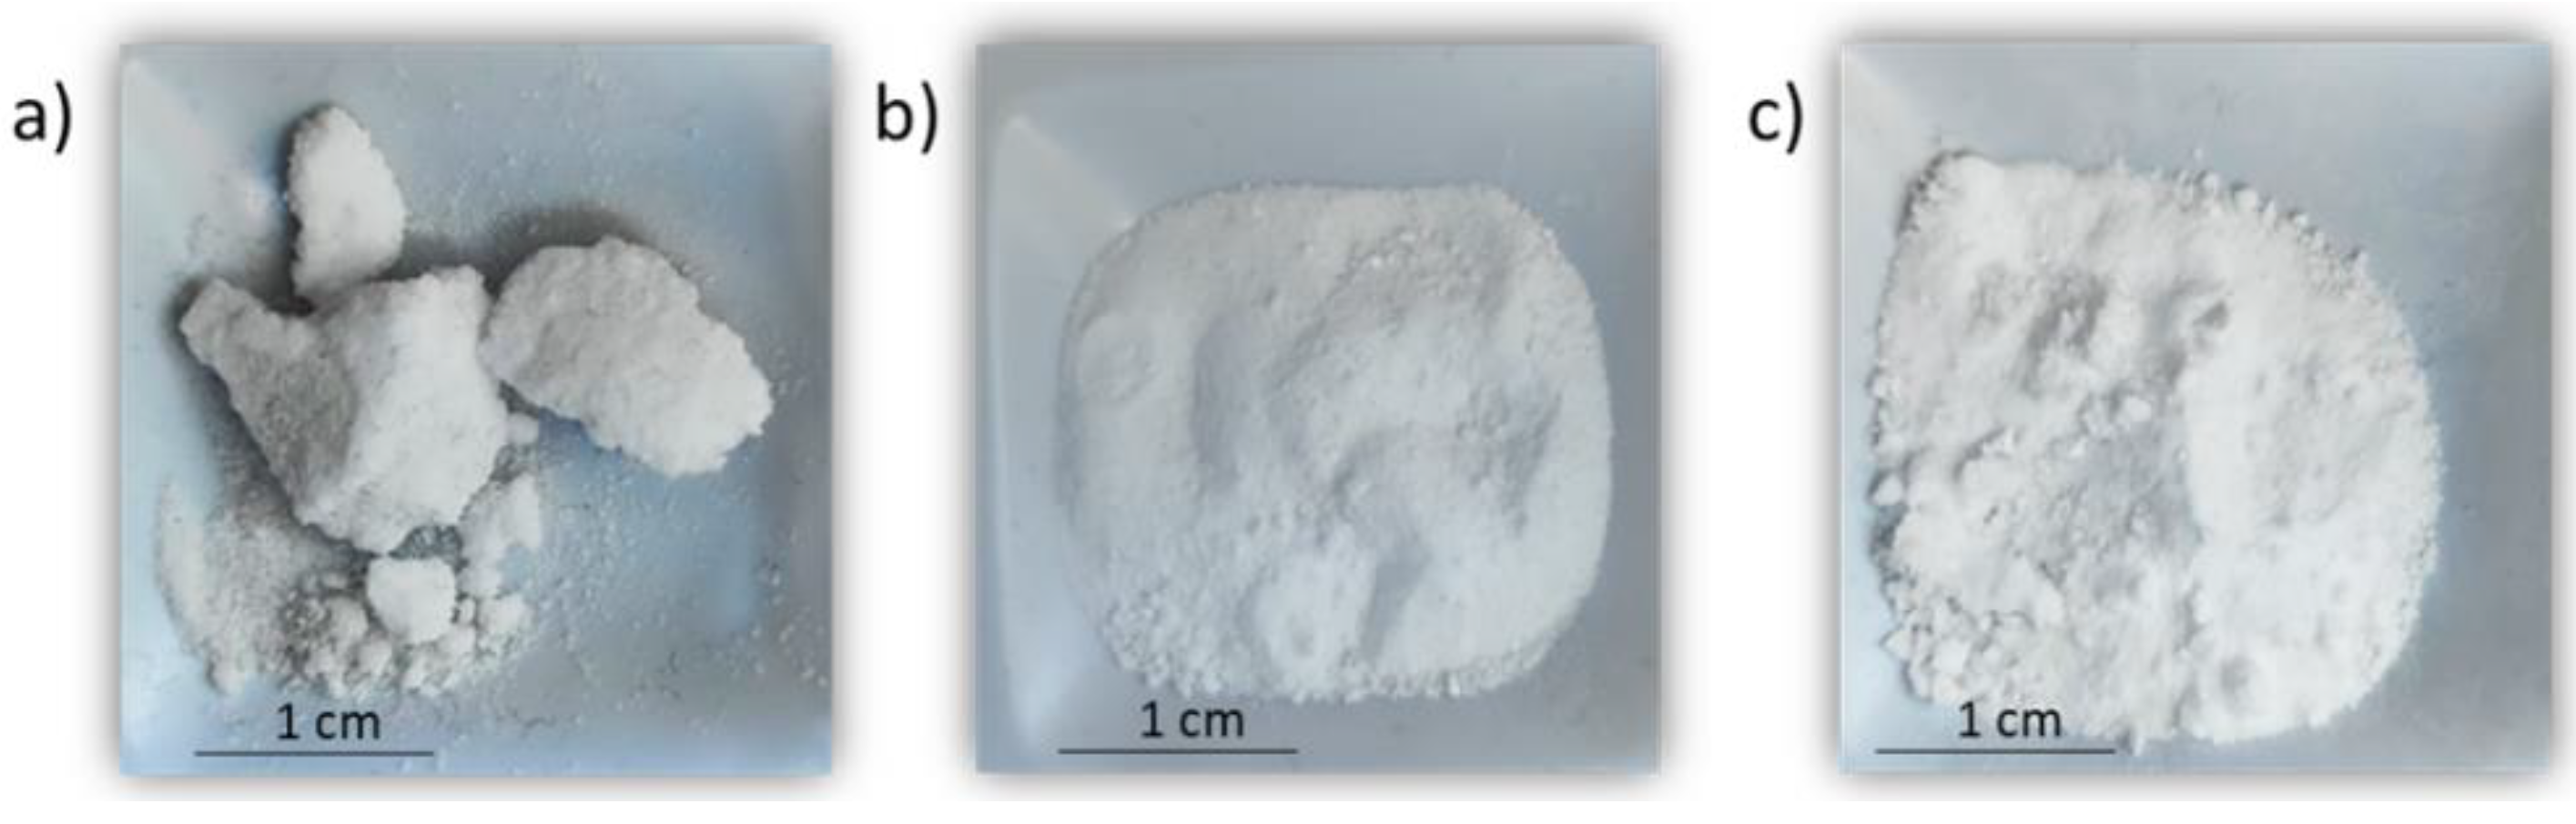
2.1. Nanofluids Sample’s Preparation

NaNO3 used to synthetize the NFs was Sigma Aldrich (99.995%), spherical SiO2 and Al2O3 NPs of 5–15 nm and 13 nm, respectively, of nominal diameter (both Sigma Aldrich, 99.5%) (Sigma Aldrich, St. Louis, MO, USA). The synthesis of the NFs were carried out through the following six steps (described in Figure 1): (1) weighting of NaNO3 and 1% of NPs (wt./wt.); (2) dissolving the mixture in 20 mL of distilled water; (3) sonicating during 20 min for a correct dispersion and homogenization of NPs in the solution; (4) drying in an oven at 105 °C until complete water evaporation and salt recrystallization; (5) grinding in an Agatha mortar; and (6) obtaining a representative sample by following the quartering standard methodology [39] with a hand-made riffle-splitter suitable for tiny amounts of sample.

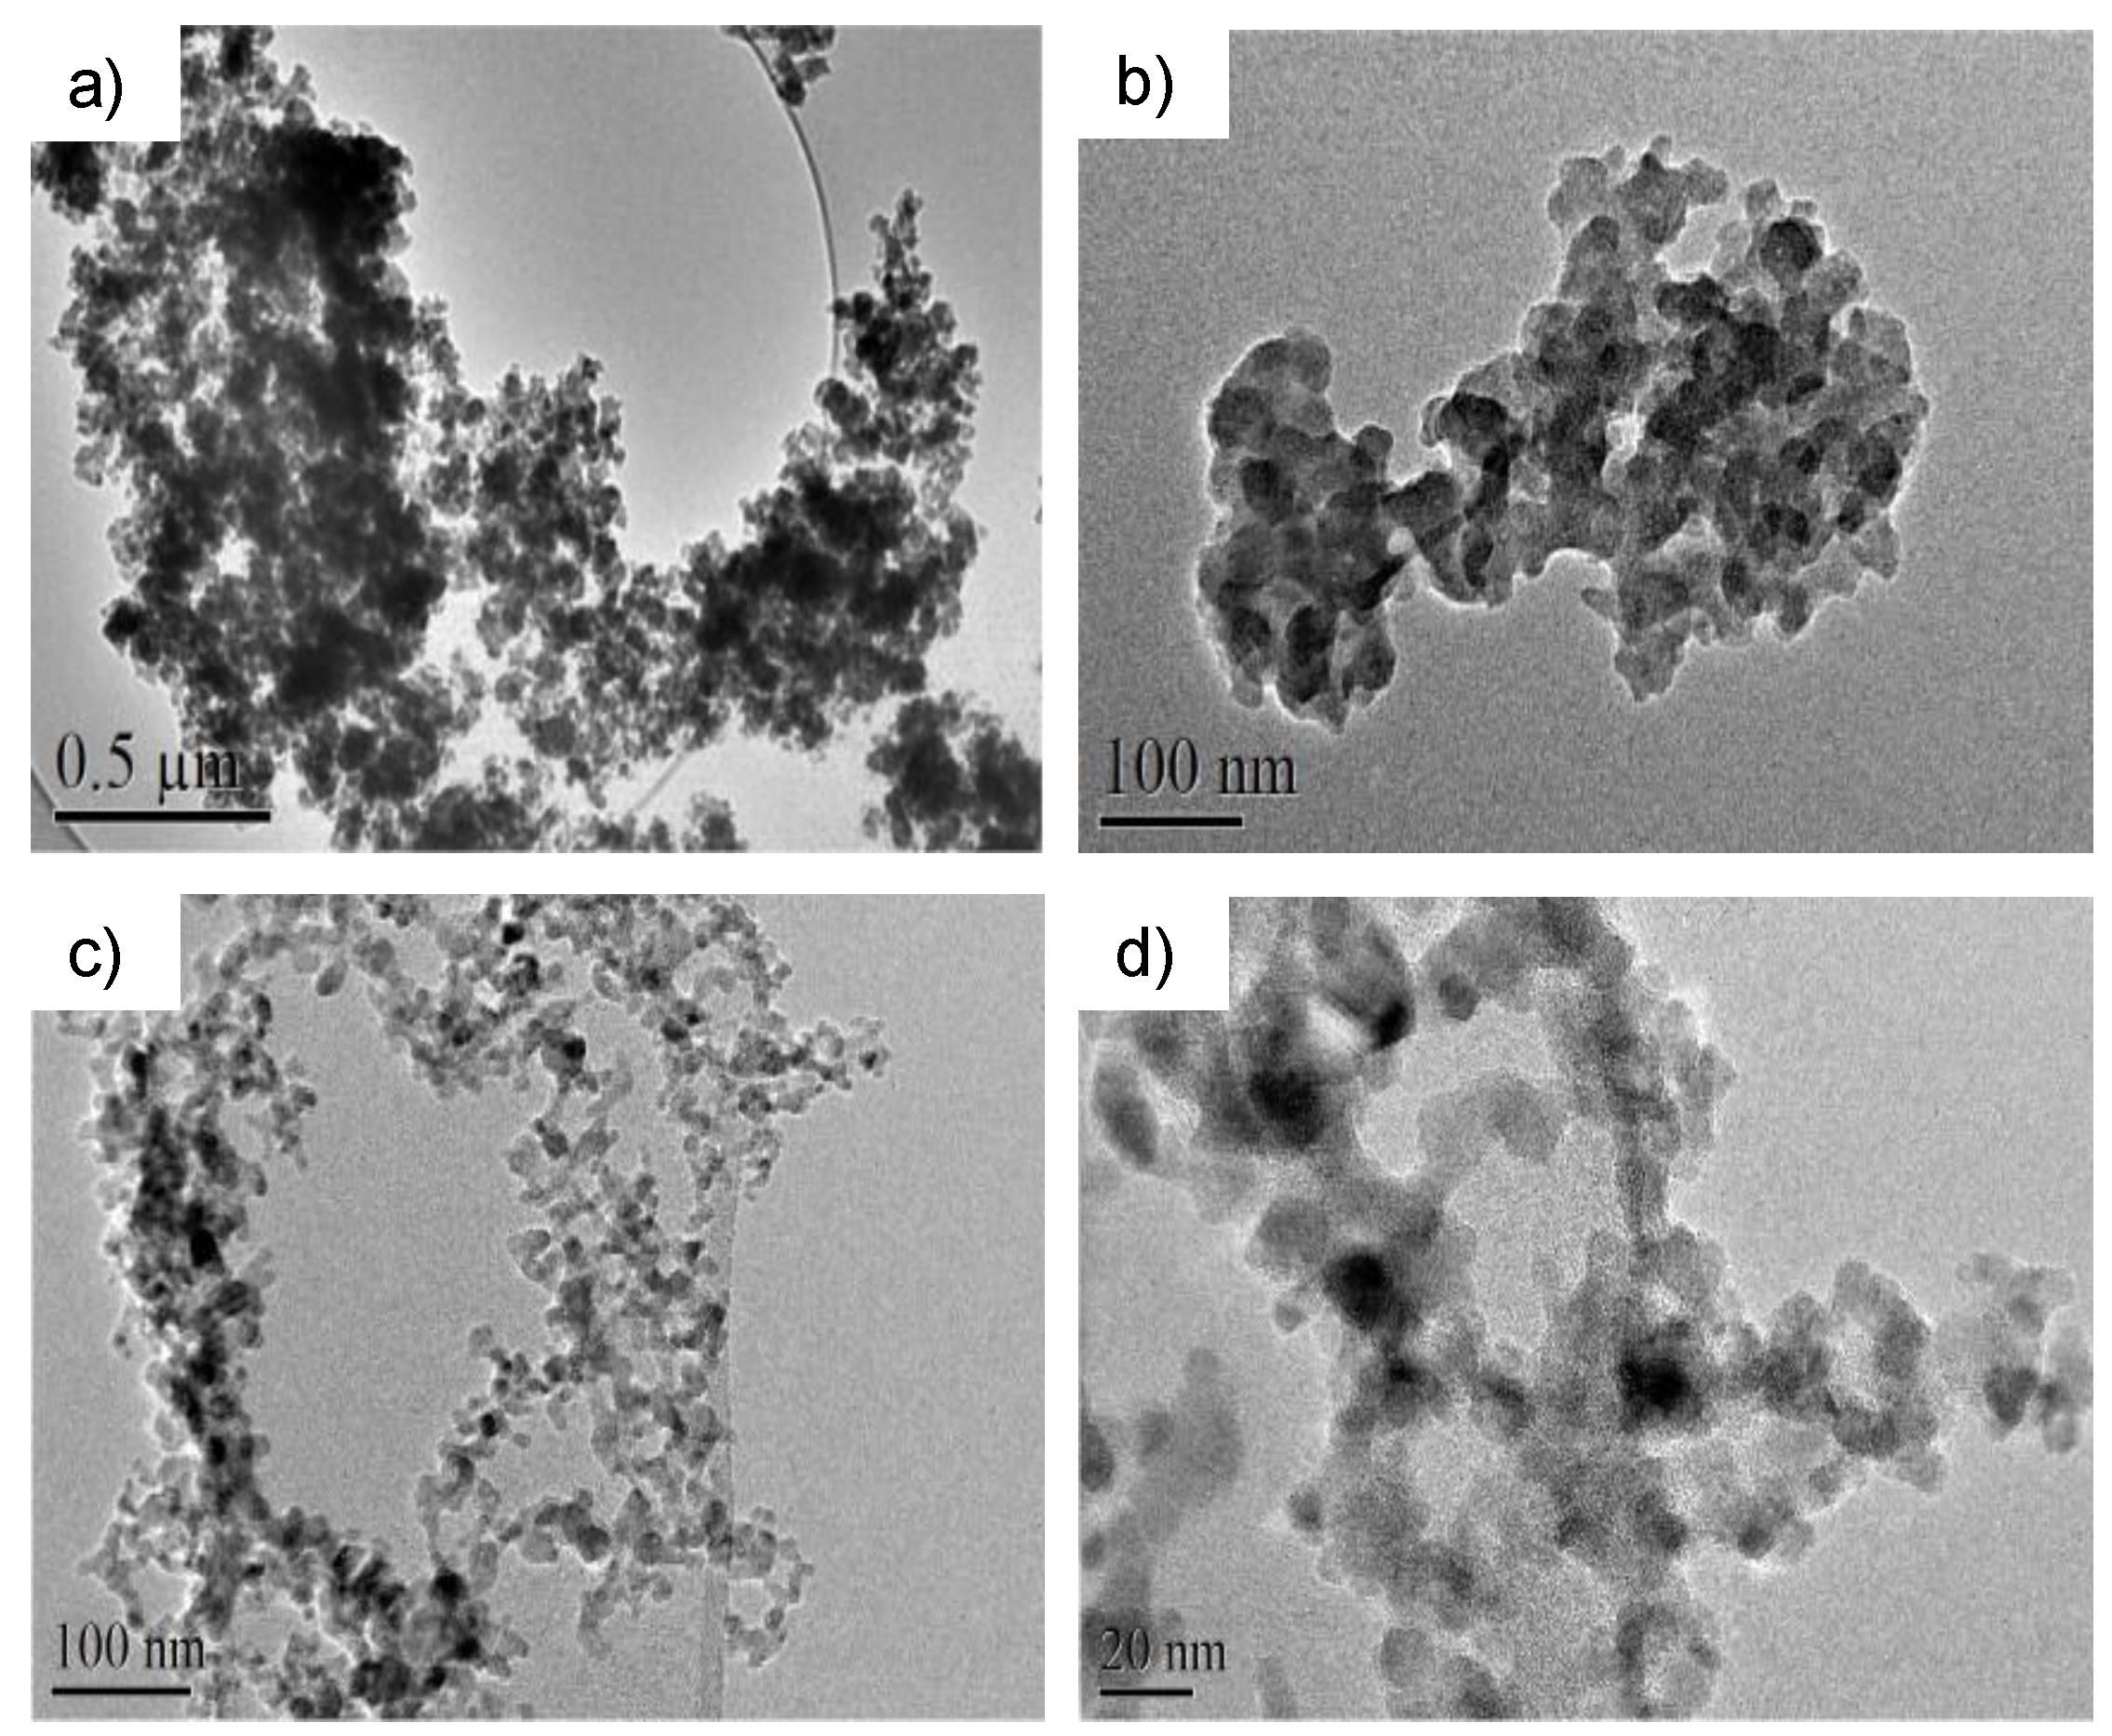
2.2. Transmission Electron Microscopy

A transmission electron microscope (TEM) JEOL JEM 2100 (JEOL, Tokyo, Japan) was employed to characterize the NPs. To proceed, NPs were dispersed in ethanol and sonicated by ultrasonic bath to avoid agglomeration.

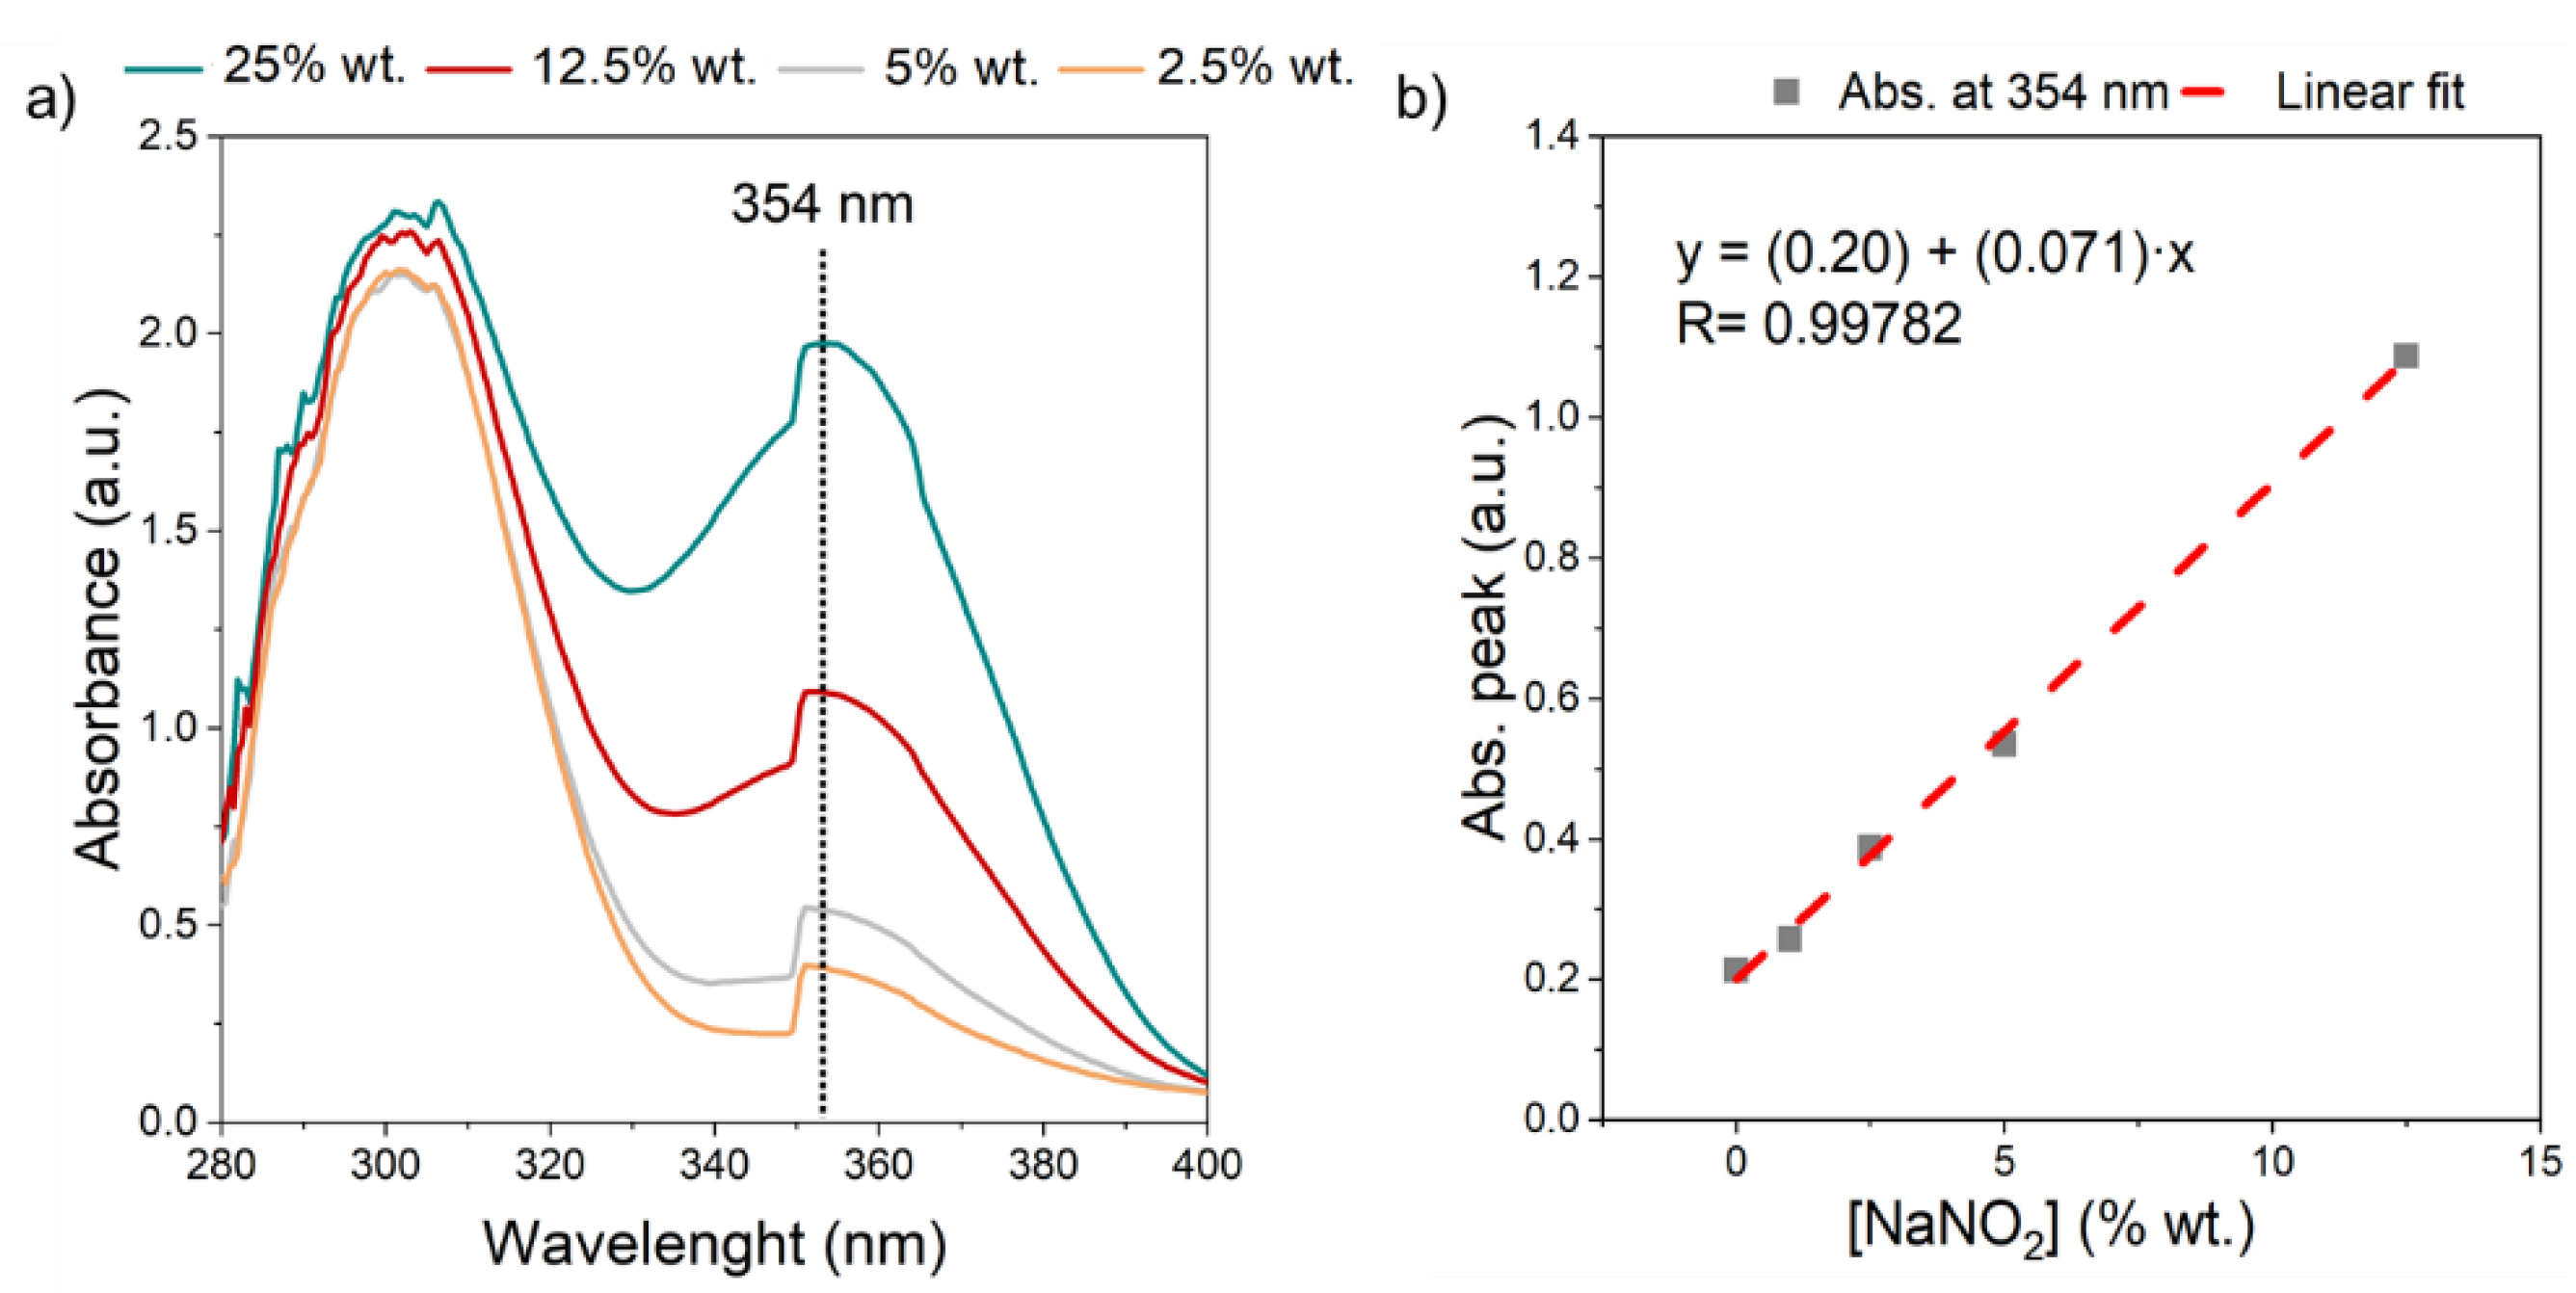
2.3. UV-Spectroscopy

A UV-Vis Spectrophotometer Shimadzu UV-1280 (Shimadzu, Kyoto, Japan) was employed to measure the absorbance and quantify the nitrite’s ion concentration (i.e., [ NO 2 ] ). The absorbance measurements were performed in the wavelength range between 230 to 600 nm. For this purpose, 10 independent samples were synthesized for each type of NP into pure sodium nitrate. First, each sample was subjected to different thermal treatments in a furnace at room temperature and then heated at intervals of 50 °C from in a temperature range between 50 and 500 °C. For each temperature, the sample was left in the furnace for around 30 min to ensure a homogeneous temperature of the sample. Subsequently, the samples were cooled into liquid nitrogen to freeze the structure at each temperature. After the thermal treatment, 0.3 M solutions were prepared by dissolving the samples in deionized water; moreover, 0.3 M sodium nitrate samples with different concentrations of sodium nitrite (2.5%, 5%, 12.5% and 25% and 100% wt.) were prepared for the nitrite calibration. The measurement uncertainty in the absorbance values was ±0.001 in arbitrary units.

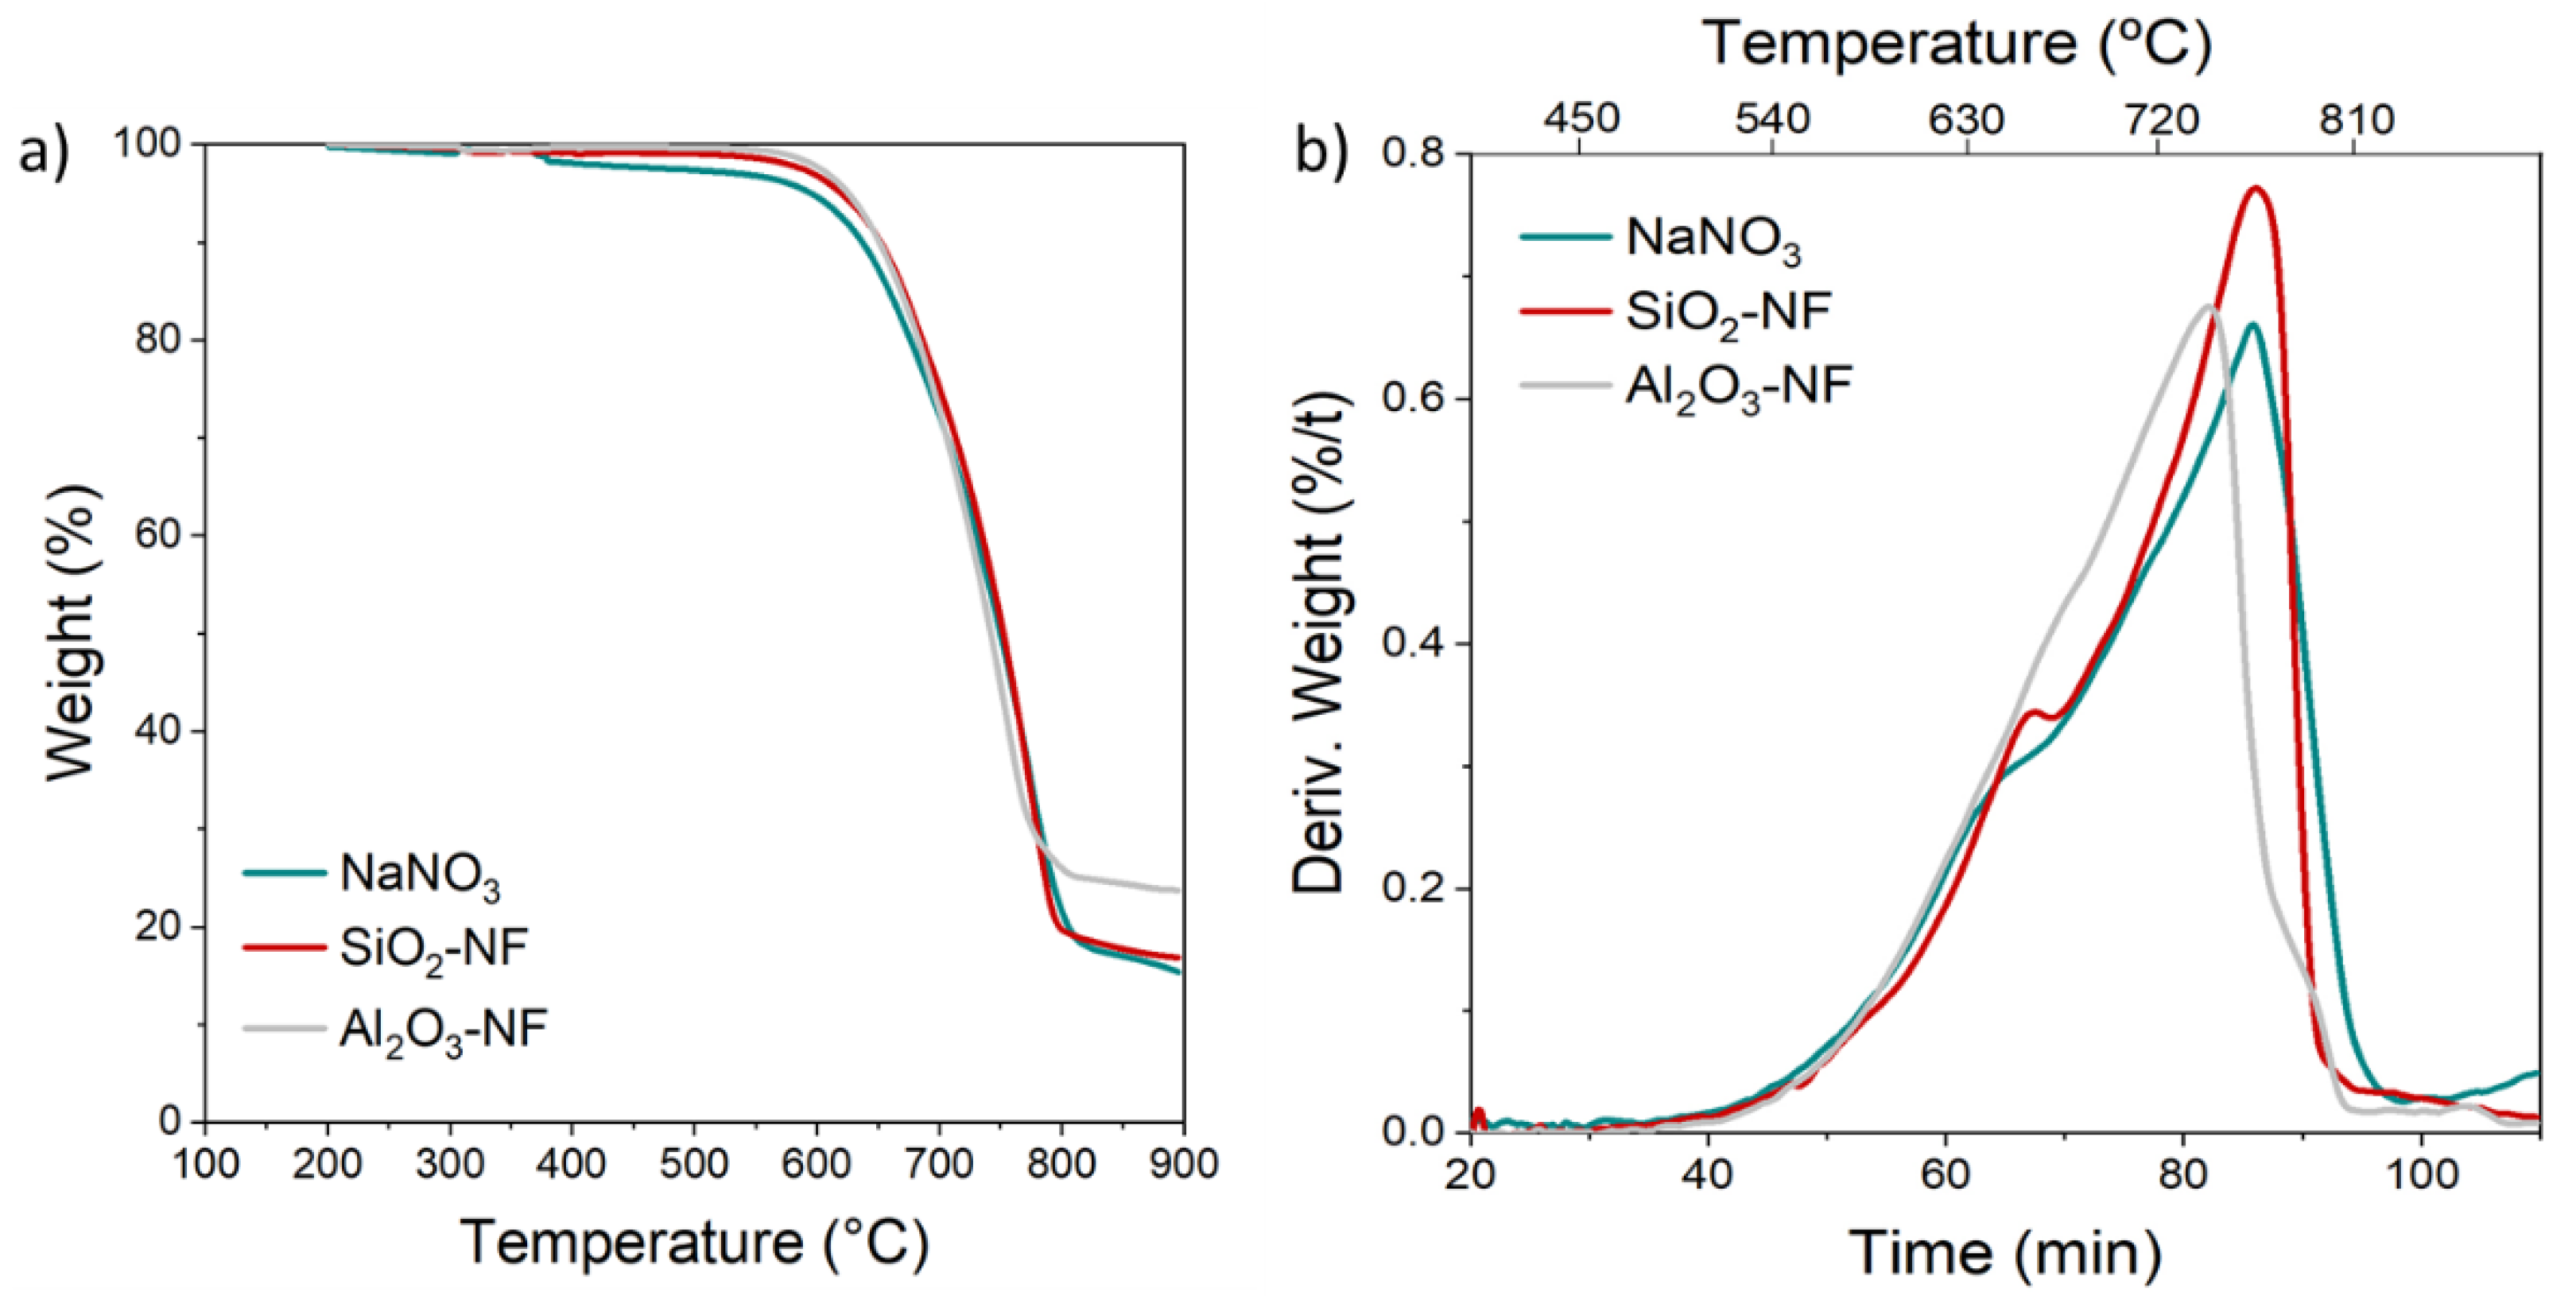
2.4. Thermogravimetric Analysis

To perform the thermogravimetric and differential thermogravimetric analysis (TG/DTG), a Q-600 SDT TA Instruments (TA instruments, New Castle, DE, USA) was used. Measurements were conducted from 30 °C to 900 °C at a heating rate of 10 °C min1 in air atmosphere with a gas flow of 100 mL min1. Each sample was prepared in standard aluminum crucibles with around 11 mg wt. Uncertainties were 0.5 °C for temperature, 1% for weight loss and 0.01% for mass.

2.5. pH

A pH and ion-meter GLP 22 from Crison (Crison Instruments, Alella, Spain) was employed to measure the pH of the samples at room temperature (29.5 ± 0.2 °C) with an uncertainty of 1%.

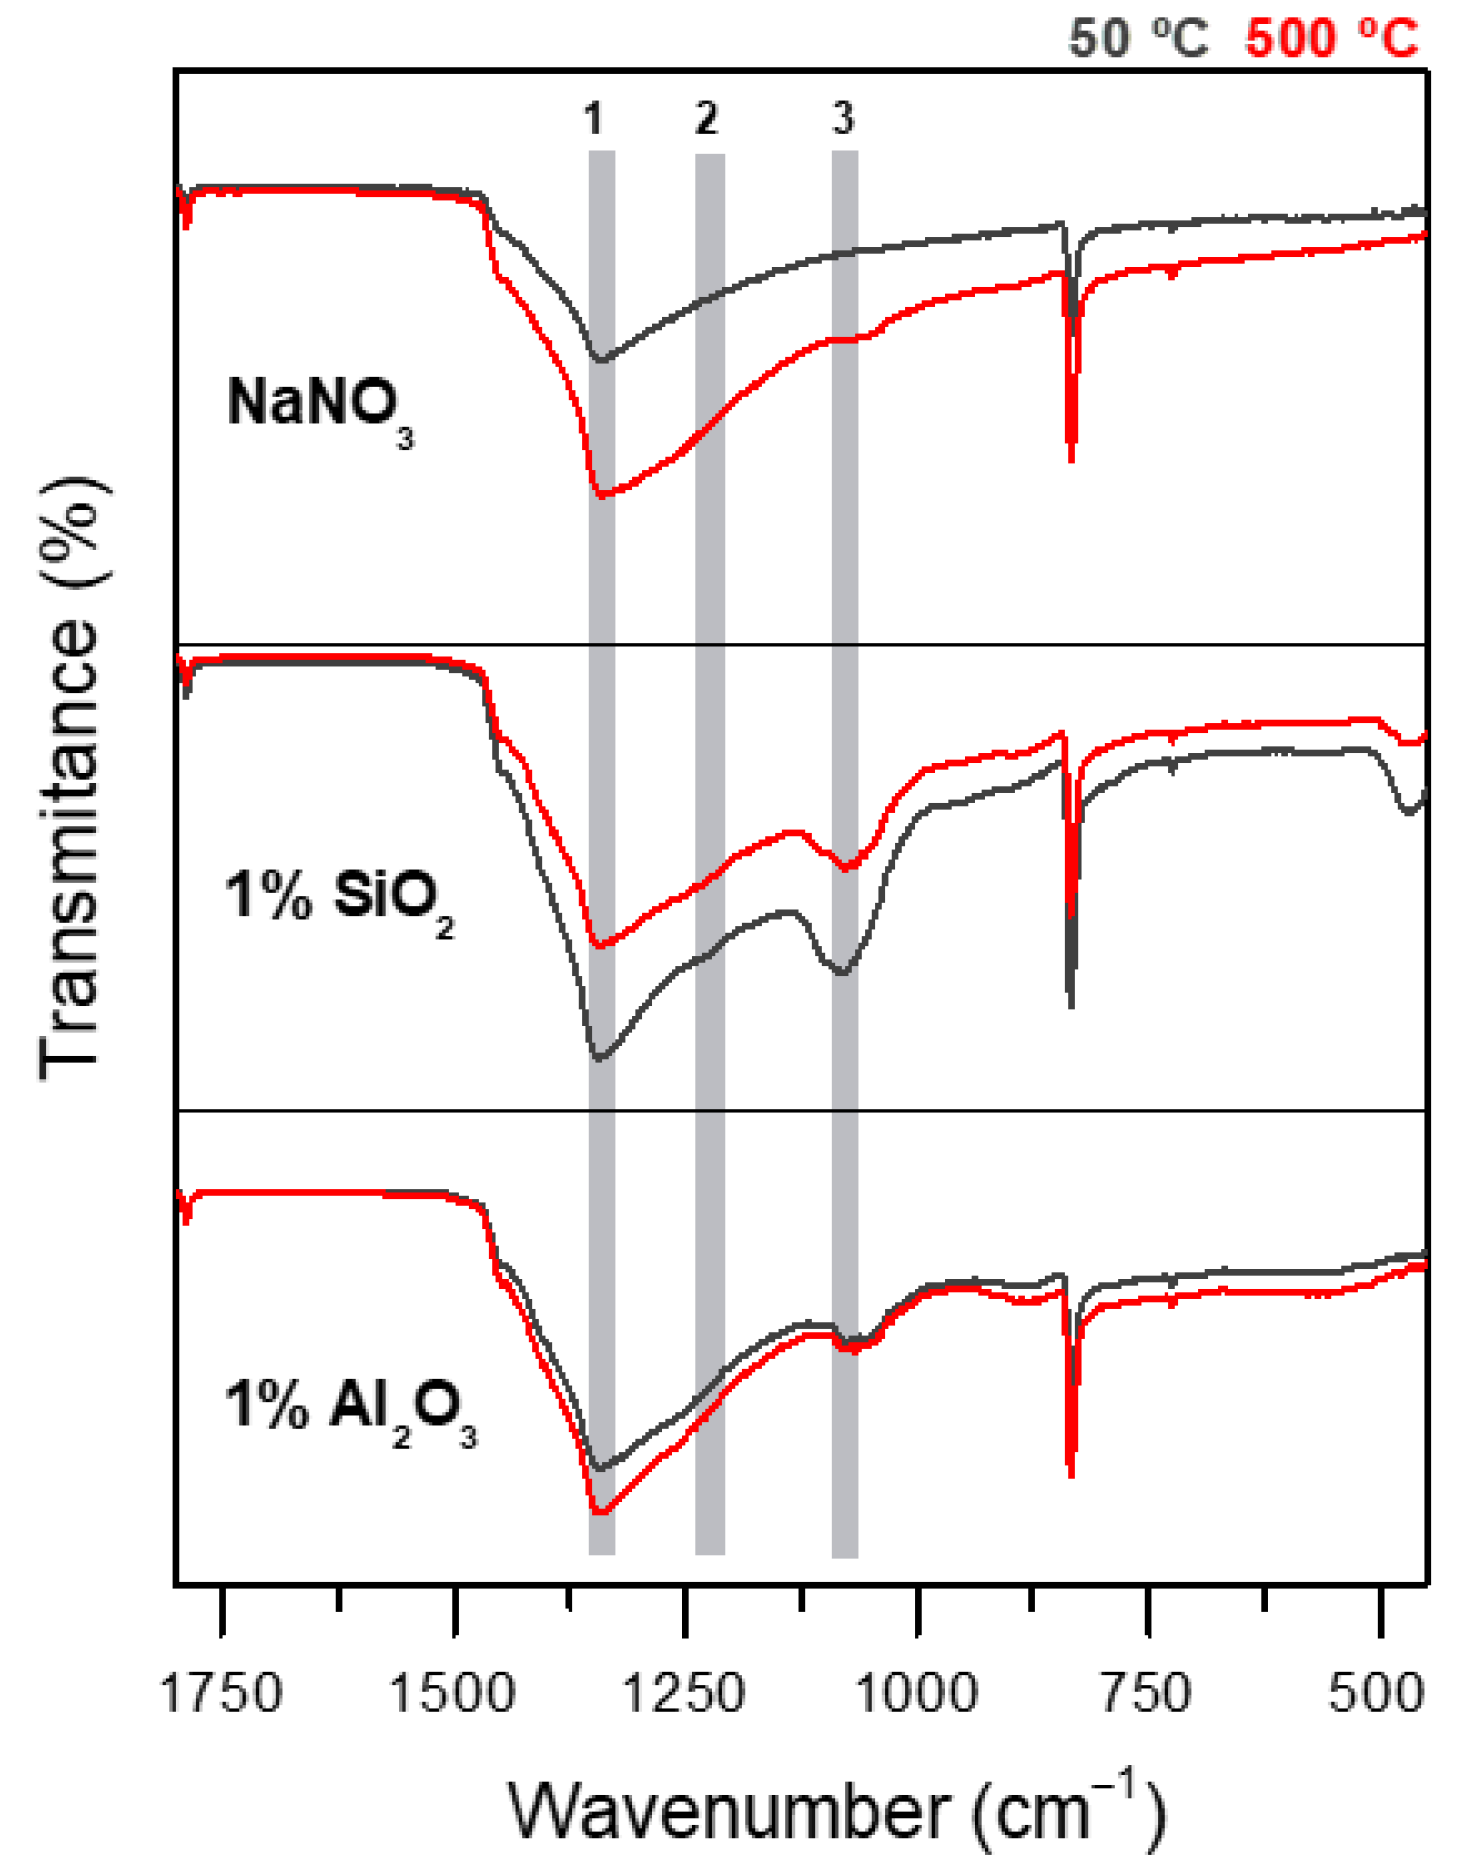
2.6. FT-IR Spectroscopy

Fourier Transform Infrared Spectroscopy with Attenuated Total Reflectance (FT-IR ATR) technique with a spectrometer TwoTM by PerkinElmer (PerkinElmer, Waltham, MA, USA) was used to determine the chemical composition. The instrumental error associated with the measure was 4 cm−1.

3. Results

3.1. Nanoparticle’s Characterization

The size and the concentration of the NPs are important parameters that govern the NF performance [40,41]. The characterization of the nanoparticles has been done through pure samples electronic microscopy. Thus, Figure 2 shows TEM images of the SiO2 and Al2O3 NPs. The silicon oxide NPs exhibit a higher degree of sintering, forming agglomerates of even more than one micrometer (Figure 2a,b). The SiO2 nanoparticles’ length and width were around: (12 × 25) nm2. On the contrary, alumina NPs have a nominal diameter in the range 10.8–12.3 nm (Figure 2c,d).

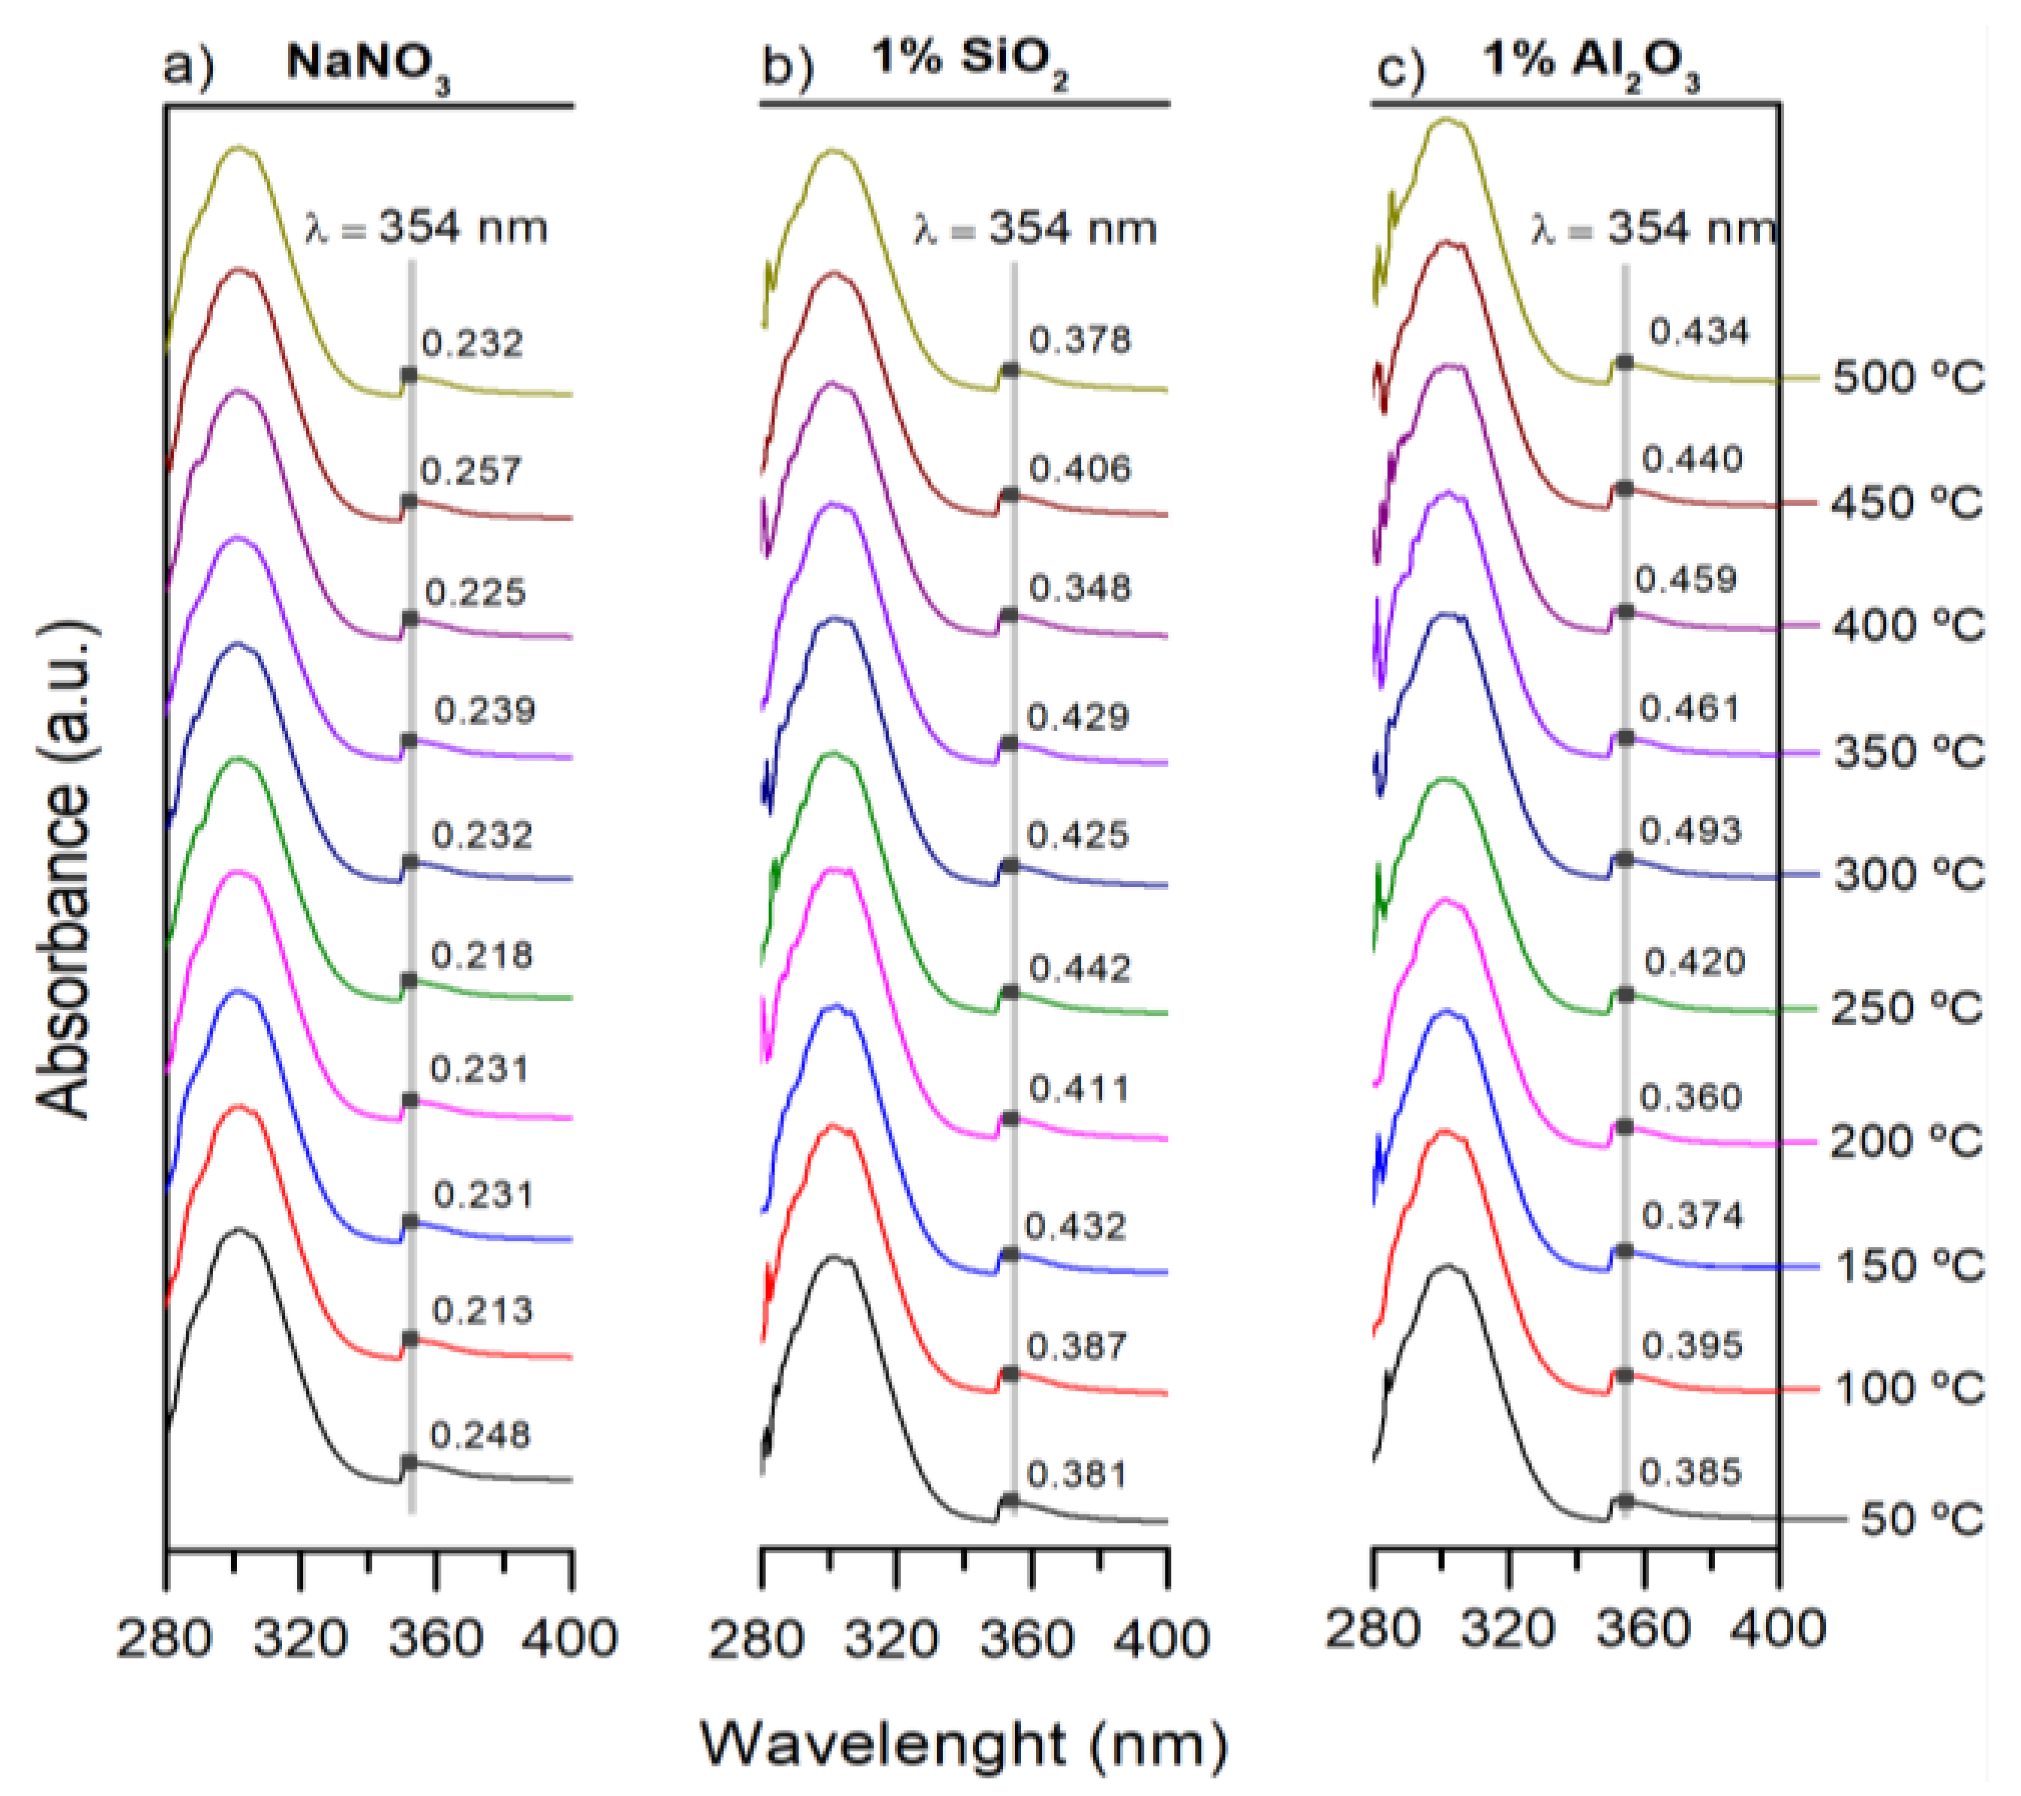
3.2. Nitrite Determination

Indirect methods based on UV and visible spectroscopy allow quantifying the nitrite concentration with an excellent limit of detection [42,43]. The UV-Vis absorption spectra were performed to NaNO3/NaNO2 mixtures samples for 0.3 M (in deionized water) at 2.5%, 5%, 12.5% and 25% wt. in NaNO2 concentration, Figure 3. The characteristic absorption peaks for [ NO 2 ] and [ NO 3 ] ions were found at 354 nm and 300 nm, respectively [43,44]. The most interesting result is the increase observed in the nitrite peak as the concentration increases from 2.5% to 25% wt., Figure 3a. The absorbance of nitrite peaks as a function of concentration (Figure 3b) exhibits a perfect linear trend with R = 0.99782, a = 0.19999 ± 0.01013 (intersection) and b = 0.0706 ± 0.00165 (slope) with a good accuracy, σ = ± 0.2.
Samples were exposed to different thermal treatments, from room temperature to 500 °C and then cooled in liquid N2 to freeze the structure at each temperature. Figure 4 shows the temperature evolution of the UV-Vis spectrum of pure 0.3M NaNO3 (Figure 4a), 0.3M NaNO3/SiO2 NF (Figure 4b), and 0.3M NaNO3/Al2O3 NF (Figure 4c); moreover, for each spectrum, the absorbance intensity at 354 nm was determined (grey line). For the pure NaNO3 and the two formulated NFs, an intensity difference in the nitrite peak with temperature was observed. Thus, Table 1 summarizes all the absorbance intensities at 354 nm as a function of the temperature; additionally, for each value, the predicted NaNO2 concentration was determined by the linear fit of Figure 3b. Both formulated NFs show a slight increase in the concentration of NaNO2 (absorbance of 0.378 and 0.434 for SiO2 and Al2O3 NPs at 1% wt. at 50 °C) in front of the pure NaNO3 (absorbance of 0.232 at 50 °C) caused by the presence of NPs. Therefore, the NPs modify the reaction kinetics of NaNO3 decomposition in the temperature range explored; moreover, Al2O3 NPs accelerate the nitrate-nitrite conversion even more than the SiO₂ NPs. This fact indicates that the nature of the NPs influences the chemical degradation of NFs, and thus, the more alkaline NPs (Al2O3 > SiO2) the greater variation in absorbance for the temperature range; however, it is remarkable that the maximum concentration of NaNO2 was around 300 °C for the 2 NFs. Despite this, it is noteworthy that the maximum NaNO2 concentration was less than 4 ± 0.2% for the two NFs and less than 0.8 ± 0.2% for the pure NaNO3, Figure 5.
Nonetheless, the nitrite concentration in the aqueous solution is strongly pH-dependent. At pH values higher than 5 (pH > 5), the literature suggests that the UV absorbance have good linearity with nitrite concentration [45]. To corroborate the adjustment and then, the nitrite concentration, the pH was measured for all the samples of Table 1 and the results are summarized in Table 2. The pH values were in the range 5–7; furthermore, with the addition of both NPs, the acidity of the NFs slightly decreases (i.e., the pH increases). Since the pH of the dissolution of nitrite was 7.08 ± 0.01, the increase of pH in the two formulated NFs was in accordance with the increase of NaNO2 concentration in the samples obtained from the linear fit in Table 1.
To corroborate and validate the nitrite formation, FT-IR spectroscopy was employed to determine the chemical composition of the samples. The FT-IR spectra for pure NaNO3 and the two NFs after thermal treatments at 50 °C and 500 °C, are shown in Figure 6. There are several vibrational bands that allow to identify the NaNO3-NaNO2 conversion, three of them are: (1) the relative intensity of the band at 825 cm−1 corresponding to the bending mode ν2 of NO 2 . The relative intensity of this mode decreases with the increase of [ NO 2 ] also observing a slight shift of the mode frequency from 835 cm−1 to 825 cm−1. (2) Modification of the band contour of the ν4 mode, 725 cm−1, that corresponds to the asymmetric in-plane bending mode; this band begins to appear as the [ NO 3 ] decrease for x = 0.6 ( [ NO 2 ]   [ NO 3 ]   ) and exhibits a slight shift from 725 cm−1 to 715 cm−1. (3) The narrowing of the band located around 1358 cm−1, corresponding to the asymmetric stretching mode of [ NO 3 ] , and the presence of the band at 1271 cm−1, corresponding to one of the fundamental vibrational modes of NaNO2, ν3 [46,47]. Nonetheless, at low [ NO 2 ] concentrations, band (3) is the only that can monitor the evolution of nitrite concentration [48,49]. Figure 5 shows the 3 bands: (1) ~1358 cm−1, (2) ~1270 cm−1, and (3) ~1100 cm−1. All the samples, except for NaNO3, show the presence of the tiny band (2) and a slight broadening of the band (1) as temperature increases. The relative intensity of the band (2) is increased in the NFs samples, indicating a high nitrite formation in comparison to pure NaNO3. The low intensity of this band agrees with the low [ NO 2 ] concentrations determined in Table 1; additionally, the presence of the band (3) in the NaNO3 sample at 500 °C, is a good indicator of the presence of low [ NO 2 ] concentrations, between x = 0.1/0.2 [48,49,50]. In the NFs spectra this band appears with higher intensity corroborating the [ NO 2 ] formation. Nonetheless, in the case of SiO2 NFs, this band overlaps with the asymmetric stretching of SiO2, causing a higher band intensity.

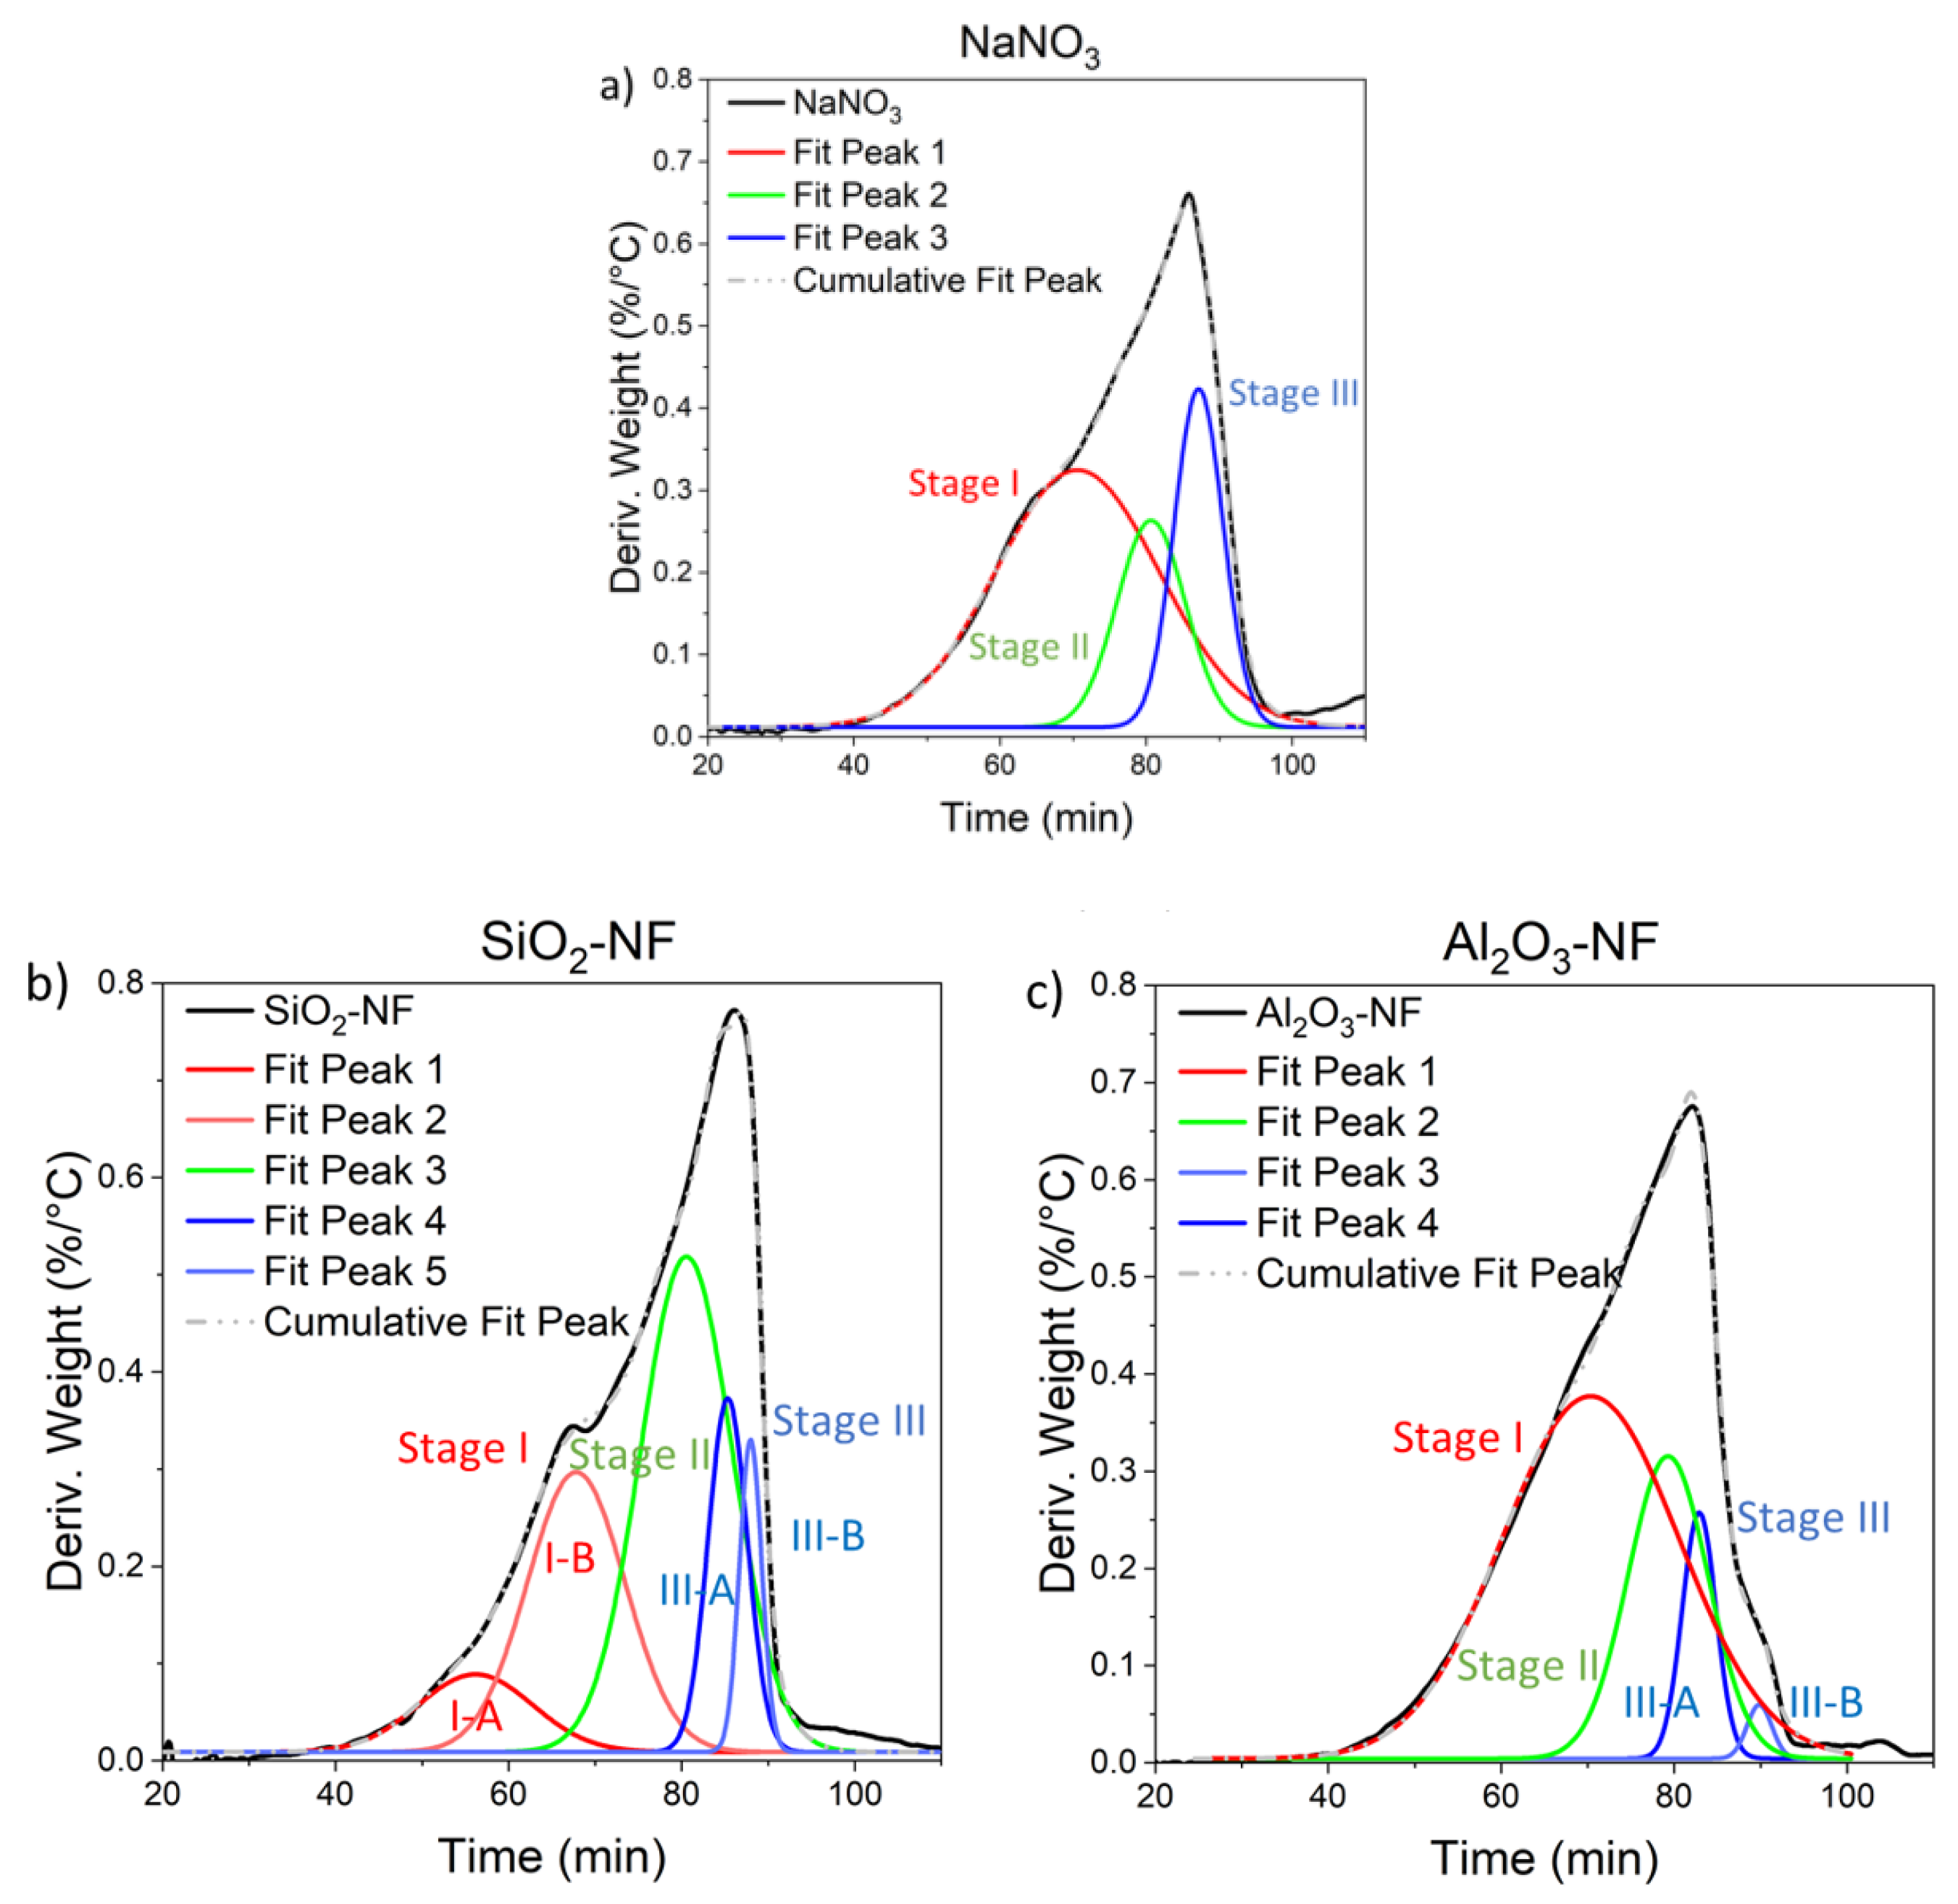
3.3. Nanofluids Reaction Kinetics and Decomposition

The increase of NaNO2 concentration in the NFs indicates a change in the reaction kinetics of NaNO3 decomposition. To study the effect of the NPs in the decomposition of NaNO3, the sample weight loss and derivative weight over time from 100 to 900 °C were evaluated in Figure 7. In the temperature range between 100 and 500 °C, Figure 7a, no significant weight loss was observed for pure NaNO3 and NaNO3/SiO2, NaNO3/Al2O3 NFs. The maximum weight loss was 2.5% in the case of pure NaNO₃ and lower than 1% for the two formulated NFs. Hence, NFs were slightly more stable than the pure NaNO3. On the other hand, due to the limit of detection (1%) in the weight loss, it is not possible to identify the low NaNO3-NaNO2 conversion determined in Table 1. Conversely, the NFs samples did not show any relevant change in the temperature range sampled, and they start to decompose around 600 °C, as previously suggested for pure NaNO3 [51]. It is remarkable that after the total decomposition, ≈800 °C, the weight loss of Al2O3-NF was lower than SiO₂ NF and pure NaNO3.
Figure 7b, shows the derivative of the weight (d(%/t)), as a function of time. The derivative of weight loss gives information of the reaction kinetics. Dissimilar behaviours were identified. Two main peaks were observed for the three samples, approximately between 278–699 °C (around 60 min) and at 730–775 °C (between 80–86 min), respectively. On the other hand, a third peak was observed for the AlO3 NF sample over 795 °C (around 90 min) The principal decomposition peak (around 80 min) shows a variation in time and temperature. Consequently, a variation in the reaction kinetics and the thermal stability of the salt (i.e., the equilibrium constants and the activation energy) are modified with the addition of AlO3 and SiO2 NPs. Table 3 summarizes all the main identified temperature peaks and the associated weight loss.
The lowest weight loss before the beginning of the decomposition above 600 °C can be explained by the lower hygroscopicity of NFs; the NPs help to reduce the moisture absorption. Figure 8 illustrates the change that experiments sodium nitrate after one year of exposure at room temperature when it is pure (a) and in the presence of SiO2 (b) and Al2O3 (c) NPs. Pure NaNO3 showed more aggregates than sodium nitrate with the presence of NPs due to moisture absorption; this behaviour is a relevant finding on the point of view of molten salts application because their high hygroscopicity in contact with environment increases the damage of metal compounds present in the plant [52,53]; thus, this effect is reduced considerably with the presence of NPs.
To better understand the thermal decomposition and to relate the TGA profiles to the possible reactions involved, the deconvolution of the TGA peaks have been statistically performed by a Gaussian fit [54]. A total of 15 reactions have been taken into consideration corresponding all to nitrate-nitrite conversions and to sodium oxides decompositions:
NaNO 3 ( s ) NaNO 2 ( s ) + 1 2 O 2 ( g )
NO 3 ( l ) NO 2 ( l ) + 1 2 O 2 ( g )
NO 3 ( l ) + 1 2 O 2 ( g ) NO 2 ( l ) + O 2 ( g )
NaNO 2 ( l ) 1 2 Na 2 O ( s ) + NO + 1 4 O 2 ( g )
NaNO 2 ( l ) 1 2 Na 2 O 2 ( s ) + NO ( g )
2 NaNO 3 ( l ) Na 2 O ( l ) + NO 2 ( g ) + NO ( g ) + O 2 ( g )
2 NaNO 2 ( l ) + 2 NO ( g ) 2 NaNO 3 ( l ) + N 2 ( g )
NaNO 2 ( l ) + NO 2 ( g ) NaNO 3 ( l ) + NO ( g )
Na 2 O 2 ( s ) + 2 NO 2 ( g ) NaNO 3 ( l ) + NaNO 2 ( l ) + 1 2 O 2 ( g )
NaNO 2 ( l ) 1 2 Na 2 O ( s ) + NO ( g ) + 1 4 O 2 ( g )
Na 2 O 2 ( s ) Na 2 O ( s ) + 1 2 O 2 ( g )
Na 2 O 2 ( s ) + 1 2 O 2 ( g ) 2 NaO ( s ) + 1 2 O 2 ( g )
Na 2 O 2 ( s ) Na 2 O ( s ) + 1 2 O 2 ( g )
2 NaNO 2 ( l ) Na 2 O ( s ) + N 2 + 3 2 O 2
2 NaNO 3 ( l ) Na 2 O ( s ) + N 2 ( l ) + 5 2 O 2 ( g )
Figure 9 shows the TGA peak deconvolution and the cumulative fit peak (grey dotted line) for pure NaNO₃ (Figure 9a), for SiO₂ NF (Figure 9b) and AlO₃ NF (Figure 9c). All the Gaussian models (cumulative fit peak) show a good fitting (i.e., R2 = 0.996, 0.998 and 0.999 for pure NaNO3, SiO2 and Al2O3 NFs, respectively); moreover, Table 4 summarizes the parameters of the deconvoluted peaks and also the reactions that contribute to each of them.
Three main stages were identified in the peak deconvolution of NaNO3 in Figure 9a. The decomposition of NaNO₃ has been well studied in the literature [55,56,57,58,59], and it is known that at high temperatures as a result of its decomposition, nitrite and sodium oxides species coexist; moreover, the decomposition process of nitrate salt can be subdivided into several stages that occur simultaneously and/or consecutively.
Stage I: The first identified stage corresponds to the solid-state reaction of formation of NaNO2, above the melting temperature to 450 °C, according to Equation (1). The equilibrium of this reversible reaction depends on the temperature and, above 600–730 °C, the backward reaction with oxygen is slower than the decomposition [55], Equation (2). In Stage I-B occurs the oxidation-decomposition processes, Equations (2) and (3); this peak reaches the maximum value at 697.3 ± 0.5 °C (at a velocity of 9.88 ± 0.01 °C/min) for pure NaNO3. Noticeably, the same peak for SiO2 NF (Figure 9b) and for Al2O3 NF (Figure 9c) appears shifted at lower temperatures (i.e., −14.3 ± 0.7 °C and −1.6 ± 0.7 °C, respectively). Furthermore, the addition of SiO2 NPs make that the single peak decomposes into two peaks (I-A and I-B), varying the decomposition kinetics of Equations (1)–(3). Specifically, an initial decomposition stage appears, Stage I-A, with a maximum at 625.8 ± 0.5 °C, with highest reaction kinetics (11.1 ± 0.1 °C/min); therefore, the addition of NPs drives to an acceleration of decomposition at lower temperatures than pure NaNO3 (Table 3).
Stage II: In the intermediate stage, from 450 to 700 °C, the first-order liquid-liquid reaction occurs, the reverse reaction in the melt sodium nitrite to form sodium nitrate (oxidation-decomposition) Equation (2); this reverse equation is possible due to the formation of NaO₂ or Na2O2 as intermediates during the decomposition of sodium nitrite, Equations (4)–(10). When the equilibrium of Equation (2) was displaced to the decomposition, the formation of O2 and NO is favoured. Therefore, the Equation (4) becomes the most kinetically and energy-favoured reaction [56]. A single peak was identified for the three samples in this stage. The maximum of this stage for NaNO3 occurs at 747.9 ± 0.5 °C. A decrease of temperature was observed only with Al2O3 NPs (−9.4 ± 0.5 °C). Therefore, the presence of Al2O3 NPs drives to a NaNO2 decomposition, Equations (4)–(10), at lower temperatures.
Stage III: Finally, above 700 °C, a reaction of NaNO2 and direct decomposition of NaNO3 occurs with the formation of Na2O and release of nitrogen oxides [55], Equations (11)–(15). In the case of pure NaNO3 the reaction occurs with a single step, stage III-A, with a maximum at 781.2 ± 0.5 °C. The presence of this peak confirms that Na2O2 and/or NaO2 are formed as intermediates for the formation of Na2O, Equations (11)–(15), [60]. In contrast, the decomposition to Na2O for NFs follow two steps: III-A and III-B described by parallel reactions. The initial decomposition stage for NFs, III-A, starts at lower temperature than the pure NaNO3 (and at lower times). The peak temperature decreases by −9.8 ± 0.7 °C and −22.3 ± 0.7 °C with SiO2 and Al2O3 NPs, respectively, in comparison to pure NaNO3. Contrarily, in the final reaction process, III-B, the maximum peak temperature increases +4.2 ± 0.7 °C with SiO2 NPs and 13.9 ± 0.7 °C with Al2O3 NPs.
Consequently, the presence of NPs produces an acceleration of the decomposition of nitrates through the sequence NaNO3-NaNO2-Na2O2, and a shift to high temperatures in the formation of Na2O. Despite the final decomposition occurs at higher temperatures, it occurs at lower times. Accordingly, the NFs need higher temperatures and lower times to decompose than the pure salt confirming the role of NPs as catalysts of decomposition reactions.
Moreover, some authors described a chemical reaction between NaNO3 and NPs, generating new intermediate species like Na2SiO3 [61,62]. To corroborate the reactivity between the NPs and NaNO3, the final product of the two NFs after the thermal treatment (after stage III, 850 °C) was analysed by FT-IR. Figure 10, shows the comparison between FT-IR spectra at 500 °C and 850 °C, for the two NFs. The identified bands at the regions (1–4), indicate the formation of new species. In the case of presence of Al2O3 NPs, these bands indicated the formation of species like NaAlO2 [63]. Similarly, the presence of SiO2 NPs favours the formation of NaSiO2. The bands in the region (1) and (4) indicate the mixed formation of NaSiO2 and Na2SiO3 [64]; this fact can explain the variation in decomposition rates and temperatures, as demonstrated by the study carried out by Y. Hoshino et al. [49], with the addition of several oxides at the μm scale into NaNO3.

4. Conclusions

The effect of the incorporation of nanoparticles on the thermal stability of NaNO3 was investigated in this study. Through UV-Vis spectroscopy and thermogravimetric analysis, NaNO2 concentration and decomposition were studied for pure NaNO3 and two NaNO3-based nanofluids formulated with 1% wt. of SiO2 and Al2O3 nanoparticles, respectively. Three key findings were achieved:
  • Detection of higher nitrite concentration (up to 4% wt.) than pure NaNO3 (up to 0.8% wt.), due to the presence of nanoparticles in the temperature range from 50 °C to 500 °C. Al2O3 nanoparticles cause a higher nitrate-nitrite conversion than SiO2 nanoparticles.
  • The presence of nanoparticles increases thermal stability to over 600 °C before starting to decompose. In addition, with Al2O3 nanoparticles, weight loss at 900 °C was about 6% lower than NaNO3.
  • Three main reaction stages were identified in the NaNO3 decomposition in accordance with the literature. These decomposition stages are altered by the presence of nanoparticles. First, SiO2 and Al2O3 nanoparticles reduce the decomposition temperatures of NaNO3-NaNO2-Na2O2 up to 7 °C. Even so, the reactions involved were accelerated by the presence of nanoparticles. Particularly, SiO2 NPs accelerate the reactions more than Al2O3 NPs. Second, the final decomposition to Na2O occurs at higher temperatures (up to 14 °C) than pure NaNO3. Nonetheless, the final decomposition takes place in shorter times.
In view of these results, the nanoparticles act as catalyst for the reactions; however, at temperatures above 500 °C, nanofluids exhibit higher thermal stability than pure NaNO3 despite the slight increase in nitrite concentration. To conclude, this study demonstrates the adequacy of the use of UV-Vis absorption and deconvolution of the TGA signal to study nitrite concentration and reaction kinetics.

Author Contributions

Conceptualization, A.S.-S., P.G. and A.I.F.; methodology, A.S.-S., S.H.-H. and P.G.; formal analysis, A.S.-S.; investigation, A.S.-S.; resources, P.G., C.B. and A.I.F.; data curation, S.H.-H., A.C. and A.S.-S.; writing—original draft preparation, A.S.-S.; writing—review and editing, A.C., P.G., C.B. and A.I.F.; visualization, A.S.-S.; supervision, P.G. and A.I.F.; funding acquisition, P.G. and A.I.F. All authors have read and agreed to the published version of the manuscript.

Funding

This research was partially funded by the Spanish government RTI2018-093849-B-C32, RTI2018-094757-BI00, MDM-2017-0767, MCIU/AEI/FEDER, UE. DIOPMA is a certified agent TECNIO in the category of technology developers from the Government of Catalonia. The authors would like to thank the Catalan Government for the quality accreditation given to their research groups DIOPMA (2017 SGR 118) and CMSL (2017 SGR 13). A.S.-S. thanks to Generalitat de Catalunya and AGAUR for her Grant FI-DGR 2018 and S.H.-H. is grateful to the Generalitat de Catalunya and the Universitat de Barcelona for the research grant, APIF-DGR 2018. Finally, P.G. thanks Generalitat de Catalunya for his Serra Húnter Associate Professorship.

Institutional Review Board Statement

Not applicable.

Informed Consent Statement

Not applicable.

Conflicts of Interest

The authors declare no conflict of interest. The funders had no role in the design of the study; in the collection, analyses, or interpretation of data; in the writing of the manuscript, or in the decision to publish the results.

References

  1. Choi, S.U.S.; Li, S.; Eastman, J.A. Measuring thermal conductivity of fluids containing oxide nanoparticles. J. Heat Transf. 1999, 121, 280–289. [Google Scholar] [CrossRef]
  2. Awais, M.; Bhuiyan, A.A.; Salehin, S.; Ehsan, M.M.; Khan, B.; Rahman, M.H. Synthesis, heat transport mechanisms and thermophysical properties of nanofluids: A critical overview. Int. J. Thermofluids 2021, 10, 100086. [Google Scholar] [CrossRef]
  3. Assael, M.J.; Antoniadis, K.D.; Wakeham, W.A.; Zhang, X. Potential applications of nanofluids for heat transfer. Int. J. Heat Mass Transf. 2019, 138, 597–607. [Google Scholar] [CrossRef]
  4. Svobodova-Sedlackova, A.; Barreneche, C.; Alonso, G.; Fernandez, A.I.; Gamallo, P. Effect of nanoparticles in molten salts—MD simulations and experimental study. Renew. Energy 2020, 152, 208–216. [Google Scholar] [CrossRef]
  5. Cuce, E.; Cuce, P.M.; Guclu, T.; Besir, A.B. On the use of nanofluids in solar energy applications. J. Therm. Sci. 2020, 29, 513–534. [Google Scholar] [CrossRef]
  6. Xiong, Q.; Hajjar, A.; Alshuraiaan, B.; Izadi, M.; Altnji, S.; Shehzad, S.A. State-of-the-art review of nanofluids in solar collectors: A review based on the type of the dispersed nanoparticles. J. Clean. Prod. 2021, 310, 127528. [Google Scholar] [CrossRef]
  7. Du, R.; Jiang, D.D.; Wang, Y.; Shah, K.W. An experimental investigation of CuO/water nanofluid heat transfer in geothermal heat exchanger. Energy Build. 2020, 227, 110402. [Google Scholar] [CrossRef]
  8. Eltoum, H.; Yang, Y.L.; Hou, J.R. The effect of nanoparticles on reservoir wettability alteration: A critical review. Pet. Sci. 2021, 18, 136–153. [Google Scholar] [CrossRef]
  9. Yakasai, F.; Jaafar, M.Z.; Bandyopadhyay, S.; Agi, A. Current developments and future outlook in nanofluid flooding: A comprehensive review of various parameters influencing oil recovery mechanisms. J. Ind. Eng. Chem. 2021, 93, 138–162. [Google Scholar] [CrossRef]
  10. Han, X.; Thrush, S.J.; Zhang, Z.; Barber, G.C.; Qu, H. Tribological characterization of ZnO nanofluids as fastener lubricants. Wear 2021, 468–469, 203592. [Google Scholar] [CrossRef]
  11. Esfe, M.H.; Bahiraei, M.; Mir, A. Application of conventional and hybrid nanofluids in different machining processes: A critical review. Adv. Colloid Interface Sci. 2020, 282, 102199. [Google Scholar] [CrossRef] [PubMed]
  12. Yıldız, G.; Ağbulut, Ü.; Gürel, A.E. A review of stability, thermophysical properties and impact of using nanofluids on the performance of refrigeration systems. Int. J. Refrig. 2021, 129, 342–364. [Google Scholar] [CrossRef]
  13. Parmar, H.B.; Juybari, H.F.; Yogi, Y.S.; Nejati, S.; Jacob, R.M.; Menon, P.S.; Warsinger, D.M. Nanofluids improve energy efficiency of membrane distillation. Nano Energy 2021, 88, 106235. [Google Scholar] [CrossRef]
  14. Yu, W.; Wang, T.; Park, A.H.A.; Fang, M. Review of liquid nano-absorbents for enhanced CO2 capture. Nanoscale 2019, 11, 17137–17156. [Google Scholar] [CrossRef] [PubMed]
  15. Peiró, G.; Gasia, J.; Miró, L.; Prieto, C.; Cabeza, L.F. Influence of the heat transfer fluid in a CSP plant molten salts charging process. Renew. Energy 2017, 113, 148–158. [Google Scholar] [CrossRef] [Green Version]
  16. Wahab, A.; Hassan, A.; Arslan, M.; Babar, H.; Usman, M. Solar energy systems–Potential of nanofluids. J. Mol. Liq. 2019, 289, 111049. [Google Scholar] [CrossRef]
  17. Singh, T.; Hussien, M.A.A.; Al-Ansari, T.; Saoud, K.; McKay, G. Critical review of solar thermal resources in GCC and application of nanofluids for development of efficient and cost effective CSP technologies. Renew. Sustain. Energy Rev. 2018, 91, 708–719. [Google Scholar] [CrossRef]
  18. Hu, Y.; He, Y.; Zhang, Z.; Wen, D. Enhanced heat capacity of binary nitrate eutectic salt-silica nanofluid for solar energy storage. Sol. Energy Mater. Sol. Cells 2019, 192, 94–102. [Google Scholar] [CrossRef] [Green Version]
  19. Nithiyanantham, U.; Grosu, Y.; González-Fernández, L.; Zaki, A.; Igartua, J.M.; Faik, A. Development of molten nitrate salt based nanofluids for thermal energy storage application: High thermal performance and long storage components life-time. In Proceedings of the SolarPACES2018-Concentrating Solar Power and Chemical Energy Systems, Casablanca, Morocco, 2–5 October 2018; American Institute of Physics: College Park, MD, USA, 2019; Volume 2126, p. 200025. [Google Scholar] [CrossRef]
  20. Wang, W.; Wu, Z.; Li, B.; Sundén, B. A review on molten-salt-based and ionic-liquid-based nanofluids for medium-to-high temperature heat transfer. J. Therm. Anal. Calorim. 2019, 136, 1037–1051. [Google Scholar] [CrossRef] [Green Version]
  21. Muñoz-Sánchez, B.; Nieto-Maestre, J.; Iparraguirre-Torres, I.; García-Romero, A.; Sala-Lizarraga, J.M. Molten salt-based nanofluids as efficient heat transfer and storage materials at high temperatures. An overview of the literature. Renew. Sustain. Energy Rev. 2018, 82, 3924–3945. [Google Scholar] [CrossRef]
  22. Huang, Y.; Cheng, X.; Li, Y.; Yu, G.; Xu, K.; Li, G. Effect of in-situ synthesized nano-MgO on thermal properties of NaNO3-KNO3. Sol. Energy 2018, 160, 208–215. [Google Scholar] [CrossRef]
  23. Shin, D.; Banerjee, D. Enhanced specific heat capacity of nanomaterials synthesized by dispersing silica nanoparticles in eutectic mixtures. J. Heat Transf. 2013, 135, 032801. [Google Scholar] [CrossRef]
  24. Schuller, M.; Shao, Q.; Lalk, T. Experimental investigation of the specific heat of a nitrate-alumina nanofluid for solar thermal energy storage systems. Int. J. Therm. Sci. 2015, 91, 142–145. [Google Scholar] [CrossRef] [Green Version]
  25. Ho, M.X.; Pan, C. Optimal concentration of alumina nanoparticles in molten hitec salt to maximize its specific heat capacity. Int. J. Heat Mass Transf. 2014, 70, 174–184. [Google Scholar] [CrossRef]
  26. Chen, X.; Wu, Y.T.; di Zhang, L.; Wang, X.; Ma, C.F. Experimental study on thermophysical properties of molten salt nanofluids prepared by high-temperature melting. Sol. Energy Mater. Sol. Cells 2019, 191, 209–217. [Google Scholar] [CrossRef]
  27. Dudda, B.; Shin, D. Investigation of Molten Salt Nanomaterial As Thermal Energy Storage in Concentrated Solar Power. In Proceedings of the ASME International Mechanical Engineering Congress and Exposition, Houston, TX, USA, 9–15 November 2012; pp. 813–818. [Google Scholar]
  28. Awad, A.; Navarro, H.; Ding, Y.; Wen, D. Thermal-physical properties of nanoparticle-seeded nitrate molten salts. Renew. Energy 2018, 120, 275–288. [Google Scholar] [CrossRef] [Green Version]
  29. He, Q.; Wang, S.; Tong, M.; Liu, Y. Experimental study on thermophysical properties of nanofluids as phase-change material (PCM) in low temperature cool storage. Energy Convers. Manag. 2012, 64, 199–205. [Google Scholar] [CrossRef]
  30. Xie, Q.; Zhu, Q.; Li, Y. Thermal storage properties of molten nitrate salt-based nanofluids with graphene nanoplatelets. Nanoscale Res. Lett. 2016, 11, 306. [Google Scholar] [CrossRef] [Green Version]
  31. Hassan, M.A.; Banerjee, D. A soft computing approach for estimating the specific heat capacity of molten salt-based nanofluids. J. Mol. Liq. 2019, 281, 365–375. [Google Scholar] [CrossRef]
  32. Lu, M.C.; Huang, C.H. Specific heat capacity of molten salt-based alumina nanofluid. Nanoscale Res. Lett. 2013, 8, 292. [Google Scholar] [CrossRef] [Green Version]
  33. Pramod, K.; Balagi, N.; Saha, P.; Bharali, J.; Rao, P.V.C.; Choudary, N.V.; Ramesh, K. Preparation and characterization of molten salt based nanothermic fluids with enhanced thermal properties for solar thermal applications. Appl. Therm. Eng. 2016, 109, 901–905. [Google Scholar] [CrossRef]
  34. Myers, P.D.; Alam, T.E.; Kamal, R.; Goswami, D.Y.; Stefanakos, E. Nitrate salts doped with CuO nanoparticles for thermal energy storage with improved heat transfer. Appl. Energy 2016, 165, 225–233. [Google Scholar] [CrossRef]
  35. Andreu-Cabedo, P.; Mondragon, R.; Hernandez, L.; Martinez-Cuenca, R.; Cabedo, L.; Julia, J. Increment of specific heat capacity of solar salt with SiO2 nanoparticles. Nanoscale Res. Lett. 2014, 9, 582. [Google Scholar] [CrossRef] [PubMed] [Green Version]
  36. Sarvghad, M.; Steinberg, T.A.; Will, G. Corrosion of stainless steel 316 in eutectic molten salts for thermal energy storage. Sol. Energy 2018, 172, 198–203. [Google Scholar] [CrossRef]
  37. Guillot, S.; Faik, A.; Rakhmatullin, A.; Lambert, J.; Veron, E.; Echegut, P.; Bessada, C.; Calvet, N.; Py, X. Corrosion effects between molten salts and thermal storage material for concentrated solar power plants. Appl. Energy 2012, 94, 174–181. [Google Scholar] [CrossRef]
  38. Prieto, C.; Osuna, R.; Fernández, A.I.; Cabeza, L.F. Thermal storage in a MW scale. Molten salt solar thermal pilot facility: Plant description and commissioning experiences. Renew. Energy 2016, 99, 852–866. [Google Scholar] [CrossRef]
  39. Astm C 702-9; Standard Practice for Reducing Samples of Aggregate to Testing Size 1. ASTM International: West Conshohocken, PA, USA, 2003; Volume 4, pp. 700–703.
  40. Kumar, L.H.; Kazi, S.N.; Masjuki, H.H.; Zubir, M.N.M. A review of recent advances in green nanofluids and their application in thermal systems. Chem. Eng. J. 2022, 429, 132321. [Google Scholar] [CrossRef]
  41. Aljaerani, H.A.; Samykano, M.; Saidur, R.; Pandey, A.K.; Kadirgama, K. Nanoparticles as molten salts thermophysical properties enhancer for concentrated solar power: A critical review. J. Energy Storage 2021, 44, 103280. [Google Scholar] [CrossRef]
  42. Edwards, A.C.; Hooda, P.S.; Cook, Y. Determination of nitrate in water containing dissolved organic carbon by ultraviolet spectroscopy. Int. J. Environ. Anal. Chem. 2001, 80, 49–59. [Google Scholar] [CrossRef]
  43. Wang, H.; Ju, A.; Wang, L. Ultraviolet Spectroscopic Detection of Nitrate and Nitrite in Seawater Simultaneously Based on Partial Least Squares. Molecules 2021, 26, 3685. [Google Scholar] [CrossRef]
  44. Dong, D.M.; Jiao, L.Z.; Zheng, W.G.; Wu, W.B.; Feng, H.K.; Shen, C.J.; Yan, H. Determination of nitrite using UV absorption spectra based on multiple linear regression. Asian J. Chem. 2013, 25, 2273–2277. [Google Scholar] [CrossRef]
  45. Riordan, E.; Minogue, N.; Healy, D.; O’Driscoll, P.; Sodeau, J.R. Spectroscopic and optimization modeling study of nitrous acid in aqueous solution. J. Phys. Chem. A 2005, 109, 779–786. [Google Scholar] [CrossRef] [PubMed]
  46. Hammad, T.M. Infrared absorption spectra studies in (NaNO3-NaNO2) system. Ann. Phys. 2002, 11, 435–441. [Google Scholar] [CrossRef]
  47. Wen-Jui, L.; Min-Yi, S.; Chin-Hui, Y.; Yuan-Pern, L. Infrared absorption of cyclic-and trans-NaNO2 and KNO2 in solid argon. J. Chem. Phys. 1998, 104, 935. [Google Scholar]
  48. Berg, R.W.; Kerridge, D.H.; Larsen, P.H. NaNO2 + NaNO3 phase diagram: New data from DSC and Raman spectroscopy. J. Chem. Eng. Data 2006, 51, 34–39. [Google Scholar] [CrossRef]
  49. Hoshino, Y.; Utsunomiya, T.; Abe, O. The thermal descomposition of sodium nitrate and the effects of several oxides on the decomposition. Bull. Chem. Soc. Jpn. 1981, 54, 1385–1391. [Google Scholar] [CrossRef] [Green Version]
  50. Sato, Y.; Gesi, K.; Takagi, Y. Study of the Phase Transition in NaNO2 by Polarized Infrared radiation. J. Phys. Soc. Soc. 1961, 16, 2172–2177. [Google Scholar] [CrossRef]
  51. Bauer, T.; Laing, D.; Tamme, R. Characterization of sodium nitrate as phase change material. Int. J. Thermophys. 2012, 33, 91–104. [Google Scholar] [CrossRef]
  52. Steinmann, W.-D. Thermal energy storage systems for concentrating solar power plants. In Concentrating Solar Power Technology; Elsevier Ltd.: Amsterdam, The Netherlands, 2021; pp. 399–440. ISBN 9780128199701. [Google Scholar]
  53. Ibrahim, A.; Peng, H.; Riaz, A.; Abdul Basit, M.; Rashid, U.; Basit, A. Molten salts in the light of corrosion mitigation strategies and embedded with nanoparticles to enhance the thermophysical properties for CSP plants. Sol. Energy Mater. Sol. Cells 2021, 219, 110768. [Google Scholar] [CrossRef]
  54. Zhang, M.-H.; Chen, X.; Dong, H. A study on multistep thermal decomposition behavior and kinetics of magnesium nitrate hydrate. Thermochim. Acta 2021, 701, 178951. [Google Scholar] [CrossRef]
  55. Nissen, D.A.; Meeker, D.E. Nitrate/Nitrite Chemistry in NaNO3-KNO3 Melts. Inorg. Chem. 1983, 22, 716–721. [Google Scholar] [CrossRef]
  56. Freeman, E.S. The Kinetics of the thermal decomposition of sodium nitrate and of the reaction between sodium nitrite and oxigen. J. Phys. Chem. 1956, 60, 1487–1493. [Google Scholar] [CrossRef]
  57. Sötz, V.A.; Bonk, A.; Forstner, J.; Bauer, T. Microkinetics of the reaction NO3-⇌NO2-+0.5 O2 in molten sodium nitrate and potassium nitrate salt. Thermochim. Acta 2019, 678, 178301. [Google Scholar] [CrossRef]
  58. Villada, C.; Bonk, A.; Bauer, T.; Bolívar, F. High-temperature stability of nitrate/nitrite molten salt mixtures under different atmospheres. Appl. Energy 2018, 226, 107–115. [Google Scholar] [CrossRef]
  59. Stern, K.H. High temperature properties and decomposition of inorganic salts part 3, nitrates and nitrites. J. Phys. Chem. Ref. Data 1972, 1, 747–772. [Google Scholar] [CrossRef] [Green Version]
  60. Jacobs, W.M.; Robinson, P.L.; Smith, H.C.; Briscoe, A.; Butkov, K.; Dagenhard, W.; Ievips, A. The thermal decomposition of sodium nitrate. Inorg. Phys. Theor. 1959, 1265–1268. [Google Scholar]
  61. Svobodova-Sedlackova, A.; Calderón, A.; Barreneche, C.; Gamallo, P.; Fernández, A.I. Understanding the abnormal thermal behavior of nanofluids through infrared thermography and thermo-physical characterization. Sci. Rep. 2021, 11, 4879. [Google Scholar] [CrossRef]
  62. Mondragón, R.; Juliá, J.E.; Cabedo, L.; Navarrete, N. On the relationship between the specific heat enhancement of salt-based nanofluids and the ionic exchange capacity of nanoparticles. Sci. Rep. 2018, 8, 7532. [Google Scholar] [CrossRef]
  63. Li, B.; Li, H.; Zhang, X.; Fan, P.; Liu, L.; Li, B.; Dong, W.; Zhao, B. Calcined sodium silicate as an efficient and benign heterogeneous catalyst for the transesterification of natural lecithin to L-α-glycerophosphocholine. Green Process. Synth. 2019, 8, 78–84. [Google Scholar] [CrossRef] [Green Version]
  64. Cherikkallinmel, S.K.; Gopalakrishnan, A.; Yaakob, Z.; Ramakrishnan, R.M.; Sugunan, S.; Narayanan, B.N. Sodium aluminate from waste aluminium source as catalyst for the transesterification of Jatropha oil. RSC Adv. 2015, 5, 46290–46294. [Google Scholar] [CrossRef]
Figure 1. Schematic representation of the two-step nanofluid synthesis.
Nanomaterials 12 01777 g001
Figure 2. TEM images at different magnifications for SiO2, (a,b), and Al2O3 nanoparticles, (c,d).
Nanomaterials 12 01777 g002
Figure 3. UV-vis spectra of 0.3M sodium nitrate-nitrite solutions: (a) evolution of nitrite peak with the concentration of NaNO2, from 2.5 to 25% wt. in NaNO3 solution, (b) linear relationship between light absorption and the concentration of nitrites at a wavelength of 354 nm.
Nanomaterials 12 01777 g003
Figure 4. UV-vis absorption spectra of samples after the thermal treatment from 50 to 500 °C: (a) pure 0.3M NaNO3, (b) 0.3M NaNO3/SiO2 NF (1% wt.) and (c) 0.3M NaNO3/Al2O3 NF (1% wt.).
Nanomaterials 12 01777 g004
Figure 5. Nitrite concentration [NaNO2] as a function of temperature from 100 to 500 °C for pure 0.3M NaNO3 (black symbols), 0.3M NaNO3/SiO2 NF (1% wt.) (grey symbols) and 0.3M NaNO3/Al2O3 NF (1% wt.) (green symbols).
Nanomaterials 12 01777 g005
Figure 6. FT-IR spectra of NaNO3 and NaNO3/SiO2, NaNO3/Al2O3 NFs with 1% wt. of NPs after thermal treatment at 50 °C and 500 °C. Band (1) corresponds to asymmetric stretching mode of NO 3 , and bands (2)–(3) corresponds to fundamental vibration bands of NO 2 .
Nanomaterials 12 01777 g006
Figure 7. TGA measurement from 100 to 900 °C of NaNO3, and NaNO3/SiO2, NaNO3/Al2O3 NFs with 1% wt. of NPs: (a) weight loss as a function of temperature and, (b) weight derivative as a function of time and temperature.
Nanomaterials 12 01777 g007
Figure 8. Effect of moisture on physical properties (water absorption) of (a) pure NaNO3, (b) NaNO3/SiO2 NPs (1% wt.) and (c) NaNO3/Al2O3 NPs (1% wt.).
Nanomaterials 12 01777 g008
Figure 9. Non-linear peak deconvolution fit of the TGA weight derivative over time for (a) NaNO3, (b) NaNO3/SiO2 NF (1% wt.) and (c) NaNO3/Al2O3 NF (1% wt.).
Nanomaterials 12 01777 g009
Figure 10. FT-IR spectra for (top) NaNO3/Al2O3 NF (1% wt.) and (bottom) NaNO3/SiO2 NF (1% wt.) after thermal treatment at 500 °C and 850 °C.
Nanomaterials 12 01777 g010
Table 1. Nitrite concentration (% wt.) in pure 0.3M NaNO3, 0.3M NaNO3/SiO2 NF (1% wt.) and 0.3M NaNO3/Al2O3 NF (1% wt.) derived from the absorbance (arbitrary units) at 354 nm as a function of temperature from 100 °C to 500 °C.
SampleNaNO3NaNO3/SiO2 NFNaNO3/Al2O3 NF
TemperatureAbs. at 354 nm [   NaNO 2 ] Abs. at 354 nm [   NaNO 2 ] Abs. at 354 nm [   NaNO 2 ]
(°C)a.u ± 0.001% wt. ± 0.2a.u ± 0.001% wt. ± 0.2a.u ± 0.001% wt. ± 0.2
1000.2130.20.3872.60.3952.7
1500.2310.40.4323.30.3742.5
2000.2320.50.4113.00.3602.3
2500.2180.30.4423.40.4203.1
3000.2320.50.4253.20.4934.1
3500.2390.50.4293.20.4613.7
4000.2250.40.3482.10.4593.6
4500.2570.80.4062.90.4403.4
5000.2320.50.3782.50.4343.3
Table 2. pH values at room temperature for pure 0.3M NaNO3, 0.3M NaNO3/SiO2 NF (1% wt.) and 0.3M NaNO3/Al2O3 NF (1% wt.) at different thermal treatments from 50 to 500 °C.
Thermal Treatment (°C)NaNO3
pH ± 0.01
NaNO3/SiO2 NF
pH ± 0.01
NaNO3/Al2O3 NF pH ± 0.01
505.765.526.08
1005.836.256.18
1505.925.736.17
2005.775.516.34
2505.785.986.31
3005.996.036.52
3505.786.426.84
4006.086.676.74
4505.886.886.81
5005.936.966.69
Table 3. Temperature and weight loss obtained by TGA measurements of pure NaNO3 and NaNO3 with SiO2 and Al2O3 NFs at 1% wt.
SampleNaNO3SiO2Al2O3
Mass (mg) ± 0.0113.7414.2714.55
First peak temperature (°C) ± 0.5678.7681.1698.9
Weight loss at first peak (%) ± 1182027
Second peak temperature (°C) ± 0.5774.8775.2755.0
Weight loss at second peak (%) ± 1626245
Third peak temperature (°C) ± 0.5--794.5
Weight loss at third peak (%) ± 1--3
Total weight loss between 507–840 °C (%) ± 1808175
Table 4. Gaussian non-linear fit parameters and the predominant reactions involved of the deconvoluted peaks for NaNO3, NaNO3/SiO2 NF (1% wt.) and NaNO3/Al2O3 NF (1% wt.).
StageStepFit Max.
Peak
NaNO3NaNO3/SiO2 NFNaNO3/Al2O3 NFReactive
Processes
Value
± Std. Dev.
Value
± Std. Dev.
Value
± Std. Dev.
Stage II-APeak Peak 1 (1)
(2)
(3)
Time (min.)-56.2
± 0.5
-
Temp.
(°C)
-625.8
± 0.5
-
I-BPeakPeak 1Peak 2Peak 1
Time (min.)70.56
± 0.06
67.80
± 0.06
70.34
± 0.03
Temp.
(°C)
697.3
± 0.5
683.0
± 0.5
695.7
± 0.5
Stage II PeakPeak 2Peak 3Peak 2(4)
(5)
(6)
(7)
(8)
(9)
(10)
Time (min.)80.66
± 0.15
80.55
± 0.07
79.28
± 0.05
Temp.
(°C)
747.9
± 0.5
747.0
± 0.5
740.5
± 0.5
Stage III PeakPeak 3Peak 4Peak 3(11)
(12)
(13)
(14)
(15)
III-ATime (min.)87.17
± 0.04
85.32
± 0.05
82.876
± 0.009
Temp.
(°C)
781.2
± 0.5
771.4
± 0.5
758.9
± 0.5
Peak Peak 5Peak 4
III-BTime (min.)-87.966
± 0.008
89.86
± 0.03
Temp.
(°C)
-785.4
± 0.5
795.2
± 0.5
Publisher’s Note: MDPI stays neutral with regard to jurisdictional claims in published maps and institutional affiliations.

