
Common Carotid Artery Volume Flow: A Comparison Study between Ultrasound Vector Flow Imaging and Phase Contrast Magnetic Resonance Imaging

 and
and
Abstract
:1. Introduction
2. Materials and Methods
3. Results
4. Discussion
5. Conclusions
Author Contributions
Funding
Institutional Review Board Statement
Informed Consent Statement
Data Availability Statement
Acknowledgments
Conflicts of Interest
References
- Kaszczewski, P.; Elwertowski, M.; Leszczynski, J.; Ostrowski, T.; Galazka, Z. Volumetric Carotid Flow Characteristics in Doppler Ultrasonography in Healthy Population Over 65 Years Old. J. Clin. Med. 2020, 9, 1375. [Google Scholar] [CrossRef]
- Roger, V.L.; Go, A.S.; Lloyd-Jones, D.M.; Benjamin, E.J.; Berry, J.D.; Borden, W.B.; Bravata, D.M.; Dai, S.; Ford, E.S.; Fox, C.S.; et al. Heart disease and stroke statistics—2012 update: A report from the American Heart Association. Circulation 2012, 125, e2–e220. [Google Scholar]
- Mitrasinovic, A.; Radak, S.; Kolar, J.; Aleksic, N.; Otasevic, P.; Popovic, M.; Radak, D. Color Doppler sonographic evaluation of flow volume of the internal carotid and vertebral arteries after carotid endarterectomy. J. Clin. Ultrasound 2010, 38, 238–243. [Google Scholar] [CrossRef] [PubMed]
- Ho, S.S.Y.; Chan, Y.L.; Yeung, D.K.W.; Metreweli, C. Blood Flow Volume Quantification of Cerebral Ischemia. AJR Am. J. Roentgenol. 2002, 178, 551–556. [Google Scholar] [CrossRef]
- Tanaka, H.; Watanabe, Y.; Nakamura, H.; Takahashi, H.; Arisawa, A.; Fujiwara, T.; Matsuo, C.; Tomiyama, N. Multiple blood flow measurements before and after carotid artery stenting via phase-contrast magnetic resonance imaging: An observational study. PLoS ONE 2018, 13, e0195099. [Google Scholar] [CrossRef] [Green Version]
- Vernooij, M.W.; van der Lugt, A.; Ikram, M.A.; Wielopolski, P.A.; Vrooman, H.A.; Hofman, A.; Krestin, G.P.; Breteler, M.M. Total cerebral blood flow and total brain perfusion in the general population: The Rotterdam Scan Study. J. Cereb. Blood Flow Metab. 2008, 28, 412–419. [Google Scholar] [CrossRef]
- Oktar, S.O.; Yucel, C.; Karaosmanoglu, D.; Akkan, K.; Ozdemir, H.; Tokgoz, N.; Tali, T. Blood-flow volume quantification in internal carotid and vertebral arteries: Comparison of 3 different ultrasound techniques with phase-contrast MR imaging. AJNR Am. J. Neuroradiol. 2006, 27, 363–369. [Google Scholar]
- Stewart, S.F. Effects of transducer, velocity, Doppler angle, and instrument settings on the accuracy of color Doppler ultrasound. Ultrasound Med. Biol. 2001, 27, 551–564. [Google Scholar] [CrossRef]
- Park, M.Y.; Jung, S.E.; Byun, J.Y.; Kim, J.H.; Joo, G.E. Effect of beam-flow angle on velocity measurements in modern Doppler ultrasound systems. AJR. Am. J. Roentgenol. 2012, 198, 1139–1143. [Google Scholar] [CrossRef]
- Hansen, K.L.; Moller-Sorensen, H.; Kjaergaard, J.; Jensen, M.B.; Lund, J.T.; Pedersen, M.M.; Lange, T.; Jensen, J.A.; Nielsen, M.B. Intra-operative Vector Flow Imaging Using Ultrasound of the Ascending Aorta among 40 Patients with Normal, Stenotic and Replaced Aortic Valves. Ultrasound Med. Biol. 2016, 42, 2414–2422. [Google Scholar] [CrossRef]
- Steel, R.; Ramnarine, K.V.; Davidson, F.; Fish, P.J.; Hoskins, P.R. Angle-independent estimation of maximum velocity through stenoses using vector Doppler ultrasound. Ultrasound Med. Biol. 2003, 29, 575–584. [Google Scholar] [CrossRef]
- Yang, X.; Sun, C.; Anderson, T.; Moran, C.M.; Hadoke, P.W.; Gray, G.A.; Hoskins, P.R. Assessment of spectral Doppler in preclinical ultrasound using a small-size rotating phantom. Ultrasound Med. Biol. 2013, 39, 1491–1499. [Google Scholar] [CrossRef] [PubMed] [Green Version]
- Hoskins, P.R. A comparison of single- and dual-beam methods for maximum velocity estimation. Ultrasound Med. Biol. 1999, 25, 583–592. [Google Scholar] [CrossRef]
- Steinman, A.H.; Tavakkoli, J.; Myers, J.G., Jr.; Cobbold, R.S.; Johnston, K.W. Sources of error in maximum velocity estimation using linear phased-array Doppler systems with steady flow. Ultrasound Med. Biol. 2001, 27, 655–664. [Google Scholar] [CrossRef]
- Scheel, P.; Ruge, C.; Petruch, U.R.; Schöning, M. Color duplex measurement of cerebral blood flow volume in healthy adults. Stroke 2000, 31, 147–150. [Google Scholar] [CrossRef] [Green Version]
- Likittanasombut, P.; Reynolds, P.; Meads, D.; Tegeler, C. Volume Flow Rate of Common Carotid Artery Measured by Doppler Method and Color Velocity Imaging Quantification (CVI-Q). J. Neuroimaging 2006, 16, 34–38. [Google Scholar] [CrossRef]
- Grant, E.G.; Benson, C.B.; Moneta, G.L.; Alexandrov, A.V.; Baker, J.D.; Bluth, E.I.; Carroll, B.A.; Eliasziw, M.; Gocke, J.; Hertzberg, B.S.; et al. Carotid artery stenosis: Gray-scale and Doppler US diagnosis--Society of Radiologists in Ultrasound Consensus Conference. Radiology 2003, 229, 340–346. [Google Scholar] [CrossRef]
- Jensen, J.A.; Munk, P. A new method for estimation of velocity vectors. IEEE Trans. Ultrason. Ferroelectr. Freq. Control. 1998, 45, 837–851. [Google Scholar] [CrossRef]
- Jensen, J.A. A new estimator for vector velocity estimation. Ultrason. Ferroelectr. Freq. Control. IEEE Trans. 2001, 48, 886–894. [Google Scholar] [CrossRef] [Green Version]
- Hansen, K.L.; Udesen, J.; Oddershede, N.; Henze, L.; Thomsen, C.; Jensen, J.A.; Nielsen, M.B. In vivo comparison of three ultrasound vector velocity techniques to MR phase contrast angiography. Ultrasonics 2009, 49, 659–667. [Google Scholar] [CrossRef]
- Udesen, J.; Jensen, J.A. Investigation of transverse oscillation method. IEEE Trans. Ultrason. Ferroelectri. Freq. Control. 2006, 53, 959–971. [Google Scholar] [CrossRef] [Green Version]
- Hansen, K.L.; Moller-Sorensen, H.; Kjaergaard, J.; Jensen, M.B.; Lund, J.T.; Pedersen, M.M.; Olesen, J.B.; Jensen, J.A.; Nielsen, M.B. Vector Flow Imaging Compared with Conventional Doppler Ultrasound and Thermodilution for Estimation of Blood Flow in the Ascending Aorta. Ultrasonic Imaging 2017, 39, 3–18. [Google Scholar] [CrossRef]
- Brandt, A.H.; Jensen, J.; Hansen, K.L.; Hansen, P.; Lange, T.; Rix, M.; Jensen, J.A.; Lonn, L.; Nielsen, M.B. Surveillance for hemodialysis access stenosis: Usefulness of ultrasound vector volume flow. J. Vas. Access 2016, 17, 483–488. [Google Scholar] [CrossRef]
- Holbek, S.; Ewertsen, C.; Bouzari, H.; Pihl, M.J.; Hansen, K.L.; Stuart, M.B.; Thomsen, C.; Nielsen, M.B.; Jensen, J.A. Ultrasonic 3-D Vector Flow Method for Quantitative In Vivo Peak Velocity and Flow Rate Estimation. IEEE Trans. Ultrason. Ferroelectri. Freq. Control. 2017, 64, 544–554. [Google Scholar] [CrossRef] [Green Version]
- Brandt, A.H.; Hansen, K.L.; Ewertsen, C.; Holbek, S.; Olesen, J.B.; Moshavegh, R.; Thomsen, C.; Jensen, J.A.; Nielsen, M.B. A Comparison Study of Vector Velocity, Spectral Doppler and Magnetic Resonance of Blood Flow in the Common Carotid Artery. Ultrasound Med. Biol. 2018, 44, 1751–1761. [Google Scholar] [CrossRef] [PubMed]
- Hansen, K.L.; Udesen, J.; Thomsen, C.; Jensen, J.A.; Nielsen, M.B. In vivo validation of a blood vector velocity estimator with MR angiography. IEEE Trans Ultrason. Ferroelectri. Freq. Control. 2009, 56, 91–100. [Google Scholar] [CrossRef] [PubMed]
- Holbek, S.; Hansen, K.L.; Bouzari, H.; Ewertsen, C.; Stuart, M.B.; Thomsen, C.; Nielsen, M.B.; Jensen, J.A. Common Carotid Artery Flow Measured by 3-D Ultrasonic Vector Flow Imaging and Validated with Magnetic Resonance Imaging. Ultrasound Med. Biol. 2017, 43, 2213–2220. [Google Scholar] [CrossRef] [PubMed]
- Moller-Sorensen, H.; Hansen, K.L.; Ostergaard, M.; Andersen, L.W.; Moller, K. Lack of agreement and trending ability of the endotracheal cardiac output monitor compared with thermodilution. Acta Anaesthesiol. Scand. 2012, 56, 433–440. [Google Scholar] [CrossRef]
- Critchley, L.A.; Critchley, J.A. A meta-analysis of studies using bias and precision statistics to compare cardiac output measurement techniques. J. Clin. Monit. Comput. 1999, 15, 85–91. [Google Scholar] [CrossRef] [PubMed]
- Hoyt, K.; Hester, F.A.; Bell, R.L.; Lockhart, M.E.; Robbin, M.L. Accuracy of volumetric flow rate measurements: An in vitro study using modern ultrasound scanners. J. Ultrasound Med. 2009, 28, 1511–1518. [Google Scholar] [CrossRef]
- Hansen, P.M.; Olesen, J.B.; Pihl, M.J.; Lange, T.; Heerwagen, S.; Pedersen, M.M.; Rix, M.; Lonn, L.; Jensen, J.A.; Nielsen, M.B. Volume flow in arteriovenous fistulas using vector velocity ultrasound. Ultrasound Med. Biol. 2014, 40, 2707–2714. [Google Scholar] [CrossRef]
- Ackroyd, N.; Gill, R.; Griffiths, K.; Kossoff, G.; Appleberg, M. Quantitative common carotid artery blood flow: Prediction of internal carotid artery stenosis. J. Vasc. Surg. 1986, 3, 846–853. [Google Scholar] [CrossRef] [Green Version]
- Nezu, T.; Hosomi, N.; Aoki, S.; Matsumoto, M. Carotid Intima-Media Thickness for Atherosclerosis. J. Atheroscler. Thromb. 2016, 23, 18–31. [Google Scholar] [CrossRef] [Green Version]
- Mortimer, R.; Nachiappan, S.; Howlett, D.C. Carotid artery stenosis screening: Where are we now? Br. J. Radiol. 2018, 90, 20170380. [Google Scholar] [CrossRef] [PubMed]
- Morales, M.M.; Anacleto, A.; Filho, C.M.; Ledesma, S.; Aldrovani, M.; Wolosker, N. Peak Systolic Velocity for Calcified Plaques Fails to Estimate Carotid Stenosis Degree. Ann. Vasc. Surg. 2019, 59, 1–4. [Google Scholar] [CrossRef]
- Stringer, D.A.; O’Halpin, D.; Daneman, A.; Liu, P.; Geary, D.F. Duplex Doppler sonography for renal artery stenosis in the post-transplant pediatric patient. Pediatr. Radiol. 1989, 19, 187–192. [Google Scholar] [CrossRef] [PubMed]
- Hutchison, S.J.; Rosin, B.L.; Curry, S.; Chandraratna, P.A. Transesophageal Echocardiographic Assessment of Lesions of the Right Ventricular Outflow Tract and Pulmonic Valve. Echocardiography 1996, 13, 21–34. [Google Scholar] [CrossRef] [PubMed]
- Pedersen, M.M.; Pihl, M.J.; Haugaard, P.; Hansen, K.L.; Lange, T.; Lonn, L.; Nielsen, M.B.; Jensen, J.A. Novel flow quantification of the carotid bulb and the common carotid artery with vector flow ultrasound. Ultrasound Med. Biol. 2014, 40, 2700–2706. [Google Scholar] [CrossRef] [PubMed]
- Brandt, A.H.; Nguyen, T.; Gutte, H.; Holtmannspötter, M.; Moshavegh, R.; Jensen, J.A.; Nielsen, M.B.; Hansen, K.L. Vector Concentration used for Stenosis Assessment in the Carotid Artery before and after Carotid Stenting. In Proceedings of the 2019 IEEE International Ultrasonics Symposium (IUS), Glasgow, UK, 6–9 October 2019; pp. 348–351. [Google Scholar]
- Hansen, K.L.; Hansen, P.M.; Ewertsen, C.; Lonn, L.; Jensen, J.A.; Nielsen, M.B. Vector Flow Imaging Compared with Digital Subtraction Angiography for Stenosis Assessment in the Superficial Femoral Artery—A Study of Vector Concentration, Velocity Ratio and Stenosis Degree Percentage. Ultrasound Int. Open 2019, 5, E53–E59. [Google Scholar] [CrossRef] [Green Version]
- Normahani, P.; Aslam, M.; Martin, G.; Standfield, N.J.; Jaffer, U. Variation in duplex peak systolic velocity measurement in a multi-site vascular service. Perfusion 2015, 30, 636–642. [Google Scholar] [CrossRef]
- Corriveau, M.M.; Johnston, K.W. Interobserver variability of carotid Doppler peak velocity measurements among technologists in an ICAVL-accredited vascular laboratory. J. Vasc. Surg. 2004, 39, 735–741. [Google Scholar] [CrossRef] [PubMed] [Green Version]
- Lui, E.Y.L.; Steinman, A.H.; Cobbold, R.S.C.; Johnston, K.W. Human factors as a source of error in peak Doppler velocity measurement. J. Vasc. Surg. 2005, 42, 972–979. [Google Scholar] [CrossRef] [Green Version]
- Zierler, R.E.; Beach, K.W.; Bergelin, R.O.; Lal, B.K.; Moore, W.S.; Roubin, G.S.; Voeks, J.H.; Brott, T.G. Agreement between site-reported and ultrasound core laboratory results for duplex ultrasound velocity measurements in the Carotid Revascularization Endarterectomy versus Stenting Trial. J. Vasc. Surg. 2014, 59, 2–7. [Google Scholar] [CrossRef] [PubMed] [Green Version]
- Pedersen, M.M.; Pihl, M.J.; Haugaard, P.; Hansen, J.M.; Hansen, K.L.; Nielsen, M.B.; Jensen, J.A. Comparison of real-time in vivo spectral and vector velocity estimation. Ultrasound Med. Biol. 2012, 38, 145–151. [Google Scholar] [CrossRef] [PubMed]
- Brandt, A.H.; Moshavegh, R.; Hansen, K.L.; Bechsgaard, T.; Lönn, L.; Jensen, J.A.; Nielsen, M.B. Vector Flow Imaging Compared with Pulse Wave Doppler for Estimation of Peak Velocity in the Portal Vein. Ultrasound Med. Biol. 2018, 44, 593–601. [Google Scholar] [CrossRef]
- Spilt, A.; Box, F.M.; van der Geest, R.J.; Reiber, J.H.; Kunz, P.; Kamper, A.M.; Blauw, G.J.; van Buchem, M.A. Reproducibility of total cerebral blood flow measurements using phase contrast magnetic resonance imaging. J. Magn. Reson Imaging 2002, 16, 1–5. [Google Scholar] [CrossRef]
- Meyer, J.I.; Khalil, R.M.; Obuchowski, N.A.; Baus, L.K. Common carotid artery: Variability of Doppler US velocity measurements. Radiology 1997, 204, 339–341. [Google Scholar] [CrossRef] [PubMed]


| MRA (1) (n = 20) | MRA (2) (n = 18) | VFI (1) (n = 20) | VFI (2) (n = 20) | |
|---|---|---|---|---|
| Mean (mL/min) | 447.0 | 421.3 | 380.3 | 385.6 |
| Range (mL/min) | 182.5–1111.4 | 280.6–696.8 | 260.4–816.6 | 235.2–753.6 |
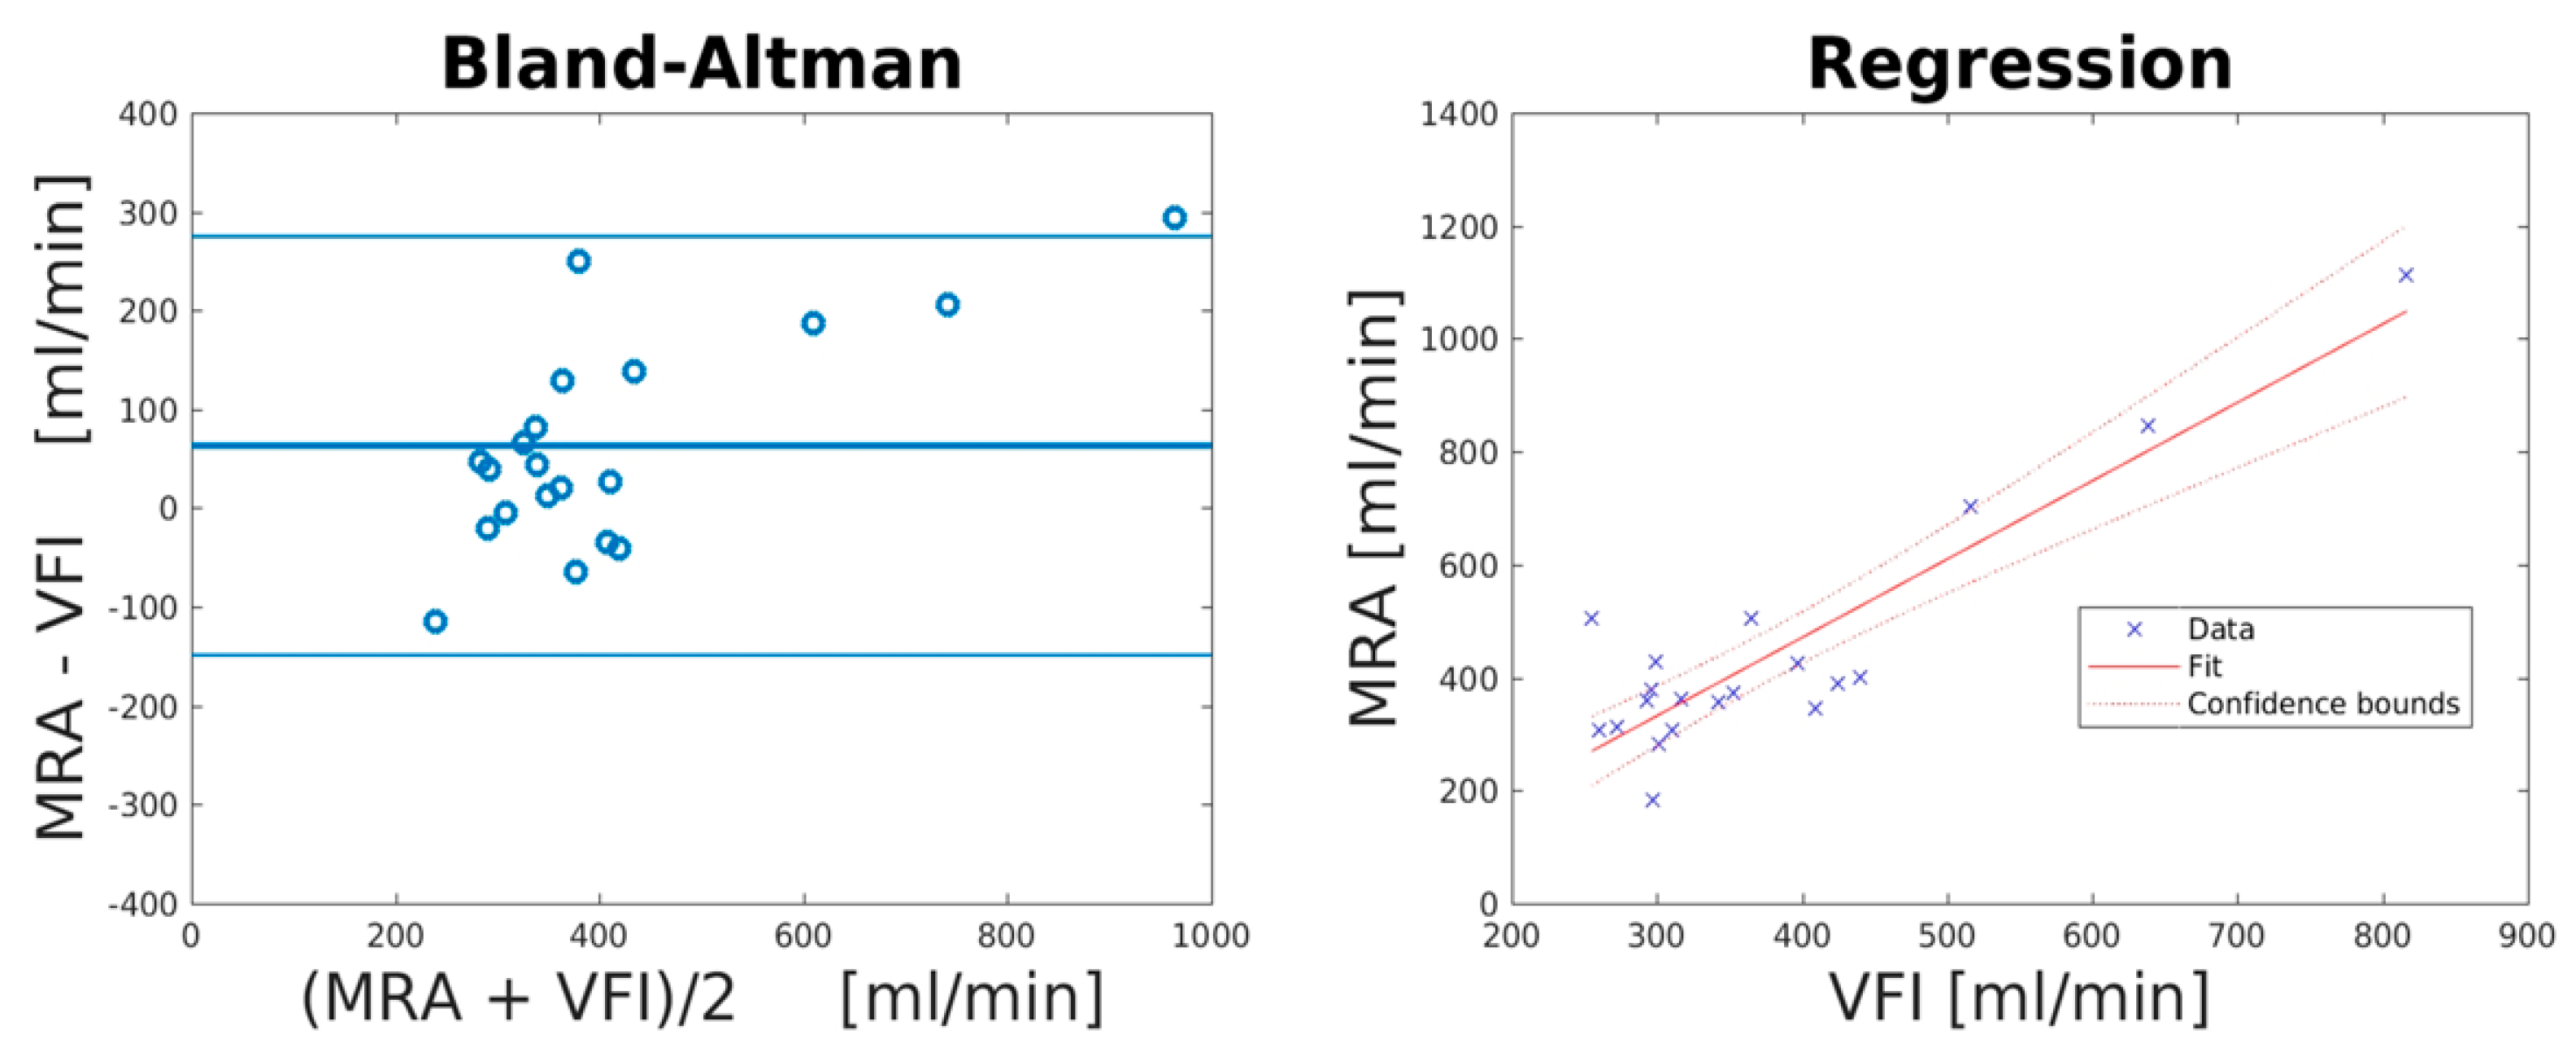
| Mean Difference (mL/min) | Lower LOA (mL/min) | Upper LOA (mL/min) | Correlation Coefficient (R2) | PE (%) | PE after Correction of Systematic Bias (%) | |
|---|---|---|---|---|---|---|
| MRA vs. VFI | 63.2 (95% CI: −113.4 to 12.9) | −148.8 (95% CI: −235.9 to 61.7) | 275.1 (95% CI: 188.0–362.2) | 0.81 (p < 0.0001) | 41.0 | 25.2 |
Publisher’s Note: MDPI stays neutral with regard to jurisdictional claims in published maps and institutional affiliations. |
© 2021 by the authors. Licensee MDPI, Basel, Switzerland. This article is an open access article distributed under the terms and conditions of the Creative Commons Attribution (CC BY) license (https://creativecommons.org/licenses/by/4.0/).
Share and Cite
Brandt, A.H.; Olesen, J.B.; Moshavegh, R.; Jensen, J.A.; Nielsen, M.B.; Hansen, K.L. Common Carotid Artery Volume Flow: A Comparison Study between Ultrasound Vector Flow Imaging and Phase Contrast Magnetic Resonance Imaging. Neurol. Int. 2021, 13, 269-278. https://0-doi-org.brum.beds.ac.uk/10.3390/neurolint13030028
Brandt AH, Olesen JB, Moshavegh R, Jensen JA, Nielsen MB, Hansen KL. Common Carotid Artery Volume Flow: A Comparison Study between Ultrasound Vector Flow Imaging and Phase Contrast Magnetic Resonance Imaging. Neurology International. 2021; 13(3):269-278. https://0-doi-org.brum.beds.ac.uk/10.3390/neurolint13030028
Chicago/Turabian StyleBrandt, Andreas Hjelm, Jacob Bjerring Olesen, Ramin Moshavegh, Jørgen Arendt Jensen, Michael Bachmann Nielsen, and Kristoffer Lindskov Hansen. 2021. "Common Carotid Artery Volume Flow: A Comparison Study between Ultrasound Vector Flow Imaging and Phase Contrast Magnetic Resonance Imaging" Neurology International 13, no. 3: 269-278. https://0-doi-org.brum.beds.ac.uk/10.3390/neurolint13030028