
Tea Bags—Standard Materials for Testing Impacts of Nitrogen Addition on Litter Decomposition in Aquatic Ecosystems?


Kyushu Research Center, Forestry and Forest Products Research Institute, FFPRI, Kurokami 4-11-16, Kumamoto 860-0862, Japan
Nitrogen 2021, 2(2), 259-267; https://0-doi-org.brum.beds.ac.uk/10.3390/nitrogen2020017
Submission received: 6 April 2021
/
Revised: 17 May 2021
/
Accepted: 22 May 2021
/
Published: 1 June 2021
Abstract
:How the anthropogenic addition of nutrients, especially nitrogen (N), impacts litter decomposition has attracted extensive attention, but how environmental factors other than nutrients affect the impacts of N addition on litter decomposition is less understood. Since different local litters could respond differently to N addition, standard materials are necessary for comparing the impacts among various environments. The present study tested if tea bags used for the Tea Bag Index (TBI) approach, i.e., constructing an asymptote model by using a green tea decomposition datum and a rooibos tea decomposition datum (single measurement in time), can be standard materials for testing the impacts of N addition on litter decomposition in aquatic ecosystems. A laboratory incubation experiment was performed using a water sample taken from a stream in Kumamoto, Japan. Since a recent study suggested that the TBI approach may be inapplicable to aquatic ecosystems, a time-series data approach, i.e., fitting models to time-series mass loss data of tea bags, was also used for testing if tea bag decomposition can pick up the impacts of N addition on aquatic litter decomposition. The time-series data approach demonstrated that N addition significantly suppressed rooibos tea decomposition, whereas green tea decomposition was not affected by N addition. The TBI approach was unsuitable for testing the sensitivity of the response of tea bag decomposition to N addition because the TBI-based asymptote model failed to predict the observed data, confirming the suggestion by a previous study. Overall, the present study suggested that the tea bags can be used as standard materials for testing the impacts of N addition on litter decomposition in aquatic ecosystems, but only when using a time-series measurement and not the TBI.
1. Introduction
Litter decomposition plays an essential role in the biogeochemical cycling of elements such as carbon in both aquatic and terrestrial ecosystems [1,2,3]. How anthropogenic addition of nutrients, especially nitrogen (N), impacts litter decomposition has attracted extensive attention in aquatic ecosystems [4,5,6,7] as well as terrestrial ecosystems [8,9,10]. However, how environmental factors other than nutrients affect the impacts of N addition on litter decomposition is less understood [11]. Ferreira et al. (2015) integrated the impacts of nutrient enrichment on aquatic litter decomposition using a meta-analysis, reporting that the litter decomposition rate was stimulated by approximately 50%, but in several study sites litter decomposition was suppressed [4]. It is possible that the impacts of N addition on litter decomposition differ in different environmental conditions (for example, hot vs. cool climates or aquatic vs. terrestrial ecosystems). Since different local litters could respond differently to N addition, standard materials are necessary for comparing the impacts among various environments.
Tea bags used for the tea bag index (TBI) approach [12] are a good candidate for the standard materials to understand the interactive effects of N amendment with other environmental factors on litter decomposition. The TBI approach, which was developed for accessing litter decomposition in terrestrial ecosystems [12], is able to construct an asymptote model (see Equation (1) below) by using a green tea decomposition datum and a rooibos tea decomposition datum (single measurement in time):
where W(t) is the mass remaining after incubation time t, k is a decomposition constant, and a and 1 − a are the labile fraction and the recalcitrant fraction of initial mass. In the TBI approach, the asymptote model is fitted to the rooibos tea decomposition datum. The asymptote of the model (i.e., 1 − a of the Equation (1)) is determined using the decomposition rate of the more easily-decomposable green tea, assuming that (i) the early-stage decomposition (i.e., decomposition of hydrolysable fraction) of green tea is completed during the 90 day incubation (standard period), (ii) the undecomposed hydrolysable fraction is stabilized and transformed to recalcitrant fraction, (iii) the decomposition of the recalcitrant fraction of green tea is negligible during the 90 days, and (iv) the ratio of stabilized hydrolysable fraction to total hydrolysable fraction in rooibos tea is equal to that in green tea [12] (note that the TBI approach focuses on the early-stage decomposition (decomposition of hydrolysable fraction), and the decomposition of acid insoluble fraction is not considered). After determining the asymptote, the decomposition constant (k in Equation (1)) can be determined by fitting the asymptote model to a mass loss datum of rooibos tea [12]. Seelen et al. (2019) demonstrated that the TBI approach was able to detect the impacts of eutrophication on litter decomposition by comparing the TBI among different study sites with different nutrient levels [13]. However, to draw a definitive conclusion, a laboratory experiment that controls environmental factors is necessary because other environmental factors, such as dissolved organic carbon [14], may covary with the nutrient levels.
W(t) = a × e−kt + (1 − a)
In the present short paper, I tried to evaluate the tea bags as a potential tool to test the impacts of N addition on litter decomposition by testing if tea bag decomposition is sufficiently sensitive to pick up the impacts of N addition. A time-series data approach, i.e., fitting models to time-series mass loss data of tea bags, was also used for testing if tea bag decomposition can pick up the impacts of N addition on aquatic litter decomposition, as well as the TBI approach. This is because it was recently suggested that the TBI approach may be inapplicable to aquatic ecosystems [15], although the TBI approach has increasingly been used in aquatic ecosystems [13,16,17,18,19].
2. Materials and Methods
2.1. Incubation Experiment
An incubation experiment was performed using a water sample taken from a stream in Yamaga City in Kumamoto Prefecture. The stream was surrounded by an evergreen coniferous plantation dominated by Cryptomeria japonica (Linnaeus f.) D. Don and Chamaecyparis obtusa (Sieb. et Zucc.) Endl. Although the artificial environment in the incubation study makes quantitative discussion difficult, it would be possible to test if tea bag decomposition is sufficiently sensitive to pick up the impacts of N addition. Four treatments were prepared, i.e., control (Cont; no N addition), low amount of N addition (Low-N; 60 µg N per L), middle amount of N addition (Middle-N; 300 µg N per L), and high amount of N addition (High-N; 1500 µg N per L), with three replicates for each tea type. The concentrations of the added N were determined considering the nitrate concentration in N-rich rivers in Japan [20]. Five tea bags were submerged into 500 hundred mL water samples in polyethylene terephthalate bottles. The bottles were incubated at 25 °C under dark conditions, and tea bags were retrieved at 7.5, 19.5, 42, 64.5, and 90 days after the start of the incubation. The retrieved tea bags were oven-dried (at 70 °C for 72 h) and mass loss ratios were determined. The bottles were covered with a polyethylene sheet for preventing water evaporation [21].
2.2. Tea Bags
Green tea bags (EAN: 87 10,908 90359 5; Lipton, Unilever, London, England) and rooibos tea bags (EAN: 87 22,700 18843 8; Lipton, Unilever, London, England) were prepared following Keuskamp et al. (2013) and the official webpage of the TBI’s approach [22]. Since Lipton has changed the mesh materials from woven nylon mesh (0.25 mm) to polypropylene nonwoven mesh (non-uniform mesh finer than 0.25 mm [23]) in 2017 [22], I used the new tea bags with nonwoven mesh. A field experiment reported that the changes in the mesh size did not have large impacts on decomposition rates of tea bags [23].
2.3. Tea Bag Index (TBI)
The TBI, which consists of a stabilization factor S (the ratio of undecomposed to decomposed hydrolysable fractions of green tea during the 90-day incubation) and a decomposition constant k of an asymptote model constructed by tea bag decomposition data, were calculated following Keuskamp et al. (2013) [12]. The stabilization factor S was calculated as (Equation (2)):
where ag is the mass loss of green tea during the 90-day incubation, and Hg is the hydrolysable fraction of green tea (0.842, determined by Keuskamp et al., 2013 [12]). The decomposition constant k was calculated by substituting the mass loss ratio of rooibos tea at the 90th day of the incubation for the following equation (Equation (3)):
where Wr(t) is the mass of rooibos tea remaining after incubation time t (90 days), Wr(0) is the initial mass of rooibos tea, and Hr is the hydrolysable fraction of rooibos tea (0.552, determined by Keuskamp et al. 2013 [12]). Note that the TBI approach assumes that the stabilization factor S of green tea is the same as that of rooibos tea and therefore parameter a in Equation (1) (labile fraction of rooibos tea) can be determined by multiplying hydrolysable fraction of rooibos tea (Hr) with the decomposed ratio of hydrolysable fraction of green tea (1 − S).
S = 1 − ag/Hg
Wr(t)/Wr(0) = (Hr × (1 − S)) × e−kt + (1 − Hr × (1 − S))
Seelen et al. (2019) proposed that the calculation of the TBI in aquatic ecosystems can be improved by using the leaching factor, i.e., the ratio of easily-leachable fraction to total tea weight (for more detail, see Seelen et al., 2019 [13]). In the present study, the corrected TBI was also calculated using the leaching factor (0.280 and 0.113 for green tea and rooibos tea, respectively for pelagic zone [13]).
2.4. Statistics
The effects of N addition on the mass remaining ratio of each tea were tested using a linear-mixed model with the incubation time (categorical data), N addition, and their interaction as fixed effects and the incubated bottles as a random effect. Two asymptote models were fitted to the time-series mass loss data of tea bags by nonlinear regression (nls procedure). In addition to an asymptote model with a single exponential term (Equation (1)), another model with double exponential term was also fitted (Equation (4):
where W(t) is the mass remaining after incubation time t, k1 and k2 are the decomposition constants, and a, b, and (1 − a − b) represent the organic matter fractions with different decomposability. Due to the double exponential term, the model could better describe the decomposition curve of teas in aquatic ecosystems, where initial mass loss is quicker than in terrestrial ecosystems. The obtained parameters were compared using a linear mixed model with concentrations of added N as a random effect because of the relatively small sample size in the present study. Parameters obtained from the TBI approach were compared with those obtained from the time-series data approach using an unpaired t-test. All statistical analyses were done using R version 4.0.2 (R Core Team 2020), with “lme4”, “lmerTest”, and “nls” libraries.
W(t) = a × e−k1t + b × e−k2t + (1 − a − b)
3. Results
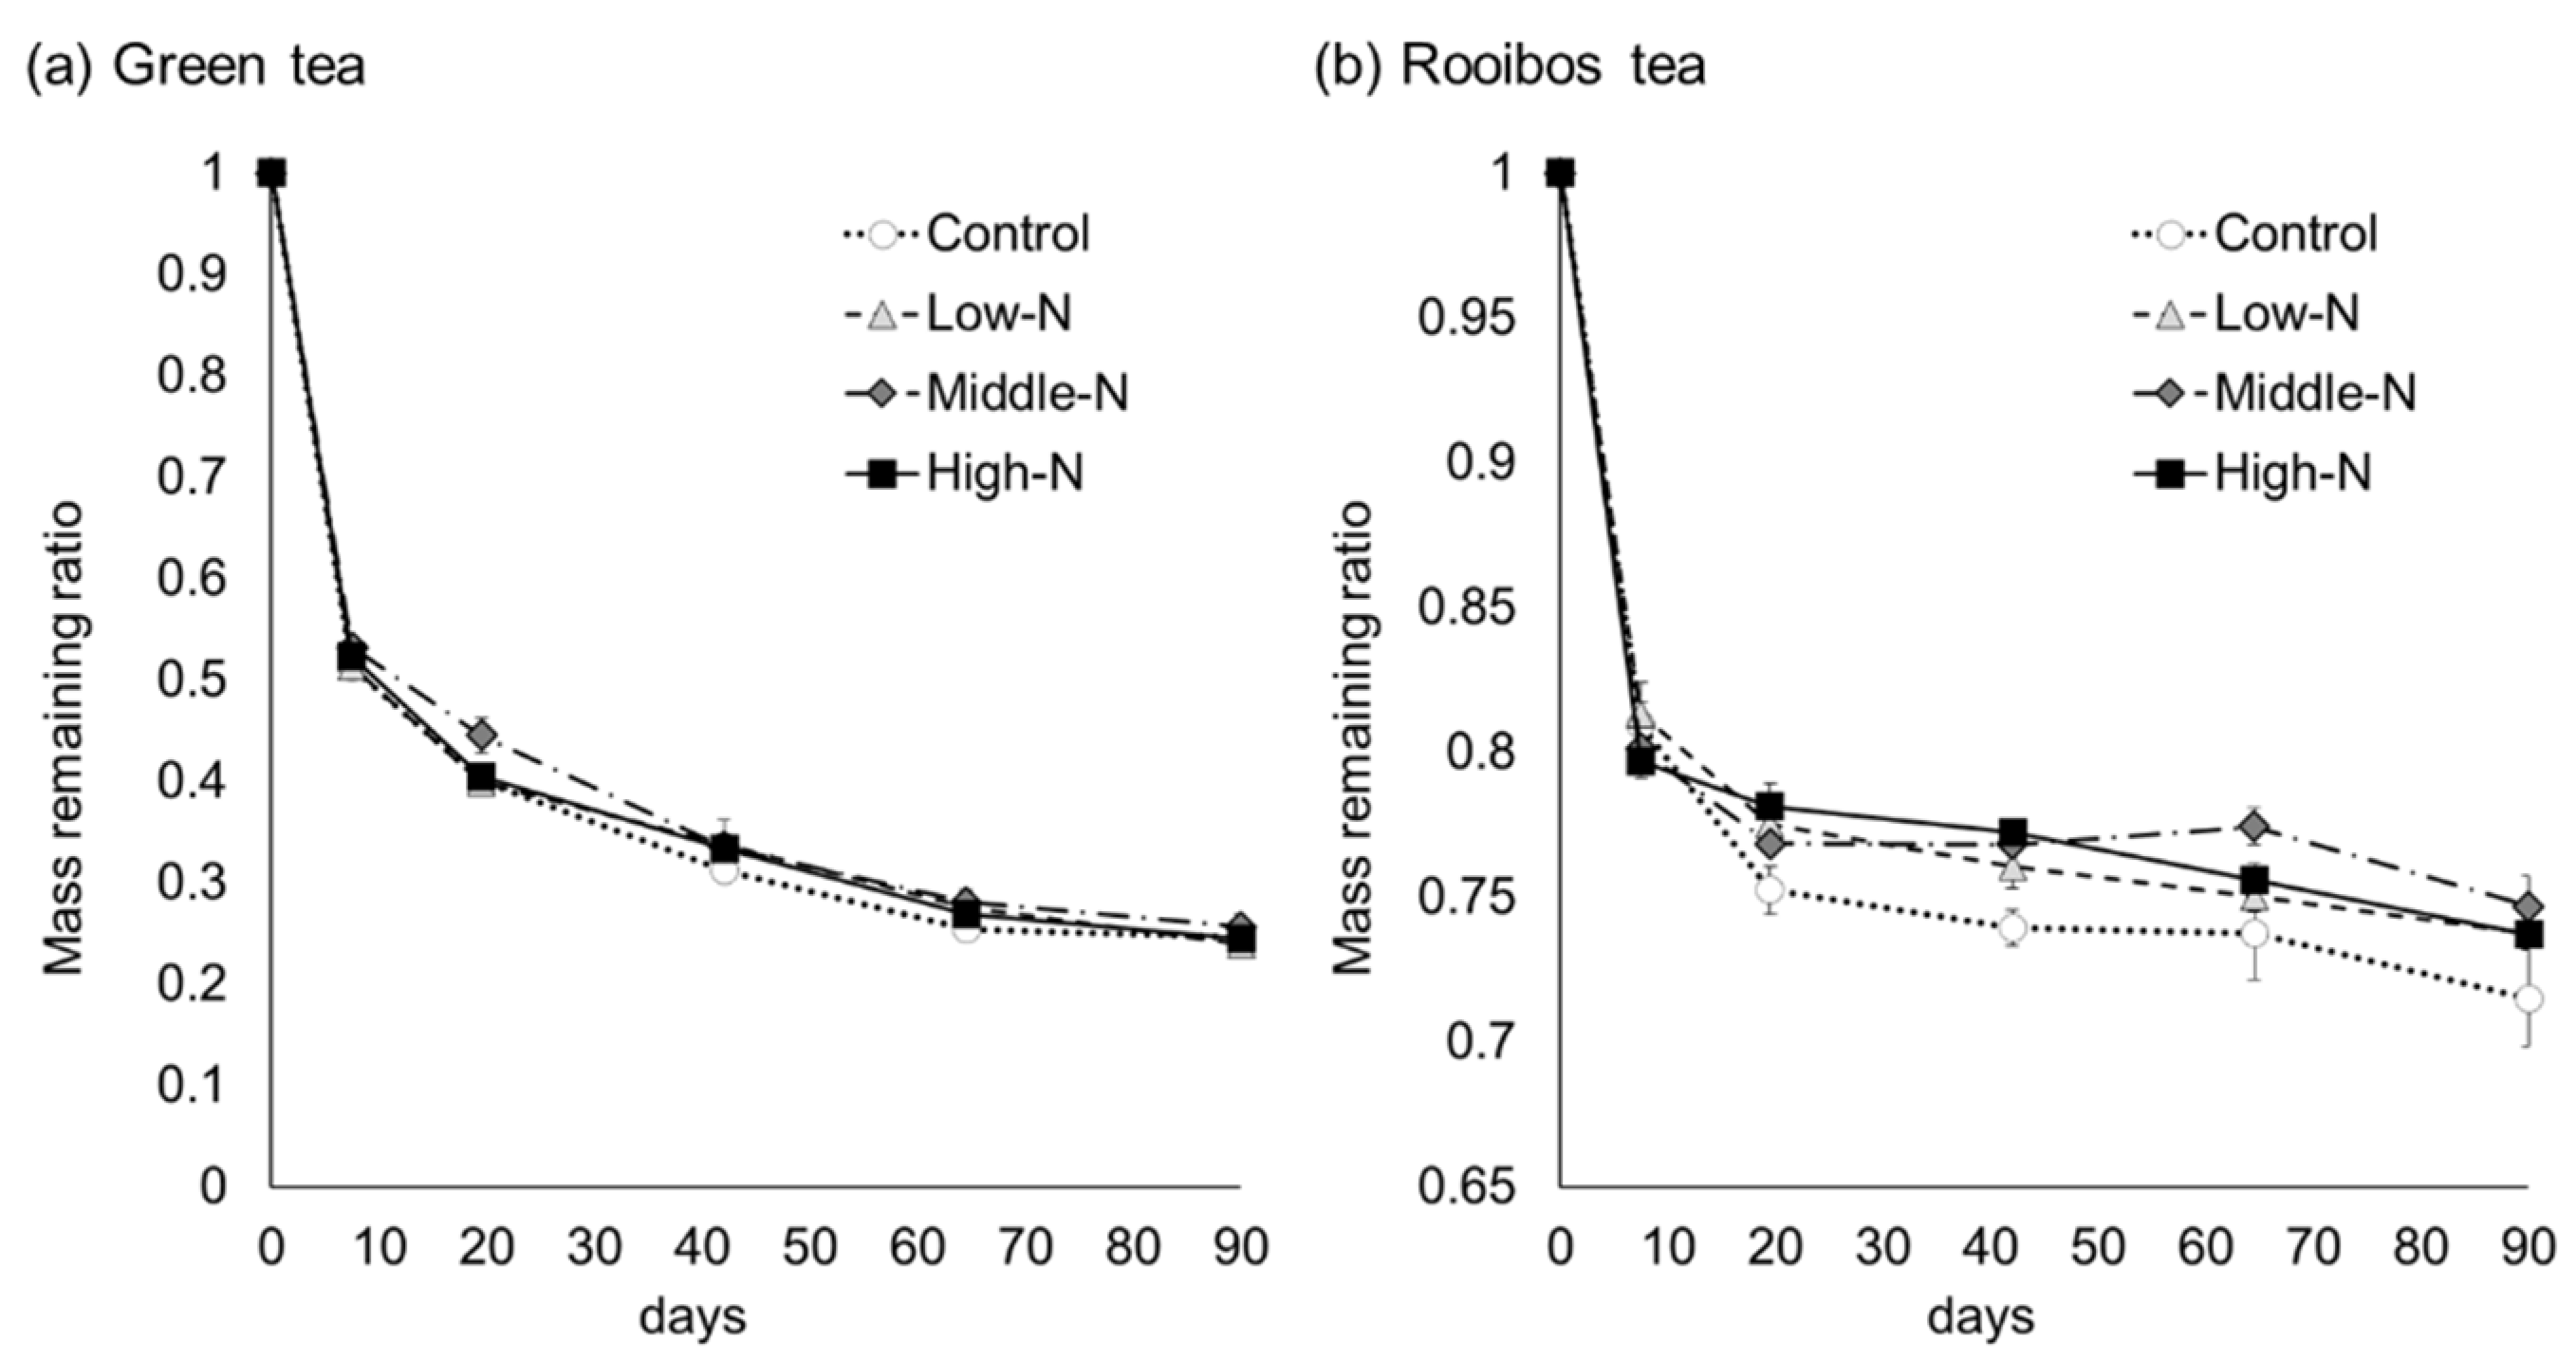
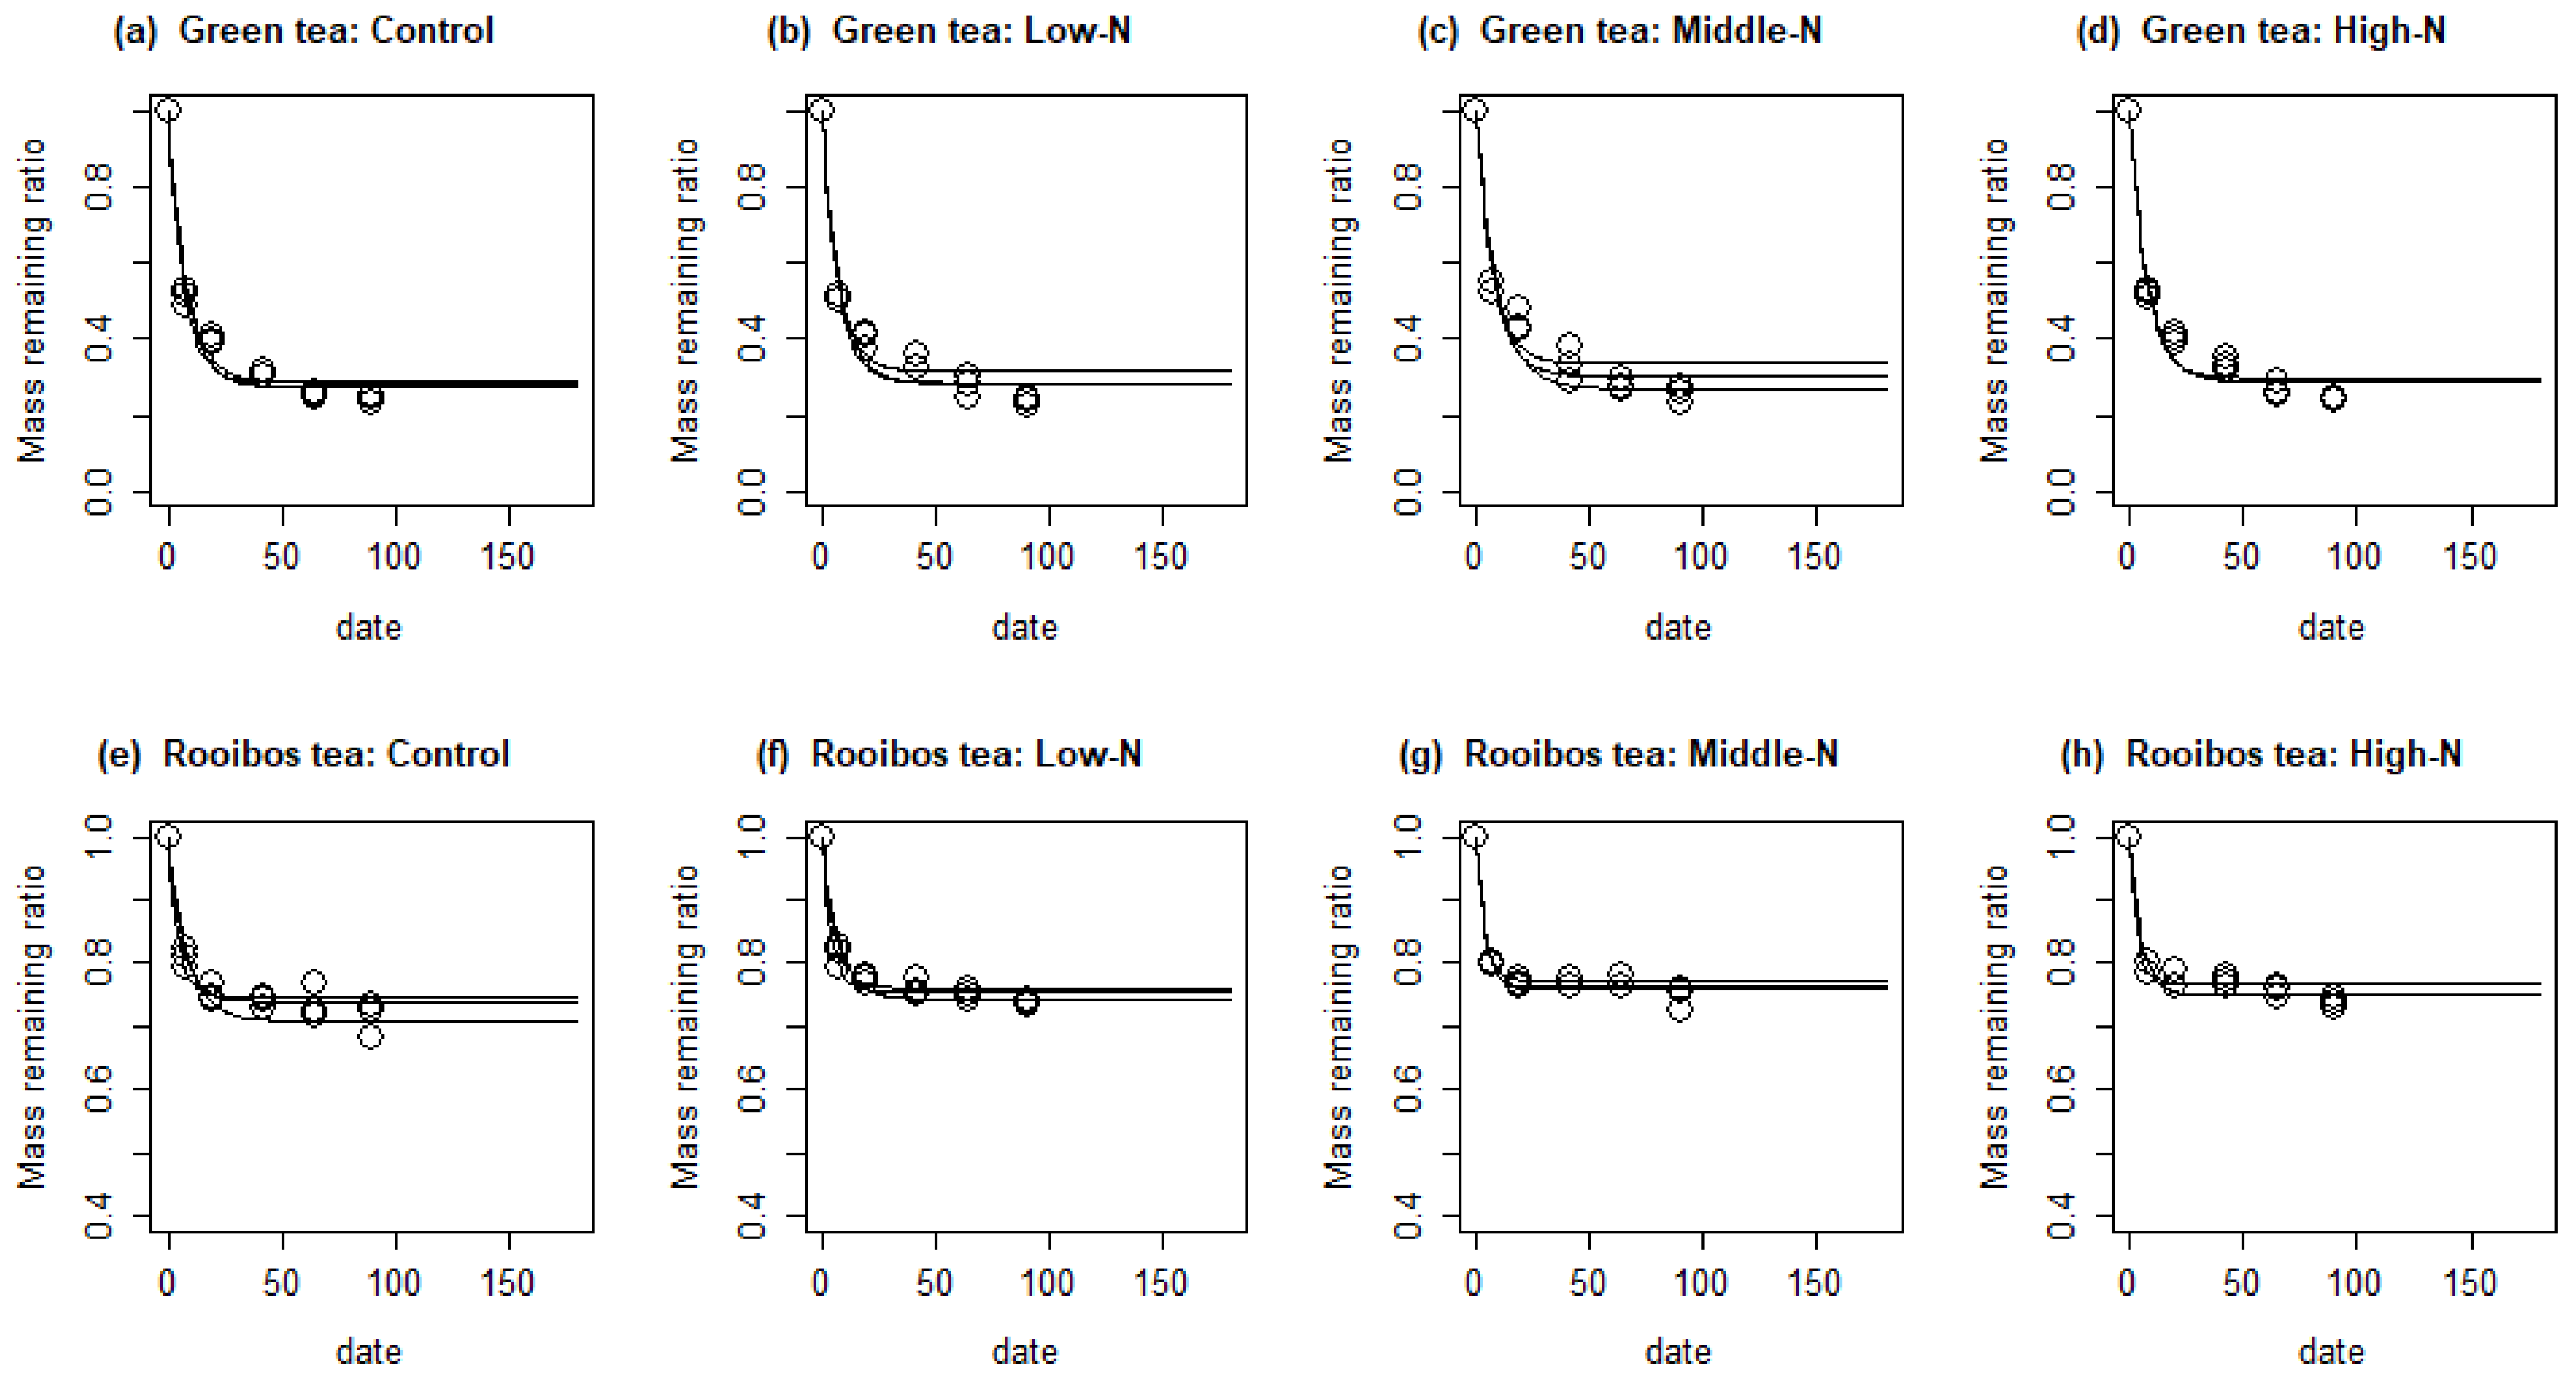
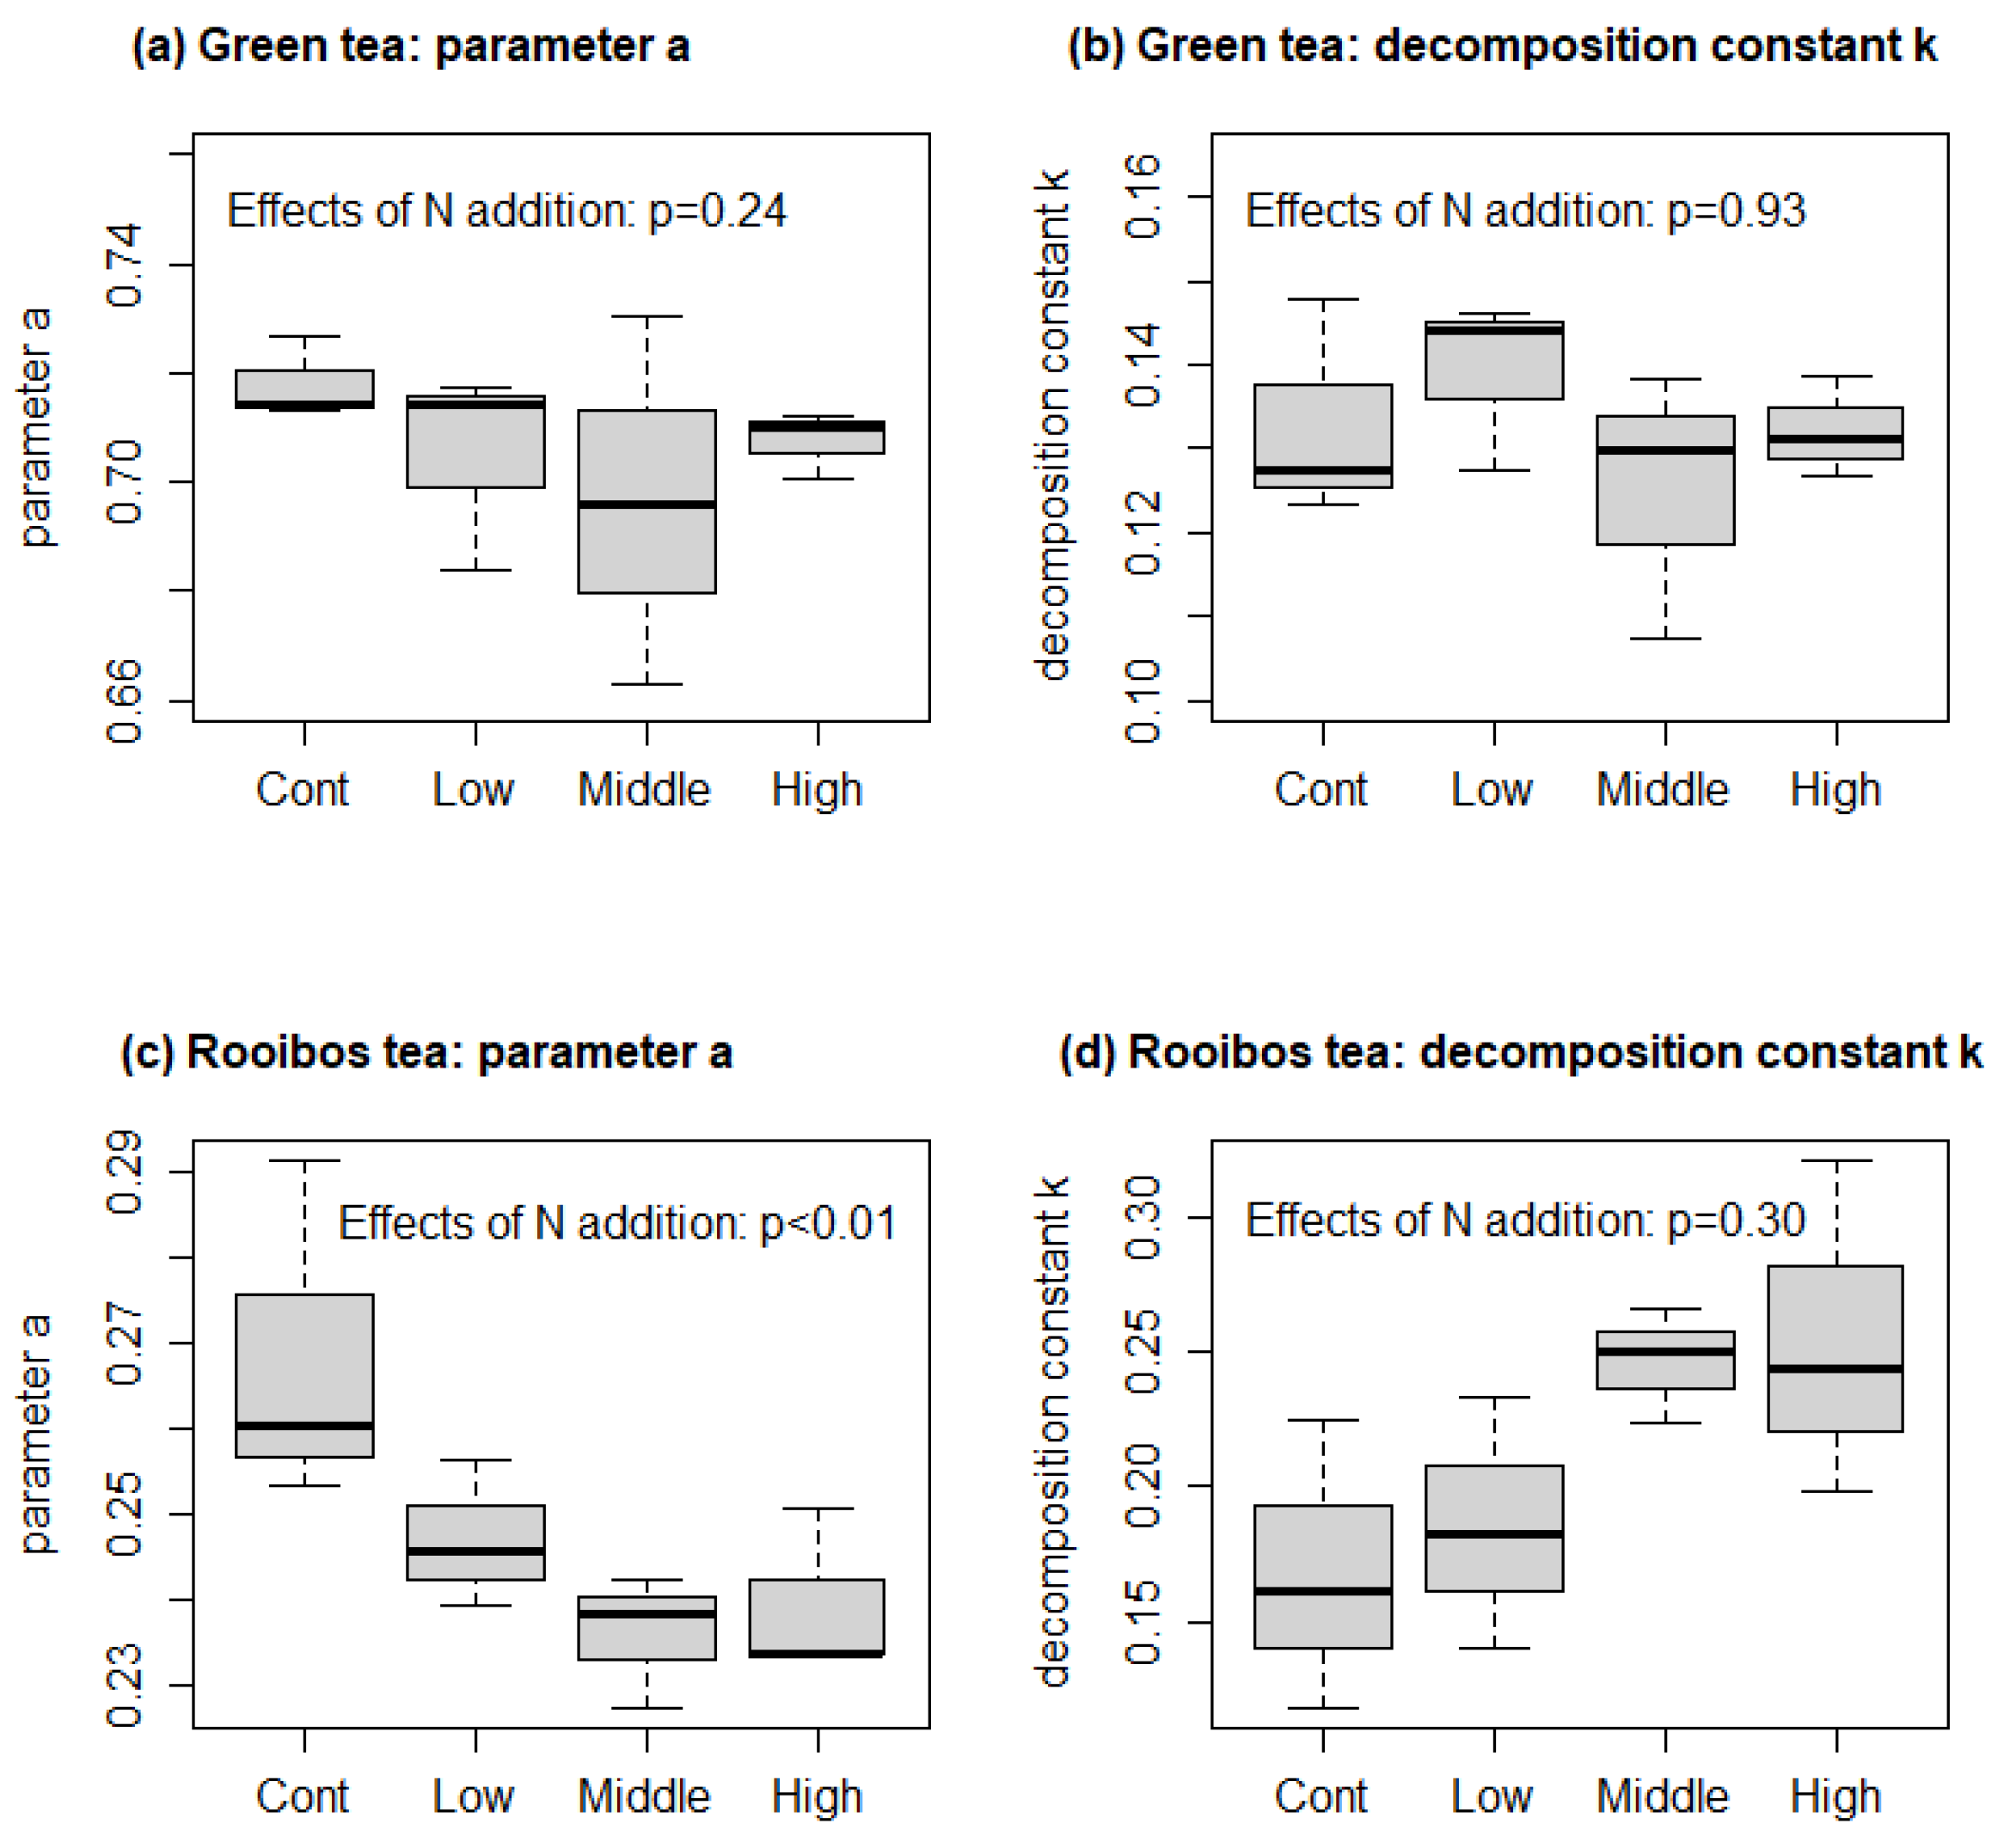
A Linear mixed model indicated that green tea decomposition was not affected by N addition (p = 0.19, Figure 1a), while rooibos tea decomposition was suppressed by N addition (p = 0.04, Figure 1b). A similar result was obtained by fitting an asymptote model with a single exponential term to the time-series data (Figure 2 and Figure 3). The parameter a (p = 0.24) and decomposition constant k (p = 0.93) of the asymptote model (Equation (1)) describing the green tea decomposition curve were not affected by N addition (Figure 3a,b). On the other hand, parameter a of the model describing the rooibos tea decomposition curve decreased significantly in N added samples (p < 0.01, Figure 3c), but decomposition constant k was not affected by N addition (p = 0.30), although it had a trend to be elevated by N addition (Figure 3d).
The asymptote model with double exponential term (Equation (4)) did not fit to the time-series data well. Although fittings of the model to several data, especially mass loss data of green teas, were better than the asymptote model with a single exponential term (Figure S1a–d from Supplementary Materials), model fittings to several data resulted in a decomposition constant k2 lower than zero (Figure S1e–h from Supplementary Materials).
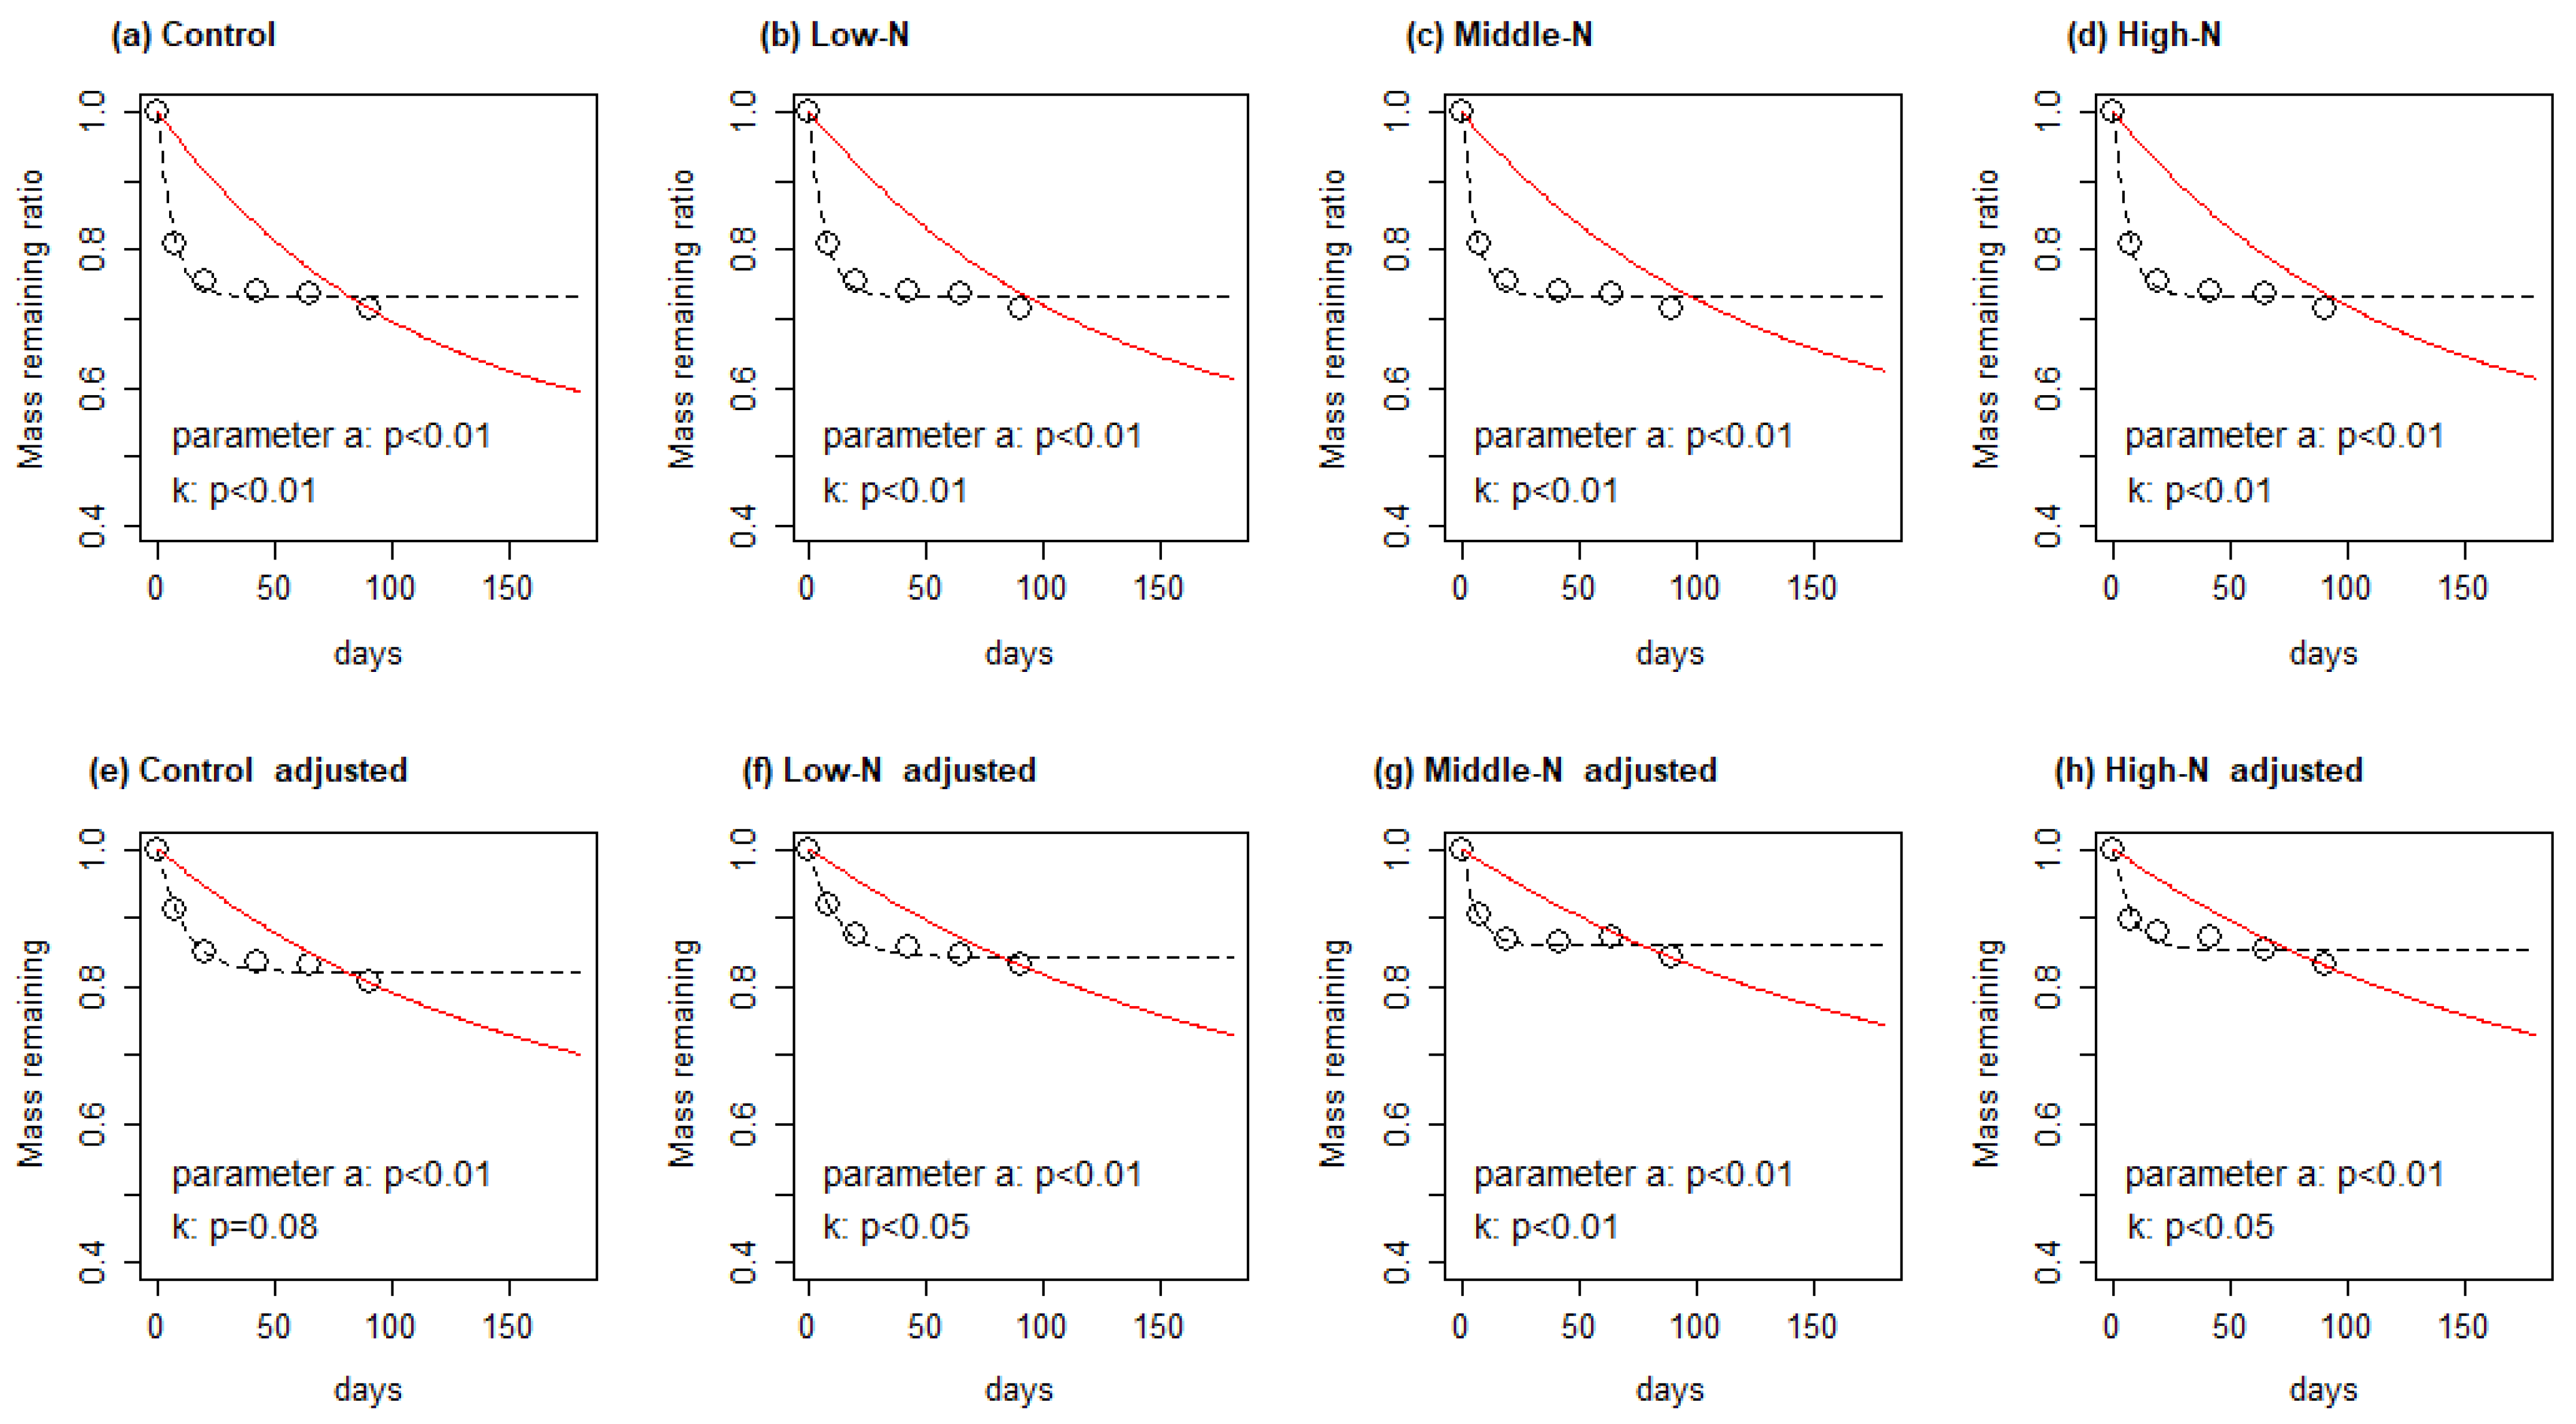
The asymptote model constructed by the TBI approach failed to predict the time-series data of rooibos tea decomposition (p < 0.01, Figure 4a–d), which supported the suggestion by a previous study that the TBI approach may not be applicable to aquatic ecosystems [15]. The corrected TBI approach by introducing leaching factor [13] did not improve the fitting much (Figure 4e–h).
4. Discussion
4.1. Effects of N Addition on Tea Decomposition
In the present study, rooibos tea decomposition was suppressed by N addition (Figure 1, Figure 2 and Figure 3). It is likely that the retarded decomposition was not caused by direct negative impacts of N on microbes such as too high a concentration of inorganic N, because the simultaneously observed green tea decomposition was not suppressed by N addition (Figure 1a). In terrestrial ecosystems, suppressed litter decomposition by N addition was often observed, especially at the late stage of decomposition [24,25], due to the following suggested possible mechanisms: (i) microbes stop decomposing litters because they no longer need to acquire the N from the litters [26]; (ii) chemically recalcitrant materials are produced by N addition [27]; and (iii) N addition shifts the microbial community [28,29]. Although these mechanisms were suggested to mainly explain the late stage of decomposition, i.e., decomposition of recalcitrant fractions such as acid insoluble fraction, rooibos tea decomposition in the present study could be suppressed in the same manner. Yue et al. (2016) [30] reported that lignin degradation was initiated much earlier in an alpine forest river compared with other terrestrial ecosystems. It is possible that the recalcitrant fraction (acid insoluble fraction) of rooibos tea in aquatic ecosystems is initiated much earlier than those in terrestrial ecosystems, and thus the suppressing impacts of N addition on the recalcitrant fraction could also appear earlier. This hypothesis can explain why green tea decomposition was not suppressed by N addition: green tea, containing a lesser amount of acid insoluble fraction [12], could have received less impacts.
4.2. Evaluating Tea Bags as Potential Standard Materials to Detect the Impacts of N Addition on Litter Decomposition
The present study demonstrated that the tea bags, especially the rooibos tea bags, were sufficiently sensitive to pick up the impacts of N addition on litter decomposition rates. Analyzing the time-series mass loss data of rooibos teas with a linier mixed model or by comparing the parameters obtained by fitting an asymptote model to the data successfully detected significant differences. Although green tea decomposition did not respond to N addition in the present study, it would be better to utilize both types of teas because it helps with the understanding of the underlining mechanisms. In the present study, as discussed above, no impacts of N addition on green tea decomposition supported the idea that the suppressed decomposition of rooibos tea by N addition was probably not caused by too high a concentration of inorganic N. The asymptote model with a double exponential term failed to fit to the time-series data (Figure S1e–h from Supplementary Materials). This was probably because the decomposition of acid insoluble fraction had started during the 90-day incubation (as discussed above). If this is the case, a combination of the exponential model with a lag-time model [31] fitted to data obtained from a longer observation time could make for better fitting. The TBI-based asymptote model also failed to predict the decomposition curve of rooibos tea (Figure 4), which supported a recent suggestion that the TBI approach may not be applicable to aquatic ecosystems [15]. Introducing the leaching factor for modifying the TBI approach [13] did not improve the prediction much, indicating that obtaining time-series data is necessary to understand the decomposition constant k of tea decomposition in aquatic ecosystems. Overall, the present study suggested that (i) tea bags can be used as standard materials for testing the impacts of N addition on litter decomposition in aquatic ecosystems, but only when using time-series measurement and not the TBI, and (ii) better model fittings may be possible to improve evaluating the impacts of N addition on aquatic litter decomposition.
Supplementary Materials
The following are available online at https://0-www-mdpi-com.brum.beds.ac.uk/article/10.3390/nitrogen2020017/s1, Figure S1: Examples of fitting the asymptote model with a double exponential term (Equation (4) in the text) to the time-series mass loss data of green teas (a–e) and rooibos teas (f–h). Each figure shows the model fitting to the tea bag decomposition data obtained from a replicate. Code numbers of replicates are shown on each figure. Each open circle represents one datum. Parameters of each model are: (a) a, k1, b, and k2 are 0.44297764, 0.35642208, 0.34723017, and 0.03150591, respectively; (b) a, k1, b, and k2 are 0.44084665, 0.37914748, 0.35471396, and 0.02767483, respectively; (c) a, k1, b, and k2 are 0.4708187, 0.3853025, 0.3652233, and 0.0178373, respectively; (d) a, k1, b, and k2 are 0.54725426, 0.21713970, 0.27081724, and 0.015745, respectively; (e) a, k1, b, and k2 are 0.600997887, 0.214203268, −0.950120034, and −0.001831729, respectively; (f) a, k1, b, and k2 are 0.217451477, 0.239464489, −0.005224775, and −0.025222519, respectively; (g) a, k1, b, and k2 are 0.2341728320, 0.2652264051, −0.0002957249, and −0.0400969399, respectively; (h) a, k1, b, and k2 are 0.207273251, 0.406834784, −0.007380097, and −0.024016403, respectively.
Author Contributions
Conceptualization, T.M.; methodology, T.M.; software, T.M.; validation, T.M.; formal analysis, T.M.; investigation, T.M.; resources, T.M.; data curation, T.M.; writing—original draft preparation, T.M.; writing—review and editing, T.M.; visualization, T.M.; project administration, T.M.; funding acquisition, T.M. All authors have read and agreed to the published version of the manuscript.
Funding
This study was financially supported by JSPS KAKENHI Grant Number JP19K15879.
Data Availability Statement
Data supporting reported results can be sent when requested to the corresponding author.
Acknowledgments
I thank Yumiko Sakamoto and Akane Sakumori for their assistance on the laboratory work.
Conflicts of Interest
I declare that I do not have any conflict of interest.
References
- Graça, M.A.S.; Ferreira, V.; Canhoto, C.; Encalada, A.C.; Guerrero-Bolaño, F.; Wantzen, K.M.; Boyero, L. A conceptual model of litter breakdown in low order streams. Int. Rev. Hydrobiol. 2015, 100, 1–12. [Google Scholar] [CrossRef]
- García-Palacios, P.; McKie, B.G.; Handa, I.T.; Frainer, A.; Hättenschwiler, S. The importance of litter traits and decomposers for litter decomposition: A comparison of aquatic and terrestrial ecosystems within and across biomes. Funct. Ecol. 2016, 30, 819–829. [Google Scholar] [CrossRef] [Green Version]
- Berg, B. Decomposition patterns for foliar litter—A theory for influencing factors. Soil Biol. Biochem. 2014, 78, 222–232. [Google Scholar] [CrossRef]
- Ferreira, V.; Castagneyrol, B.; Koricheva, J.; Gulis, V.; Chauvet, E.; Graça, M.A.S. A meta-analysis of the effects of nutrient enrichment on litter decomposition in streams. Biol. Rev. 2014, 90, 669–688. [Google Scholar] [CrossRef] [PubMed]
- Abelho, M.; Graça, M.A.S. Effects of nutrient enrichment on decomposition and fungal colonization of sweet chestnut leaves in an Iberian stream (central Portugal). Ecology 2006, 560, 239–247. [Google Scholar] [CrossRef] [Green Version]
- Triska, F.J.; Sedell, J.R. Decomposition of four species of leaf litter in response to nitrate manipulation. Ecology 1976, 57, 783–792. [Google Scholar] [CrossRef]
- Woodward, G.; Gessner, M.O.; Giller, P.S.; Gulis, V.; Hladyz, S.; Lecerf, A.; Malmqvist, B.; McKie, B.G.; Tiegs, S.D.; Cariss, H.; et al. Continental-scale effects of nutrient pollution on stream ecosystem functioning. Science 2012, 336, 1438–1440. [Google Scholar] [CrossRef] [Green Version]
- Knorr, M.; Frey, S.D.; Curtis, P.S. Nitrogen additions and litter decomposition: A meta-analysis. Ecology 2005, 86, 3252–3257. [Google Scholar] [CrossRef]
- Mo, J.; Brown, S.; Xue, J.; Fang, Y.; Li, Z. Response of litter decomposition to simulated N deposition in disturbed, rehabilitated and mature forests in subtropical China. Plant Soil 2006, 282, 135–151. [Google Scholar] [CrossRef]
- Kaspari, M.; Garcia, M.N.; Harms, K.E.; Santana, M.; Wright, S.J.; Yavitt, J.B. Multiple nutrients limit litterfall and decomposition in a tropical forest. Ecol. Lett. 2007, 11, 35–43. [Google Scholar] [CrossRef] [PubMed]
- Mori, T.; Hashimoto, T.; Sakai, Y. Evaluating the tea bag method as a potential tool for detecting the effects of added nutrients and their interactions with climate on litter decomposition. bioRxiv 2021. [Google Scholar] [CrossRef]
- Keuskamp, J.A.; Dingemans, B.J.J.; Lehtinen, T.; Sarneel, J.M.; Hefting, M.M. Tea Bag Index: A novel approach to collect uniform decomposition data across ecosystems. Methods Ecol. Evol. 2013, 4, 1070–1075. [Google Scholar] [CrossRef]
- Seelen, L.M.; Flaim, G.; Keuskamp, J.; Teurlincx, S.; Font, R.A.; Tolunay, D.; Fránková, M.; Šumberová, K.; Temponeras, M.; Lenhardt, M.; et al. An affordable and reliable assessment of aquatic decomposition: Tailoring the Tea Bag Index to surface waters. Water Res. 2019, 151, 31–43. [Google Scholar] [CrossRef]
- Bernhardt, E.S.; Likens, G.E. Dissolved organic carbon enrichment alters nitrogen dynamics in a forest stream. Ecology 2002, 83, 1689–1700. [Google Scholar] [CrossRef]
- Mori, T.; Ono, K.; Sakai, Y. Testing the Tea Bag Index as a potential indicator for assessing litter decomposition in aquatic ecosystems. bioRxiv 2021. [Google Scholar] [CrossRef]
- Hunter, W.R.; Williamson, A.; Sarneel, J.M. Using the Tea Bag Index to unravel how human pharmaceuticals affect aquatic microbial activity. bioRxiv 2019. [Google Scholar] [CrossRef] [Green Version]
- Mueller, P.; Schile-Beers, L.M.; Mozdzer, T.J.; Chmura, G.L.; Dinter, T.; Kuzyakov, Y.; De Groot, A.V.; Esselink, P.; Smit, C.; D’Alpaos, A.; et al. Global-change effects on early-stage decomposition processes in tidal wetlands—Implications from a global survey using standardized litter. Biogeosciences 2018, 15, 3189–3202. [Google Scholar] [CrossRef] [Green Version]
- Lalimi, F.Y.; Silvestri, S.; D’Alpaos, A.; Roner, M.; Marani, M. The spatial variability of organic matter and decomposition processes at the marsh scale. J. Geophys. Res. Biogeosci. 2018, 123, 3713–3727. [Google Scholar] [CrossRef]
- Peralta–Maraver, I.; Perkins, D.M.; Thompson, M.S.A.; Fussmann, K.; Reiss, J.; Robertson, A.L. Comparing biotic drivers of litter breakdown across stream compartments. J. Anim. Ecol. 2019, 88, 1146–1157. [Google Scholar] [CrossRef] [PubMed]
- Ito, Y.; Miura, S.; Kato, M.; Yoshinaga, S. Regional distribution of nitrate concentrations in the stream water of forested watersheds in the Kanto and Chubu districts. J. Jpn. For. Soc. 2004, 86, 275–278. [Google Scholar]
- Mori, T.; Ohta, S.; Ishizuka, S.; Konda, R.; Wicaksono, A.; Heriyanto, J.; Hardjono, A. Effects of phosphorus addition with and without ammonium, nitrate, or glucose on N2O and NO emissions from soil sampled under Acacia mangium plantation and incubated at 100 % of the water-filled pore space. Biol. Fertil. Soils 2012, 49, 13–21. [Google Scholar] [CrossRef]
- Teatime4 Science. Available online: http://www.teatime4science.org/ (accessed on 30 March 2021).
- Mori, T.; Aoyagi, R.; Taga, H.; Sakai, Y. Effects of water content and mesh size on tea bag decomposition. Ecologies 2021, 2, 175–186. [Google Scholar] [CrossRef]
- Berg, B. Nutrient release from litter and humus in coniferous forest soils—A mini review. Scand. J. For. Res. 1986, 1, 359–369. [Google Scholar] [CrossRef]
- Fog, K. The effect of added nitrogen on the rate of decomposition of organic matter. Biol. Rev. 1988, 63, 433–462. [Google Scholar] [CrossRef]
- Craine, J.M.; Morrow, C.; Fierer, N. Microbial nitrogen limitation increases decomposition. Ecology 2007, 88, 2105–2113. [Google Scholar] [CrossRef]
- Berg, B.; Matzner, E. Effect of N deposition on decomposition of plant litter and soil organic matter in forest systems. Environ. Rev. 1997, 5, 1–25. [Google Scholar] [CrossRef]
- Bonner, M.T.; Castro, D.; Schneider, A.N.; Sundström, G.; Hurry, V.; Street, N.R.; Näsholm, T. Why does nitrogen addition to forest soils inhibit decomposition? Soil Biol. Biochem. 2019, 137, 107570. [Google Scholar] [CrossRef]
- Ramirez, K.S.; Craine, J.; Fierer, N. Consistent effects of nitrogen amendments on soil microbial communities and processes across biomes. Glob. Chang. Biol. 2012, 18, 1918–1927. [Google Scholar] [CrossRef]
- Yue, K.; Peng, C.; Yang, W.; Peng, Y.; Zhang, C.; Huang, C.; Wu, F. Degradation of lignin and cellulose during foliar litter decomposition in an alpine forest river. Ecosphere 2016, 7, e01523. [Google Scholar] [CrossRef]
- Harmon, M.; Franklin, J.; Swanson, F.; Sollins, P.; Gregory, S.; Lattin, J.; Anderson, N.; Cline, S.; Aumen, N.; Sedell, J.; et al. Ecology of coarse woody debris in temperate ecosystems. Adv. Ecol. Res. 2004, 15, 59–234. [Google Scholar] [CrossRef]
Figure 1.
Effects of nitrogen addition on mass of (a) green tea and (b) rooibos tea remaining at 0, 7.5, 19.5, 42, 64.5, and 90 days after the start of the incubation. Control, no nitrogen addition. Low-N, low amount of nitrogen addition (60 µg N per L). Middle-N, middle amount of nitrogen addition (300 µg N per L). High-N, high amount of nitrogen addition (1500 µg N per L). The error bars indicate the standard error of the three replicates.

Figure 2.
Fitting of the asymptote model with a single exponential term (Equation (1) in the text) to the time-series mass loss data of green teas (a–d) and rooibos teas (e–h). Control, no nitrogen addition. Low-N, low amount of nitrogen addition (60 µg N per L). Middle-N, middle amount of nitrogen addition (300 µg N per L). High-N, high amount of nitrogen addition (1500 µg N per L). Each open circle represents one datum.

Figure 3.
Effects of nitrogen addition on the parameter a and the decomposition constant k of the asymptote model with a single exponential term (Equation (1) in the text) fitted to mass loss data of green teas (a–b) and rooibos teas (c–d).
Figure 3.
Effects of nitrogen addition on the parameter a and the decomposition constant k of the asymptote model with a single exponential term (Equation (1) in the text) fitted to mass loss data of green teas (a–b) and rooibos teas (c–d).

Figure 4.
Relative mass of rooibos teas remaining in a water sample taken from a stream in Kumamoto, Japan (a–d), and the relative mass adjusted by using the leaching factor (e–h). Dashed lines show fittings to the asymptote model (Equation (1) in the text). Solid red lines show asymptote models describing rooibos tea decomposition determined by the TBI approach. Control, no nitrogen addition. Low-N, low amount of nitrogen addition (60 µg N per L). Middle-N, middle amount of nitrogen addition (300 µg N per L). High-N, high amount of nitrogen addition (1500 µg N per L). Each open circle is an average of three replicates. Parameter a and decomposition constant k obtained from the TBI approach were compared with those obtained from the time-series data approach using unpaired t-test.

Publisher’s Note: MDPI stays neutral with regard to jurisdictional claims in published maps and institutional affiliations. |
© 2021 by the author. Licensee MDPI, Basel, Switzerland. This article is an open access article distributed under the terms and conditions of the Creative Commons Attribution (CC BY) license (https://creativecommons.org/licenses/by/4.0/).
Share and Cite
MDPI and ACS Style
Mori, T. Tea Bags—Standard Materials for Testing Impacts of Nitrogen Addition on Litter Decomposition in Aquatic Ecosystems? Nitrogen 2021, 2, 259-267. https://0-doi-org.brum.beds.ac.uk/10.3390/nitrogen2020017
AMA Style
Mori T. Tea Bags—Standard Materials for Testing Impacts of Nitrogen Addition on Litter Decomposition in Aquatic Ecosystems? Nitrogen. 2021; 2(2):259-267. https://0-doi-org.brum.beds.ac.uk/10.3390/nitrogen2020017
Chicago/Turabian StyleMori, Taiki. 2021. "Tea Bags—Standard Materials for Testing Impacts of Nitrogen Addition on Litter Decomposition in Aquatic Ecosystems?" Nitrogen 2, no. 2: 259-267. https://0-doi-org.brum.beds.ac.uk/10.3390/nitrogen2020017