Article

Comparison of Nitrogen Treatment by Four Onsite Wastewater Systems in Nutrient-Sensitive Watersheds of the North Carolina Coastal Plain

by
Charles P. Humphrey, Jr.
1,*,
Michael O’Driscoll
2 and
Guy Iverson
1
1
Environmental Health Sciences Program, Department of Health Education & Promotion, East Carolina University, Greenville, NC 27858, USA
2
Department of Coastal Studies, East Carolina University, Greenville, NC 27858, USA
*
Author to whom correspondence should be addressed.
Submission received: 7 April 2021 / Revised: 20 May 2021 / Accepted: 1 June 2021 / Published: 8 June 2021

Abstract

:
Wastewater may be a source of nitrogen (N) to groundwater and surface waters if not effectively treated. In North Carolina, onsite wastewater systems (OWSs) are used by 50% of the population for wastewater treatment, but most OWSs are not routinely monitored. There is a lack of information regarding the N contributions from OWSs to water resources. Four sites with OWSs were instrumented with groundwater wells near their drainfield trenches to compare N concentrations in groundwater to concentrations in wastewater and to determine the N treatment efficiency of the systems. Two OWSs (Site 200 and 300) were less than 1 year old, and two (Site 100 and 400) were more than 10 years old at the start of the study. Two OWSs (Site 100 and 200) used pressure dosing, while two OWSs (Site 300 and 400) used gravity distribution. The mean N treatment efficiency of the four OWSs was 77%. The new OWSs were more efficient (92%) relative to the older OWSs (62%) at reducing N concentrations. Similar N treatment efficiencies were observed when pooling data for the pressure dosed (77%) and gravity (79%) OWSs. Each OWS influenced groundwater by causing increases in N concentrations. It is important that new OWSs are installed at a shallow depth and with sufficient separation to groundwater to promote the aerobic treatment of wastewater. Remediation strategies including the installation of permeable reactive barriers or the use of media filters may be needed in some areas to reduce N transport from existing OWS.

1. Introduction

1.1. Nitrogen and Environmental Health

Nitrogen (N) is an essential nutrient for plants and low concentrations of N often limit primary productivity on land [1] and in water [2]. Additions of N-based fertilizers to agricultural fields and forests have increased crop yields [3] and timber production [4]. These increases are important as the global population has doubled in the last 50 years, and thus the demand for food and fiber has grown [5]. As the global population continues to increase, so too will the generation of human wastewater which contains elevated concentrations of N [6]. Increases in N contributions to water resources during the period of increased population growth, fertilizer applications, and wastewater discharges has stimulated algal blooms and eutrophication [7,8] and caused substantial economic harm [9]. Excess N loading to water resources is a major threat to public and environmental health [7,8] and must be curtailed. For example, water supplies with high concentrations of NO3 may cause methemoglobinemia in infants [10]. The US EPA has set a maximum contaminant level of 10 mg·L−1 for NO3 N in drinking water supplies, while the World Health Organization suggests 11.3 mg·L−1 as the standard [11]. Corrective actions are suggested when concentrations of NO3 exceed these thresholds. N loading to surface waters has stimulated toxic algal blooms, causing disruptions in water supply and water use impairment [7]. Legislation has been enacted in some regions with nutrient-sensitive waters, including North Carolina, to reduce N loading to water resources from various sources including agriculture, urban runoff, and municipal wastewater treatment plants [12]. However, reducing contributions of N from onsite wastewater systems (OWSs) to water resources in North Carolina was not included in the regulations. More research was suggested to gain a better understanding of the treatment efficiency of OWSs and their impact with regard to N contributions to water resources. If these data suggest OWSs can be a potentially significant N source, then additional efforts will be necessary to develop mitigation strategies for reducing N loads from OWSs to water resources.

1.2. Wastewater as a Nitrogen Source

Wastewater from humans is enriched with nutrients and typically contains between 26 and 120 mg·L−1 of N [6]. On a mass basis, each person excretes about 4 kg of N per year in their wastewater [13], which must be effectively treated and dispersed to protect water resources. Wastewater in urban areas is typically treated via centralized sewer plants which are required to monitor influent and effluent characteristics including N concentrations [14]. Wastewater in rural areas is often managed via OWSs, but routine monitoring for nutrient treatment is not required for these technologies [15,16]. In the United States, approximately 23% of the population use OWSs, and in some states, such as North Carolina (NC), nearly 50% are served by OWSs [13,17]. Most OWSs are soil-based treatment units and typically include a septic tank, effluent distribution device, drainfield trenches, and soil [18]. The septic tank promotes the settling of solids and the digestion of organic matter, resulting in a reduction in biochemical oxygen demand and total suspended solids [19]. Raw wastewater is mostly total Kjeldahl nitrogen (TKN), a combination of organic N and NH4+ [6,20]. Ammonification, or the transformation of organic N to NH4+, occurs in the septic tank via anaerobic decomposition. Septic tank effluent is typically 70 to 90% NH4+, and the effluent is sent to drainfield trenches via an effluent distribution device [21]. Drainfield trenches are filled with porous media that temporarily stores the effluent until infiltration into soil [22]. Most of the N transformations and treatment occur in soil beneath the drainfield trenches [23,24,25]. From an environmental perspective, the ideal treatment of N would include ammonification in the septic tank, followed by nitrification (conversion of NH4+ to NO3) in the vadose zone beneath trenches, and denitrification (conversion of NO3 to N2 gas), ultimately resulting in the mass removal of N from groundwater near the OWS [21]. It is also possible for NH4+ to adsorb to cation exchange sites on clay particles or organic matter, thus reducing N transport [26]. Additionally, both NH4+ and NO3 are plant and microbe available forms of N, and thus they may be immobilized via uptake by plant roots or soil microorganisms [1]. These N transformations and removal processes are influenced by the physicochemical environment within the septic tank, in soil below the drainfield trenches, and in groundwater beneath the system [27,28].

1.3. Onsite Wastewater Systems and Nitrogen Treatment

N treatment by OWSs is related to several factors including but not limited to soil type, the vertical separation distance to groundwater, wastewater loading characteristics, the system type, and the extensiveness of biomat formation along the trench bottom. For example, several studies have documented higher N treatment efficiencies for OWSs installed in clayey soils in comparison to sandy soils. More specifically, a study [29] comparing N treatment by four conventional-style OWSs in one North Carolina neighborhood reported the highest reduction in N concentration (95%) was for the OWS in a soil with the highest clay content (35%) and lowest hydraulic conductivity (0.13 m·day−1). The other three OWSs in the study were installed in soils that had between 25 and 26% clay, with a mean hydraulic conductivity of 0.28 m·day−1, and a mean N reduction of 54% (range of 33 to 71%) [29]. A different study of 16 OWSs [30] in coastal North Carolina reported mean TDN concentration reductions of 64% for eight OWSs in sandy soils with an average saturated hydraulic conductivity of 3.1 m·day−1 as compared to TDN reductions of 95% for four OWSs in more clayey soils with a mean hydraulic conductivity of 0.2 m·day−1, and 76% for four OWSs in loam soils with a mean hydraulic conductivity of 0.3 m·day−1. The greater reactive surface area and smaller voids found in clayey soils likely provided a more robust environment for N removal [25,29]. Negative charges associated with cation exchange sites on clay minerals may attract positively charged ions, including NH4+, thus limiting their mobility [26] and enhancing N treatment. The relatively small pores characteristic of clayey soils may increase the residence time of infiltrating wastewater, allowing more opportunity for N transformations [25,31].
The vertical separation distance between drainfield trenches and groundwater has been shown to influence N treatment by affecting nitrification and subsequent denitrification potential [27]. If the groundwater is too close to the drainfield trenches, then diffusion the of oxygen may be restricted, limiting the oxidation of NH4+ via nitrification. For example, a study in Ireland [32] showed that NH4+ comprised 27% of TDN in soil water 0.3 m below the drainfield trenches, but less than 4.5% for samples collected 1 m below the trench. In coastal NC, research [25] showed that NH4+ comprised a mean of 41% of dissolved inorganic N for nine OWSs with less than 0.45 m separation distances from drainfield trenches to the high-water table, but less than 13% of N for seven OWSs that had greater than 0.45 m vertical separation. A different study of two OWSs in NC [33] showed that groundwater inorganic N concentrations beneath the drainfield trenches of an OWS with less than 0.3 m to groundwater was comprised predominantly of NH4+, but for an OWS with more than 0.45 m to groundwater, the dominant N species was NO3. Nitrification was inhibited at most of these locations where the vertical separation distance to groundwater was less than 0.45 m and this likely restricted oxygen diffusion and the oxidation of NH4+. As stated previously, nitrification is an important step to N removal via denitrification [27], and thus, nitrification often influences the overall N treatment efficiency of OWSs.
Wastewater loading is another factor that has been shown to influence N concentrations in groundwater beneath OWSs. Seasonally used OWSs have shown large variations in N concentrations in groundwater due to inconsistent wastewater discharges to soil. A study [34] of three OWSs serving seasonally used homes in Rhode Island reported groundwater NO3 concentrations near drainfields were typically less than 2.5 mg·L−1 during periods when the home was unoccupied, but increased to 115.5, 73.8, and 45.4 mg·L−1, respectively, during occupied months. That study [34] showed that NO3-N concentrations fluctuated by 115, 73, and 44 mg·L−1, respectively throughout the year based on wastewater loading. Research [30] in coastal North Carolina showed that the mean TDN concentration in groundwater beneath the drainfield of a seasonally used OWS was the lowest (14.7 mg·L−1) of eight OWSs installed in the same soil types, in the same region, and with the same system technology. The mean TDN concentration of groundwater near the drainfield trenches of the other seven OWSs used year-round in the study [30] was more than 2.5 times greater (39.5 mg·L−1) than the seasonally used OWS. Research [32] comparing N treatment by six OWSs in Ireland showed the three OWSs with the highest loading rates (>41 L·m2·day−1) had the lowest removal efficiency (75 to 82%) while the three OWSs with lower loading rates (<25 L·m2·day−1) all exceeded 93% removal. Collectively, these studies indicate that wastewater loading characteristics including the consistency of discharges and magnitude of discharges may influence N concentrations in groundwater beneath OWSs.
The type of OWS used may also be a factor that influence treatment, although there are conflicting reports as to the significance of system type. Research [20] in Rhode Island comparing the N treatment efficiency of 8 pressure dosed and 11 gravity flow OWSs in sandy fill material reported mean N reduction efficiencies of 40 and 48%, respectively. While the differences in treatment between the pressure dosed and gravity systems were not statistically significant, they attributed the higher mean N treatment by the gravity flow systems to the development of a more extensive biomat in the fill material. An earlier study [35] in North Carolina that evaluated the N treatment of seven pressure dosed and eight gravity flow OWSs revealed lower N concentrations in groundwater beneath the pressure dosed systems. The researchers [35] concluded that N treatment by the pressure dosed OWSs was improved by the mostly aerobic conditions of the shallow-placed laterals, wetting and drying cycles associated with fluctuating water tables, and dose–rest cycles of the pressure dosed OWSs. Research [36] comparing the N treatment efficiency of two gravity flow, conventional OWSs and two single-pass sand filters showed that sand filters reduced N by 50% but were less efficient than the gravity flow OWSs (70%) evaluated in the same region of central North Carolina. Additionally, a study [22] of 148 OWSs in Texas which included 36 conventional, 56 chamber, and 56 multi-pipe systems did not reveal statistically significant differences in performance based on media used in the drainfield trenches. Soil type was the main factor cited with regard to performance in that research [22]. These studies show that the influence of system type on N treatment may not be as important as other factors such as soil type and wastewater loading characteristics.
Some research has suggested that wastewater treatment by OWSs is influenced by the development of a biomat or clogging mat at the drainfield trench bottom-soil interface [20,31,37,38]. Biomats are formed from suspended solids, secretions from microorganisms, and microorganism cells that accumulate on the trench bottom after years of routine wastewater discharges to the drainfield [37,38]. Biomats seal off or clog larger soil pores and effectively reduce the infiltration capacity of soil [32,38]. Biomats may improve treatment by providing an additional filter of wastewater and increasing the residence time of wastewater in soil [20,31,34,37]. For example, research in Rhode Island [20,34] and Ireland [31,32] concluded that nutrient treatment was positively influenced by OWSs with a developed biomat. A biomat may take years to fully develop [34,37] which hypothetically could lead to differences in N treatment for newly installed OWSs in comparison to older systems. In a recent review [39] of N treatment by 21 OWSs, it was reported that system age was not a likely factor with regard to treatment. However, only one of the 21 systems tested was less than 3 years old [39] and that system had been in operation for 2 years; thus, it may have had a developed biomat during the testing period. Less information is available regarding the N treatment efficiency of newly (<1 year) installed OWSs. An average of over 260,000 new systems have been installed annually in North Carolina over the past few decades [36]; thus, understanding how new OWSs perform in relation to older systems with regard to N treatment is necessary to better characterize OWS treatment efficiency during different stages of operation.

1.4. Research Needs

More research is needed regarding the N treatment efficiency of OWSs and the factors that may influence performance of the systems. Currently, there is conflicting information with regard to the influence of system type and system age on the N treatment efficiency of OWSs. The goal of this study was to provide more information on the N treatment efficiency of OWSs in North Carolina, where nearly 50% of the state’s population use OWSs [17] and excess nutrient loading has caused eutrophication and the impairment of water resources [12]. This research may be applicable for regions that continue to rely heavily on OWSs for new development and have nutrient-sensitive waters such as the eastern and Gulf Coast of the US [14,15,23,24], Canada [39,40], Australia [41], and Ireland [31,32].

2. Materials and Methods
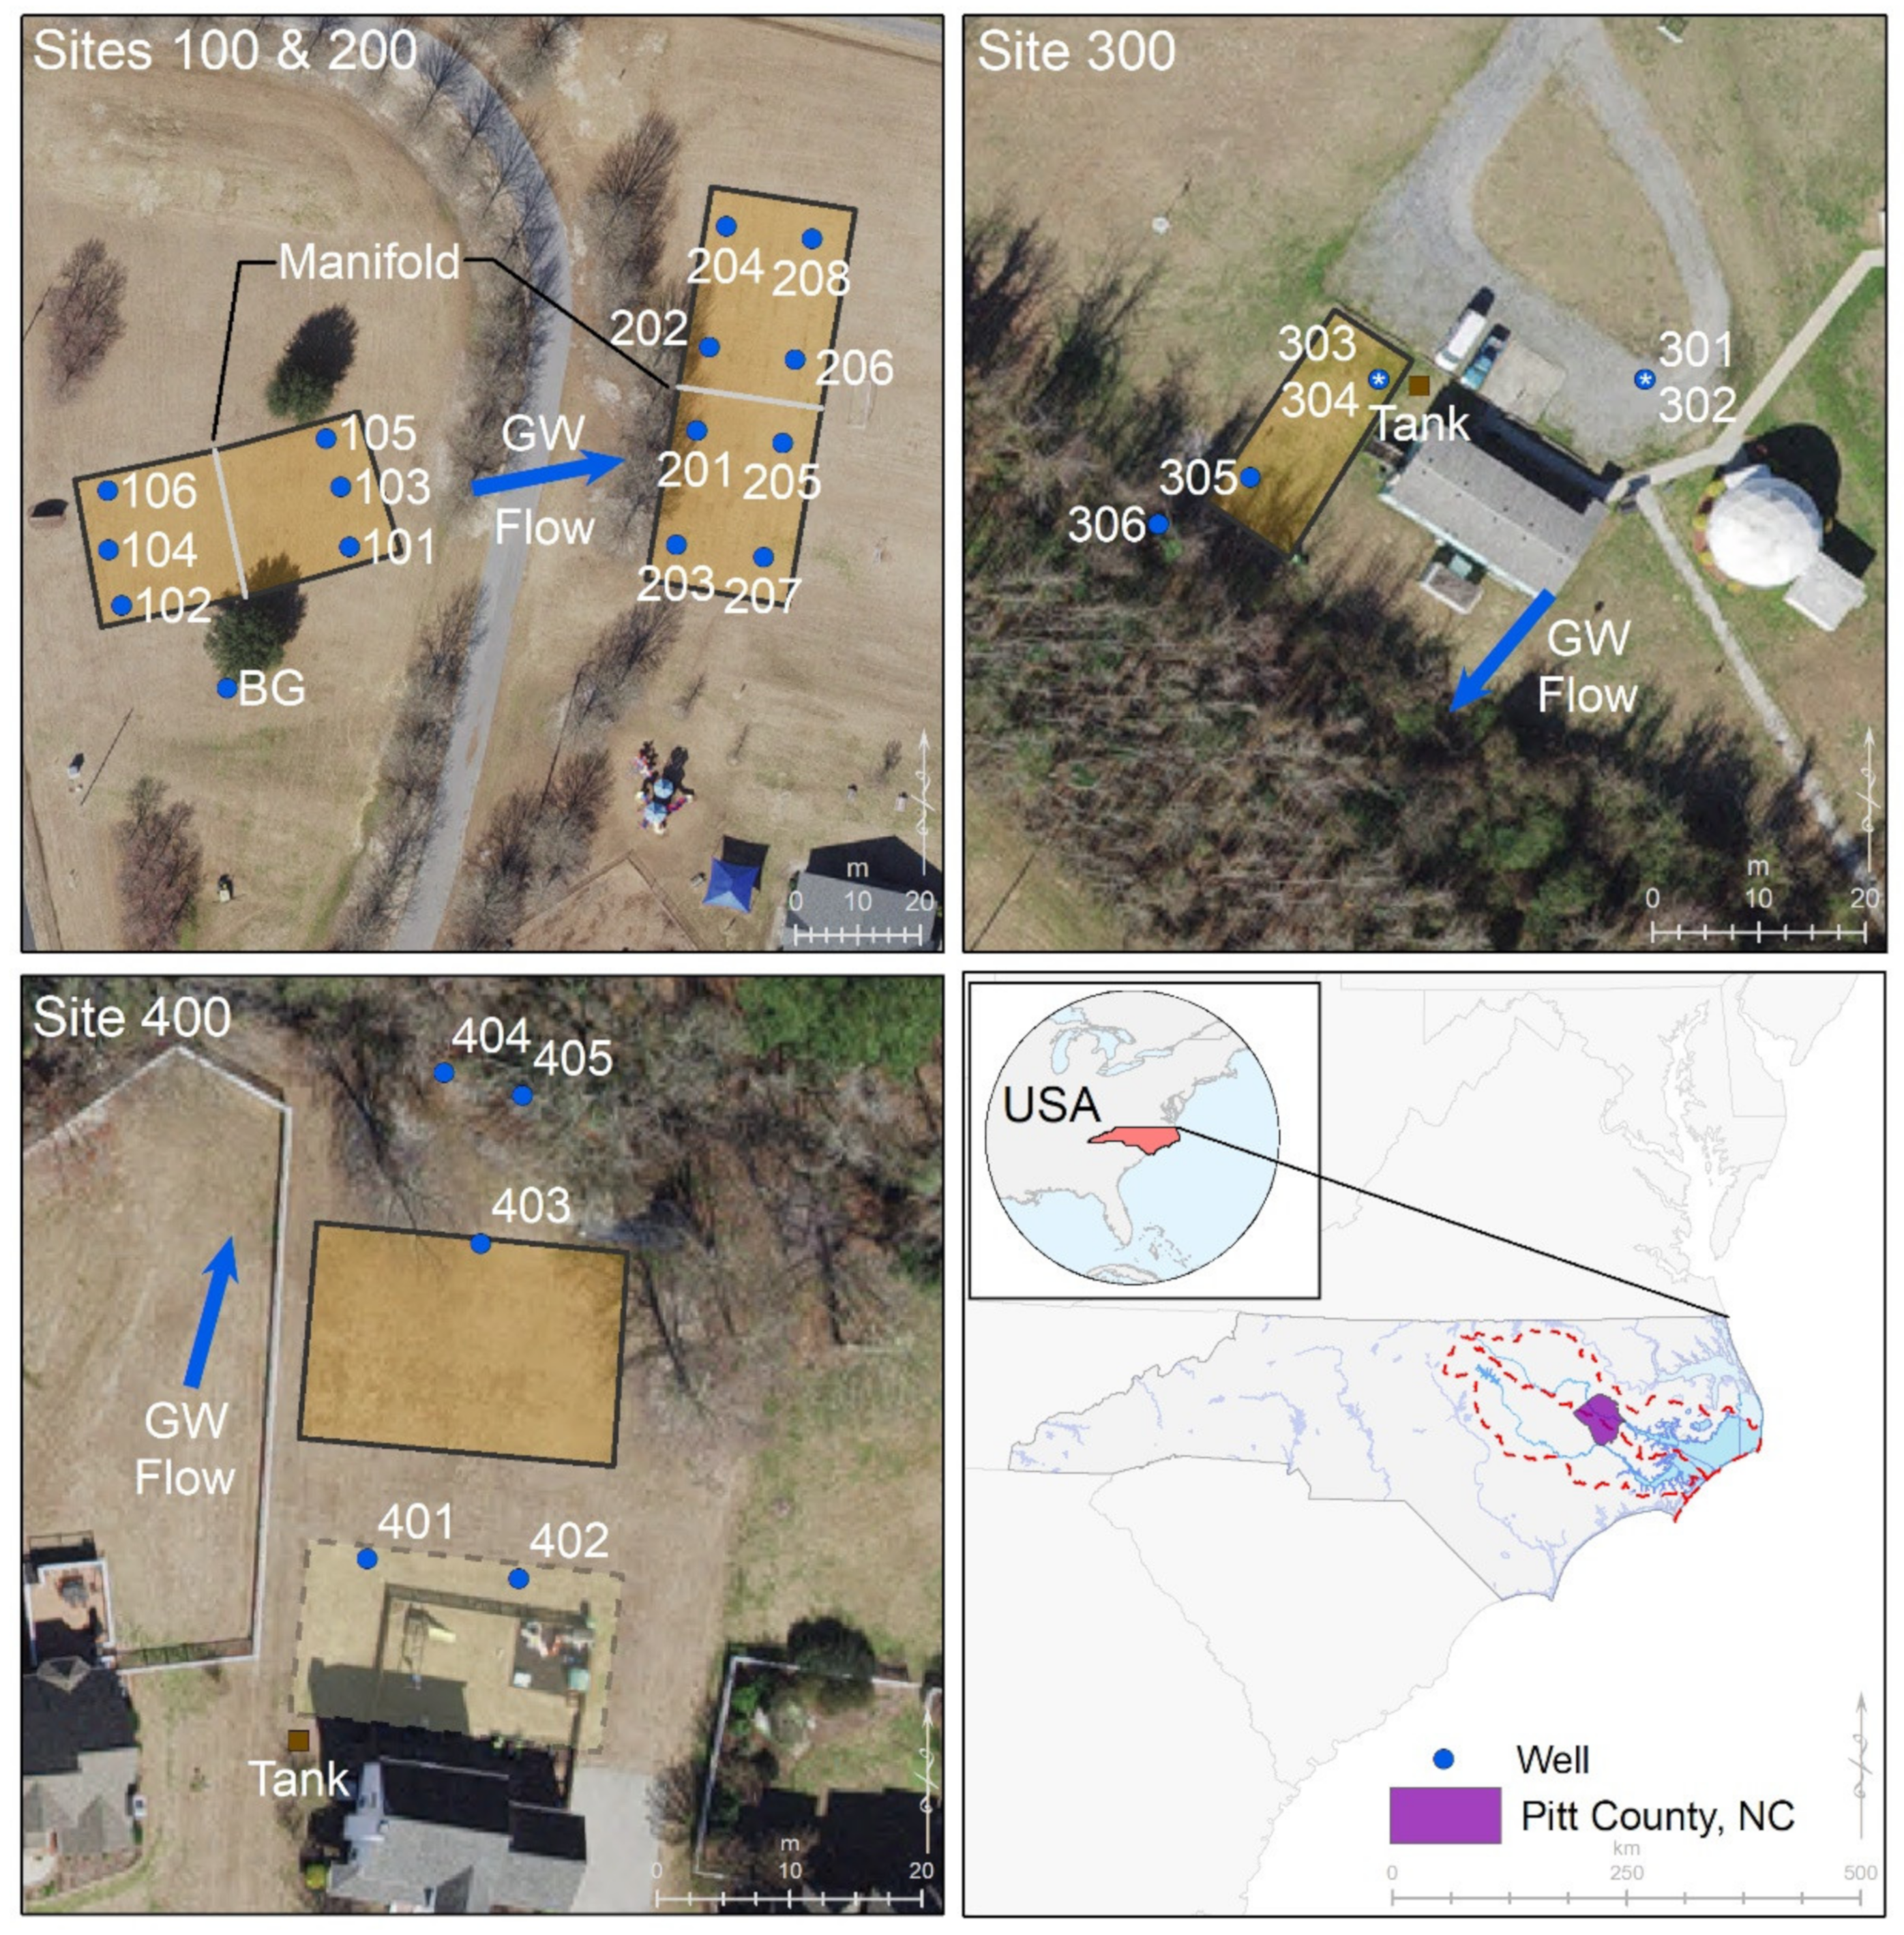
2.1. Site Selection

The study sites were located in Pitt County, North Carolina (Figure 1). Pitt County is in the coastal plain geological region and is underlain by a series of eastwardly dipping and thickening aquifers that serve as a water supply for many municipalities [42]. The surficial aquifer is hydrologically connected to streams and rivers; thus, shallow groundwater and surface water quality are linked [14,16]. The mean annual rainfall for the area is 125 cm, and temperatures range between an average high of 11 °C in January to 32 °C in July [43]. Northern Pitt County is drained by the Tar River, while southern Pitt County is drained by the Neuse River. Both rivers are designated as nutrient-sensitive waters and reducing N loading to the rivers and estuary has been a priority for more than 2 decades [12]. Efforts to reduce N loading to the rivers have included the implementation of basin-wide rules that require the installation of agricultural best management practices on farms, stormwater control measures on new developments, and improvements in centralized sewer plants to meet N loading caps [12]. Although N contributions from OWSs were discussed in the development of the regulations, mitigation strategies for reducing OWS impacts were not included because of a lack of consensus as to their contributions. An estimated 40 and 48% of the populations in the Neuse and Tar-Pamlico River Basins are served by OWSs [44]. OWSs that use advanced pre-treatment technologies have been approved for locations with limited soil resources, but most OWSs in North Carolina that are currently in use are conventional-style OWSs that use soil-based treatment [18]. Information regarding N treatment by OWSs is needed to gain a better understanding of their potential contributions of excess N to the Neuse and Tar-Pamlico Rivers.
The N treatment efficiencies of 4 OWSs were evaluated in this research. Two OWSs (Site 200 and 300) were monitored during the first-year operation of the systems, when biomat development was not expected to be complete. The OWSs at Sites 100 and 400 were both in use for more than 11 years prior to the study. The OWS at Site 100 served a school and as enrollment increased, the need for additional OWS capacity developed. A second drainfield (Site 200) was installed at the school to accommodate increased wastewater flows. The OWSs at Sites 100 and 200 used a pressure manifold for effluent distribution. Thus, Sites 100 and 200 are similar except with regard to age. The OWS at Site 300 serves an environmental education center, and the OWS at Site 400 served a 3-bedroom home with 5 occupants. The systems at Sites 300 and 400 used distribution boxes for effluent dispersal and were gravity flow (no pumps). Other site and system characteristics are shown in Table 1.

2.2. Monitoring Well Installations

Groundwater monitoring wells were installed between the drainfield trenches or within 3 m of the drainfield at each site and up-gradient from the systems (background) (Figure 1). At Site 400, one well (403) was installed down-gradient and near the drainfield (<2 m) and 2 additional wells (404 and 405) were installed 15 m down-gradient from the OWS to provide data on the groundwater transport of N. Boreholes for the wells were created using soil augers with removable handles and extensions. Soil profiles were laid onto tarps and the characteristics of the soil (e.g., texture, color, depth) were compared to soil descriptions shown in the USDA Soil Survey of Pitt County [45] to determine the soil series at the sites. The depth to groundwater was noted during the borings and wells were constructed such that the screened portion would extend below the water table. Wells were made using 1-m length well screen cemented to solid PVC casing. A cap was cemented to the bottom of the well screen to prevent sediment from filling the well. Sand was used to fill the annular space between the well screen and edge of the borehole. A mixture of bentonite and sand was poured into the annular space above the well screen and extended to within 8 cm of the top of the casing. The bentonite and sand mixture helps prevent the preferential flow of surface water down the borehole. A cap with an identification label was placed on each well. The top of each well casing was terminated approximately 10 cm below the land surface, and the wells were enclosed within valve boxes with removable lids.

2.3. Water Sampling and Analyses

Wastewater samples from the septic tank at each site were collected by removing the access cover and lowering a bailer into the tank, filling the bailer, and bringing it back above the land surface. Wastewater samples were transferred from the bailer to pre-labeled 250 mL HDPE sample bottles. The depth to groundwater at each well was measured using a Solinst TLC 107 meter (Georgetown, ON, USA). Next, a disposable bailer was used to purge the well several times prior to transferring a fresh sample to an HDPE bottle. The physicochemical properties of water and wastewater including pH, temperature, dissolved oxygen (DO), and specific conductance (SC) were determined in the field using a YSI 556 multimeter (Yellow Springs, OH, USA). Samples in bottles were placed in ice-filled coolers and transported to the Environmental Research Laboratory at East Carolina University for nitrogen analyses. Samples were filtered using 0.7 µm pore size paper. Concentrations of TKN, NH4 and NO2 + NO3 (henceforth referred to as NO3), were determined using a SmartChem 200 discrete analyzer (Unity Scientific Instruments Inc, Milford, MA, USA) with methods 390-200E, 210-201B, and 375-100E-1, respectively. Dissolved organic N (DON) was estimated by subtracting the concentration of NH4+ from TKN. The concentration of TKN was assessed using a Kjeldahl digestion, and then analyzed by the SmartChem 200 (Unity Scientific Instruments Inc, Milford, MA, USA). Total dissolved N (TDN) was calculated by adding the concentrations of TKN and NO3. Samples were collected at least once each season and between 5 (Sites 300 and 400) and 7 (Sites 100 and 200) times overall for each site during this study.

2.4. Statistical Analyses

The treatment efficiency of each system was calculated using Equation (1):
Treatment   Efficiency = [ Wastewater   N Groundwater   N ÷ Wastewater   N ] × 100 %
N treatment efficiencies of the new OWS (Site 200) was compared to the older OWS (Site 100) to provide insight as to the influence of age on N treatment. N treatment by the gravity flow (Site 300 and 400) and pressure dosed systems (Site 100 and 200) were compared to determine if the effluent distribution technique resulted in different N treatment. The concentrations of N in the groundwater near each system and in the background groundwater were also compared to determine if the OWSs were significantly influencing groundwater quality. Statistical significance (p < 0.05) was determined using t-tests (if data were normally distributed) or Mann–Whitney tests (if data were not normally distributed) with Minitab 18 statistical software (State College, PA, USA). The frequency that groundwater NO3 concentrations exceeded the 10 mg·L−1 standard was reported for each system. The concentrations of N in wastewater and groundwater at the sites, and treatment efficiencies reported for the systems were compared to results from prior studies. Figures were developed using the R statistical software [46,47] and associated packages [48,49,50,51].
The percentage of TDN that was NH4+, NO3, and DON along with the mean physicochemical properties including pH, DO and SC of wastewater and groundwater were reported at each site to provide insight into N transformations and wastewater impacts on groundwater.

3. Results and Discussion

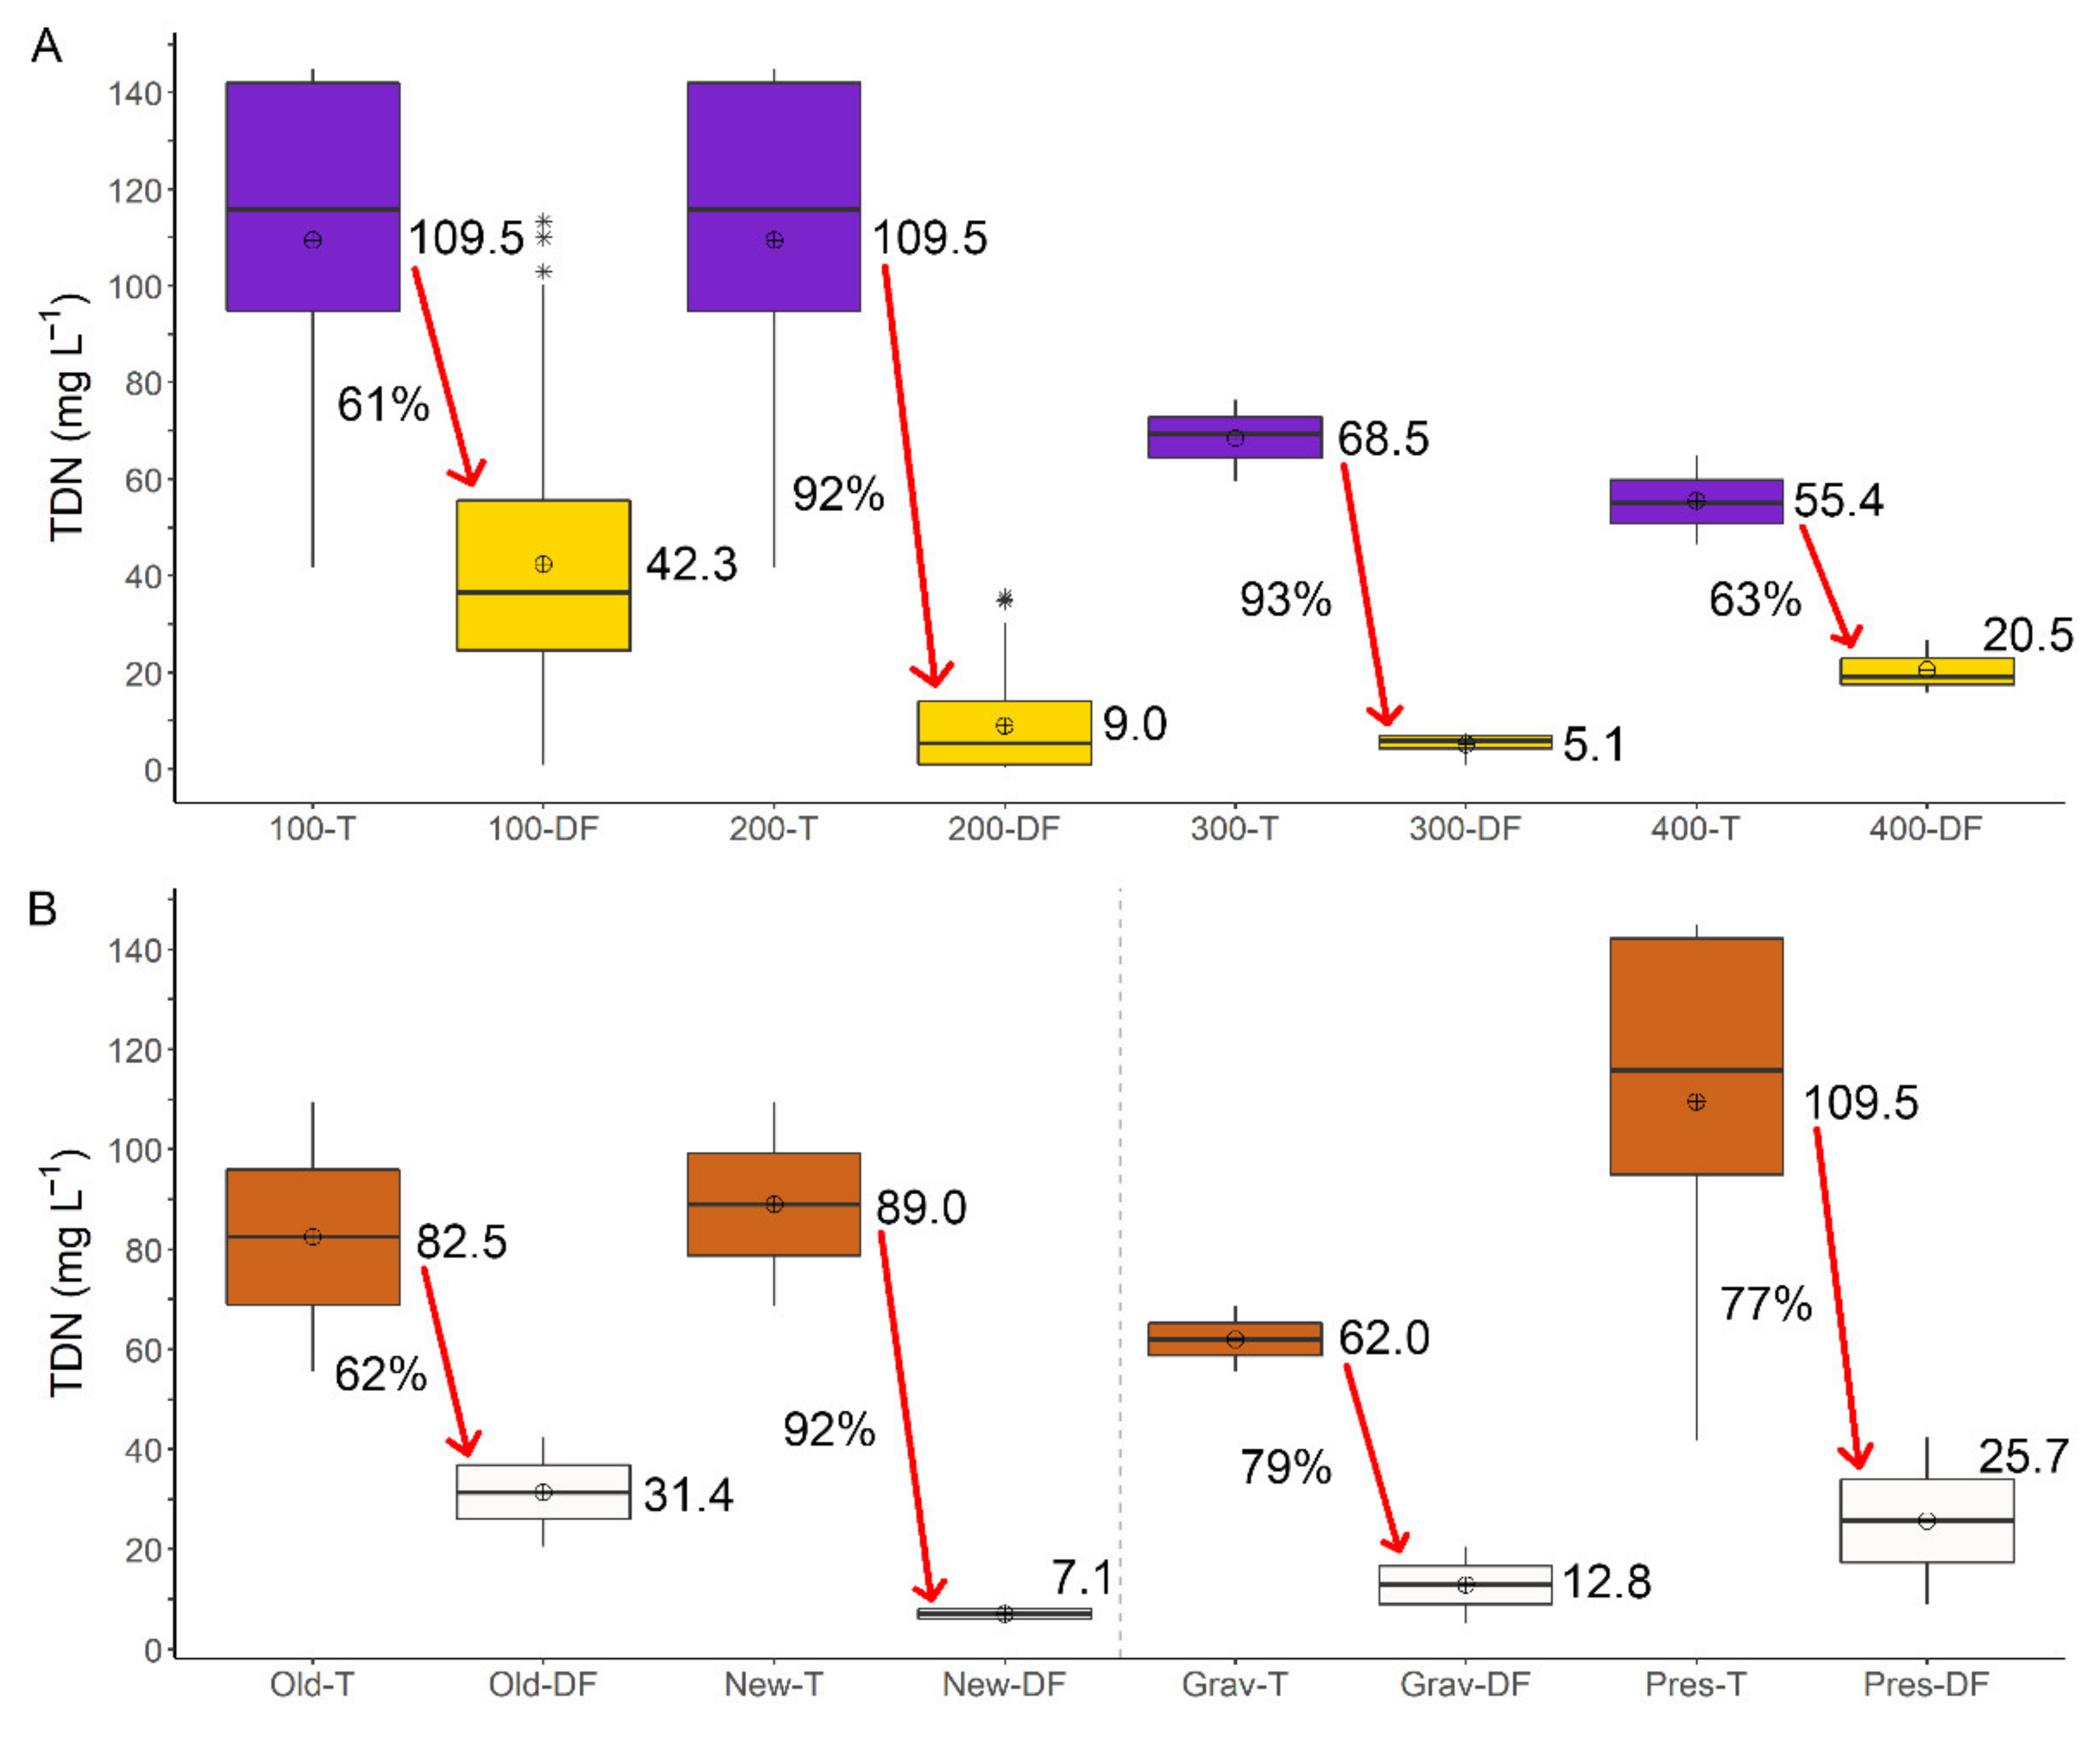
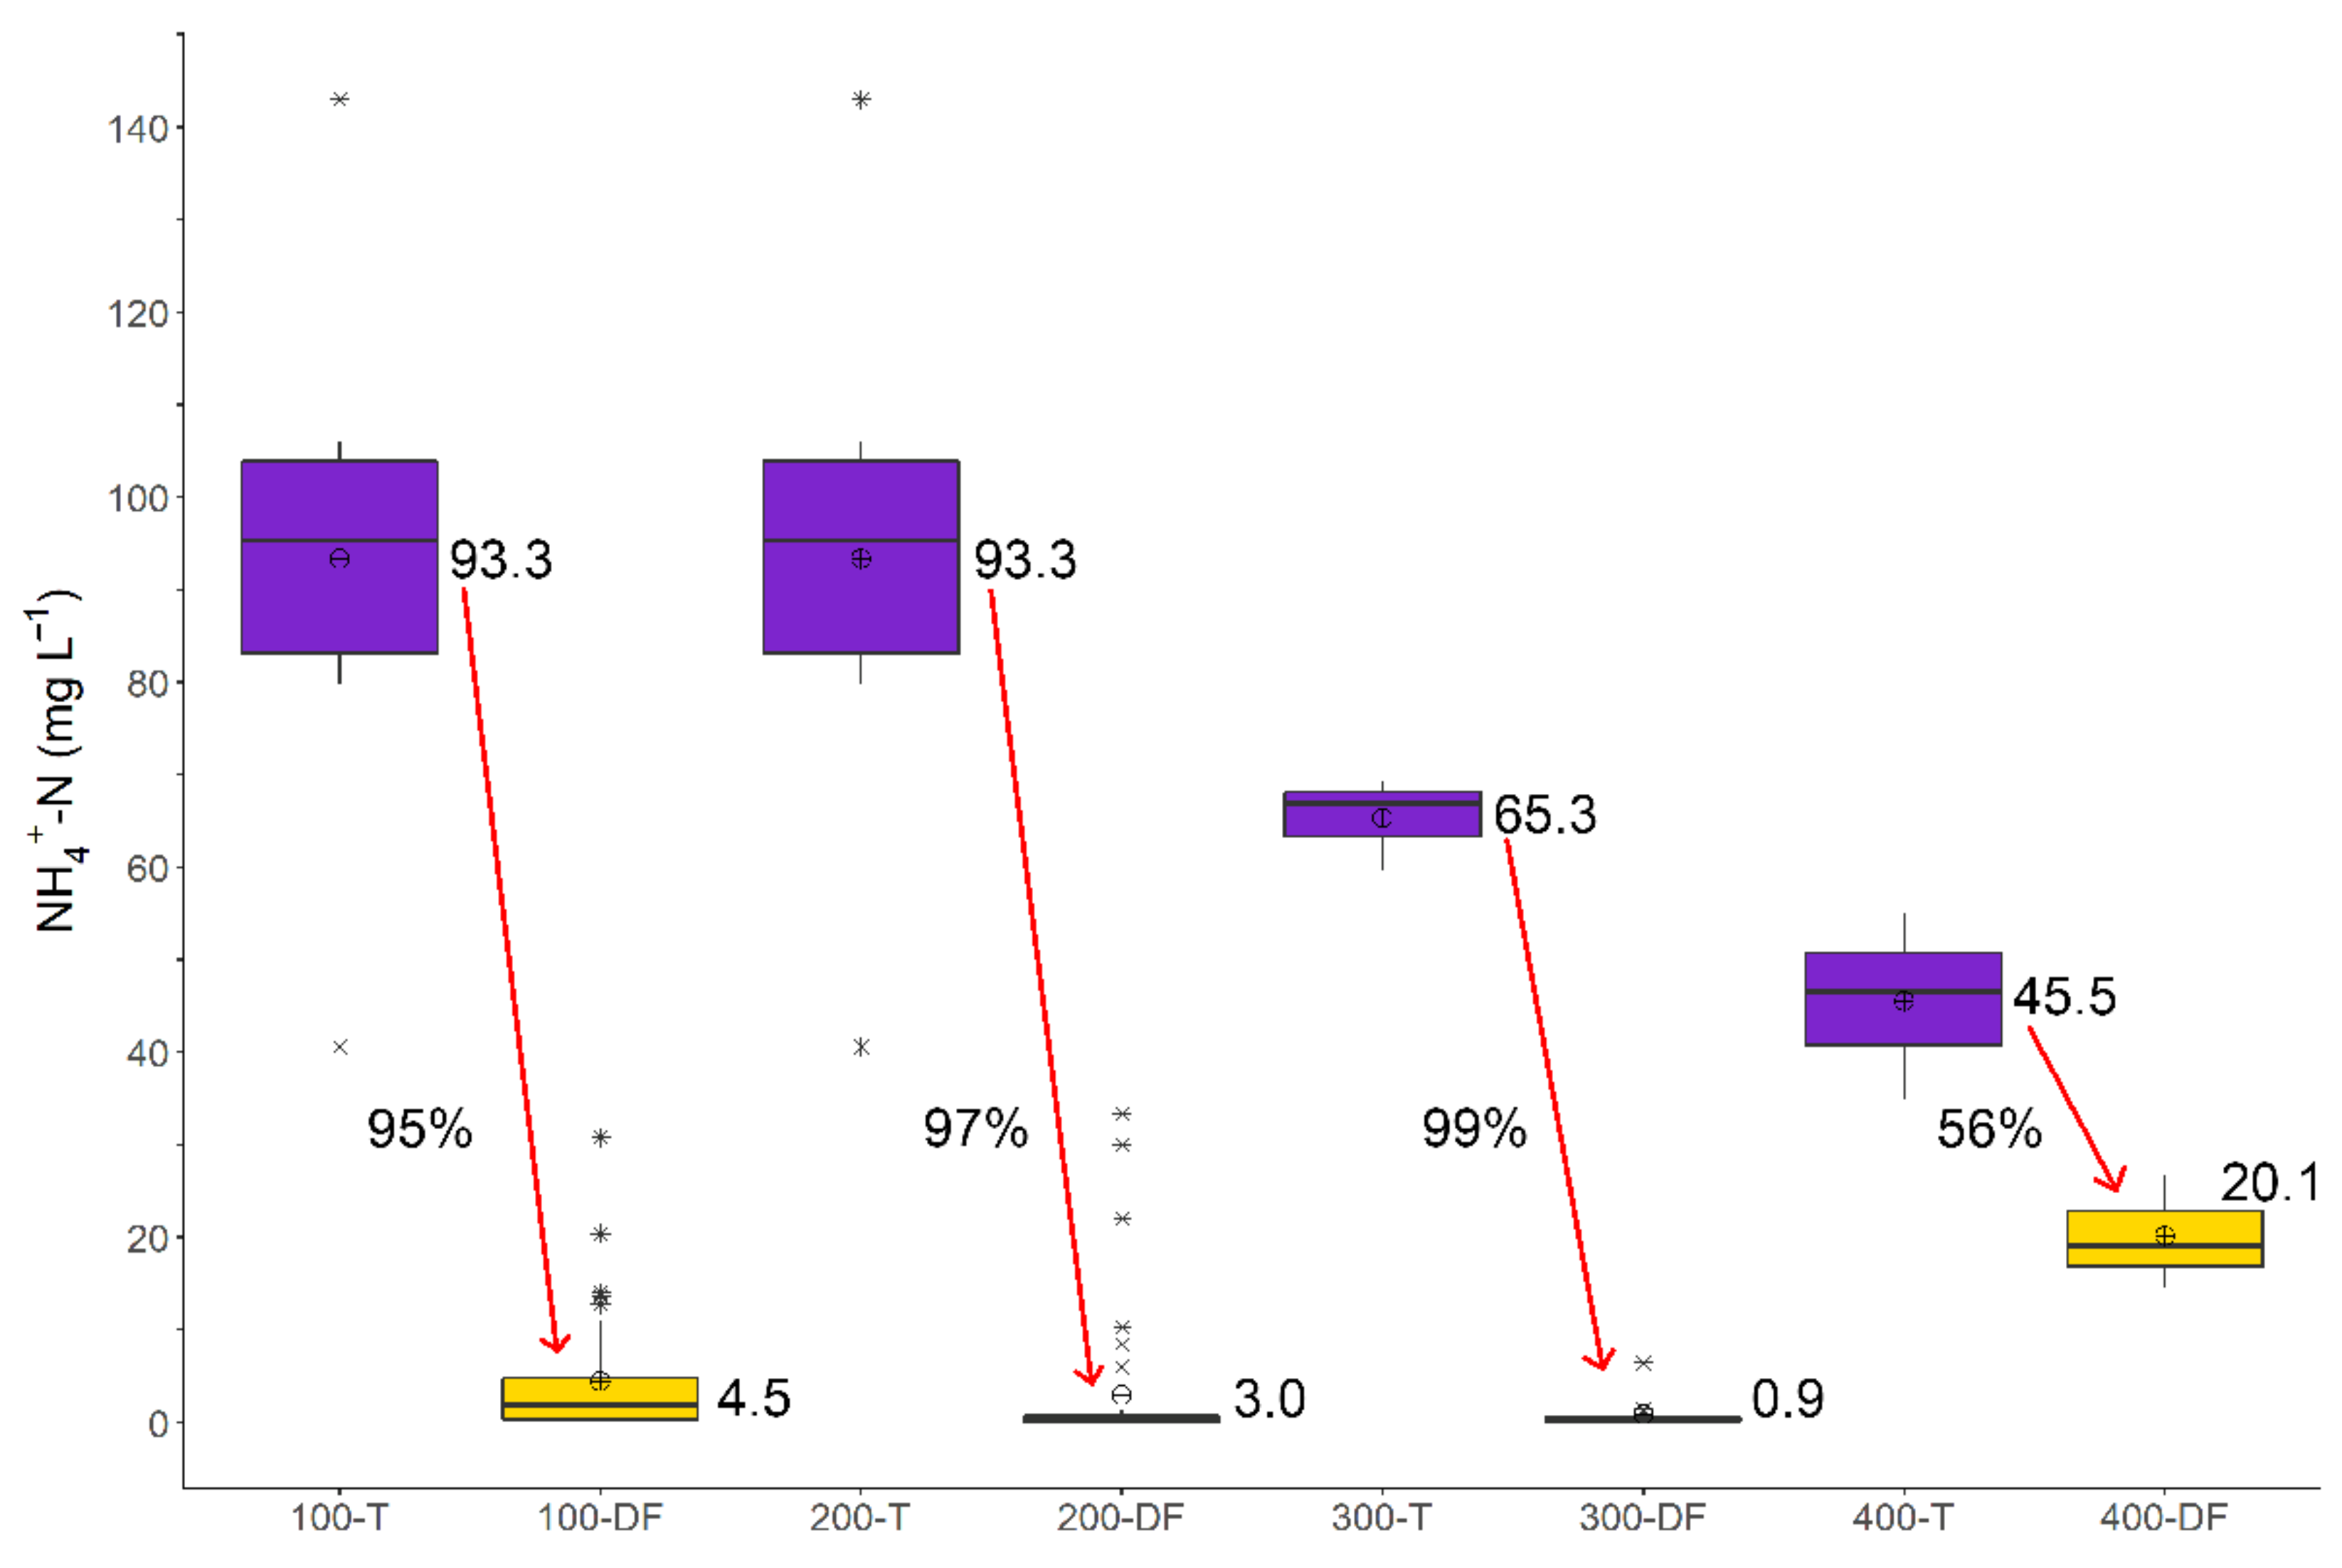
3.1. Nitrogen Treatment

The mean TDN treatment efficiency of the four OWSs was 77%, but differences in efficiencies were observed between systems. The highest treatment efficiency of TDN was observed at the newer OWSs including Site 300 (93%) and Site 200 (92%). Lower efficiencies were observed at the older sites including Site 400 (63%), and Site 100 (61%) (Figure 2). Overall, comparisons based solely on system age showed the mean treatment efficiency was 92% for the newer systems and 62% for the older systems, suggesting better performance for OWSs during start-up. Prior studies and reports [34,37] suggest that biomat formation may take a few years to develop and since biomat development is expected to improve N treatment [20,32], it was expected that older systems with biomats may perform better than new OWSs without developed biomats. This study shows that the OWSs that performed best with regard to N treatment were the ones tested during the first year of use.
The gravity flow OWSs at Sites 300 and 400 had a mean TDN treatment efficiency of 79%, which was nearly identical to the mean efficiency for the pressure dosed OWSs (77%) at Sites 100 and 200 (Figure 2). Comparing the mean TDN efficiency of the older pressure dosed OWS at Site 100 (61%) to the older gravity flow OWS at Site 400 (63%) also revealed a nearly identical reduction (Figure 2). A similar finding was observed when comparing the mean TDN treatment for the new gravity flow OWS at Site 300 (93%) to the new pressure dosed OWS at Site 200 (92%). Based on these findings, a difference in N treatment could not be attributed solely due to the effluent distribution technique. Our findings are in contrast with those reported previously [20], which showed better N removal for gravity flow OWSs in comparison to pressure dosed. Our findings are also in contrast with prior research [35] that showed improved N treatment by pressure dosed systems in comparison to gravity flow. Other factors including the separation distance to groundwater and wastewater loading characteristics likely influenced N treatment more than effluent distribution, and these factors are discussed in more detail in a later section of the paper.
For each site, wastewater had TDN concentrations that were significantly (p < 0.05) elevated relative to groundwater near the drainfield, and background groundwater (Figure 3). The mean TDN concentration in wastewater at Site 100 and 200 (109.5 mg·L−1) was higher in comparison to Site 300 (68.4 mg·L−1) and 400 (55.4 mg·L−1), but all concentrations were within the range of values of N (26 to 124 mg·L−1) reported in a recent literature review of wastewater characteristics [6]. Some of the differences in TDN concentrations in wastewater observed at the sites may be related to the facilities they serve. The OWSs at Sites 100 and 200 serve a school, the OWS at Site 300 serves an educational center, and the OWS at Site 400 serves a home. The total N in typical residential wastewater serving a single-family dwelling ranges from 26–75 mg·L−1 [13] and mean TDN concentrations at Site 400 were within this range. Most of the N in wastewater is associated with fecal matter and urine [21]. Wastewater generated from sinks, washing machines, and dish washers essentially serves to dilute N concentrations from waste flushed down the toilets. The schools and education center do not use washing machines and showers, and thus a higher percentage of their wastewater is from the toilets, likely resulting in higher TDN concentrations relative to the other sites. Overall, the mean (77%) and range (61 to 93%) of TDN treatment efficiencies observed for the four sites in this study are similar to efficiencies reported for three sites by Gill et al. [32] (mean 75% and range 68 to 81%), two sites by Humphrey et al. [33] (mean 70%, range of 59 to 80%), and four sites by Del Rosario et al. [29] (mean 64%, range of 33 to 95%).
The mean concentrations of TDN in groundwater near the drainfields at Site 100 (42.3 mg·L−1) and down-gradient (between 2 and 15 m) from Site 400 (13.1 mg·L−1) were significantly higher relative to background groundwater concentrations at those sites (Site 100 BG = 2.1 mg·L−1, p = 0.004; Site 400 BG = 4.7 mg·L−1, p = 0.045). However, concentrations of TDN in groundwater near (<3 m) the newer drainfields at Sites 200 (9.0 mg·L−1) and 300 (5.1 mg·L−1) were not significantly different than background groundwater at those sites (Site 200 BG = 2.1 mg·L−1, p = 0.484; Site 300 BG = 1.8 mg·L−1, p = 0.48) indicating the newer systems had less overall impact on water quality. While the overall mean concentrations of TDN in groundwater near the new OWSs at Site 200 and 300 were not significantly different in comparison to background conditions, there was at least one well at each of the newer sites where TDN concentrations were significantly higher than background. These wells include 202 (p = 0.032), 204 (p = 0.002), and 206 (p = 0.030) at Site 200, and well 306 (p = 0.033) at Site 300. Overall, the OWS at Site 300 was the most efficient at reducing TDN concentrations, and the efficiency at this site was likely influenced by relatively low and inconsistent wastewater loading. The OWS was designed to accommodate up to 1512 L of wastewater per day, but the education center was only used a day or two per week. Although water use records were not available, wastewater generation was intermittent and likely never approached the maximum design flow for the OWS. Prior studies [30,34] have shown that intermittent wastewater discharges from OWSs such as seasonally used systems, may result in low concentrations of TDN in groundwater during low water use periods. The OWSs at Sites 100, 200 and 400 were more regularly used and experienced higher flows that likely influenced groundwater N concentrations and N treatment.
Great variability was observed with regard to TDN concentrations in groundwater near the other new OWS at Site 200. Some of the differences in groundwater TDN concentrations at Site 200 may be related to higher wastewater loading rates to soil near the front of the drainfield trenches in comparison to the distal end of the trenches. A pressure manifold is used to distribute wastewater to the drainfield trenches at Site 200 (Table 1; Figure 1). Each drainfield trench receives septic tank effluent via a conveyance lateral that is connected to the manifold. The lateral is coupled to a pipe with holes on the bottom. The pipe extends the length of the trench, is surrounded by porous media, and is open ended. Therefore, septic tank effluent is first discharged to the trenches and soil nearest where the lateral is connected to the pressure manifold. For newer systems, that may result in large differences in effluent loading based on proximity to the manifold, and differences in groundwater TDN concentrations beneath the OWS [37]. As a system ages and the biomat develops, a more uniform distribution of effluent along the trench and into the subsurface is expected [37]. For Site 200, the mean concentration of TDN in groundwater near the front (<5 m from the manifold) of the trenches (8.1 mg·L−1) collected from wells 201, 202, 205, and 206 was significantly (p = 0.006) higher relative to groundwater near the end (>20 m from the manifold) of the trenches (2.6 mg·L−1). The higher loading of wastewater to soil near the front of the trenches at Site 200 may also explain the differences in SC of groundwater near that system. The mean SC of groundwater near the front of the trenches at Site 200 (289.3 µS·cm−1) was significantly greater (p = 0.002) relative to groundwater sampled near the end of the trenches (150.7 µS·cm−1) (Table 2). SC is a measure of the ability to transmit electrical current and is related to the concentration of dissolved ions in water. Wastewater typically has higher concentrations of dissolved ions relative to groundwater, and thus a higher SC [52,53]. Several studies have shown that SC can be a good indicator of wastewater impacted groundwater [14,16,52,53]. After years of operation, a clogging mat may form at the interface of the trench media and soil and gradually extend the length of the trench, providing a more even distribution of wastewater across the drainfield [37,38] and more uniform water quality beneath the drainfield [37].

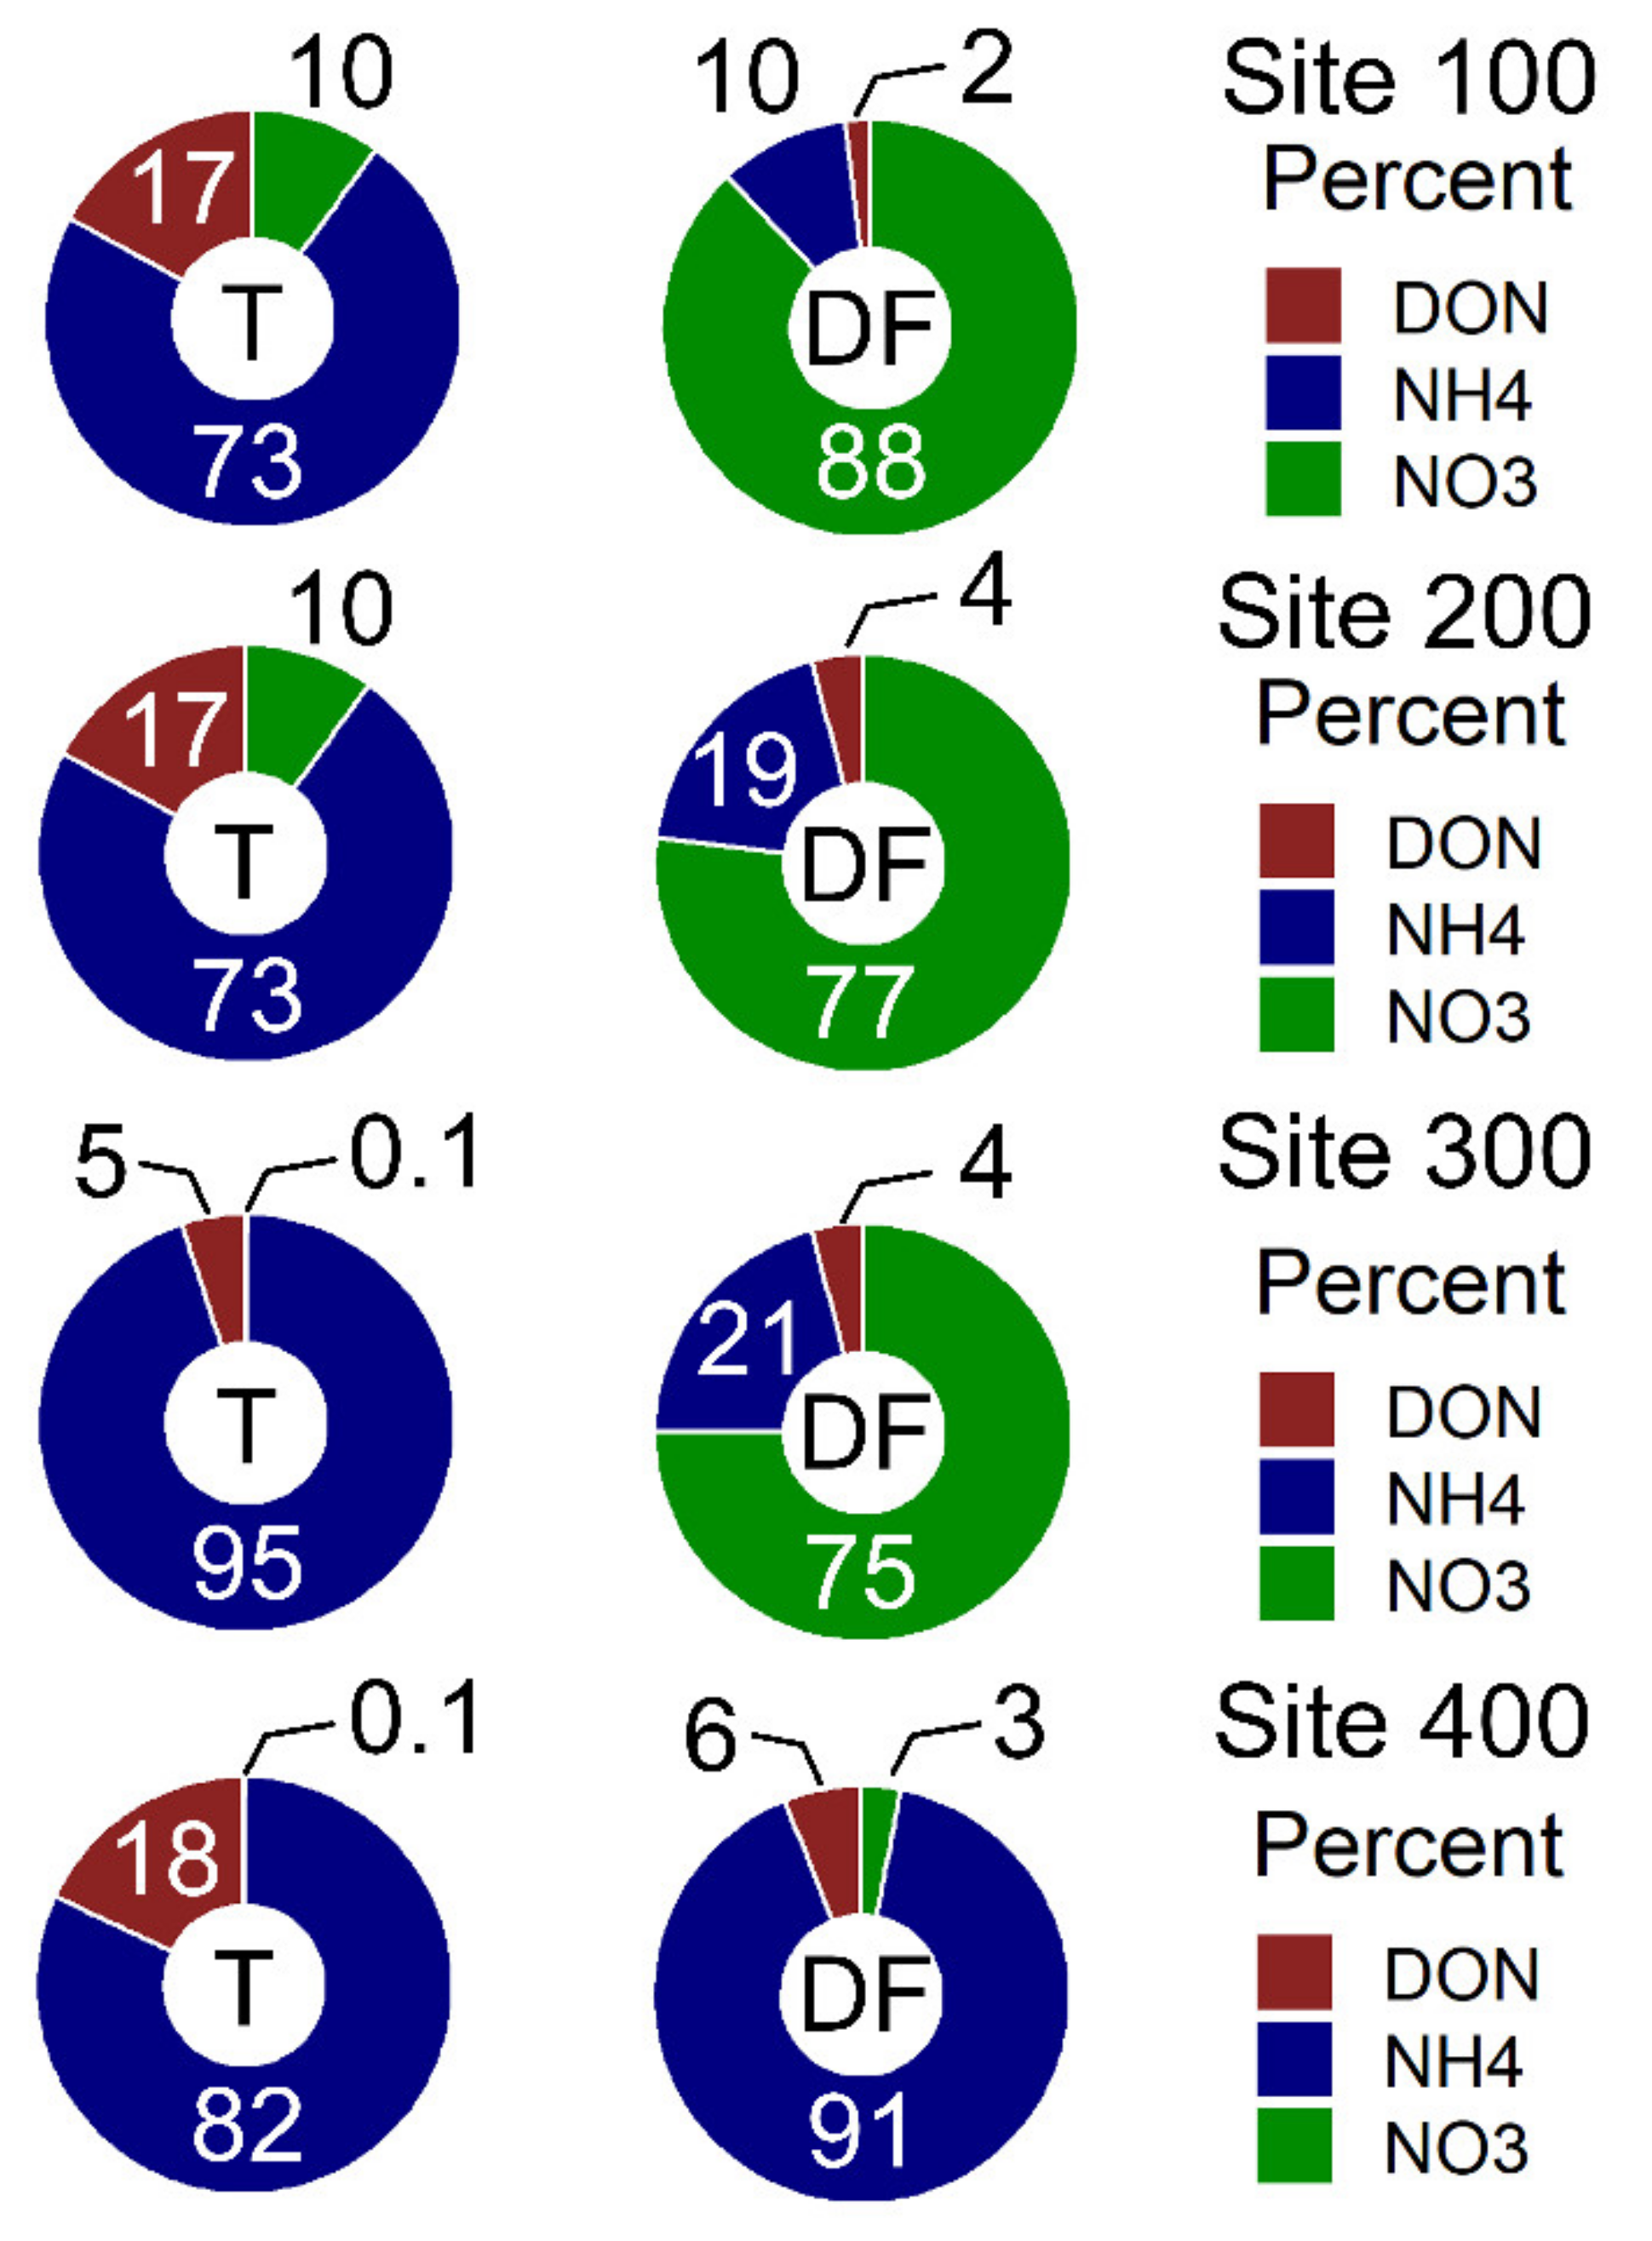
3.2. Nitrogen Speciation and Transformations in Septic Tanks

Most of the N in septic tank effluent for each site was comprised of NH4+, followed by DON, and then NO3 (Figure 4). The percentage of TDN in septic tank effluent that was NH4+ ranged from 73% at Sites 100 and 200, to almost 95% at Site 300 (Figure 4). The percentage of TDN in septic effluent that was DON ranged from 5% at Site 300 to 18% at Site 400. As septic tanks are anaerobic environments, reduced forms of N including NH4+ and DON are predominant [23,25,35]. The percentage of TDN that was NO3 was less 11% at each site, which was expected since nitrification relies on aerobic environments [1]. Prior studies have shown that much of the DON in raw wastewater is converted to NH4+ via ammonification, resulting in septic effluent that is often 70 to 90% NH4+ [21]. These trends were also observed in this study.

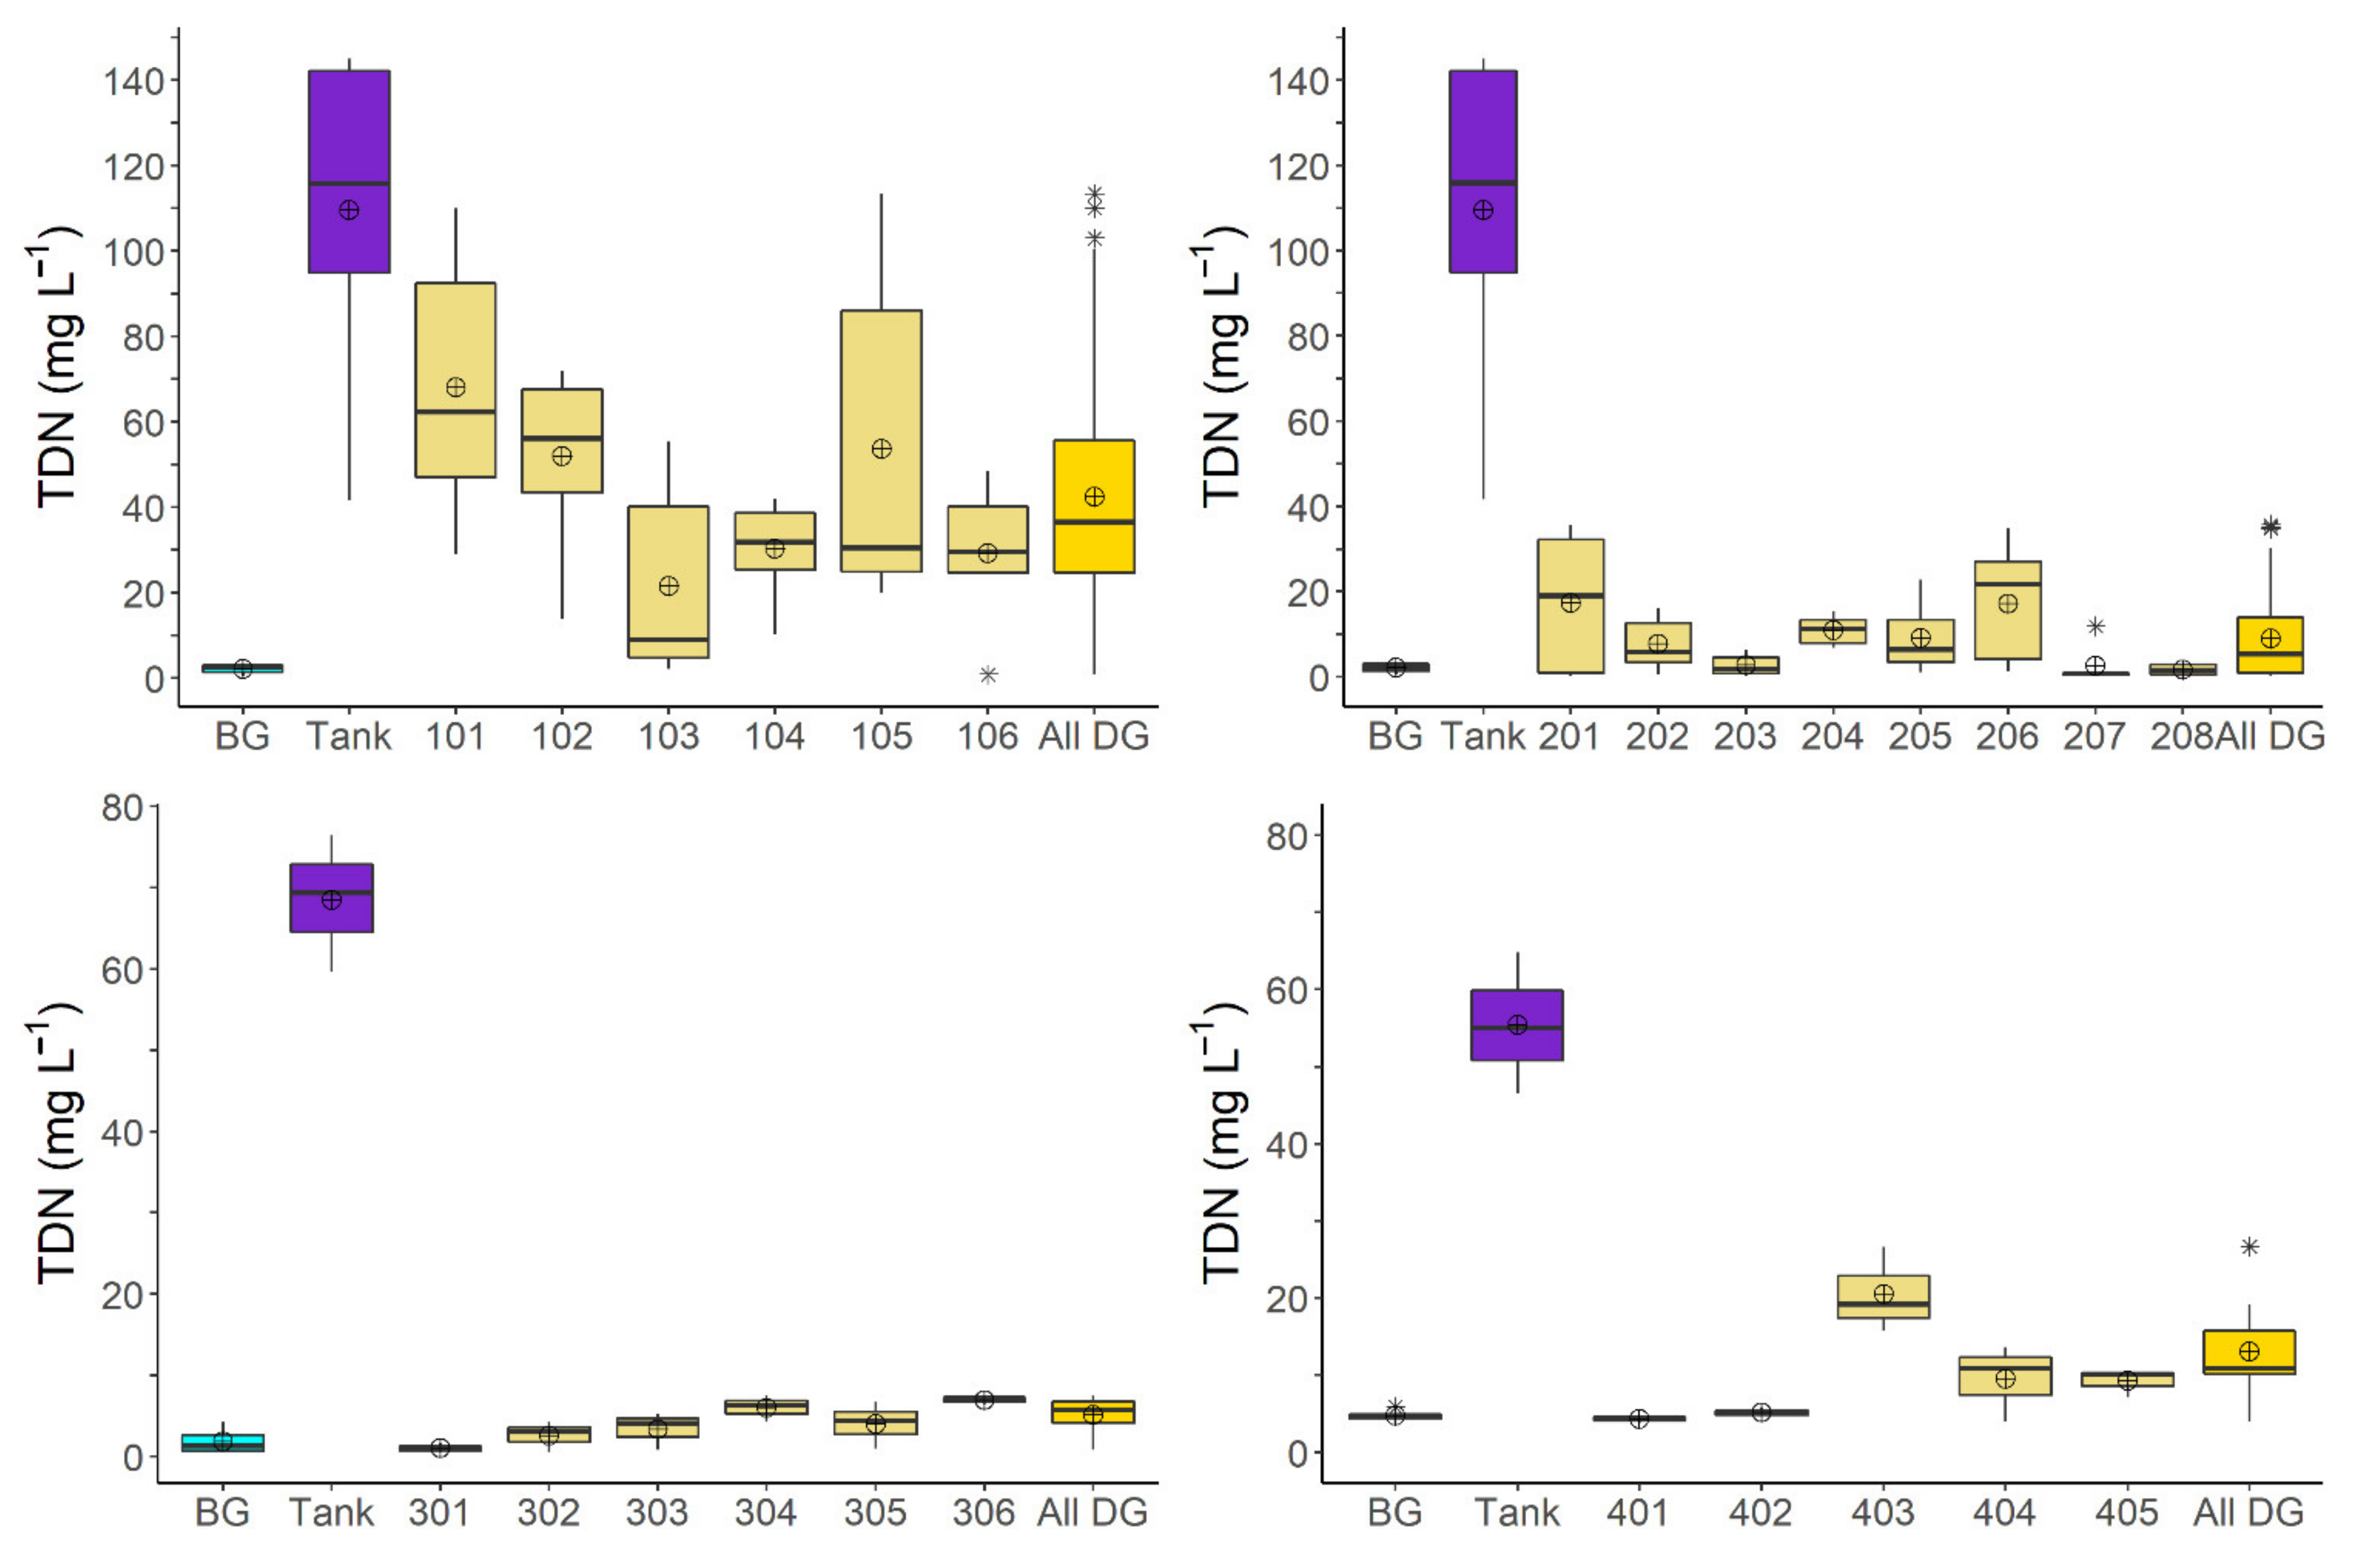
3.3. Nitrogen Speciation and Transformations in Groundwater Near the OWS

N in groundwater near the drainfields of the OWSs at Sites 100, 200, and 300 was 88%, 77%, and 75% NO3, respectively, while at Site 400 the dominant species of N in groundwater was NH4+ (91%) (Figure 4). The OWS at Site 400 was the least efficient (56%) at treating NH4+ when comparing concentrations in septic tank effluent to groundwater near the drainfield. The other systems all removed greater than 94% of NH4+. The mean NH4+ concentration in groundwater near the OWS at Site 400 was five times greater than Site 100, which contained the second highest concentration (Figure 5). These findings suggest that nitrification was a more active process at Sites 100, 200, and 300 in comparison to Site 400. Nitrification may occur in aerobic environments when temperature (>5 °C) and pH (4.5 to 10) are suitable for nitrifying microorganisms to be active [1]. While the mean temperature (17.2 °C) and pH (5.6) of groundwater near the drainfield at Site 400 were within the acceptable range for nitrifying microorganisms, the mean DO concentration in groundwater near the drainfield at Site 400 (1.8 mg·L−1) was less than half the concentrations at the other sites (Table 2). Aeration and nitrification at Site 400 were likely inhibited by the relatively shallow depth to groundwater (0.5 ± 0.1 m) and separation distance (<0.1 m) from drainfield trenches to groundwater. Prior research [25,27,33] has shown that when the vertical separation distance to groundwater is less than 0.45 m, reduced forms of N, including NH4+ and DON, are often observed in groundwater near the drainfield. When separation distances are greater than 60 cm, the most common form of N in groundwater near drainfields is NO3 [25,33]. The OWSs at Sites 100, 200, and 300 each had mean separation distances to groundwater that exceeded 1 m, mean DO concentrations greater than 4.0 mg·L−1, and at least 75% of the TDN in groundwater was NO3.
The OWS at Site 100 had almost 90% of the groundwater samples collected near the drainfield exceed the 10 mg·L−1 NO3 standard. The newer OWS at Site 200 had 25% of groundwater samples exceed 10 mg·L−1 NO3, and groundwater near the OWSs at Sites 300 and 400 never exceeded the standard. However, more than 10 mg·L−1 TDN (mostly in the form of NH4+) was frequently observed at Site 400. Ideally, NO3 would be removed in soil immediately beneath drainfield trenches and would not leach to groundwater. The removal of NO3 may occur in groundwater passing through soil or aquifer material that is anaerobic with sufficient carbon, and suitable physicochemical conditions (pH above 5, and temperature above 2 °C), such as in riparian areas or hyporheic zones of streams or other waterways down-gradient from the OWS [27,40,52]. In these scenarios, the groundwater transport of NO3 does not necessarily result in loading to surface waters [40,52]. Nitrification is an important step in the eventual removal of N via denitrification.
While this study focused on N treatment near (<5 m) OWS, there was one site (Site 400) where groundwater data collected 15 m down-gradient from the OWS (wells 404 and 405) were available (Figure 1 and Figure 3). For this site, TDN concentrations in groundwater declined from a mean of 20.5 mg·L−1 near (<2 m) the drainfield at well 403, to 9.5 and 9.2 mg·L−1, 15 m down-gradient from the system at wells 404 and 405, respectively (Figure 3). Thus, TDN concentrations in groundwater 15 m away from the OWS drainfield were still more than two times greater than background conditions at that site. The dominant form of N in wastewater (81%), groundwater near the system (99%), and groundwater down-gradient from the system (86%) was NH4+, and thus, denitrification would have been inhibited along the groundwater flow-path towards the creek due to a lack of nitrification beneath the drainfield trenches. The loading of NH4+ to surface waters may also stimulate algae blooms as NH4+ is a plant available form of N [1] and therefore also presents public and environmental health risks.

3.4. Physicochemical Properties of Water

3.4.1. pH

At each site, the mean pH of wastewater exceeded the mean pH of groundwater samples collected near the drainfield and in background groundwater locations. The mean pH of wastewater was highest for Site 300 (7.1) and the same (6.6) for Sites 100, 200, and 400 (Table 2). Groundwater pH near the drainfield at Site 100 was the lowest (4.3) followed by Site 200 (4.9), Site 300 (5.3), and Site 400 (5.6). The mean background groundwater pH at all sites was similar and ranged from 5.3 at Sites 100 and 200 to 5.6 at Site 300. When NH4+ is oxidized to NO3, hydrogen (H+) is released and may cause a reduction in pH unless the soil or groundwater has sufficient buffering capacity [40,52]. There was a drop of 2.3 pH units at Site 100 when comparing the pH of wastewater (6.6) to groundwater near the drainfield (4.3). Groundwater near the drainfield at Site 100 had a mean pH that was one unit lower relative to background groundwater (5.3). Most (74%) of the TDN in septic effluent was NH4+ at Site 100, but groundwater near the drainfield was 88% NO3; thus, nitrification and the release of H+ was likely the cause of the low pH in groundwater near the system [52]. The mean pH of groundwater near the drainfield at Site 200 (4.9) was 1.7 pH units lower than wastewater and 0.4 pH units lower than background groundwater at the site. While NH4+ comprised 74% of the TDN in wastewater, groundwater near the OWS was 77% NO3. A similar scenario was observed at Site 300, where there was a drop in pH units of 1.8 when comparing the mean pH of wastewater (7.1) to groundwater near the system (5.3). The TDN in septic tank effluent at Site 300 was 95% NH4+ and groundwater TDN was 75% NO3. Site 400 was the only location where the mean pH of groundwater near the system (5.6) was elevated relative to background groundwater (5.5). This was also the only site where the NH4+ was the dominant (91%) species of TDN in groundwater near the drainfield. The relatively small mean separation distance to groundwater (0.05 m) and low DO (1.8 mg·L−1) may have limited nitrification [25,27,33] resulting in a pH value in groundwater near the system (5.6) that was between background groundwater (5.5) and wastewater (6.6).
The overall TDN treatment efficiency at Site 100 may have been negatively influenced by the relatively low pH (4.3) of groundwater beneath the drainfield [1]. While the OWS at Site 100 was effective for NH4+ treatment (95%) via nitrification, it was overall the least efficient system for TDN treatment (61%). As the OWS had been in use for 12 years, it is possible that the buffering capacity of the soil had been reduced after more than a decade of effluent discharges to the subsurface and nitrification of NH4+-rich septic tank effluent. The dominant species of N in groundwater beneath the OWS was NO3 (88%); thus, nitrification was occurring at Site 100 [25,27]. Soil microorganisms that are responsible for denitrification are most active when the pH exceeds 5.0; thus, the removal of NO3 via denitrification may have been limited by the low pH [1] at Site 100, resulting in lower overall TDN treatment efficiency. The OWS at Site 200 is installed in the same soil series as the OWS at Site 100 (Table 1). However, the OWS at Site 200 was in operation for less than 1.25 years during the entire sampling period, while Site 100’s OWS was in use for more than a decade. The mean pH of groundwater beneath the drainfield at Site 200 was 0.6 pH units greater than at Site 100 and was more similar to the background groundwater pH. Thus, the soil buffering at Site 200 may have been more effective than at Site 100 due to a shorter period of wastewater applications. The higher overall TDN treatment efficiency at Site 200 (92%) in relation to Site 100 (61%) may be related to higher denitrification rates enabled by a more suitable pH for denitrifying microorganisms [1]. Operators of wastewater treatment plants [54] and advanced pre-treatment OWSs [55] monitor the pH and alkalinity of wastewater to ensure conditions are suitable for biological N transformations, and may add pH and alkalinity-adjusting chemicals to ensure proper biological activity. Most OWSs are not required to be monitored after installation but monitoring properties of wastewater could allow for potential adjustments that may improve the overall performance [55]. Another possibility for the better treatment of N by the newer system at Site 200 is that adsorption rates of NH4+ onto cation exchange sites of soil beneath the new drainfield trenches were greater relative to Site 100. There was a shorter cumulative period of wastewater discharges to the subsurface at Site 200 relative to Site 100 and thus a lower likelihood of exceeding the adsorption capacity of the cation exchange sites of the soil [26].

3.4.2. Specific Conductance

At each site, the highest mean SC was observed in wastewater, followed by groundwater collected from a well near (<3 m) the drainfield (Table 2). Wastewater at Sites 100 and 200 had a mean SC of 1400 µS·cm−1, followed by mean SC near the drainfields (Site 100: 494.7 µS·cm−1; Site 200: 220.0 µS·cm−1), and background groundwater (108.4 µS·cm−1). Wastewater at Site 300 had a mean SC of 1115.4 µS·cm−1, background groundwater was 140.9 µS·cm−1, and the mean for all groundwater near the drainfield was 136.4 µS·cm−1. However, groundwater collected near the drainfield from well 304 had the second highest SC (175.2 µS·cm−1) behind wastewater. At Site 400, wastewater had a mean SC of 792 µS·cm−1 followed by groundwater near the drainfield (305.6 µS·cm−1), and background groundwater (203.8 µS·cm−1). These data indicate the OWSs were influencing the SC of groundwater near each of the systems via the subsurface discharge of wastewater with high concentrations of dissolved ions. Prior studies [14,29,52] have also reported elevated SC in wastewater and groundwater near OWSs, relative to background groundwater.

3.4.3. Dissolved Oxygen

The mean concentration of DO was lowest at each site for the wastewater sampling location and ranged from 0.9 mg·L−1 for Site 400 to 1.9 mg·L−1 for the other sites (Table 2). The mean concentration of DO down-gradient from the systems was between 2.0 mg·L−1 for Site 400 to 5.5 mg·L−1 for Site 300. Mean concentrations of DO in background groundwater were highest for Site 300 (4.6 mg·L−1) followed by Site 100 and 200 (3.8 mg·L−1), and Site 400 (2.7 mg·L−1). The oxidation of NH4+ and reduction in NO3 are important processes with regard to N removal via nitrification and denitrification [27,40,52]. These processes require alternating aerobic and anaerobic conditions beneath the OWS drainfield trenches. The DO and N speciation data suggest that OWSs at Sites 100, 200, and 300 were very efficient (>90%) for NH4+ treatment via nitrification. Reductions in the concentrations of TDN suggest that removal mechanisms such as denitrification, immobilization and/or adsorption were present at each site.

4. Conclusions

The N treatment efficiencies of four OWSs evaluated in this study ranged from 61% to 93%. Treatment efficiencies were higher for the newer (92%) in comparison to the older (62%) systems, but similar for pressure dosed (77%) and gravity flow (79%). Factors including wastewater loading and vertical separation distance to groundwater likely influenced performance along with the ages of the systems. More specifically, the new OWS at Site 300 had the highest treatment efficiency (93%) and the lowest water use/wastewater generation of the sites, along with the largest separation distance to groundwater. In contrast, the OWS at Site 400 had been in use for 12 years, had the smallest mean separation distance to groundwater (<0.1 m), had regular flow (home occupied by 5 people), and was the least efficient of all systems at lowering NH4+ concentrations (56%), which negatively influenced denitrification potential and overall TDN treatment. The OWSs at Sites 100 and 200 served the same school and had similar site characteristics (i.e., soil type, depth to groundwater, and effluent distribution mechanisms), but N treatment was 29% better at the new OWS at Site 200. The mean pH of groundwater beneath the OWS at Site 100 (4.3) was 0.6 pH units lower relative to Site 200 (4.9), and the low pH may have negatively influenced denitrification [1] and N treatment. The buffering capacity of the soil beneath the drainfield trenches at Site 100 was likely reduced because of 12 years of NH4+-rich wastewater discharges to the drainfield and oxidation of the wastewater and the release of H+ during nitrification. The influence of biomat formation on N treatment at the older sites may have been offset by limited denitrification due to low pH at Site 100 and limited nitrification due to inadequate vertical separation at Site 400.
The OWSs at Sites 100, 200, and 300 were efficient at nitrifying wastewater and reducing NH4+ concentrations, but elevated NO3 was observed in groundwater near the OWS. The transport of NO3 at these sites may be reduced by the installation of permeable reactive barriers consisting of a labile carbon source such as woodchips and/or sawdust within the groundwater flow-path of the OWS plumes [56,57,58]. Prior research on reactive barriers has shown these technologies can remove greater than 90% of NO3 in groundwater, and can be cost-effective retrofits [57,58]. For Site 400, the N treatment efficiency may be improved by installing new drainfield trenches at a higher elevation on the property to increase the separation distance to groundwater and aeration of wastewater [59]. Another option may be the use of advanced pre-treatment technologies or media filters that oxidize wastewater prior to the effluent being discharged to soil [55]. New OWSs should be installed shallowly, with a sufficient separation distance to groundwater to enable N transformations and the aerobic treatment of wastewater. The use of valves to periodically alternate flow from the septic tank to different individual drainfield trenches would allow a sequential resting period for each trench and the soil beneath the trench, possibly improving treatment.
Although this study showed that newer systems had better N treatment, more work is needed to further isolate the effect of system age on N removal. Prior research suggested system failure is common between 27–66 years [60] and the US EPA suggests OWSs should last between 15 and 40 years [61]. As the infrastructure ages and a larger percentage of systems are over 15 years old, there is a growing need to understand the effects of system age on OWS N treatment to improve the accuracy of OWS N loading estimates. Given the continuous issues with excess nutrient loading to water resources and heavy reliance on OWSs for wastewater treatment, we need to better understand the environmental settings where OWSs are most likely to be significant sources of nutrient pollution. Each of the OWSs evaluated in this study contributed to elevated N concentrations in groundwater, so there is opportunity for improvement. More work is also needed to develop cost-effective mitigation strategies for this commonly used wastewater infrastructure.

Author Contributions

Conceptualization, C.P.H.J. and M.O.; methodology, C.P.H.J., M.O. and G.I.; software G.I. and C.P.H.J.; validation, C.P.H.J., M.O. and G.I.; formal analysis, C.P.H.J., G.I. and M.O.; investigation, C.P.H.J. and M.O.; resources, C.P.H.J. and M.O.; data curation, C.P.H.J., M.O. and G.I.; writing—original draft preparation, C.P.H.J.; writing—review and editing, M.O., G.I. and C.P.H.J.; visualization, G.I. and C.P.H.J.; supervision, M.O. and C.P.H.J.; project administration, C.P.H.J. and M.O.; funding acquisition, C.P.H.J. and M.O. All authors have read and agreed to the published version of the manuscript.

Funding

This research was partially funded by the North Carolina Water Resources Research Institute via grant number 12-07-W.

Institutional Review Board Statement

Not applicable.

Informed Consent Statement

Not applicable.

Data Availability Statement

All data used in the study is summarized in the figures and tables. Raw data may be available on request from the corresponding author.

Acknowledgments

The authors would like to thank Matt Smith, Sarah Hardison, and Eliot Anderson-Evans for assistance with field and lab work. This acknowledgement does not indicate the individuals listed endorse the manuscript.

Conflicts of Interest

The authors declare no conflict of interest.

References

  1. Havlin, J.L.; Tisdale, S.L.; Nelson, W.L.; Beaton, J.D. Soil Fertility and Fertilizers, 6th ed.; Prentice Hall: Upper Saddle River, NJ, USA, 1999; pp. 86–153. [Google Scholar]
  2. Paerl, H.W.; Rossignol, K.L.; Guajardo, R.; Hall, N.S.; Joyner, A.R.; Peierls, B.L.; Ramus, J.S. FerryMon: Ferry-based monitoring and assessment of human and climatically driven environmental change in the Albemarle-Pamlico Sound system. Environ. Sci. Technol. 2009, 43, 7609–7613. [Google Scholar] [CrossRef] [Green Version]
  3. Zhang, X.; Davidson, E.A.; Mauzerall, D.L.; Searchinger, T.D.; Dumas, P.; Shen, Y. Managing nitrogen for sustainable development. Nature 2015, 528, 51–59. [Google Scholar] [CrossRef] [Green Version]
  4. Albaugh, T.J.; Fox, T.R.; Cook, R.L.; Raymond, J.E.; Rubilar, R.A.; Campoe, O.C. Forest fertilizer applications in the southeastern United States from 1969 to 2016. Forest Sci. 2019, 65, 355–362. [Google Scholar] [CrossRef]
  5. Cleland, J. World population growth; past, present and future. Environ. Resour. Econ. 2013, 55, 543–554. [Google Scholar] [CrossRef]
  6. Lowe, K.S.; Tucholke, M.B.; Tomaras, J.M.; Conn, K.; Hoppe, C.; Drewes, J.E.; McCray, J.E.; Munakata-Marr, J. Influent Constituent Characteristics of the Modern Waste Stream from Single Sources; IWA Publishing: London, UK, 2010. [Google Scholar]
  7. Brooks, B.W.; Lazorchak, J.M.; Howard, M.D.; Johnson, M.-V.V.; Morton, S.L.; Perkins, D.A.; Reavie, E.D.; Scott, G.I.; Smith, S.A.; Steevens, J. Are harmful algal blooms becoming the greatest inland water quality threat to public health and aquatic ecosystems? Environ. Toxicol. Chem. 2016, 35, 6–13. [Google Scholar] [CrossRef]
  8. Conley, D.J.; Paerl, H.W.; Howarth, R.W.; Boesch, D.F.; Seitzinger, S.P.; Havens, K.E.; Lancelot, C.; Likens, G.E. ECOLOGY: Controlling eutrophication: Nitrogen and phosphorus. Science 2009, 323, 1014–1015. [Google Scholar] [CrossRef]
  9. Dodds, W.K.; Bouska, K.; Eitzmann, J.L.; Pilger, T.J.; Pitts, K.L.; Riley, A.J.; Schloesser, J.T.; Thornbrugh, D.J. Eutrophication of U.S. freshwaters: Analysis of potential economic damages. Environ. Sci. Technol. 2009, 43, 12–19. [Google Scholar] [CrossRef] [PubMed] [Green Version]
  10. Sadeq, M.; Moe, C.L.; Attarassi, B.; Cherkaoui, I.; ElAouad, R.; Idrissi, L. Drinking water nitrate and prevalence of methemoglobinemia among infants and children aged 1–7 years in Moroccan areas. Int. J. Hyg. Environ. Health 2008, 211, 546–554. [Google Scholar] [CrossRef] [PubMed]
  11. Ward, M.H.; Jones, R.R.; Brender, J.D.; De Kok, T.M.; Weyer, P.J.; Nolan, B.T.; Villanueva, C.M.; Van Breda, S.G. Drinking water nitrate and human health: An updated review. Int. J. Environ. Res. Public Health 2018, 15, 1557. [Google Scholar] [CrossRef] [PubMed] [Green Version]
  12. North Carolina Department of Environmental Quality. Neuse River Nutrient Strategy. 2021. Available online: https://deq.nc.gov/about/divisions/water-resources/planning/nonpoint-source-management/nutrient-strategies/neuse (accessed on 15 May 2021).
  13. US EPA. Onsite Wastewater Treatment Systems Manual. 2002. Available online: https://www.epa.gov/sites/production/files/2015-06/documents/2004_07_07_septics_septic_2002_osdm_all.pdf (accessed on 6 April 2021).
  14. Iverson, G.; O’Driscoll, M.; Humphrey Jr, C.; Manda, A.; Anderson-Evans, E. Wastewater nitrogen contributions to coastal plain watersheds, NC, USA. Water Air Soil Pollut. 2015, 226, 1–17. [Google Scholar] [CrossRef]
  15. Cox, A.H.; Loomis, G.W.; Amador, J.A. Preliminary evidence that rising groundwater tables threaten coastal septic systems. J. Sustain. Water Built Environ. 2019, 5, 04019007. [Google Scholar] [CrossRef]
  16. Humphrey, C.P.; Anderson-Evans, E.; O’Driscoll, M.; Manda, A.; Iverson, G. Comparison of phosphorus concentrations in coastal plain watersheds served by onsite wastewater treatment systems and a municipal sewer treatment system. Water Air Soil Pollut. 2015, 226, 1–18. [Google Scholar] [CrossRef]
  17. Naylor, E.; Humphrey, C.; Easter, L.; Iverson, G. Evaluation of nitrate concentrations and potential sources of nitrate in private water supply wells in North Carolina. J. Environ. Health 2018, 80, 16–23. [Google Scholar]
  18. Lindbo, D.; Godfrey, J.; Rashash, D. Why Do Septic Systems Fail? 2021. Available online: https://content.ces.ncsu.edu/why-do-septic-systems-fail (accessed on 15 May 2021).
  19. Nasr, F.A.; Mikhaeil, B. Treatment of domestic wastewater using conventional and baffled septic tanks. Environ. Technol. 2013, 34, 2337–2343. [Google Scholar] [CrossRef] [PubMed]
  20. Bunnell, J.; Zampella, R.; Morgan, M.; Gray, D. A comparison of nitrogen removal by subsurface pressure dosing and standard septic systems in sandy soils. J. Environ. Manag. 1999, 56, 209–219. [Google Scholar] [CrossRef]
  21. Lusk, M.G.; Toor, G.S.; Yang, Y.-Y.; Mechtensimer, S.; De, M.; Obreza, T.A. A review of the fate and transport of nitrogen, phosphorus, pathogens, and trace organic chemicals in septic systems. Crit. Rev. Environ. Sci. Technol. 2017, 47, 455–541. [Google Scholar] [CrossRef]
  22. Carr, M.E.; Jumper, D.L.; Yelderman, J.C. A comparison of disposal methods for on-site sewage facilities within the state of Texas, USA. Environmentalist 2009, 29, 381–387. [Google Scholar] [CrossRef]
  23. De, M.; Toor, G.S. Fate of effluent-borne nitrogen in the mounded drainfield of an onsite wastewater treatment system. Vadose Zone J. 2015, 14, 1–12. [Google Scholar] [CrossRef]
  24. De, M.; Toor, G.S. Nitrogen transformations in the mounded drainfields of drip dispersal and gravel trench septic systems. Ecol. Eng. 2017, 102, 352–360. [Google Scholar] [CrossRef] [Green Version]
  25. Humphrey, C.P.; O’Driscoll, M.A.; Zarate, M.A. Controls on groundwater nitrogen contributions from on-site wastewater systems in coastal North Carolina. Water Sci. Technol. 2010, 62, 1448–1455. [Google Scholar] [CrossRef]
  26. Chatterjee, A. Extent and variation of nitrogen losses from non-legume field crops of conterminous United States. Nitrogen 2020, 1, 5. [Google Scholar] [CrossRef]
  27. O’Driscoll, M.A.; Humphrey, C.P.; Deal, N.E.; Lindbo, D.L.; Zarate-Bermudez, M.A. Meteorological influences on nitrogen dynamics of a coastal onsite wastewater treatment system. J. Environ. Qual. 2014, 43, 1873–1885. [Google Scholar] [CrossRef] [Green Version]
  28. Cooper, J.A.; Morales, I.; Amador, J.A. Nitrogen transformations in different types of soil treatment areas receiving domestic wastewater. Ecol. Eng. 2016, 94, 22–29. [Google Scholar] [CrossRef]
  29. Del Rosario, K.L.; Humphrey, C.P.; Mitra, S.; O’Driscoll, M.A. Nitrogen and carbon dynamics beneath on-site wastewater treatment systems in Pitt County, North Carolina. Water Sci. Technol. 2013, 69, 663–671. [Google Scholar] [CrossRef] [PubMed]
  30. Humphrey, C.; O’Driscoll, M.A.; Armstrong, M.C. Onsite wastewater system nitrogen loading to groundwater in the Newport River watershed, North Carolina. Environ. Nat. Resour. Res. 2012, 2, 70–79. [Google Scholar] [CrossRef] [Green Version]
  31. Gill, L.W.; O’Suilleabhain, C.; Misstear, B.; Johnston, P.; Patel, T.; O’Luanaigh, N. Nitrogen loading on groundwater from the discharge of on-site domestic wastewater effluent into different subsoils in Ireland. Water Sci. Technol. 2008, 57, 1921–1926. [Google Scholar] [CrossRef] [PubMed]
  32. Gill, L.; O’Luanaigh, N.; Johnston, P.; Misstear, B.; O’Suilleabhain, C. Nutrient loading on subsoils from on-site wastewater effluent, comparing septic tank and secondary treatment systems. Water Res. 2009, 43, 2739–2749. [Google Scholar] [CrossRef]
  33. Humphrey, C.P.; O’Driscoll, M.A.; Deal, N.E.; Lindbo, D.L.; Thieme, S.C.; Zarate-Bermudez, M.A. Onsite wastewater system nitrogen contributions to groundwater in coastal North Carolina. J. Environ. Health 2013, 76, 16–23. [Google Scholar]
  34. Postma, F.B.; Gold, A.J.; Loomis, G.W. Nutrient and microbial movement from seasonally-used septic systems. J. Environ. Health 1992, 55, 5–10. [Google Scholar]
  35. Cogger, C.G.; Carlile, B.L. Field performance of conventional and alternative septic systems in wet soils. J. Environ. Qual. 1984, 13, 137–142. [Google Scholar] [CrossRef]
  36. Humphrey, C.P.; Jernigan, J.; Iverson, G.; Serozi, B.; O’Driscoll, M.; Pradhan, S.; Bean, E. Field evaluation of nitrogen treatment by conventional and single-pass sand filter onsite wastewater systems in the North Carolina piedmont. Water Air Soil Pollut. 2016, 227, 1–17. [Google Scholar] [CrossRef]
  37. Hoover, M.T.; Disy, T.A.; Pfieffer, M.A.; Dudley, N.; Mayer, R.B.; Buffington, B. North Carolina Subsurface Wastewater Operators Training School Manual, 1st ed.; North Carolina State University & North Carolina Department of Environment, Health and Natural Resources: Raleigh, NC, USA, 1996; pp. 4.1–4.31. [Google Scholar]
  38. Beal, C.; Gardner, E.; Kirchhof, G.; Menzies, N. Long-term flow rates and biomat zone hydrology in soil columns receiving septic tank effluent. Water Res. 2006, 40, 2327–2338. [Google Scholar] [CrossRef] [PubMed] [Green Version]
  39. Robertson, W.D.; Van Stempvoort, D.R.; Schiff, S.L. Nitrogen attenuation in septic system plumes. Groundwater 2021, 59, 369–380. [Google Scholar] [CrossRef]
  40. Robertson, W.D.; Cherry, J.A.; Sudicky, E.A. Ground-water contamination from two small septic systems on sand aquifers. Groundwater 1991, 29, 82–92. [Google Scholar] [CrossRef]
  41. Geary, P.; Lucas, S. Contamination of estuaries from failing septic tank systems: Difficulties in scaling up from monitored individual systems to cumulative impact. Environ. Sci. Pollut. Res. 2018, 26, 2132–2144. [Google Scholar] [CrossRef]
  42. O’Driscoll, M.; Johnson, P.; Mallinson, D. Geological controls and effects of floodplain asymmetry on river–groundwater interactions in the southeastern Coastal Plain, USA. Hydrogeol. J. 2010, 18, 1265–1279. [Google Scholar] [CrossRef]
  43. US Climate Data. Climate for North Carolina. 2021. Available online: https://www.usclimatedata.com/climate/north-carolina/united-states/3203 (accessed on 6 April 2021).
  44. Pradhan, S. Predicting Nutrient Loadings and Fate and Transport of Nitrogen Derived from On-Site Systems. Ph.D. Thesis, North Carolina State University, Raleigh, NC, USA, 22 November 2004. [Google Scholar]
  45. USDA. Pitt County Soil Survey. 1974. Available online: https://www.pittcountync.gov/DocumentCenter/View/6381/Soil-Survey- (accessed on 6 April 2021).
  46. R Core Team. R: A Language and Environment for Statistical Computing Computer Program; R Foundation for Statistical Computing: Vienna, Austria, 2019; Available online: http://www.r-project.org (accessed on 6 April 2021).
  47. RStudio Team. RStudio: Integrated Development for R; RStudio, Inc.: Boston, MA, USA, 2019; Available online: http://www.rstudio.com/ (accessed on 6 April 2021).
  48. Wickham, H. ggplot2: Elegant Graphics for Data Analysis; Springer: New York, NY, USA, 2016. [Google Scholar]
  49. Wilke, C.O. cowplot: Streamlined Plot Theme and Plot Annotations for ‘ggplot2’. 2019. Available online: https://CRAN.R-project.org/package=cowplot (accessed on 6 April 2021).
  50. Wickham, H.; Bryan, J. readxl: Read Excel Files. 2019. Available online: https://CRAN.R-project.org/package=readxl (accessed on 6 April 2021).
  51. Wickham, H.; François, R.; Henry, L.; Müller, K. dplyr: A Grammar of Data Manipulation. 2020. Available online: https://CRAN.R-project.org/package=dplyr (accessed on 6 April 2021).
  52. Geary, P. Effluent tracing and the transport of contaminants from a domestic septic system. Water Sci. Technol. 2005, 51, 283–290. [Google Scholar] [CrossRef] [PubMed]
  53. Humphrey, C.; O’Driscoll, M.; Harris, J. Spatial distribution of fecal indicator bacteria in groundwater beneath two large on-site wastewater treatment systems. Water 2014, 6, 602–619. [Google Scholar] [CrossRef] [Green Version]
  54. Juan, M.; Chengyao, P.; Li, W.; Shuying, W.; Yang, L.; Ningping, M.; Xia, Y.; Yongzhen, P. Biological nitrogen removal in a step-feed CAST with real-time control treating municipal wastewater. Water Sci. Technol. 2010, 61, 2325–2332. [Google Scholar] [CrossRef]
  55. Lancellotti, B.; Loomis, G.; Hoyt, K.; Avizinis, E.; Amador, J. Evaluation of nitrogen concentration in final effluent of advanced nitrogen-removal onsite wastewater treatment systems (OWTS). Water Air Soil Pollut. 2017, 228, 1–16. [Google Scholar] [CrossRef]
  56. Robertson, W.D.; Cherry, J.A. In situ denitrification of septic-system nitrate using reactive porous media barriers: Field trials. Groundwater 1995, 33, 99–111. [Google Scholar] [CrossRef]
  57. Schipper, L.A.; Vojvodić-Vuković, M. Five years of nitrate removal, denitrification and carbon dynamics in a denitrification wall. Water Res. 2001, 35, 3473–3477. [Google Scholar] [CrossRef]
  58. Schipper, L.A.; Robertson, W.D.; Gold, A.J.; Jaynes, D.B.; Cameron, S.C. Denitrifying bioreactors—An approach for reducing nitrate loads to receiving waters. Ecol. Eng. 2010, 36, 1532–1543. [Google Scholar] [CrossRef]
  59. Corbett, D.R.; Dillon, K.; Burnett, W.; Schaefer, G. The spatial variability of nitrogen and phosphorus concentration in a sand aquifer influenced by onsite sewage treatment and disposal systems: A case study on St. George Island, Florida. Environ. Pollut. 2002, 117, 337–345. [Google Scholar] [CrossRef]
  60. Hill, D.E.; Frink, C.R. Septic system longevity increased by improved design. Water Pollut. Contr. Fed. 1980, 52, 2199–2203. [Google Scholar]
  61. US EPA. New Homebuyer’s Guide to Septic Systems. 2017. Available online: https://www.epa.gov/sites/production/files/2017-08/documents/170803-homebuyerssepticguide_508c.pdf (accessed on 6 April 2021).
Figure 1. Groundwater monitoring Sites 100 to 400 were located in Pitt County, North Carolina, USA, within the nutrient-sensitive Neuse and Tar-Pamlico River Basins denoted by the dashed line. Drainfield trenches are within the shaded regions of each site. Wells BG, 301, 302, 401 and 402 serve as background groundwater sampling locations for the sites. Wells 404 and 405 are located 15-m down-gradient from the Site 400 drainfield. Other wells (101–106, 201–208, 303–306, 403) are between drainfield trenches or <3 m down-gradient from the drainfields and are considered drainfield wells.
Nitrogen 02 00018 g001
Figure 2. Box plots showing total dissolved nitrogen (TDN) concentrations in septic tank effluent (T) and groundwater near (<3 m) the drainfield trenches (DFs) at each site (A). Figure (B) shows old (>10 years) and new (<1 year) and gravity (Grav) and pressure (Pres) dosed comparisons of TDN concentrations in wastewater and groundwater. Mean percent concentration reductions are shown as percentages. Circles indicate mean concentrations, horizontal lines show median concentrations, asterisks are statistical outliers.
Nitrogen 02 00018 g002
Figure 3. Box plots showing total dissolved nitrogen (TDN) concentrations in background groundwater (BG), septic tank effluent (tank), in groundwater from individual wells, and pooled data from groundwater near and down-gradient from the systems (DG). Wells BG, 301, 302, 401 and 402 serve as background groundwater sampling locations for the sites. Wells 404 and 405 are located 15-m down-gradient from the Site 400 drainfield. Other wells (101–106, 201–208, 303–306, 403) are between drainfield trenches or <3 m down-gradient from the drainfields and are considered drainfield wells. Circles indicate mean concentrations, horizontal lines show median concentrations, asterisks are statistical outliers.
Nitrogen 02 00018 g003
Figure 4. Mean percentages of total dissolved nitrogen in wastewater sampled from the septic tanks (T), and in groundwater near (<3 m) the drainfield (DF) of each site that was dissolved organic (DON), ammonium (NH4+) and nitrate (NO3) for Sites 100 to 400.
Nitrogen 02 00018 g004
Figure 5. Box plots showing ammonium nitrogen (NH4+-N) concentrations in wastewater collected from the septic tanks (T) and groundwater near (<3 m) the drainfields (DFs) at Sites 100 to 400. The treatment efficiencies for the onsite wastewater systems are shown as percentages. Circles indicate mean concentrations, horizontal lines show median concentrations, asterisks are statistical outliers.
Nitrogen 02 00018 g005
Table 1. System and soil characteristics for Sites 100 to 400.
SiteAge at Start of Research (Years)Drainfield MediaDrainfield Trenches Length (m), NumberMax Design Flow (L·day−1)Effluent DistributionSoil Series
10012Polystyrene26, 249500Pressure ManifoldExum
200<1Chamber30, 2010,880Pressure ManifoldExum
300<1Polystyrene21, 31512Distribution BoxWagram
40012Gravel24, 51360Distribution BoxGoldsboro
Table 2. Mean and (standard deviation) of physicochemical properties of water collected from the septic tank, background groundwater wells (BG, 301, 302, 401, 402), wells near (<3 m) the drainfield trenches (101–106, 201–208, 303–306, 403), and all wells down-gradient (DG) from the systems (all except background).
SitepHTemperature (°C)Specific Conductance (µS·cm−1)Depth to Water (m)DO (mg·L−1)
100 Tank6.6 (1.6)14.7 (3.7)1400.5 (142.9)N/A1.9 (1.1)
100 BG5.3 (0.9)18.6 (5.8)108.4 (58.9)1.3 (0.6)3.8 (2.1)
1013.9 (0.5)18.6 (6.2)773.8 (234.9)1.8 (0.6)3.6 (2.2)
1025.9 (0.4)16.1 (7.8)605.7 (225.0)1.6 (0.6)3.4 (2.8)
1034.3 (0.8) 17.2 (5.6)309.7 (284.3)1.6 (0.6)6.4 (3.0)
1043.9 (0.2) 18.1 (5.8)156.1 (146.3)1.6 (0.7)3.6 (2.4)
1053.6 (0.3)16.7 (7.6)714.7 (342.2)1.8 (0.7)5.2 (2.4)
1064.2 (0.4)18.6 (6.2)408.2 (184.6)1.8 (0.6)3.7 (2.4)
100 DG4.3 (0.8)17.6 (1.0)494.7 (242.9)1.7 (0.1)4.3 (2.5)
200 Tank6.6 (1.1)14.7 (3.7)1400.5 (142.9)N/A1.9 (1.1)
200 BG5.3 (0.9)18.6 (5.8)108.4 (58.9)1.3 (0.6)3.8 (2.1)
2014.7 (1.0) 18.6 (5.2)285.1 (197.5)1.8 (0.6)4.5 (2.4)
2025.1 (0.5)18.9 (6.8)191.6 (124.8)1.7 (0.6)4.2 (2.1)
2034.8 (0.9)18 (5.6)92.7 (58.0)1.8 (0.6)4.3 (2.8)
2044.5 0.2)18.4 (5.5) 257.0 (41.2)1.9 (0.6)3.9 (1.3)
2055 (0.6)18.3 (5.0)291.0 (129.8)1.8 (0.6)3.0 (1.8)
2065.2 (0.5)18.3 (5.5)389.6 (244.9)1.8 (0.6)3.8 (3.0)
2074.9 (0.8)18.3 (5.4)141.7 (82.4)1.9 (0.6)5.0 (1.8)
2085.0 (0.6) 18.3 (5.9)111.5 (41.7)2.0 (0.6)4.4 (2.5)
200 DG4.9 (0.2)18.4 (0.3)222.0 (103.0)1.8 (0.1)4.1 (2.2)
300 Tank7.1 (2.2)18.0 (8.2)1115.4 (196.0)N/A1.9 (0.2)
300 BG5.6 (0.4)18.0 (0.2)140.9 (48.2)2.6 (0.3)2.6 (0.3)
3015.9 (0.6)17.8 (62.6) 175.0 (62.6)2.4 (0.2)3.5 (2.2)
3025.3 (0.5)18.1 (3.9)106.8 (51.2)2.8 (0.2)5.7 (1.9)
3035.1 (0.4)18.0 (3.5)109.6 (25.2)3.1 (0.3)5.4 (1.7)
3045.7 (0.5)18.4 (4.0)175.2 (66.9)3.1 (0.3)5.3 (1.9)
3055.5 (0.6)18.1 (3.5)122.6 (19.1)3.4 (0.3)5.1 (2.9)
3065 (0.4)18.1 (3.2)138.2 (16.8)3.3 (0.2)6.2 (1.5)
300 DG5.3 (0.3)18.2 (0.2)136.4 (28.4)3.2 (0.2)5.5 (2.0)
400 Tank6.6 (0.4)21.1 (6.2)792.0 (171.3)N/A0.9 (0.6)
400 BG5.5 (0.1)18.4 (0.3)203.8 (4.2)0.8 (0.1)2.9 (0.2)
4015.5 (2.1)18.2 (5.6)206.7 (24.4)0.9 (0.1)3 (1.2)
4025.4 (1.8) 18.6 (5.8)200.8 (79.9)0.7 (0.1)2.7 (0.8)
4035.6 (2.1)17.6 (7.3)523.4 (122.7)0.5 (0.1)1.8 (0.7)
4045.5 (1.8)16.8 (4.7)248.6 (80.0)1.3 (0.1)2.4 (1.4)
4055.8 (0.2)17.3 (5.4)144.8 (55.8)1.1 (0.1)1.7 (0.9)
400 DG5.6 (0.2)17.2 (0.4)305.6 (195.6)1.0 (0.4)2.0 (1.0)
Publisher’s Note: MDPI stays neutral with regard to jurisdictional claims in published maps and institutional affiliations.

