Comparative Effectiveness Trial of an Obesity Prevention Intervention in EFNEP and SNAP-ED: Primary Outcomes

Abstract
:1. Introduction
2. Materials and Methods
2.1. Design
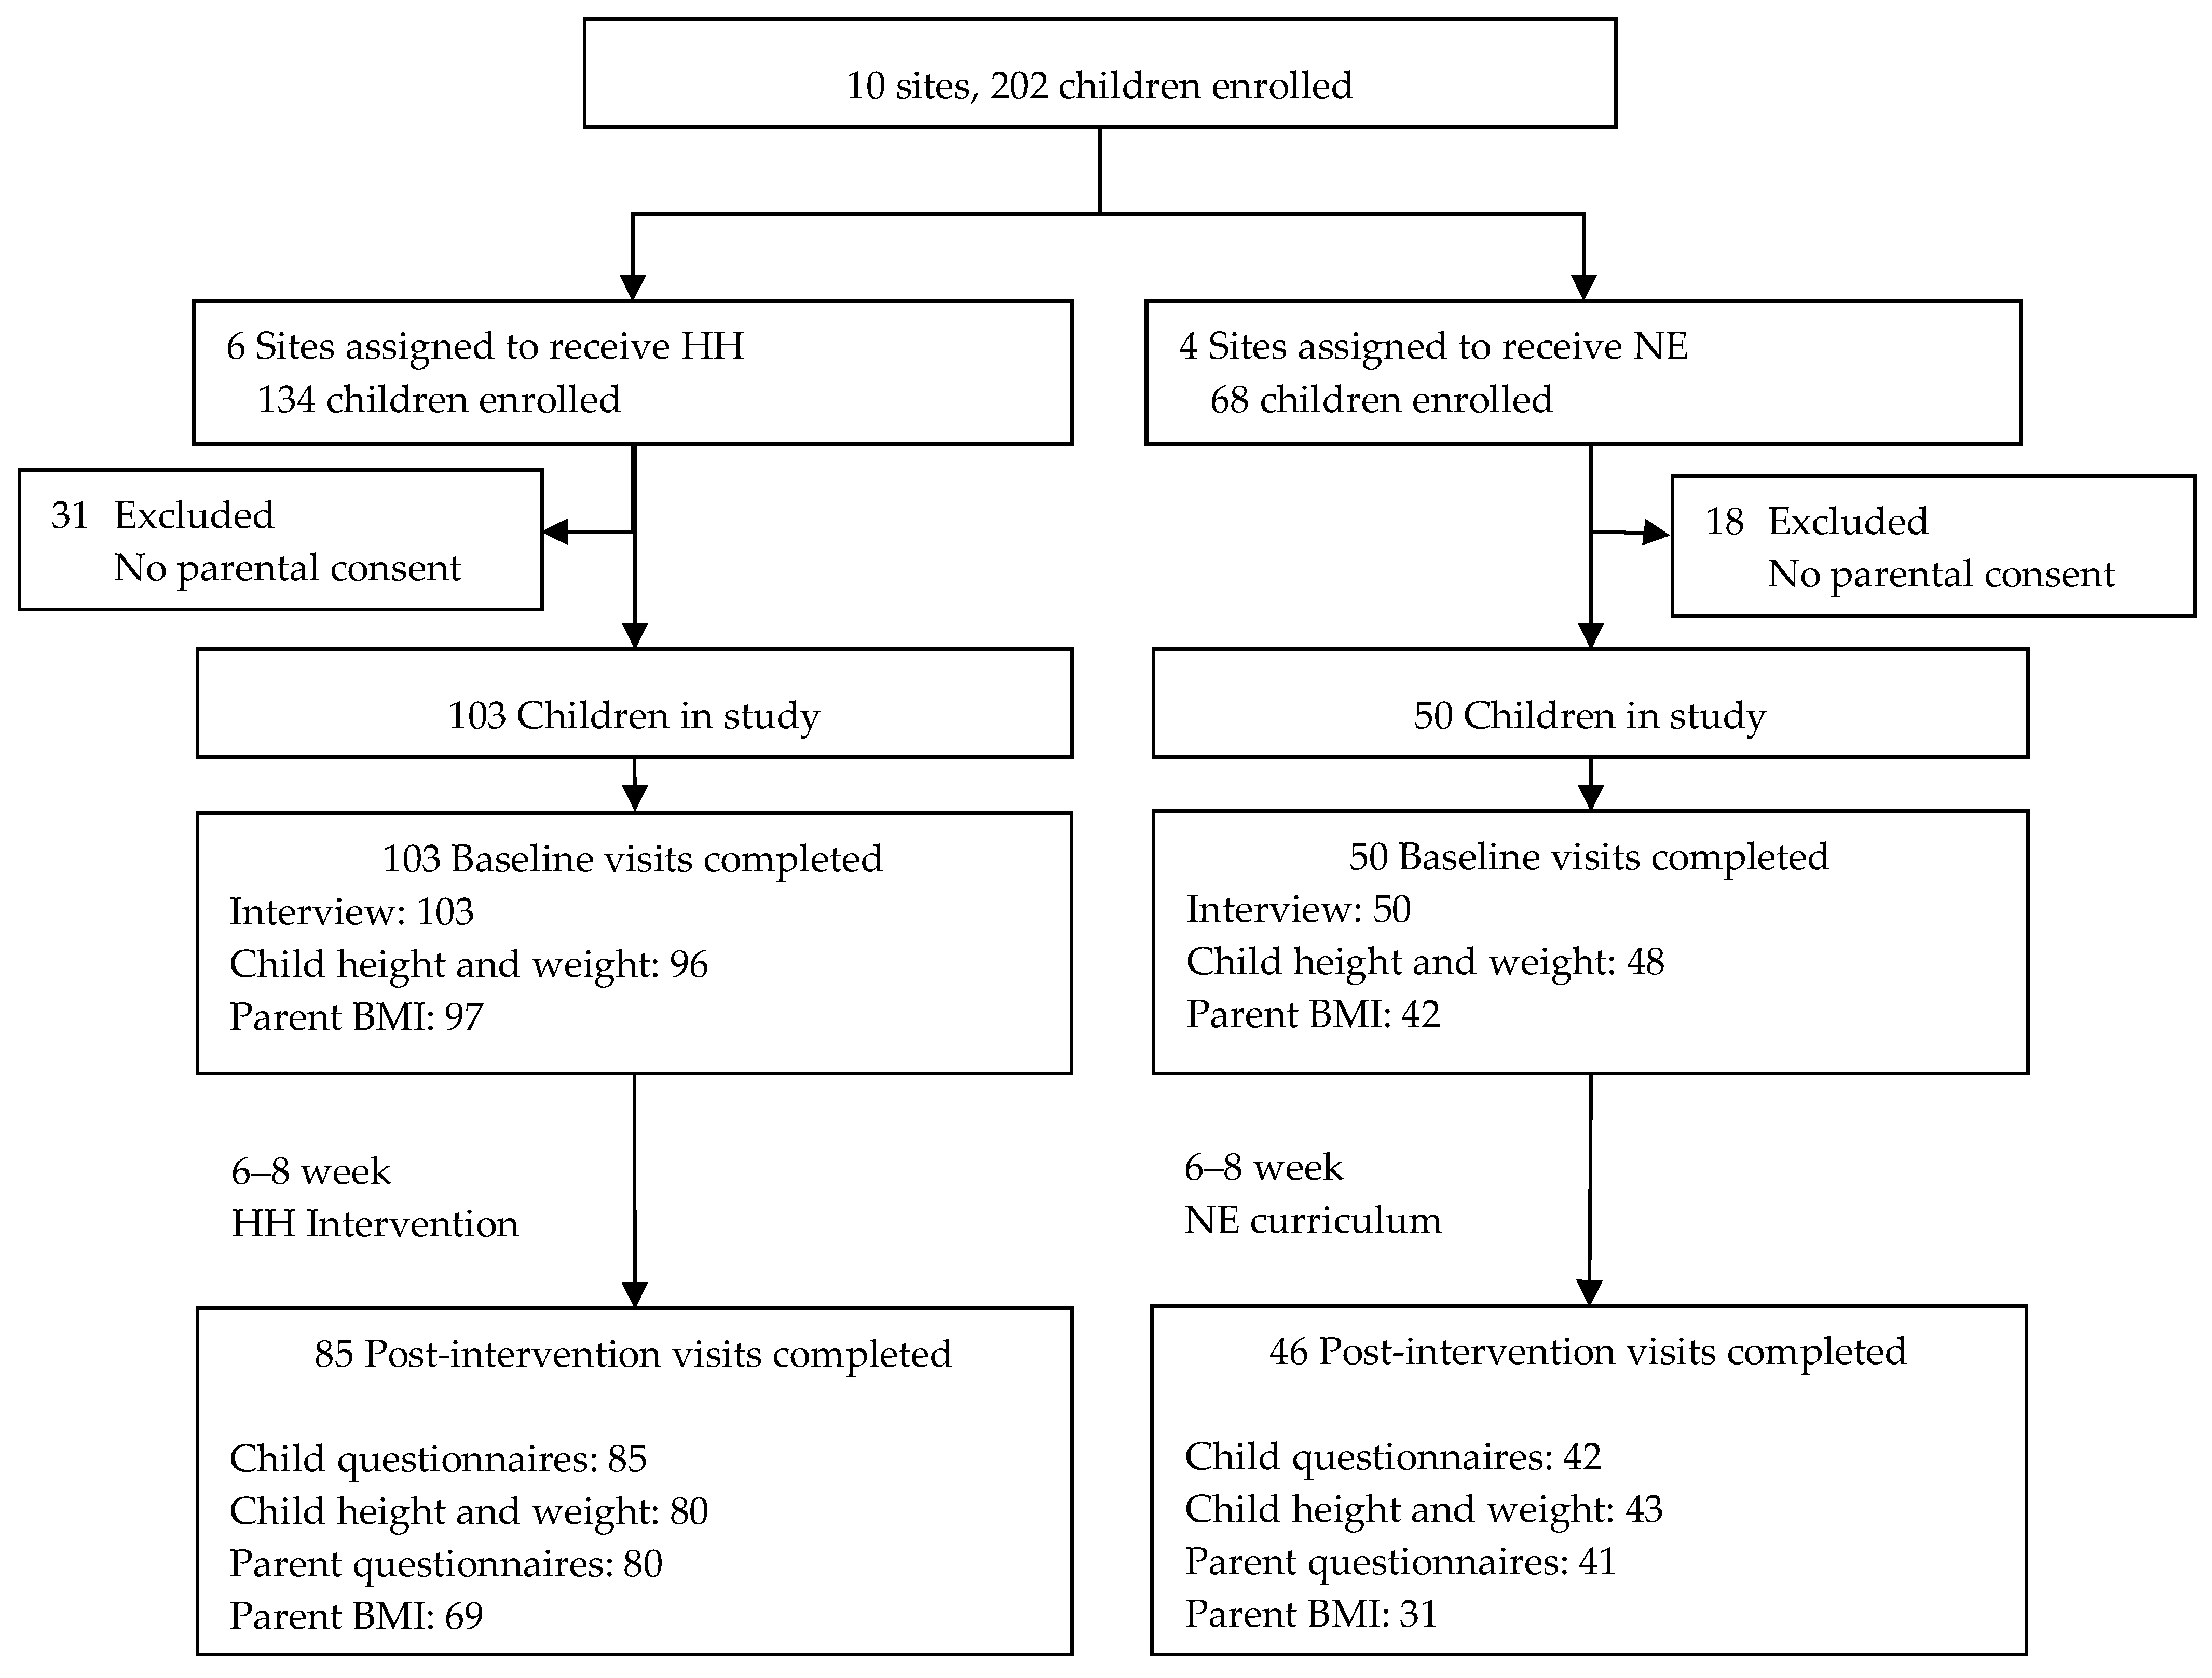
2.1.1. Sample
2.1.2. Measures
2.1.3. Demographics
2.1.4. Anthropometrics
2.1.5. Dietary Intake
2.1.6. Physical Activity
2.1.7. Screen Time
2.2. Intervention
2.2.1. Adaptation of HH for Children and Parents
2.2.2. Standard Nutrition Education Intervention
2.2.3. Training
2.3. Analysis
3. Results
4. Discussion
5. Conclusions
Author Contributions
Funding
Conflicts of Interest
References
- Organization, W.H. Obesity: Preventing and Managing the Global Epidemic; World Health Organization: Geneva, Switzerland, 2000. [Google Scholar]
- Ogden, C.L.; Carroll, M.D.; Curtin, L.R.; McDowell, M.A.; Tabak, C.J.; Flegal, K.M. Prevalence of overweight and obesity in the United States, 1999–2004. JAMA 2006, 295, 1549–1555. [Google Scholar] [CrossRef]
- Ogden, C.L.; Carroll, M.D.; Curtin, L.R.; Lamb, M.M.; Flegal, K.M. Prevalence of high body mass index in US children and adolescents, 2007–2008. JAMA 2010, 303, 242–249. [Google Scholar] [CrossRef] [PubMed]
- Must, A.; Spadano, J.; Coakley, E.H.; Field, A.E.; Colditz, G.; Dietz, W.H. The disease burden associated with overweight and obesity. JAMA 1999, 282, 1523–1529. [Google Scholar] [CrossRef] [PubMed]
- Ogden, C.L.; Carroll, M.D.; Lawman, H.G.; Fryar, C.D.; Kruszon-Moran, D.; Kit, B.K.; Flegal, K.M. Trends in Obesity Prevalence Among Children and Adolescents in the United States, 1988–1994 Through 2013–2014. JAMA 2016, 315, 2292–2299. [Google Scholar] [CrossRef] [PubMed]
- Fahlman, M.M.; McCaughtry, N.; Martin, J.; Shen, B. Racial and socioeconomic disparities in nutrition behaviors: Targeted interventions needed. J. Nutr. Educ. Behav. 2010, 42, 10–16. [Google Scholar] [CrossRef]
- Olshansky, S.J.; Passaro, D.J.; Hershow, R.C.; Layden, J.; Carnes, B.A.; Brody, J.; Hayflick, L.; Butler, R.N.; Allison, D.B.; Ludwig, D.S. A potential decline in life expectancy in the United States in the 21st century. N. Engl. J. Med. 2005, 352, 1138–1145. [Google Scholar] [CrossRef]
- Cunningham, S.A.; Kramer, M.R.; Narayan, K.M. Incidence of childhood obesity in the United States. N. Engl. J. Med. 2014, 370, 1660–1661. [Google Scholar] [CrossRef]
- Ogden, C.L.; Carroll, M.D.; Kit, B.K.; Flegal, K.M. Prevalence of childhood and adult obesity in the United States, 2011–2012. JAMA 2014, 311, 806–814. [Google Scholar] [CrossRef] [PubMed]
- Wang, Y.; Zhang, Q. Are American children and adolescents of low socioeconomic status at increased risk of obesity? Changes in the association between overweight and family income between 1971 and 2002. Am. J. Clin. Nutr. 2006, 84, 707–716. [Google Scholar] [CrossRef] [PubMed] [Green Version]
- Leung, C.W.; Blumenthal, S.J.; Hoffnagle, E.E.; Jensen, H.H.; Foerster, S.B.; Nestle, M.; Cheung, L.W.; Mozaffarian, D.; Willett, W.C. Associations of food stamp participation with dietary quality and obesity in children. Pediatrics 2013, 131, 463–472. [Google Scholar] [CrossRef]
- Hesketh, K.D.; Campbell, K.J. Interventions to prevent obesity in 0–5 year olds: An updated systematic review of the literature. Obesity (Silver Spring) 2010, 18 (Supp. 1), S27–S35. [Google Scholar] [CrossRef]
- Fitzgibbon, M.L.; Stolley, M.R.; Schiffer, L.; Van Horn, L.; KauferChristoffel, K.; Dyer, A. Two-year follow-up results for Hip-Hop to Health Jr.: A randomized controlled trial for overweight prevention in preschool minority children. J. Pediatr. 2005, 146, 618–625. [Google Scholar] [CrossRef] [PubMed]
- Estabrooks, P.; Dzewaltowski, D.A.; Glasgow, R.E.; Klesges, L.M. Reporting of validity from school health promotion studies published in 12 leading journals, 1996–2000. J. Sch. Health 2003, 73, 21–28. [Google Scholar] [CrossRef] [PubMed]
- Glasgow, R.E.; Vogt, T.M.; Boles, S.M. Evaluating the public health impact of health promotion interventions: The RE-AIM framework. Am. J. Public Health 1999, 89, 1322–1327. [Google Scholar] [CrossRef]
- Westfall, J.M.; Mold, J.; Fagnan, L. Practice-based research--"Blue Highways" on the NIH roadmap. JAMA 2007, 297, 403–406. [Google Scholar] [CrossRef] [PubMed]
- Woolf, S.H. The meaning of translational research and why it matters. JAMA 2008, 299, 211–213. [Google Scholar] [CrossRef] [PubMed]
- Heelan, K.A.; Bartee, R.T.; Nihiser, A.; Sherry, B. Healthier School Environment Leads to Decreases in Childhood Obesity: The Kearney Nebraska Story. Childhood Obes. 2015, 11, 600–607. [Google Scholar] [CrossRef]
- Fitzgibbon, M.L.; Stolley, M.R.; Dyer, A.R.; VanHorn, L.; KauferChristoffel, K. A community-based obesity prevention program for minority children: Rationale and study design for Hip-Hop to Health Jr. Prev. Med. 2002, 34, 289–297. [Google Scholar] [CrossRef] [PubMed]
- Fitzgibbon, M.L.; Stolley, M.R.; Schiffer, L.; Kong, A.; Braunschweig, C.L.; Gomez-Perez, S.L.; Odoms-Young, A.; Van Horn, L.; Christoffel, K.K.; Dyer, A.R. Family-based hip-hop to health: Outcome results. Obesity (Silver Spring) 2013, 21, 274–283. [Google Scholar] [CrossRef] [PubMed] [Green Version]
- Fitzgibbon, M.L.; Stolley, M.R.; Schiffer, L.A.; Braunschweig, C.L.; Gomez, S.L.; Van Horn, L.; Dyer, A.R. Hip-Hop to Health Jr. Obesity Prevention Effectiveness Trial: Postintervention results. Obesity (Silver Spring) 2011, 19, 994–1003. [Google Scholar] [CrossRef]
- Stolley, M.R.; Fitzgibbon, M.L.; Dyer, A.; Van Horn, L.; KauferChristoffel, K.; Schiffer, L. Hip-Hop to Health Jr., an obesity prevention program for minority preschool children: Baseline characteristics of participants. Prev. Med. 2003, 36, 320–329. [Google Scholar] [CrossRef]
- Krauss, R.M.; Eckel, R.H.; Howard, B.; Appel, L.J.; Daniels, S.R.; Deckelbaum, R.J.; Erdman, J.W., Jr.; Kris-Etherton, P.; Goldberg, I.J.; Kotchen, T.A.; et al. AHA Dietary Guidelines: Revision 2000: A statement for healthcare professionals from the Nutrition Committee of the American Heart Association. Stroke 2000, 31, 2751–2766. [Google Scholar] [CrossRef] [PubMed]
- Burney, J.; Haughton, B. EFNEP: A nutrition education program that demonstrates cost-benefit. J. Am. Diet. Assoc. 2002, 102, 39–45. [Google Scholar] [CrossRef]
- Del Tredici, A.M.; Joy, A.B.; Omelich, C.L.; Laughlin, S.G. Evaluation study of the California Expanded Food and Nutrition Education Program: 24-hour food recall data. J. Am. Diet. Assoc. 1988, 88, 185–190. [Google Scholar] [PubMed]
- Cullen, K.W.; Lara Smalling, A.; Thompson, D.; Watson, K.B.; Reed, D.; Konzelmann, K. Creating healthful home food environments: Results of a study with participants in the expanded food and nutrition education program. J. Nutr. Educ. Behav. 2009, 41, 380–388. [Google Scholar] [CrossRef] [PubMed]
- Shadish, W.R.; Cook, T.D.; Campbell, D.T. Experimental and Quasi-Experimental Designs for Generalized Causal Inference; Wadsworth Cengage Learning: Belmont, CA, USA, 2002. [Google Scholar]
- Ogden, C.L.; Kuczmarski, R.J.; Flegal, K.M.; Mei, Z.; Guo, S.; Wei, R.; Grummer-Strawn, L.M.; Curtin, L.R.; Roche, A.F.; Johnson, C.L. Centers for Disease Control and Prevention 2000 growth charts for the United States: Improvements to the 1977 National Center for Health Statistics version. Pediatrics 2002, 109, 45–60. [Google Scholar] [CrossRef] [PubMed]
- Paxton, A.E.; Strycker, L.A.; Toobert, D.J.; Ammerman, A.S.; Glasgow, R.E. Starting the conversation performance of a brief dietary assessment and intervention tool for health professionals. Am. J. Prev Med. 2011, 40, 67–71. [Google Scholar] [CrossRef]
- Godin, G.; Shephard, R.J. A simple method to assess exercise behavior in the community. Can. J. Appl Sport Sci. 1985, 10, 141–146. [Google Scholar] [PubMed]
- Borzekowski, D.L.; Robinson, T.N. The remote, the mouse, and the no. 2 pencil: The household media environment and academic achievement among third grade students. Arch. Pediatr Adolesc Med. 2005, 159, 607–613. [Google Scholar] [CrossRef]
- Andriani, H.; Liao, C.Y.; Kuo, H.W. Parental weight changes as key predictors of child weight changes. BMC Pub. Health 2005, 15, 645. [Google Scholar]


| Variable Name | HH (Hip Hop) N = 103 | NE (Nutrition Education) N = 50 | All N = 153 a | ||||
|---|---|---|---|---|---|---|---|
| Mean or % | SD or N | Mean or % | SD or N | Pb | Mean or % | SD or N | |
| Age, months | 54.8 | 7.4 | 51.5 | 10.2 | 0.03 | 53.7 | 8.5 |
| Sex | 0.88 | ||||||
| Male | 45% | 46 | 46% | 23 | 45% | 69 | |
| Female | 55% | 57 | 54% | 27 | 55% | 84 | |
| Race | <0.001 | ||||||
| Hispanic/Latino | 50% | 52 | 6% | 3 | 36% | 55 | |
| African-American/Black, not Hispanic | 33% | 34 | 46% | 23 | 37% | 57 | |
| White, not Hispanic | 10% | 10 | 30% | 15 | 16% | 25 | |
| Multiracial, other | 7% | 7 | 18% | 9 | 10% | 16 | |
| BMI, kg/m2 | 16.9 | 2.0 | 16.5 | 1.9 | 0.26 | 16.7 | 1.9 |
| BMI Z score | 0.8 | 1.2 | 0.5 | 1.2 | 0.18 | 0.7 | 1.2 |
| BMI percentile | 0.29 | ||||||
| <5th (underweight) | 4% | 4 | 4% | 2 | 4% | 6 | |
| 5th–<85th (normal weight) | 51% | 49 | 63% | 30 | 55% | 79 | |
| 85th–<95th (overweight) | 26% | 25 | 17% | 8 | 23% | 33 | |
| ≥95th (obese) | 19% | 18 | 17% | 8 | 18% | 26 | |
| Weight, kg | 18.8 | 3.5 | 18.5 | 3.3 | 0.62 | 18.7 | 3.4 |
| Height, cm | 105.4 | 6.1 | 105.9 | 6.8 | 0.66 | 105.5 | 6.3 |
| TV, h/day | 2.4 | 1.5 | 1.9 | 1.5 | 0.04 | 2.2 | 1.5 |
| Screen time, h/day | 4.3 | 2.7 | 3.3 | 2.1 | 0.02 | 4.0 | 2.5 |
| STC diet score (0–16) c | 9.6 | 2.2 | 9.9 | 2.1 | 0.47 | 9.7 | 2.2 |
| Godin Leisure-Time Exercise d | 75.8 | 35.5 | 74.1 | 45.2 | 0.49 | 75.2 | 38.8 |
| Godin Leisure-Time Exercise, moderate and strenuous only d | 61.0 | 32.4 | 58.2 | 41.6 | 0.32 | 60.1 | 35.5 |
| Variable Name | HH N = 103 | NE N = 50 | All N = 153 a | ||||
|---|---|---|---|---|---|---|---|
| Mean or % | SD or N | Mean or % | SD or N | Pb | Mean or % | SD or N | |
| Age, years | 32.9 | 8.6 | 37.5 | 9.6 | 0.004 | 34.4 | 9.2 |
| Sex | 0.31 | ||||||
| Male | 14% | 14 | 8% | 4 | 12% | 18 | |
| Female | 86% | 89 | 92% | 46 | 88% | 135 | |
| Relationship to child | 0.69 | ||||||
| Mother | 80% | 82 | 84% | 42 | 81% | 124 | |
| Father | 13% | 13 | 8% | 4 | 11% | 17 | |
| Other | 8% | 8 | 8% | 4 | 8% | 12 | |
| Race | <0.001 | ||||||
| Hispanic/Latino | 51% | 53 | 6% | 3 | 37% | 56 | |
| African-American/Black, not Hispanic | 34% | 35 | 48% | 24 | 39% | 59 | |
| White, not Hispanic | 11% | 11 | 34% | 17 | 18% | 28 | |
| Multiracial, other | 4% | 4 | 12% | 6 | 7% | 10 | |
| Born in US (Hispanic only) | 25% | 13 | 67% | 2 | --g | 27% | 15 |
| Years in US (if born outside US) | 13.5 | 8.9 | 1.0 | -- | --g | 13.1 | 9.0 |
| Education, years | 12.6 | 2.4 | 15.7 | 2.3 | <0.001 | 13.6 | 2.8 |
| Education, categories | <0.001 | ||||||
| Not HS graduate | 21% | 22 | 2% | 1 | 15% | 23 | |
| HS graduate/General Education Diploma | 36% | 37 | 10% | 5 | 27% | 42 | |
| Some college, no degree | 19% | 20 | 14% | 7 | 18% | 27 | |
| Associate’s degree | 8% | 8 | 4% | 2 | 7% | 10 | |
| Bachelor’s degree | 16% | 16 | 70% | 35 | 33% | 51 | |
| Employed full or part-time | 36% | 37 | 62% | 31 | 0.002 | 44% | 68 |
| Marital status | 0.17 | ||||||
| Single, never married | 36% | 37 | 28% | 14 | 33% | 51 | |
| Married or living with partner | 56% | 58 | 70% | 35 | 61% | 93 | |
| Separated, divorced, widowed | 8% | 8 | 2% | 1 | 6% | 9 | |
| Owns or leases car | 47 | 47% | 82% | 41 | <0.001 | 59% | 88 |
| Public assistance in last 6 months | |||||||
| Cash assistance | 8% | 8 | 4% | 2 | 0.50 | 7% | 10 |
| SNAP | 52% | 53 | 22% | 11 | <0.001 | 42% | 64 |
| WIC | 30% | 30 | 10% | 5 | 0.006 | 23% | 35 |
| BMI, kg/m2 | 29.3 | 6.9 | 29.6 | 7.9 | 0.81 | 29.4 | 7.2 |
| BMI category, kg/m2 | 0.96 | ||||||
| <18.5 (underweight) | 0% | 0 | 2% | 1 | 1% | 1 | |
| 18.5–<25 (normal weight) | 32% | 31 | 26% | 11 | 30% | 42 | |
| 25–<30 (overweight) | 29% | 28 | 33% | 14 | 30% | 42 | |
| ≥30 (obese) | 39% | 38 | 38% | 16 | 39% | 54 | |
| Weight, kg | 75.6 | 21.4 | 80.4 | 22.0 | 0.23 | 77.0 | 21.6 |
| Height, cm | 160.3 | 9.8 | 164.7 | 6.3 | 0.009 | 161.6 | 9.1 |
| TV, h/day | 2.8 | 2.1 | 1.9 | 1.3 | 0.02 | 2.5 | 1.9 |
| Screen time, h/day | 5.6 | 4.4 | 6.1 | 3.3 | 0.09 | 5.8 | 4.1 |
| STC diet score (0–16) c | 9.5 | 2.9 | 9.7 | 2.8 | 0.82 | 9.5 | 2.9 |
| Godin Leisure-Time Exercise score d | 52.2 | 44.9 | 46.7 | 32.8 | 0.64 | 50.4 | 41.3 |
| Godin PA score, moderate and strenuous only d | 39.1 | 39.5 | 33.4 | 30.1 | 0.55 | 37.2 | 36.7 |
| Variable Name | No Covariates a | Covariates b | ||||||||
|---|---|---|---|---|---|---|---|---|---|---|
| HH | NE | HH | NE | |||||||
| Mean Change | SD | Mean Change | SD | P | Mean Change | SD | Mean Change | SD | P | |
| Children c | ||||||||||
| STC diet score (0–16) d | 0.34 | 0.24 | 0.18 | 0.34 | 0.71 | 0.29 | 0.24 | 0.16 | 0.34 | 0.76 |
| Godin Leisure-Time Exercise e | 6.66 | 4.73 | 18.53 * | 6.78 | 0.15 | 6.83 | 4.78 | 19.10 * | 6.82 | 0.14 |
| Godin Leisure-Time Exercise, moderate and strenuous only e | 4.39 | 4.23 | 15.39 * | 6.07 | 0.14 | 4.72 | 4.28 | 16.00 * | 6.11 | 0.13 |
| TV, h/day | 0.01 | 0.19 | −0.36 | 0.27 | 0.25 | 0.04 | 0.19 | −0.35 | 0.27 | 0.24 |
| Screen time, h/day | 0.20 | 0.23 | −0.22 | 0.33 | 0.30 | 0.22 | 0.23 | −0.19 | 0.33 | 0.31 |
| BMI, kg/m2 | 0.00 | 0.04 | 0.10 * | 0.05 | 0.11 | 0.00 | 0.06 | 0.11 | 0.07 | 0.23 |
| BMI Z score | 0.00 | 0.04 | 0.07 | 0.05 | 0.29 | 0.00 | 0.04 | 0.07 | 0.05 | 0.27 |
| Parents c | ||||||||||
| STC diet score (0–16) d | 0.75 * | 0.26 | 0.35 | 0.36 | 0.36 | 0.79 * | 0.25 | 0.41 | 0.35 | 0.38 |
| Godin Leisure-Time Exercise e | 3.01 | 4.67 | 6.99 | 6.57 | 0.62 | 3.50 | 4.77 | 6.74 | 6.70 | 0.69 |
| Godin Leisure-Time Exercise, moderate and strenuous only e | 2.14 | 4.23 | 5.36 | 5.94 | 0.66 | 2.68 | 4.32 | 5.39 | 6.07 | 0.72 |
| TV, h/day | −0.18 | 0.16 | −0.19 | 0.22 | 0.96 | −0.19 | 0.16 | −0.19 | 0.22 | 0.98 |
| Screen time, h/day | 0.32 | 0.32 | 0.03 | 0.44 | 0.60 | 0.34 | 0.32 | −0.03 | 0.45 | 0.51 |
| BMI, kg/m2 | −0.22 * | 0.10 | 0.30 | 0.15 | 0.005 | −0.20 * | 0.10 | 0.29 | 0.15 | 0.007 |
| Weight, kg | −0.59 * | 0.28 | 0.79 | 0.42 | 0.008 | −0.55 | 0.28 | 0.78 | 0.42 | 0.01 |
© 2019 by the authors. Licensee MDPI, Basel, Switzerland. This article is an open access article distributed under the terms and conditions of the Creative Commons Attribution (CC BY) license (http://creativecommons.org/licenses/by/4.0/).
Share and Cite
Buscemi, J.; Odoms-Young, A.; Stolley, M.R.; Schiffer, L.; Blumstein, L.; Clark, M.H.; Berbaum, M.L.; McCaffrey, J.; Braunschweig, C.; Fitzgibbon, M.L. Comparative Effectiveness Trial of an Obesity Prevention Intervention in EFNEP and SNAP-ED: Primary Outcomes. Nutrients 2019, 11, 1012. https://0-doi-org.brum.beds.ac.uk/10.3390/nu11051012
Buscemi J, Odoms-Young A, Stolley MR, Schiffer L, Blumstein L, Clark MH, Berbaum ML, McCaffrey J, Braunschweig C, Fitzgibbon ML. Comparative Effectiveness Trial of an Obesity Prevention Intervention in EFNEP and SNAP-ED: Primary Outcomes. Nutrients. 2019; 11(5):1012. https://0-doi-org.brum.beds.ac.uk/10.3390/nu11051012
Chicago/Turabian StyleBuscemi, Joanna, Angela Odoms-Young, Melinda R. Stolley, Linda Schiffer, Lara Blumstein, Margaret H. Clark, Michael L. Berbaum, Jennifer McCaffrey, Carol Braunschweig, and Marian L. Fitzgibbon. 2019. "Comparative Effectiveness Trial of an Obesity Prevention Intervention in EFNEP and SNAP-ED: Primary Outcomes" Nutrients 11, no. 5: 1012. https://0-doi-org.brum.beds.ac.uk/10.3390/nu11051012