No Interaction between Polymorphisms Related to Vitamin A Metabolism and Vitamin A Intake in Relation to Colorectal Cancer in a Prospective Danish Cohort

 , , and
Abstract
:1. Introduction
2. Materials and Methods
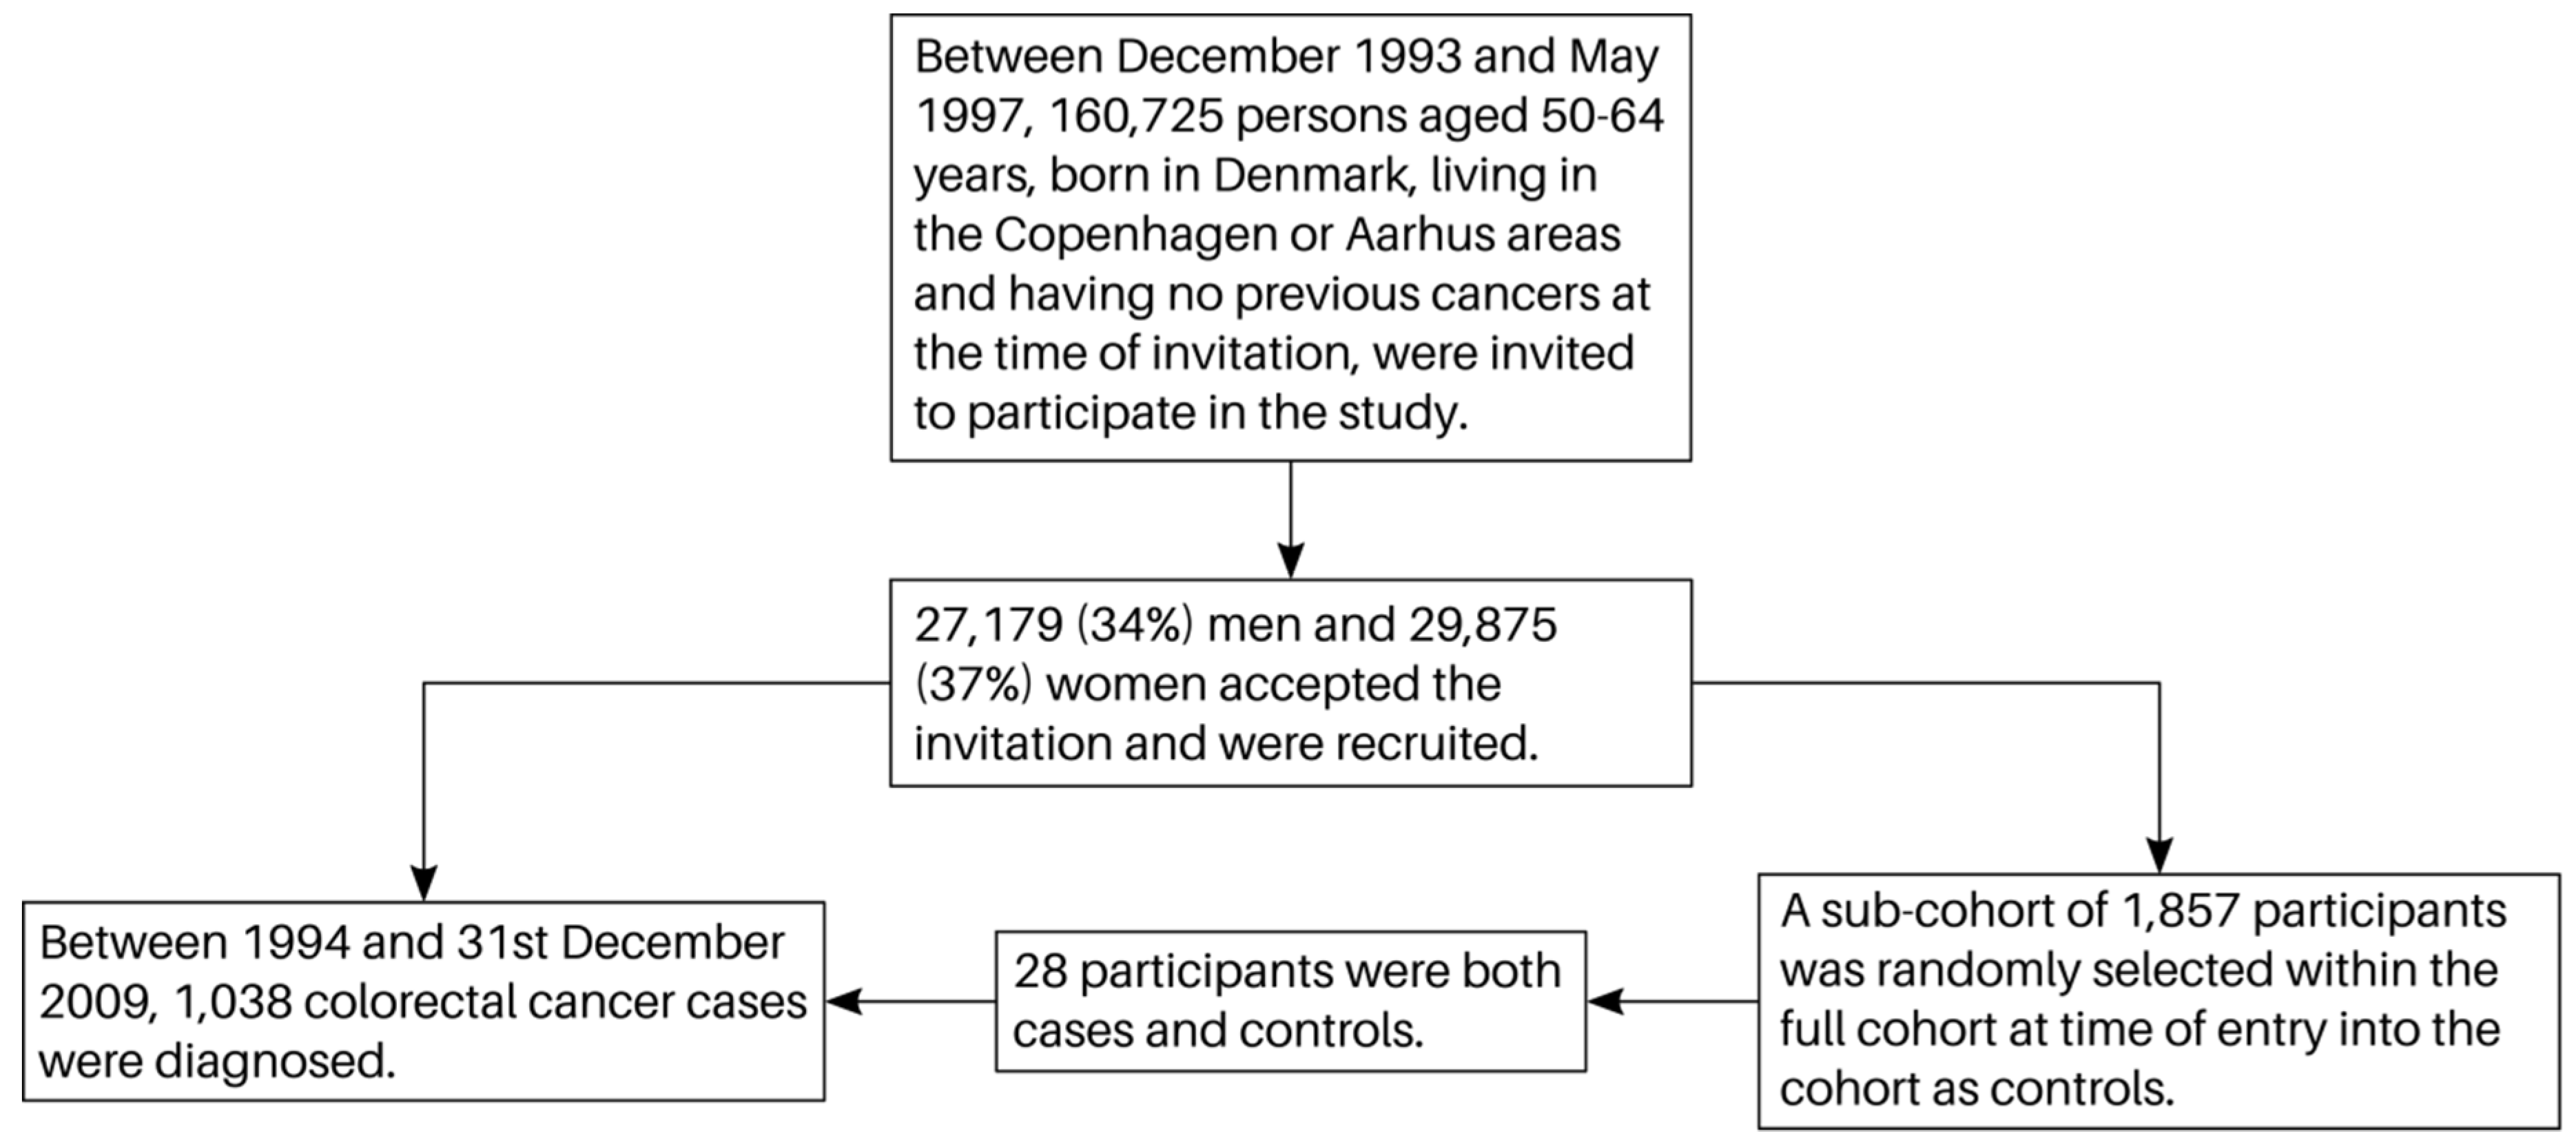
2.1. Subjects
2.2. Follow-Up and Endpoints
2.3. Dietary and Lifestyle Questionnaire
2.4. Genotyping and Selection of Polymorphisms
2.5. Statistics
3. Results
3.1. Baseline Characteristics
3.2. Associations between Polymorphisms and Colorectal Cancer (CRC)
3.3. Interactions between Polymorphisms and Vitamin A Intake
4. Discussion
5. Conclusions
Author Contributions
Funding
Acknowledgments
Conflicts of Interest
Abbreviations
| CI | confidence intervals |
| CRC | colorectal cancer |
| DCH | “Diet, Cancer and Health” |
| EPIC | European Prospective Investigation into Cancer and Nutrition |
| HRT | hormone replacement therapy |
| IRR | incidence rate ratios |
| Nf-kB | nuclear factor kappa-B |
| Nrf-2 | nuclear factor (erythroid-derived 2)-like 2 |
| NSAID | non-steroidal anti-inflammatory drug |
| OR | odds ratio |
| RE | retinol equivalents |
References
- How Diet, Nutrition and Physical Activity Affect Colorectal (Bowel) Cancer Risk. Available online: https://www.Wcrf.Org/dietandcancer/colorectal-cancer (accessed on 23 May 2019).
- Huxley, R.R.; Ansary-Moghaddam, A.; Clifton, P.; Czernichow, S.; Parr, C.L.; Woodward, M. The impact of dietary and lifestyle risk factors on risk of colorectal cancer: A quantitative overview of the epidemiological evidence. Int. J. Cancer 2009, 125, 171–180. [Google Scholar] [CrossRef] [PubMed]
- Vieira, A.R.; Abar, L.; Chan, D.S.M.; Vingeliene, S.; Polemiti, E.; Stevens, C.; Greenwood, D.; Norat, T. Foods and beverages and colorectal cancer risk: A systematic review and meta-analysis of cohort studies, an update of the evidence of the wcrf-aicr continuous update project. Ann. Oncol. 2017, 28, 1788–1802. [Google Scholar] [CrossRef] [PubMed]
- Zhao, Z.; Feng, Q.; Yin, Z.; Shuang, J.; Bai, B.; Yu, P.; Guo, M.; Zhao, Q. Red and processed meat consumption and colorectal cancer risk: A systematic review and meta-analysis. Oncotarget 2017, 8, 83306–83314. [Google Scholar] [CrossRef] [PubMed]
- Terry, P.; Giovannucci, E.; Michels, K.B.; Bergkvist, L.; Hansen, H.; Holmberg, L.; Wolk, A. Fruit, vegetables, dietary fiber, and risk of colorectal cancer. J. Natl. Cancer Inst. 2001, 93, 525–533. [Google Scholar] [CrossRef] [PubMed]
- Strober, W. Vitamin a rewrites the abcs of oral tolerance. Mucosal Immunol. 2008, 1, 92–95. [Google Scholar] [CrossRef] [PubMed]
- Konieczna, P.; Groeger, D.; Ziegler, M.; Frei, R.; Ferstl, R.; Shanahan, F.; Quigley, E.M.; Kiely, B.; Akdis, C.A.; O’Mahony, L. Bifidobacterium infantis 35624 administration induces foxp3 t regulatory cells in human peripheral blood: Potential role for myeloid and plasmacytoid dendritic cells. Gut 2012, 61, 354–366. [Google Scholar] [CrossRef] [PubMed]
- Okayasu, I.; Hana, K.; Nemoto, N.; Yoshida, T.; Saegusa, M.; Yokota-Nakatsuma, A.; Song, S.Y.; Iwata, M. Vitamin a inhibits development of dextran sulfate sodium-induced colitis and colon cancer in a mouse model. Biomed Res. Int. 2016, 2016, 4874809. [Google Scholar] [CrossRef] [PubMed]
- Kim, C.H. Host and microbial factors in regulation of t cells in the intestine. Front. Immunol. 2013, 4, 141. [Google Scholar] [CrossRef] [PubMed]
- Das, S.; Donas, C.; Akeus, P.; Quiding-Jarbrink, M.; Mora, J.R.; Villablanca, E.J. Beta7 integrins contribute to intestinal tumor growth in mice. PLoS ONE 2018, 13, e0204181. [Google Scholar] [CrossRef]
- Ahmad, F.; Dixit, D.; Sharma, V.; Kumar, A.; Joshi, S.D.; Sarkar, C.; Sen, E. Nrf2-driven tert regulates pentose phosphate pathway in glioblastoma. Cell Death Dis. 2016, 7, e2213. [Google Scholar] [CrossRef]
- Kaulmann, A.; Bohn, T. Carotenoids, inflammation, and oxidative stress—implications of cellular signaling pathways and relation to chronic disease prevention. Nutr. Res. 2014, 34, 907–929. [Google Scholar] [CrossRef] [PubMed]
- Pino-Lagos, K.; Guo, Y.; Noelle, R.J. Retinoic acid: A key player in immunity. BioFactors 2010, 36, 430–436. [Google Scholar] [CrossRef] [PubMed]
- Maalmi, H.; Walter, V.; Jansen, L.; Owen, R.W.; Ulrich, A.; Schottker, B.; Chang-Claude, J.; Hoffmeister, M.; Brenner, H. Dose-response relationship between serum retinol levels and survival in patients with colorectal cancer: Results from the dachs study. Nutrients 2018, 10, 510. [Google Scholar] [CrossRef] [PubMed]
- Leenders, M.; Leufkens, A.M.; Siersema, P.D.; van Duijnhoven, F.J.; Vrieling, A.; Hulshof, P.J.; van Gils, C.H.; Overvad, K.; Roswall, N.; Kyro, C.; et al. Plasma and dietary carotenoids and vitamins a, c and e and risk of colon and rectal cancer in the european prospective investigation into cancer and nutrition. Int. J. Cancer 2014, 135, 2930–2939. [Google Scholar] [CrossRef] [PubMed]
- Kabat, G.C.; Kim, M.Y.; Sarto, G.E.; Shikany, J.M.; Rohan, T.E. Repeated measurements of serum carotenoid, retinol and tocopherol levels in relation to colorectal cancer risk in the women’s health initiative. Eur. J. Clin. Nutr. 2012, 66, 549–554. [Google Scholar] [CrossRef] [PubMed]
- Park, Y.; Spiegelman, D.; Hunter, D.J.; Albanes, D.; Bergkvist, L.; Buring, J.E.; Freudenheim, J.L.; Giovannucci, E.; Goldbohm, R.A.; Harnack, L.; et al. Intakes of vitamins a, c, and e and use of multiple vitamin supplements and risk of colon cancer: A pooled analysis of prospective cohort studies. Cancer Causes Control 2010, 21, 1745–1757. [Google Scholar] [CrossRef] [PubMed]
- Wang, Z.; Joshi, A.M.; Ohnaka, K.; Morita, M.; Toyomura, K.; Kono, S.; Ueki, T.; Tanaka, M.; Kakeji, Y.; Maehara, Y.; et al. Dietary intakes of retinol, carotenes, vitamin c, and vitamin e and colorectal cancer risk: The fukuoka colorectal cancer study. Nutr. Cancer 2012, 64, 798–805. [Google Scholar] [CrossRef] [PubMed]
- Bohn, T.; Desmarchelier, C.; Dragsted, L.O.; Nielsen, C.S.; Stahl, W.; Ruhl, R.; Keijer, J.; Borel, P. Host-related factors explaining interindividual variability of carotenoid bioavailability and tissue concentrations in humans. Mol. Nutr. Food Res. 2017, 61, 1600685. [Google Scholar] [CrossRef] [PubMed]
- Kopp, T.I.; Andersen, V.; Tjonneland, A.; Vogel, U. Polymorphisms in nfkb1 and tlr4 and interaction with dietary and life style factors in relation to colorectal cancer in a danish prospective case-cohort study. PLoS ONE 2015, 10, e0116394. [Google Scholar] [CrossRef]
- Kopp, T.I.; Vogel, U.; Tjonneland, A.; Andersen, V. Meat and fiber intake and interaction with pattern recognition receptors (tlr1, tlr2, tlr4, and tlr10) in relation to colorectal cancer in a danish prospective, case-cohort study. Am. J. Clin. Nutr. 2018, 107, 465–479. [Google Scholar] [CrossRef]
- Andersen, V.; Holst, R.; Kopp, T.I.; Tjonneland, A.; Vogel, U. Interactions between diet, lifestyle and il10, il1b, and ptgs2/cox-2 gene polymorphisms in relation to risk of colorectal cancer in a prospective danish case-cohort study. PLoS ONE 2013, 8, e78366. [Google Scholar] [CrossRef]
- Vogel, L.K.; Saebo, M.; Hoyer, H.; Kopp, T.I.; Vogel, U.; Godiksen, S.; Frenzel, F.B.; Hamfjord, J.; Bowitz-Lothe, I.M.; Johnson, E.; et al. Intestinal ptgs2 mrna levels, ptgs2 gene polymorphisms, and colorectal carcinogenesis. PLoS ONE 2014, 9, e105254. [Google Scholar] [CrossRef]
- Vogel, U.; Christensen, J.; Dybdahl, M.; Friis, S.; Hansen, R.D.; Wallin, H.; Nexo, B.A.; Raaschou-Nielsen, O.; Andersen, P.S.; Overvad, K.; et al. Prospective study of interaction between alcohol, nsaid use and polymorphisms in genes involved in the inflammatory response in relation to risk of colorectal cancer. Mutat. Res. 2007, 624, 88–100. [Google Scholar] [CrossRef]
- Tjonneland, A.; Olsen, A.; Boll, K.; Stripp, C.; Christensen, J.; Engholm, G.; Overvad, K. Study design, exposure variables, and socioeconomic determinants of participation in diet, cancer and health: A population-based prospective cohort study of 57,053 men and women in denmark. Scand. J. Public Health. 2007, 35, 432–441. [Google Scholar] [CrossRef]
- Kopp, T.I.; Andersen, V.; Tjonneland, A.; Vogel, U. Polymorphisms in atp-binding cassette transporter genes and interaction with diet and life style factors in relation to colorectal cancer in a danish prospective case-cohort study. Scand. J. Gastroenterol. 2015, 50, 1469–1481. [Google Scholar] [CrossRef]
- Andersen, V.; Kopp, T.I.; Tjonneland, A.; Vogel, U. No association between hmox1 and risk of colorectal cancer and no interaction with diet and lifestyle factors in a prospective danish case-cohort study. Int. J. Mol. Sci. 2015, 16, 1375–1384. [Google Scholar] [CrossRef]
- Barlow, W.E.; Ichikawa, L.; Rosner, D.; Izumi, S. Analysis of case-cohort designs. J. Clin. Epidemiol. 1999, 52, 1165–1172. [Google Scholar] [CrossRef]
- Tjonneland, A.; Overvad, K.; Haraldsdottir, J.; Bang, S.; Ewertz, M.; Jensen, O.M. Validation of a semiquantitative food frequency questionnaire developed in denmark. Int. J. Epidemiol. 1991, 20, 906–912. [Google Scholar] [CrossRef]
- Nissen, S.B.; Tjonneland, A.; Stripp, C.; Olsen, A.; Christensen, J.; Overvad, K.; Dragsted, L.O.; Thomsen, B. Intake of vitamins a, c, and e from diet and supplements and breast cancer in postmenopausal women. Cancer Causes Control 2003, 14, 695–704. [Google Scholar] [CrossRef]
- Foodcalc 1.3, Computer Program 1998. Available online: http://www.Foodcalc.Dk (accessed on 23 May 2019).
- Prosky, L.; Asp, N.G.; Furda, I.; DeVries, J.W.; Schweizer, T.F.; Harland, B.F. Determination of total dietary fiber in foods and food products: Collaborative study. J. Assoc. Off Anal. Chem. 1985, 68, 677–679. [Google Scholar]
- Petersen, R.K.; Larsen, S.B.; Jensen, D.M.; Christensen, J.; Olsen, A.; Loft, S.; Nellemann, C.; Overvad, K.; Kristiansen, K.; Tjonneland, A.; et al. Ppargamma-pgc-1alpha activity is determinant of alcohol related breast cancer. Cancer Letters 2012, 315, 59–68. [Google Scholar] [CrossRef]
- Miller, S.A.; Dykes, D.D.; Polesky, H.F. A simple salting out procedure for extracting DNA from human nucleated cells. Nucleic Acids Res. 1988, 16, 1215. [Google Scholar] [CrossRef]
- Langholz, B.; Jiao, J. Computational methods for case–cohort studies. Comput. Stat. Data An. 2007, 51, 3737–3748. [Google Scholar] [CrossRef]
- Andersen, V.; Halekoh, U.; Tjonneland, A.; Vogel, U.; Kopp, T.I. Intake of red and processed meat, use of non-steroid anti-inflammatory drugs, genetic variants and risk of colorectal cancer: A prospective study of the danish “diet, cancer and health” cohort. Int. J. Mol. Sci. 2019, 20, 1121. [Google Scholar] [CrossRef]
- Andersen, V.; Egeberg, R.; Tjonneland, A.; Vogel, U. Interaction between interleukin-10 (il-10) polymorphisms and dietary fibre in relation to risk of colorectal cancer in a danish case-cohort study. BMC Cancer 2012, 12, 183. [Google Scholar] [CrossRef]
- Mondul, A.M.; Yu, K.; Wheeler, W.; Zhang, H.; Weinstein, S.J.; Major, J.M.; Cornelis, M.C.; Mannisto, S.; Hazra, A.; Hsing, A.W.; et al. Genome-wide association study of circulating retinol levels. Hum. Mol. Genet. 2011, 20, 4724–4731. [Google Scholar] [CrossRef]
- Chen, K.C.; Hsueh, W.T.; Ou, C.Y.; Huang, C.C.; Lee, W.T.; Fang, S.Y.; Tsai, S.T.; Huang, J.S.; Wong, T.Y.; Wu, J.L.; et al. Alcohol drinking obliterates the inverse association between serum retinol and risk of head and neck cancer. Medicine 2015, 94, e1064. [Google Scholar] [CrossRef]
- Hendrickson, S.J.; Hazra, A.; Chen, C.; Eliassen, A.H.; Kraft, P.; Rosner, B.A.; Willett, W.C. Beta-carotene 15,15’-monooxygenase 1 single nucleotide polymorphisms in relation to plasma carotenoid and retinol concentrations in women of european descent. Am. J. Clin. Nutr. 2012, 96, 1379–1389. [Google Scholar] [CrossRef]
- Ferrucci, L.; Perry, J.R.; Matteini, A.; Perola, M.; Tanaka, T.; Silander, K.; Rice, N.; Melzer, D.; Murray, A.; Cluett, C.; et al. Common variation in the beta-carotene 15,15’-monooxygenase 1 gene affects circulating levels of carotenoids: A genome-wide association study. Am. J. Hum. Genet. 2009, 84, 123–133. [Google Scholar] [CrossRef]
- Ovsyannikova, I.G.; Haralambieva, I.H.; Vierkant, R.A.; O’Byrne, M.M.; Jacobson, R.M.; Poland, G.A. Effects of vitamin a and d receptor gene polymorphisms/haplotypes on immune responses to measles vaccine. Pharm. Genom. 2012, 22, 20–31. [Google Scholar] [CrossRef]
- Borel, P.; Desmarchelier, C.; Nowicki, M.; Bott, R. A combination of single-nucleotide polymorphisms is associated with interindividual variability in dietary beta-carotene bioavailability in healthy men. J. Nutr. 2015, 145, 1740–1747. [Google Scholar] [CrossRef]
- Borel, P.; Desmarchelier, C.; Nowicki, M.; Bott, R. Lycopene bioavailability is associated with a combination of genetic variants. Free Radic. Biol. Med. 2015, 83, 238–244. [Google Scholar] [CrossRef]
- Formanack, M.L.; Baier, L.J. Variation in the fabp2 promoter affects gene expression: Implications for prior association studies. Diabetologia 2004, 47, 349–351. [Google Scholar]
- Desmarchalier, C.; Borel, P. Overview of carotenoid bioavailability determinants: From dietary factors to host genetic variations. Trends Food Sci. Technol. 2017, 69, 270–280. [Google Scholar] [CrossRef] [Green Version]
- Heine-Broring, R.C.; Winkels, R.M.; Renkema, J.M.; Kragt, L.; van Orten-Luiten, A.C.; Tigchelaar, E.F.; Chan, D.S.; Norat, T.; Kampman, E. Dietary supplement use and colorectal cancer risk: A systematic review and meta-analyses of prospective cohort studies. Int. J. Cancer 2015, 136, 2388–2401. [Google Scholar] [CrossRef]
- Andersen, V.; Egeberg, R.; Tjonneland, A.; Vogel, U. Abcc2 transporter gene polymorphisms, diet and risk of colorectal cancer: A danish prospective cohort study. Scand. J. Gastroenterol. Suppl. 2012, 47, 572–574. [Google Scholar] [CrossRef]


| Variable | Cases | Sub-Cohort | IRR (95% CI) 1 | ||
|---|---|---|---|---|---|
| n (%) | Median (5–95%) (Missing) | n (%) | Median (5–95%) (Missing) | ||
| Total | 1038 (100) | 1857 (100) | |||
| Sex | |||||
| Females | 462 (45) | 865 (47) | |||
| Males | 576 (55) | 992 (53) | |||
| Age at entry | 58 (51–65) | 56 (51–64) | |||
| BMI (kg/m2) | 26 (21–34) (3) | 26 (21–33) | 1.05 (1.01–1.10) 5 | ||
| Food intake | |||||
| Alcohol (g/day) 2 | 15 (1–71) | 14 (1–66) | 1.03 (0.98–1.07) 6 | ||
| Dietary fiber (g/day) | 20 (11–33) | 21 (11–34) | 0.83 (0.65–1.08) 7 | ||
| Red and processed meat (g/day) | 112 (46–233) | 109 (41–236) | 1.01 (0.97–1.06) 8 | ||
| Total energy (kJ/day) | 9681 (6115–14,712) (4) | 9633 (5922–14,820) | 1.00 (1.00–1.00) 9 | ||
| Fruits (g/day) | 166 (24–493) (4) | 176 (27–546) | 0.98 (0.95–1.02) 10 | ||
| Vegetables (g/day) | 153 (46–367) (4) | 163 (50–372) | 1.03 (0.98–1.09) 11 | ||
| Fruit and vegetables (g/day) | 331 (98-796) (4) | 350 (102–818) | 1.00 (0.97–1.02) 12 | ||
| Vitamin A intake | |||||
| Vitamin A (total) (RE/day) | 1980 (759–4332) (0) | 1992 (800–4398) (4) | 0.98 (0.90–1.06) 13 | ||
| Vitamin A (dietary) (RE/day) | 1684 (697–4189) (0) | 1693 (670–3966) (4) | 1.03 (0.94–1.13) | ||
| β-Carotene (total) (µg/day) | 2993 (707–12,424) (0) | 3177 (761–12,837) (4) | 0.99 (0.89–1.10) 14 | ||
| Retinol (total) (µg/day) | 1033 (285–2661) (0) | 966 (272–2550) (4) | 1.04 (0.91–1.18) 15 | ||
| Vitamin A (supplements) (%, n) | 455 (44) | 882 (48) [4] | 0.87 (0.74–1.03) | ||
| Vitamin A (supplements) 3 (RE/day) | 624 (72–1011) (0) | 640 (57–1500) (4) | |||
| Smoking status | |||||
| Never | 306 (29) | 621 (33) | 1.00 (ref.) | ||
| Past | 322 (31) | 536 (29) | 1.12 (0.91–1.38) | ||
| Current | 410 (39) | 699 (38) | 1.18 (0.97–1.44) | ||
| NSAID use 4 | |||||
| No | 716 (70) | 1275 (69) | 1.00 (ref.) | ||
| Yes | 313 (30) | 568 (31) | 0.99 (0.84–1.18) | ||
| HRT use among women | |||||
| Never | 279 (60) | 455 (53) | 1.00 (ref.) | ||
| Past | 62 (13) | 137 (16) | 0.65 (0.45–0.92) | ||
| Current | 121 (26) | 273 (32) | 0.70 (0.53–0.92) | ||
| Gene | Rs-Number | MAF | Function/Effect of Polymorphism | Feature | Reference |
|---|---|---|---|---|---|
| RA Transport | |||||
| near TTR | rs1667255 | 0.50 | The SNP has been associated with circulating retinol levels | Downstream of gene | [38,39] |
| FFAR4 | rs10882272 | 0.39 | - | 3′ UTR | [38,39] |
| Cleavage β-Carotene into RA | |||||
| near BCO1 | rs4889286 | 0.49 | Associates with plasma β-carotene | Upstream of gene | [40] |
| BCO1 | rs12934922 | 0.23 | - | Missense (Arg to Ser) | [40,41] |
| near BCO1 | rs6564851 | 0.48 | - | Upstream of gene | [40] |
| RA Receptor | |||||
| RARB | rs6800566 | 0.25 | Associated with immune response and/or cytokine levels after stimulation | Intron | [42] |
| RARB | rs13070407 | 0.20 | - | Intron | |
| Uptake of β-Carotene into Enterocytes | |||||
| ABCA1 | rs2791952 | 0.14 | Associated with β-carotene bioavailability | Intron | [43,44] |
| FABP2 | rs1799883 | 0.25 | Affect the promotor activity in in vitro promotor assay | Missense (Ala to Thr)) | [45] |
| Polymorphism | ncases (%) | nsub-cohort (%) | IRR (95% CI) 1 | IRR (95% CI) 2 | p-Value 3 |
|---|---|---|---|---|---|
| TTR rs1667255 | |||||
| AA | 360 (39) | 675 (39) | 1.00 (ref.) | 1.00 (ref.) | |
| CA | 426 (46) | 794 (46) | 0.99 (0.83–1.19) | 1.03 (0.86–1.23) | 0.76 |
| CC | 139 (15) | 270 (16) | 0.97 (0.76–1.24) | 0.99 (0.77–1.27) | 0.93 |
| CA + CC | 565 (61) | 1064 (61) | 0.99 (0.84–1.17) | 1.02 (0.86–1.21) | 0.84 |
| CC vs. AA + CA | 139 (15) | 270 (16) | 0.97 (0.78–1.22) | 0.97 (0.78–1.22) | 0.82 |
| FFAR4 rs10882272 | |||||
| TT | 395 (43) | 699 (40) | 1.00 (ref.) | 1.00 (ref.) | |
| TC | 414 (45) | 811 (47) | 0.92 (0.77–1.10) | 0.92 (0.77–1.10) | 0.35 |
| CC | 116 (13) | 232 (13) | 0.90 (0.69–1.16) | 0.93 (0.71–1.21) | 0.57 |
| TC + CC | 530 (57) | 1043 (60) | 0.91 (0.78–1.08) | 0.92 (0.78–1.09) | 0.33 |
| BCO1 rs4889286 | |||||
| TT | 250 (27) | 451 (26) | 1.00 (ref.) | 1.00 (ref.) | |
| TC | 451 (48) | 862 (49) | 0.95(0.78–1.15) | 0.96 (0.79–1.17) | 0.70 |
| CC | 237 (25) | 446 (25) | 0.97(0.77–1.21) | 0.99 (0.79–1.25) | 0.97 |
| TC + CC | 688 (73) | 1308 (74) | 0.96(0.80–1.15) | 0.97 (0.81–1.17) | 0.77 |
| BCO1 rs12934922 | |||||
| AA | 274 (30) | 541 (31) | 1.00 (ref.) | 1.00 (ref.) | |
| TA | 437 (47) | 837 (48) | 1.05 (0.87–1.27) | 1.05 (0.87–1.28) | 0.61 |
| TT | 211 (23) | 364 (21) | 1.18 (0.94–1.48) | 1.18 (0.93–1.48) | 0.18 |
| TA + TT | 648 (70) | 1201 (69) | 1.09 (0.91–1.30) | 1.09 (0.91–1.31) | 0.36 |
| BCO1 rs6564851 | |||||
| GG | 252 (27) | 467 (27) | 1.00 (ref.) | 1.00 (ref.) | |
| TG | 444 (48) | 854 (49) | 0.96 (0.79–1.17) | 0.98 (0.80–1.19) | 0.82 |
| TT | 230 (25) | 433 (25) | 1.00 (0.80–1.25) | 1.03 (0.82–1.30) | 0.80 |
| TG + TT | 674 (73) | 1287 (73) | 0.97 (0.81–1.17) | 0.99 (0.82–1.20) | 0.96 |
| TT vs. GG + TG | 230 (25) | 433 (25) | 1.02 (0.85–1.24) | 1.05 (0.86–1.27) | 0.65 |
| RARB rs6800566 | |||||
| GG | 397 (43) | 735 (42) | 1.00 (ref.) | 1.00 (ref.) | |
| GA | 421 (45) | 830 (47) | 0.93 (0.78–1.11) | 0.94 (0.79–1.12) | 0.51 |
| AA | 108 (12) | 199 (11) | 1.00 (0.76–1.31) | 0.98 (0.75–1.30) | 0.92 |
| GA + AA | 529 (57) | 1029 (58) | 0.94 (0.80–1.11) | 0.95 (0.80–1.12) | 0.56 |
| RARB rs13070407 | |||||
| TT | 536 (57) | 985 (56) | 1.00 (ref.) | 1.00 (ref.) | |
| TC | 344 (37) | 672 (38) | 0.96 (0.81–1.14) | 0.95 (0.80–1.14) | 0.61 |
| CC | 60 (6) | 110 (6) | 1.04 (0.74–1.46) | 1.06 (0.75–1.50) | 0.75 |
| TC + CC | 404 (43) | 782 (44) | 0.97 (0.83–1.15) | 0.97 (0.82–1.14) | 0.71 |
| CC vs. TT + TC | 60 (6) | 110 (6) | 1.05 (0.75–1.47) | 1.08 (0.77–1.51) | 0.66 |
| ABCA1 rs2791952 | |||||
| CC | 720 (77) | 1389 (79) | 1.00 (ref.) | 1.00 (ref.) | |
| TC | 211 (22) | 341 (19) | 1.17 (0.96–1.43) | 1.15 (0.93–1.40) | 0.19 |
| TT | 7 (1) | 27 (2) | 0.48 (0.21–1.10) | 0.51 (0.22–1.19) | 0.13 |
| TC + TT | 218 (23) | 368 (21) | 1.12 (0.92–1.36) | 1.10 (0.90–1.35) | 0.34 |
| FABP2 rs1799883 | |||||
| GG | 505 (55) | 908 (52) | 1.00 (ref.) | 1.00 (ref.) | |
| GA | 356 (39) | 706 (41) | 0.89 (0.75–1.05) | 0.89 (0.74–1.06) | 0.18 |
| AA | 62 (7) | 125 (7) | 0.89 (0.64–1.24) | 0.88 (0.63–1.23) | 0.45 |
| GA + AA | 418 (45) | 831 (48) | 0.89 (0.75–1.04) | 0.88 (0.75–1.05) | 0.16 |
| Vitamin A | β-Carotene | Retinol | ||||
|---|---|---|---|---|---|---|
| IRR (95% CI) 1 | p-Value | IRR (95% CI) 1 | p-Value | IRR (95% CI) 1 | p-Value | |
| TTR rs1667255 | ||||||
| AA | 0.98 (0.88–1.09) | 0.61 | 1.02 (0.89–1.17) | 0.92 | 0.99 (0.83–1.19) | 0.32 |
| CA + CC | 1.01 (0.91–1.13) | 1.03 (0.91–1.17) | 1.11 (0.94–1.32) | |||
| FFAR4 rs10882272 | ||||||
| TT | 1.05 (0.94–1.17) | 0.25 | 1.05 (0.93–1.20) | 0.45 | 1.16 (0.97–1.38) | 0.21 |
| TC + CC | 0.97 (0.87–1.07) | 1.00 (0.88–1.13) | 1.01 (0.85–1.19) | |||
| BCO1 rs4889286 | ||||||
| TT | 1.07 (0.91–1.26) | 0.33 | 1.20 (0.97–1.49) | 0.08 | 1.04 (0.83–1.31) | 0.85 |
| TC + CC | 0.98 (0.90–1.08) | 1.00 (0.90–1.12) | 1.07 (0.92–1.24) | |||
| BCO1 rs12934922 | ||||||
| AA | 1.00 (0.86–1.15) | 0.92 | 0.94 (0.79–1.13) | 0.20 | 1.16 (0.96–1.40) | 0.21 |
| TA + TT | 1.00 (0.91–1.10) | 1.06 (0.94–1.20) | 1.00 (0.85–1.18) | |||
| BCO1 rs6564851 | ||||||
| GG | 1.06 (0.90–1.25) | 0.37 | 1.21 (0.98–1.50) | 0.09 | 1.02 (0.81–1.28) | 0.77 |
| TG + TT | 0.98 (0.90–1.08) | 1.02 (0.91–1.14) | 1.06 (0.91–1.23) | |||
| RARB rs6800566 | ||||||
| GG | 0.98 (0.88–1.10) | 0.53 | 0.97 (0.85–1.12) | 0.23 | 1.10 (0.92–1.31) | 0.61 |
| GA + AA | 1.03 (0.92–1.14) | 1.06 (0.94–1.20) | 1.04 (0.88–1.22) | |||
| RARB rs13070407 | ||||||
| TT | 1.02 (0.92–1.13) | 0.46 | 1.08 (0.96–1.22) | 0.05 | 1.01 (0.86–1.19) | 0.35 |
| TC + CC | 0.97 (0.86–1.09) | 0.92 (0.79–1.08) | 1.13 (0.93–1.36) | |||
| ABCA1 rs2791952 | ||||||
| CC | 0.98 (0.90–1.08) | 0.43 | 0.99 (0.88–1.12) | 0.52 | 1.09 (0.95–1.27) | 0.47 |
| TC + TT | 1.05 (0.90–1.22) | 1.04 (0.91–1.21) | 1.00 (0.80–1.25) | |||
| FABP2 rs1799883 | ||||||
| GG | 1.00 (0.89–1.11) | 0.73 | 1.04 (0.92–1.18) | 0.67 | 1.09 (0.93–1.29) | 0.35 |
| GA + AA | 0.97 (0.87–1.09) | 1.01 (0.87–1.16) | 0.98 (0.82–1.18) | |||
| 1. Tertile | 2. Tertile | 3. Tertile | 1. Tertile | 2. Tertile | 3. Tertile | p | 1. Tertile | 2. Tertile | 3. Tertile | 1. Tertile | 2. Tertile | 3. Tertile | p | |
|---|---|---|---|---|---|---|---|---|---|---|---|---|---|---|
| Nc/Ns | Nc/Ns | Nc/Ns | IRR (95% CI) | IRR (95% CI) | IRR (95% CI) | Nc/Ns | Nc/Ns | Nc/Ns | IRR (95% CI) | IRR (95% CI) | IRR (95% CI) | |||
| TTR rs1667255 | Vitamin A | Retinol | ||||||||||||
| AA | 119/216 | 126/228 | 105/219 | 1.00 | 1.02 (0.66–1.57) | 0.93 (0.58–1.49) | 110/221 | 127/237 | 113/205 | 1.00 | 1.02 (0.66–1.58) | 1.02 (0.63–1.63) | ||
| CA + CC | 185/335 | 178/340 | 190/359 | 1.03 (0.70–1.53) | 0.99 (0.67–1.48) | 1.04 (0.68–1.59) | 0.83 | 162/355 | 178/320 | 213/359 | 0.93 (0.62–1.38) | 1.08 (0.72–1.62) | 1.14 (0.74–1.76) | 0.66 |
| β-carotene | ||||||||||||||
| AA | 131/199 | 118/229 | 101/235 | 1.00 | 0.90 (0.57–1.42) | 0.77 (0.46–1.29) | ||||||||
| CA + CC | 196/327 | 196/348 | 161/359 | 0.95 (0.65–1.40) | 0.98 (0.65–1.49) | 0.83 (0.51–1.36) | 0.79 | |||||||
| FFAR4 rs10882272 | Vitamin A | Retinol | ||||||||||||
| TT | 129/236 | 134/230 | 125/213 | 1.00 | 1.16 (0.76–1.76) | 1.19 (0.76–1.87) | 118/231 | 128/244 | 142/204 | 1.00 | 0.97 (0.64–1.49) | 1.31 (0.83–2.06) | ||
| TC + CC | 172/317 | 168/341 | 174/363 | 1.07 (0.73–1.58) | 0.95 (0.64–1.41) | 0.98 (0.65–1.48) | 0.36 | 154/344 | 175/314 | 185/363 | 0.90 (0.60–1.34) | 1.07 (0.71–1.59) | 0.97 (0.63–1.48) | 0.18 |
| β-carotene | ||||||||||||||
| TT | 139/217 | 140/238 | 109/224 | 1.00 | 1.09 (0.71–1.68) | 0.90 (0.54–1.50) | ||||||||
| TC + CC | 187/311 | 172/340 | 155/370 | 0.99 (0.68–1.45) | 0.90 (0.59–1.36) | 0.79 (0.49–1.28) | 0.67 | |||||||
| BCO1 rs4889286 | Vitamin A | Retinol | ||||||||||||
| TT | 78/162 | 79/140 | 83/142 | 1.00 | 1.12 (0.66–1.89) | 1.22 (0.71–2.09) | 69/145 | 91/163 | 80/136 | 1.00 | 1.06 (0.63–1.78) | 1.10 (0.62–1.95) | ||
| TC + CC | 230/397 | 227/437 | 217/439 | 1.18 (0.77–1.80) | 1.09 (0.71–1.68) | 1.08 (0.68–1.70) | 0.48 | 206/438 | 217/399 | 251/436 | 0.98 (0.62–1.53) | 1.08 (0.69–1.70) | 1.12 (0.70–1.79) | 0.98 |
| β-carotene | ||||||||||||||
| TT | 77/151 | 87/145 | 76/148 | 1.00 | 1.27 (0.75–2.16) | 1.14 (0.63–2.04) | ||||||||
| TC + CC | 253/380 | 233/440 | 188/453 | 1.31 (0.86–2.01) | 1.16 (0.73–1.82) | 0.93 (0.55–1.57) | 0.12 | |||||||
| BCO1 rs12934922 | Vitamin A | Retinol | ||||||||||||
| AA | 89/178 | 98/155 | 85/192 | 1.00 | 1.23 (0.75–2.01) | 0.96 (0.58–1.59) | 73/181 | 91/187 | 108/157 | 1.00 | 1.09 (0.65–1.81) | 1.61 (0.95–2.75) | ||
| TA + TT | 214/376 | 203/414 | 212/387 | 1.18 (0.78–1.79) | 1.04 (0.69–1.58) | 1.16 (0.74–1.79) | 0.23 | 200/395 | 209/371 | 220/411 | 1.27 (0.82–1.96) | 1.38 (0.88–2.17) | 1.25 (0.78–2.00) | 0.05 |
| β-carotene | ||||||||||||||
| AA | 94/154 | 103/170 | 75/201 | 1.00 | 1.09 (0.66–1.80) | 0.70 (0.39–1.24) | ||||||||
| TA + TT | 230/374 | 212/409 | 187/394 | 1.05 (0.69–1.59) | 0.98 (0.63–1.53) | 0.91 (0.55–1.51) | 0.27 | |||||||
| BCO1 rs6564851 | Vitamin A | Retinol | ||||||||||||
| GG | 79/168 | 81/145 | 82/146 | 1.00 | 1.11 (0.66–1.87) | 1.20 (0.70–2.05) | 73/153 | 91/166 | 78/140 | 1.00 | 1.06 (0.63–1.77) | 1.08 (0.61–1.90) | ||
| TG + TT | 224/388 | 222/431 | 215/434 | 1.19 (0.78–1.82) | 1.11 (0.72–1.69) | 1.09 (0.69–1.72) | 0.53 | 199/426 | 215/392 | 247/435 | 0.98 (0.63–1.52) | 1.11 (0.71–1.73) | 1.13 (0.71–1.80) | 0.95 |
| β-carotene | ||||||||||||||
| GG | 78/155 | 85/151 | 79/153 | 1.00 | 1.23 (0.72–2.09) | 1.14 (0.64–2.05) | ||||||||
| TG + TT | 248/379 | 225/432 | 188/442 | 1.30 (0.85–1.99) | 1.15 (0.73–1.82) | 0.98 (0.58–1.66) | 0.19 | |||||||
| RARB rs6800566 | Vitamin A | Retinol | ||||||||||||
| GG | 132/239 | 133/246 | 123/232 | 1.00 | 0.98 (0.65–1.48) | 1.04 (0.66–1.63) | 119/250 | 138/239 | 131/228 | 1.00 | 1.19 (0.78–1.82) | 1.14 (0.73–1.80) | ||
| GA + AA | 171/325 | 170/330 | 176/350 | 0.95 (0.65–1.40) | 0.96 (0.65–1.43) | 0.96 (0.64–1.45) | 0.96 | 155/334 | 165/326 | 197/345 | 1.00 (0.67–1.49) | 1.01 (0.68–1.51) | 1.16 (0.76–1.77) | 0.63 |
| β-carotene | ||||||||||||||
| GG | 142/229 | 142/241 | 104/247 | 1.00 | 1.08 (0.70–1.67) | 0.81 (0.48–1.36) | ||||||||
| GA + AA | 185/305 | 171/346 | 161/354 | 0.99 (0.68–1.46) | 0.91 (0.60–1.36) | 0.87 (0.54–1.38) | 0.51 | |||||||
| RARB rs13070407 | Vitamin A | Retinol | ||||||||||||
| TT | 168/305 | 179/313 | 177/348 | 1.00 | 1.10 (0.76–1.60) | 1.01 (0.68–1.49) | 161/315 | 166/323 | 197/328 | 1.00 | 0.97 (0.67–1.41) | 1.12 (0.74–1.67) | ||
| TC + CC | 141/257 | 129/264 | 122/239 | 1.08 (0.74–1.59) | 0.92 (0.62–1.37) | 1.02 (0.66–1.58) | 0.46 | 115/270 | 144/243 | 133/247 | 0.87 (0.58–1.30) | 1.11 (0.75–1.65) | 1.01 (0.66–1.54) | 0.38 |
| β-carotene | ||||||||||||||
| TT | 184/287 | 167/332 | 173/347 | 1.00 | 0.90 (0.60–1.33) | 0.93 (0.59–1.48) | ||||||||
| TC + CC | 147/247 | 152/255 | 93/258 | 0.99 (0.68–1.45) | 1.08 (0.72–1.62) | 0.67 (0.40–1.13) | 0.06 | |||||||
| ABCA1 rs2791952 | Vitamin A | Retinol | ||||||||||||
| CC | 237/435 | 237/452 | 227/467 | 1.00 | 0.99 (0.72–1.36) | 0.97 (0.68–1.37) | 207/456 | 242/444 | 252/454 | 1.00 | 1.18 (0.85–1.63) | 1.19 (0.84–1.70) | ||
| TC + TT | 69/124 | 71/124 | 74/113 | 1.03 (0.64–1.64) | 1.06 (0.66–1.68) | 1.18 (0.72–1.95) | 0.78 | 68/126 | 67/118 | 79/117 | 1.28 (0.81–2.04) | 1.13 (0.69–1.84) | 1.33 (0.81–2.21) | 0.52 |
| β-carotene | ||||||||||||||
| CC | 251/421 | 250/446 | 200/487 | 1.00 | 1.03 (0.74–1.46) | 0.79 (0.52–1.20) | ||||||||
| TC + TT | 78/114 | 69/131 | 67/116 | 1.06 (0.67–1.68) | 0.96 (0.60–1.55) | 1.11 (0.64–1.93) | 0.24 | |||||||
| FABP2 rs1799883 | Vitamin A | Retinol | ||||||||||||
| GG | 159/284 | 167/312 | 165/296 | 1.00 | 0.94 (0.65–1.37) | 1.03 (0.69–1.55) | 154/300 | 154/287 | 183/305 | 1.00 | 0.97 (0.66–1.43) | 1.10 (0.73–1.65) | ||
| GA + AA | 146/266 | 133/257 | 128/284 | 0.93 (0.63–1.37) | 0.92 (0.62–1.38) | 0.82 (0.53–1.25) | 0.57 | 118/267 | 147/273 | 142/267 | 0.85 (0.57–1.27) | 0.98 (0.66–1.45) | 0.94 (0.61–1.45) | 0.68 |
| β-carotene | ||||||||||||||
| GG | 183/300 | 161/288 | 147/304 | 1.00 | 1.04 (0.70–1.53) | 0.91 (0.57–1.45) | ||||||||
| GA + AA | 144/229 | 148/287 | 115/291 | 1.01 (0.69–1.49) | 0.90 (0.60–1.35) | 0.74 (0.46–1.20) | 0.58 | |||||||
© 2019 by the authors. Licensee MDPI, Basel, Switzerland. This article is an open access article distributed under the terms and conditions of the Creative Commons Attribution (CC BY) license (http://creativecommons.org/licenses/by/4.0/).
Share and Cite
Andersen, V.; Halekoh, U.; Bohn, T.; Tjønneland, A.; Vogel, U.; Kopp, T.I. No Interaction between Polymorphisms Related to Vitamin A Metabolism and Vitamin A Intake in Relation to Colorectal Cancer in a Prospective Danish Cohort. Nutrients 2019, 11, 1428. https://0-doi-org.brum.beds.ac.uk/10.3390/nu11061428
Andersen V, Halekoh U, Bohn T, Tjønneland A, Vogel U, Kopp TI. No Interaction between Polymorphisms Related to Vitamin A Metabolism and Vitamin A Intake in Relation to Colorectal Cancer in a Prospective Danish Cohort. Nutrients. 2019; 11(6):1428. https://0-doi-org.brum.beds.ac.uk/10.3390/nu11061428
Chicago/Turabian StyleAndersen, Vibeke, Ulrich Halekoh, Torsten Bohn, Anne Tjønneland, Ulla Vogel, and Tine Iskov Kopp. 2019. "No Interaction between Polymorphisms Related to Vitamin A Metabolism and Vitamin A Intake in Relation to Colorectal Cancer in a Prospective Danish Cohort" Nutrients 11, no. 6: 1428. https://0-doi-org.brum.beds.ac.uk/10.3390/nu11061428