Maternal Characteristics Affect Fetal Growth Response in the Women First Preconception Nutrition Trial

 , , ,
, , ,
Abstract
:1. Introduction
2. Materials and Methods
2.1. Study Design
2.2. Ethical Approval
2.3. Statistical Analyses
3. Results
4. Discussion
5. Conclusions
Supplementary Materials
Author Contributions
Funding
Acknowledgments
Conflicts of Interest
References
- Dimasuay, K.G.; Boeuf, P.; Powell, T.L.; Jansson, T. Placental responses to changes in the maternal environment determine fetal growth. Front. Physiol. 2016, 7, 12. [Google Scholar] [CrossRef]
- Baptiste-Roberts, K.; Salafia, C.M.; Nicholson, W.K.; Duggan, A.; Wang, N.Y.; Brancati, F.L. Gross placental measures and childhood growth. J. Matern. Fetal Neonatal Med. 2009, 22, 13–23. [Google Scholar] [CrossRef] [PubMed] [Green Version]
- Wu, G.; Bazer, F.W.; Cudd, T.A.; Meininger, C.J.; Spencer, T.E. Maternal nutrition and fetal development. J. Nutr. 2004, 134, 2169–2172. [Google Scholar] [CrossRef] [PubMed]
- Lander, R.L.; Hambidge, K.M.; Westcott, J.E.; Tejeda, G.; Diba, T.S.; Mastiholi, S.C.; Khan, U.S.; Garces, A.; Figueroa, L.; Tshefu, A.; et al. Pregnant Women in Four Low-Middle Income Countries Have a High Prevalence of Inadequate Dietary Intakes That Are Improved by Dietary Diversity. Nutrients 2019, 11, 1560. [Google Scholar] [CrossRef]
- Hambidge, K.M.; Krebs, N.F.; Garces, A.; Westcott, J.E.; Figueroa, L.; Goudar, S.S.; Dhaded, S.; Pasha, O.; Aziz Ali, S.; Tshefu, A.; et al. Anthropometric indices for non-pregnant women of childbearing age differ widely among four low-middle income populations. BMC Public Health 2017, 18, 45. [Google Scholar] [CrossRef] [PubMed]
- Fall, C.H. The fetal and early life origins of adult disease. Indian Pediatr. 2003, 40, 480–502. [Google Scholar]
- Kozuki, N.; Katz, J.; Lee, A.C.; Vogel, J.P.; Silveira, M.F.; Sania, A.; Stevens, G.A.; Cousens, S.; Caulfield, L.E.; Christian, P.; et al. Short maternal stature increases risk of small-for-gestational-age and preterm births in low—and middle-income countries: Individual participant data meta-analysis and population attributable fraction. J. Nutr. 2015, 145, 2542–2550. [Google Scholar] [CrossRef]
- Black, R.E.; Allen, L.H.; Bhutta, Z.A.; Caulfield, L.E.; de Onis, M.; Ezzati, M.; Mathers, C.; Rivera, J. Maternal and child undernutrition: Global and regional exposures and health consequences. Lancet 2008, 371, 243–260. [Google Scholar] [CrossRef]
- Subramanian, S.V.; Ackerson, L.K.; Davey Smith, G.; John, N.A. Association of maternal height with child mortality, anthropometric failure, and anemia in India. JAMA 2009, 301, 1691–1701. [Google Scholar] [CrossRef]
- Ozaltin, E.; Hill, K.; Subramanian, S.V. Association of maternal stature with offspring mortality, underweight, and stunting in low—to middle-income countries. JAMA 2010, 303, 1507–1516. [Google Scholar] [CrossRef]
- Martorell, R.; Zongrone, A. Intergenerational influences on child growth and undernutrition. Paediatr. Perinat. Epidemiol. 2012, 26 (Suppl. 1), 302–314. [Google Scholar] [CrossRef] [PubMed]
- Rahman, M.M.; Abe, S.K.; Rahman, M.S.; Kanda, M.; Narita, S.; Bilano, V.; Ota, E.; Gilmour, S.; Shibuya, K. Maternal anemia and risk of adverse birth and health outcomes in low—and middle-income countries: Systematic review and meta-analysis. Am. J. Clin. Nutr. 2016, 103, 495–504. [Google Scholar] [CrossRef] [PubMed]
- Kozuki, N.; Lee, A.C.; Silveira, M.F.; Sania, A.; Vogel, J.P.; Adair, L.; Barros, F.; Caulfield, L.E.; Christian, P.; Fawzi, W.; et al. The associations of parity and maternal age with small-for-gestational-age, preterm, and neonatal and infant mortality: A meta-analysis. BMC Public Health 2013, 13 (Suppl. 3), S2. [Google Scholar] [CrossRef] [PubMed]
- Griffiths, P.L.; Balakrishna, N.; Fernandez Rao, S.; Johnson, W. Do socio-economic inequalities in infant growth in rural India operate through maternal size and birth weight? Ann. Hum. Biol. 2016, 43, 154–163. [Google Scholar] [CrossRef] [Green Version]
- Kabir, A.; Rahman, M.J.; Shamim, A.A.; Klemm, R.D.W.; Labrique, A.B.; Rashid, M.; Christian, P.; West, K.P., Jr. Identifying maternal and infant factors associated with newborn size in rural Bangladesh by partial least squares (PLS) regression analysis. PLoS ONE 2017, 12, e0189677. [Google Scholar] [CrossRef]
- Ronsmans, C.; Fisher, D.J.; Osmond, C.; Margetts, B.M.; Fall, C.H. Multiple micronutrient supplementation during pregnancy in low-income countries: A meta-analysis of effects on stillbirths and on early and late neonatal mortality. Food Nutr. Bull. 2009, 30, S547–S555. [Google Scholar] [CrossRef]
- Smith, E.R.; Shankar, A.H.; Wu, L.S.; Aboud, S.; Adu-Afarwuah, S.; Ali, H.; Agustina, R.; Arifeen, S.; Ashorn, P.; Bhutta, Z.A.; et al. Modifiers of the effect of maternal multiple micronutrient supplementation on stillbirth, birth outcomes, and infant mortality: A meta-analysis of individual patient data from 17 randomised trials in low-income and middle-income countries. Lancet Glob. Health 2017, 5, e1090–e1100. [Google Scholar] [CrossRef]
- Potdar, R.D.; Sahariah, S.A.; Gandhi, M.; Kehoe, S.H.; Brown, N.; Sane, H.; Dayama, M.; Jha, S.; Lawande, A.; Coakley, P.J.; et al. Improving women’s diet quality preconceptionally and during gestation: Effects on birth weight and prevalence of low birth weight—A randomized controlled efficacy trial in India (Mumbai Maternal Nutrition Project). Am. J. Clin. Nutr. 2014, 100, 1257–1268. [Google Scholar] [CrossRef]
- Imdad, A.; Bhutta, Z.A. Maternal nutrition and birth outcomes: Effect of balanced protein-energy supplementation. Paediatr. Perinat. Epidemiol. 2012, 26 (Suppl. 1), 178–190. [Google Scholar] [CrossRef]
- Stevens, B.; Buettner, P.; Watt, K.; Clough, A.; Brimblecombe, J.; Judd, J. The effect of balanced protein energy supplementation in undernourished pregnant women and child physical growth in low—and middle-income countries: A systematic review and meta-analysis. Matern. Child Nutr. 2015, 11, 415–432. [Google Scholar] [CrossRef]
- Ashorn, P.; Hallamaa, L.; Allen, L.H.; Ashorn, U.; Chandrasiri, U.; Deitchler, M.; Doyle, R.; Harjunmaa, U.; Jorgensen, J.M.; Kamiza, S.; et al. Co-causation of reduced newborn size by maternal undernutrition, infections, and inflammation. Matern. Child Nutr. 2018, 14, e12585. [Google Scholar] [CrossRef] [PubMed]
- Ashorn, P.; Alho, L.; Ashorn, U.; Cheung, Y.B.; Dewey, K.G.; Harjunmaa, U.; Lartey, A.; Nkhoma, M.; Phiri, N.; Phuka, J.; et al. The impact of lipid-based nutrient supplement provision to pregnant women on newborn size in rural Malawi: A randomized controlled trial. Am. J. Clin. Nutr. 2015, 101, 387–397. [Google Scholar] [CrossRef] [PubMed]
- Mridha, M.K.; Matias, S.L.; Chaparro, C.M.; Paul, R.R.; Hussain, S.; Vosti, S.A.; Harding, K.L.; Cummins, J.R.; Day, L.T.; Saha, S.L.; et al. Lipid-based nutrient supplements for pregnant women reduce newborn stunting in a cluster-randomized controlled effectiveness trial in Bangladesh. Am. J. Clin. Nutr. 2016, 103, 236–249. [Google Scholar] [CrossRef] [PubMed]
- Huybregts, L.; Roberfroid, D.; Lanou, H.; Menten, J.; Meda, N.; Van Camp, J.; Kolsteren, P. Prenatal food supplementation fortified with multiple micronutrients increases birth length: A randomized controlled trial in rural Burkina Faso. Am. J. Clin. Nutr. 2009, 90, 1593–1600. [Google Scholar] [CrossRef] [PubMed]
- Adu-Afarwuah, S.; Lartey, A.; Okronipa, H.; Ashorn, P.; Zeilani, M.; Peerson, J.M.; Arimond, M.; Vosti, S.; Dewey, K.G. Lipid-based nutrient supplement increases the birth size of infants of primiparous women in Ghana. Am. J. Clin. Nutr. 2015, 101, 835–846. [Google Scholar] [CrossRef] [PubMed]
- Hambidge, K.M.; Westcott, J.E.; Garces, A.; Figueroa, L.; Goudar, S.S.; Dhaded, S.M.; Pasha, O.; Ali, S.A.; Tshefu, A.; Lokangaka, A.; et al. A multicountry randomized controlled trial of comprehensive maternal nutrition supplementation initiated before conception: The Women First trial. Am. J. Clin. Nutr. 2019, 109, 457–469. [Google Scholar] [CrossRef]
- Ali, S.A.; Hambidge, K.M.; Pasha, O.; Khan, A.; Krebs, N.F. The Women First Preconception Nutrition Trial Group. Women First Preconception Nutrition Trial (WF): Effects of maternal nutrition supplements commencing before conception or in early gestation on newborn size in rural Pakistan. Curr. Dev. Nutr. 2018, 2, 24–25. [Google Scholar]
- Dhaded, S.M.; Hambidge, K.M.; Ali, S.A.; Somannavar, M.S.; Saleem, S.; Pasha, O.; Khan, U.; Herekar, V.; Vernekar, S.; Kumar, Y.; et al. Preconception nutrition intervention improved birth length and reduced stunting and wasting in newborns in South Asia: The Women First Randomized Controlled Trial. PLoS ONE 2019, in press. [Google Scholar]
- Dhaded, S.; Hambidge, K.M.; Krebs, N.F. The Women First Preconception Nutrition Trial Group. Women First Preconception Nutrition Trial (WF): Newborn anthropometric outcomes in N Karnataka, India after a maternal nutrition intervention. Curr. Dev. Nutr. 2018, 2, 30–31. [Google Scholar]
- Arriaza, A.; Hambidge, M.; Krebs, N.; Channon, A.; Garces, A. Guatemalan women mean height, a century behind. In Proceedings of the Society for Latin America Nutrition (SLAN) XVIII, Guadalajara, Mexico, 11–15 November 2018; Available online: https://www.slaninternacional.org/congreso2018/ (accessed on 17 October 2019).
- Hambidge, K.M.; Krebs, N.F.; Westcott, J.E.; Garces, A.; Goudar, S.S.; Kodkany, B.S.; Pasha, O.; Tshefu, A.; Bose, C.L.; Figueroa, L.; et al. Preconception maternal nutrition: A multi-site randomized controlled trial. BMC Pregnancy Childbirth 2014, 14, 111. [Google Scholar] [CrossRef]
- Villar, J.; Cheikh Ismail, L.; Victora, C.G.; Ohuma, E.O.; Bertino, E.; Altman, D.G.; Lambert, A.; Papageorghiou, A.T.; Carvalho, M.; Jaffer, Y.A.; et al. International standards for newborn weight, length, and head circumference by gestational age and sex: The Newborn Cross-Sectional Study of the INTERGROWTH-21st Project. Lancet 2014, 384, 857–868. [Google Scholar] [CrossRef]
- Papageorghiou, A.T.; Ohuma, E.O.; Altman, D.G.; Todros, T.; Cheikh Ismail, L.; Lambert, A.; Jaffer, Y.A.; Bertino, E.; Gravett, M.G.; Purwar, M.; et al. International standards for fetal growth based on serial ultrasound measurements: The Fetal Growth Longitudinal Study of the INTERGROWTH-21st Project. Lancet 2014, 384, 869–879. [Google Scholar] [CrossRef]
- Adu-Afarwuah, S.; Lartey, A.; Okronipa, H.; Ashorn, P.; Zeilani, M.; Baldiviez, L.M.; Oaks, B.M.; Vosti, S.; Dewey, K.G. Impact of small-quantity lipid-based nutrient supplement on hemoglobin, iron status and biomarkers of inflammation in pregnant Ghanaian women. Matern. Child Nutr. 2017, 13. [Google Scholar] [CrossRef]
- Gough, E.K.; Moodie, E.E.; Prendergast, A.J.; Ntozini, R.; Moulton, L.H.; Humphrey, J.H.; Manges, A.R. Linear growth trajectories in Zimbabwean infants. Am. J. Clin. Nutr. 2016, 104, 1616–1627. [Google Scholar] [CrossRef] [PubMed] [Green Version]
- Christian, P.; Lee, S.E.; Donahue Angel, M.; Adair, L.S.; Arifeen, S.E.; Ashorn, P.; Barros, F.C.; Fall, C.H.; Fawzi, W.W.; Hao, W.; et al. Risk of childhood undernutrition related to small-for-gestational age and preterm birth in low- and middle-income countries. Int. J. Epidemiol. 2013, 42, 1340–1355. [Google Scholar] [CrossRef] [PubMed]
- Victora, C.G.; de Onis, M.; Hallal, P.C.; Blossner, M.; Shrimpton, R. Worldwide timing of growth faltering: Revisiting implications for interventions. Pediatrics 2010, 125, e473–e480. [Google Scholar] [CrossRef] [PubMed]
- Prendergast, A.J.; Humphrey, J.H. The stunting syndrome in developing countries. Paediatr. Int. Child Health 2014, 34, 250–265. [Google Scholar] [CrossRef] [Green Version]
- Fox, E.L.; Davis, C.; Downs, S.M.; Schultink, W.; Fanzo, J. Who is the woman in women’s nutrition? A narrative review of evidence and actions to support women’s nutrition throughout life. Curr. Dev. Nutr. 2019, 3, nzy076. [Google Scholar] [CrossRef]
- Ramakrishnan, U.; Grant, F.; Goldenberg, T.; Zongrone, A.; Martorell, R. Effect of women’s nutrition before and during early pregnancy on maternal and infant outcomes: A systematic review. Paediatr. Perinat. Epidemiol. 2012, 26 (Suppl. 1), 285–301. [Google Scholar] [CrossRef]


| Characteristic | All (n = 1465) | Guatemala (n = 493) | India (n = 515) | Pakistan (n = 457) |
|---|---|---|---|---|
| Maternal age, years | 23.2 ± 4.1 1 | 24.2 ± 4.4 | 22.0 ± 3.4 | 23.6 ± 4.1 |
| 20 | 296 (20) 2 | 75 (15) | 131 (25) | 90 (20) |
| 20+ | 1169 (80) | 418 (85) | 384 (75) | 367 (80) |
| Maternal stature, cm | 149.6 ± 6.5 | 145.5 ± 4.8 | 151.2 ± 5.8 | 152.1 ± 6.6 |
| Stunted 3 | 737 (50) | 405 (82) | 200 (39) | 132 (29) |
| Not stunted | 727 (50) | 87 (18) | 315 (61) | 325 (71) |
| Maternal weight, kg | 48.3 ± 9.3 | 53.7 ± 9.7 | 45.7 ± 8.0 | 45.5 ± 7.4 |
| Maternal body mass index (BMI) | 21.7 ± 4.4 | 25.3 ± 4.2 | 19.9 ± 3.2 | 19.7 ± 3.0 |
| Low BMI 4 | 368 (25) | 4 (1) | 196 (38) | 168 (37) |
| Normal/high BMI | 1096 (75) | 488 (99) | 319 (62) | 289 (63) |
| Parity | ||||
| =0 | 304 (21) | 31 (6) | 132 (26) | 141 (31) |
| ≥1 | 1161 (79) | 462 (94) | 383 (74) | 316 (69) |
| Baseline hemoglobin (Hb) | ||||
| Anemia (Hb <12 g/dL) | 855 (59) | 59 (12) | 470 (91) | 326 (72) |
| No anemia (Hb ≥12 g/dL) | 595 (41) | 422 (88) | 44 (9) | 129 (28) |
| Household SES 5 | ||||
| Low SES | 315 (22) | 52 (11) | 49 (10) | 214 (47) |
| Average/high SES | 1150 (79) | 441 (89) | 466 (90) | 243 (53) |
| Maternal education | ||||
| No formal education | 461 (31) | 35 (7) | 40 (8) | 386 (84) |
| Formal education | 1004 (69) | 458 (93) | 475 (92) | 71 (16) |
| Newborn sex | ||||
| Male | 723 (49) | 249 (51) | 263 (51) | 211 (46) |
| Female | 742 (51) | 244 (49) | 252 (49) | 246 (54) |
| Characteristic | All (n = 1465) | Parity = 0 (n = 304) | Parity ≥1 (n = 1161) | p-Value | Anemia (n = 855) | No Anemia (n = 595) | p-Value |
|---|---|---|---|---|---|---|---|
| Maternal age, years | 23.2 ± 4.1 1 | 20.2 ± 3.2 | 24.0 ± 3.9 | <0.001 | 22.7 ± 3.9 | 23.9 ± 4.3 | < 0.001 |
| <20 | 296 (20) 2 | 153 (50) | 143 (12) | <0.001 | 195 (23) | 99 (17) | 0.004 |
| 20+ | 1169 (80) | 151 (50) | 1018 (88) | 660 (77) | 496 (83) | ||
| Maternal stature, cm | 149.6 ± 6.5 | 150.8 ± 6.2 | 149.3 ± 6.5 | <0.001 | 151.1 ± 6.3 | 147.5 ± 6.2 | < 0.001 |
| Stunted 3 | 737 (50) | 120 (39) | 617 (53) | <0.001 | 332 (39) | 394 (66) | < 0.001 |
| Not stunted | 727 (50) | 184 (61) | 543 (47) | 523 (61) | 201 (34) | ||
| Maternal weight, kg | 48.3 ± 9.3 | 46.3 ± 8.4 | 48.9 ± 9.4 | <0.001 | 45.9 ± 8.0 | 51.7 ± 10.0 | < 0.001 |
| Maternal body mass index (BMI) | 21.7 ± 4.4 | 20.4 ± 3.7 | 22.0 ± 4.5 | <0.001 | 20.1 ± 3.4 | 23.8 ± 4.7 | < 0.001 |
| Low BMI 4 | 368 (25) | 108 (36) | 260 (22) | <0.001 | 295 (35) | 72 (12) | < 0.001 |
| Normal/high BMI | 1096 (75) | 196 (64) | 900 (78) | 560 (66) | 523 (88) | ||
| Baseline hemoglobin (Hb) | |||||||
| Anemia (Hb <12 g/dL) | 855 (59) | 210 (69) | 645 (56) | <0.001 | |||
| No anemia (Hb ≥12 g/dL) | 595 (41) | 93 (31) | 502 (44) | ||||
| Parity | |||||||
| Parity = 0 | 210 (25) | 93 (16) | <0.001 | ||||
| Parity ≥1 | 645 (75) | 502 (84) | |||||
| Household SES 5 | |||||||
| Low SES | 315 (22) | 77 (25) | 238 (21) | 0.068 | 205 (24) | 108 (18) | 0.008 |
| Average/high SES | 1150 (79) | 227 (75) | 923 (80) | 650 (76) | 487 (82) | ||
| Maternal education | |||||||
| No formal education | 461 (31) | 129 (42) | 332 (29) | <0.001 | 324 (38) | 135 (23) | <0.001 |
| Formal education | 1004 (69) | 175 (58) | 829 (71) | 531 (62) | 460 (77) | ||
| Newborn sex | |||||||
| Male | 723 (49) | 151 (50) | 572 (49) | 0.900 | 419 (49) | 296 (50) | 0.781 |
| Female | 742 (51) | 153 (50) | 589 (51) | 436 (51) | 299 (50) |
| Arm 1 | Arm 2 | Arm 3 | Parity x Arm | Arm 1 vs. Arm 3 | Arm 2 vs. Arm 3 | Arm 1 vs. Arm 2 | ||||
|---|---|---|---|---|---|---|---|---|---|---|
| Outcome | Adjusted Mean (95% CI) | Adjusted Mean (95% CI) | Adjusted Mean (95% CI) | Interaction (p-Value) | Adjusted Mean Difference (95% CI) | p-Value | Adjusted Mean Difference (95% CI) | p-Value | Adjusted Mean Difference (95% CI) | p-Value |
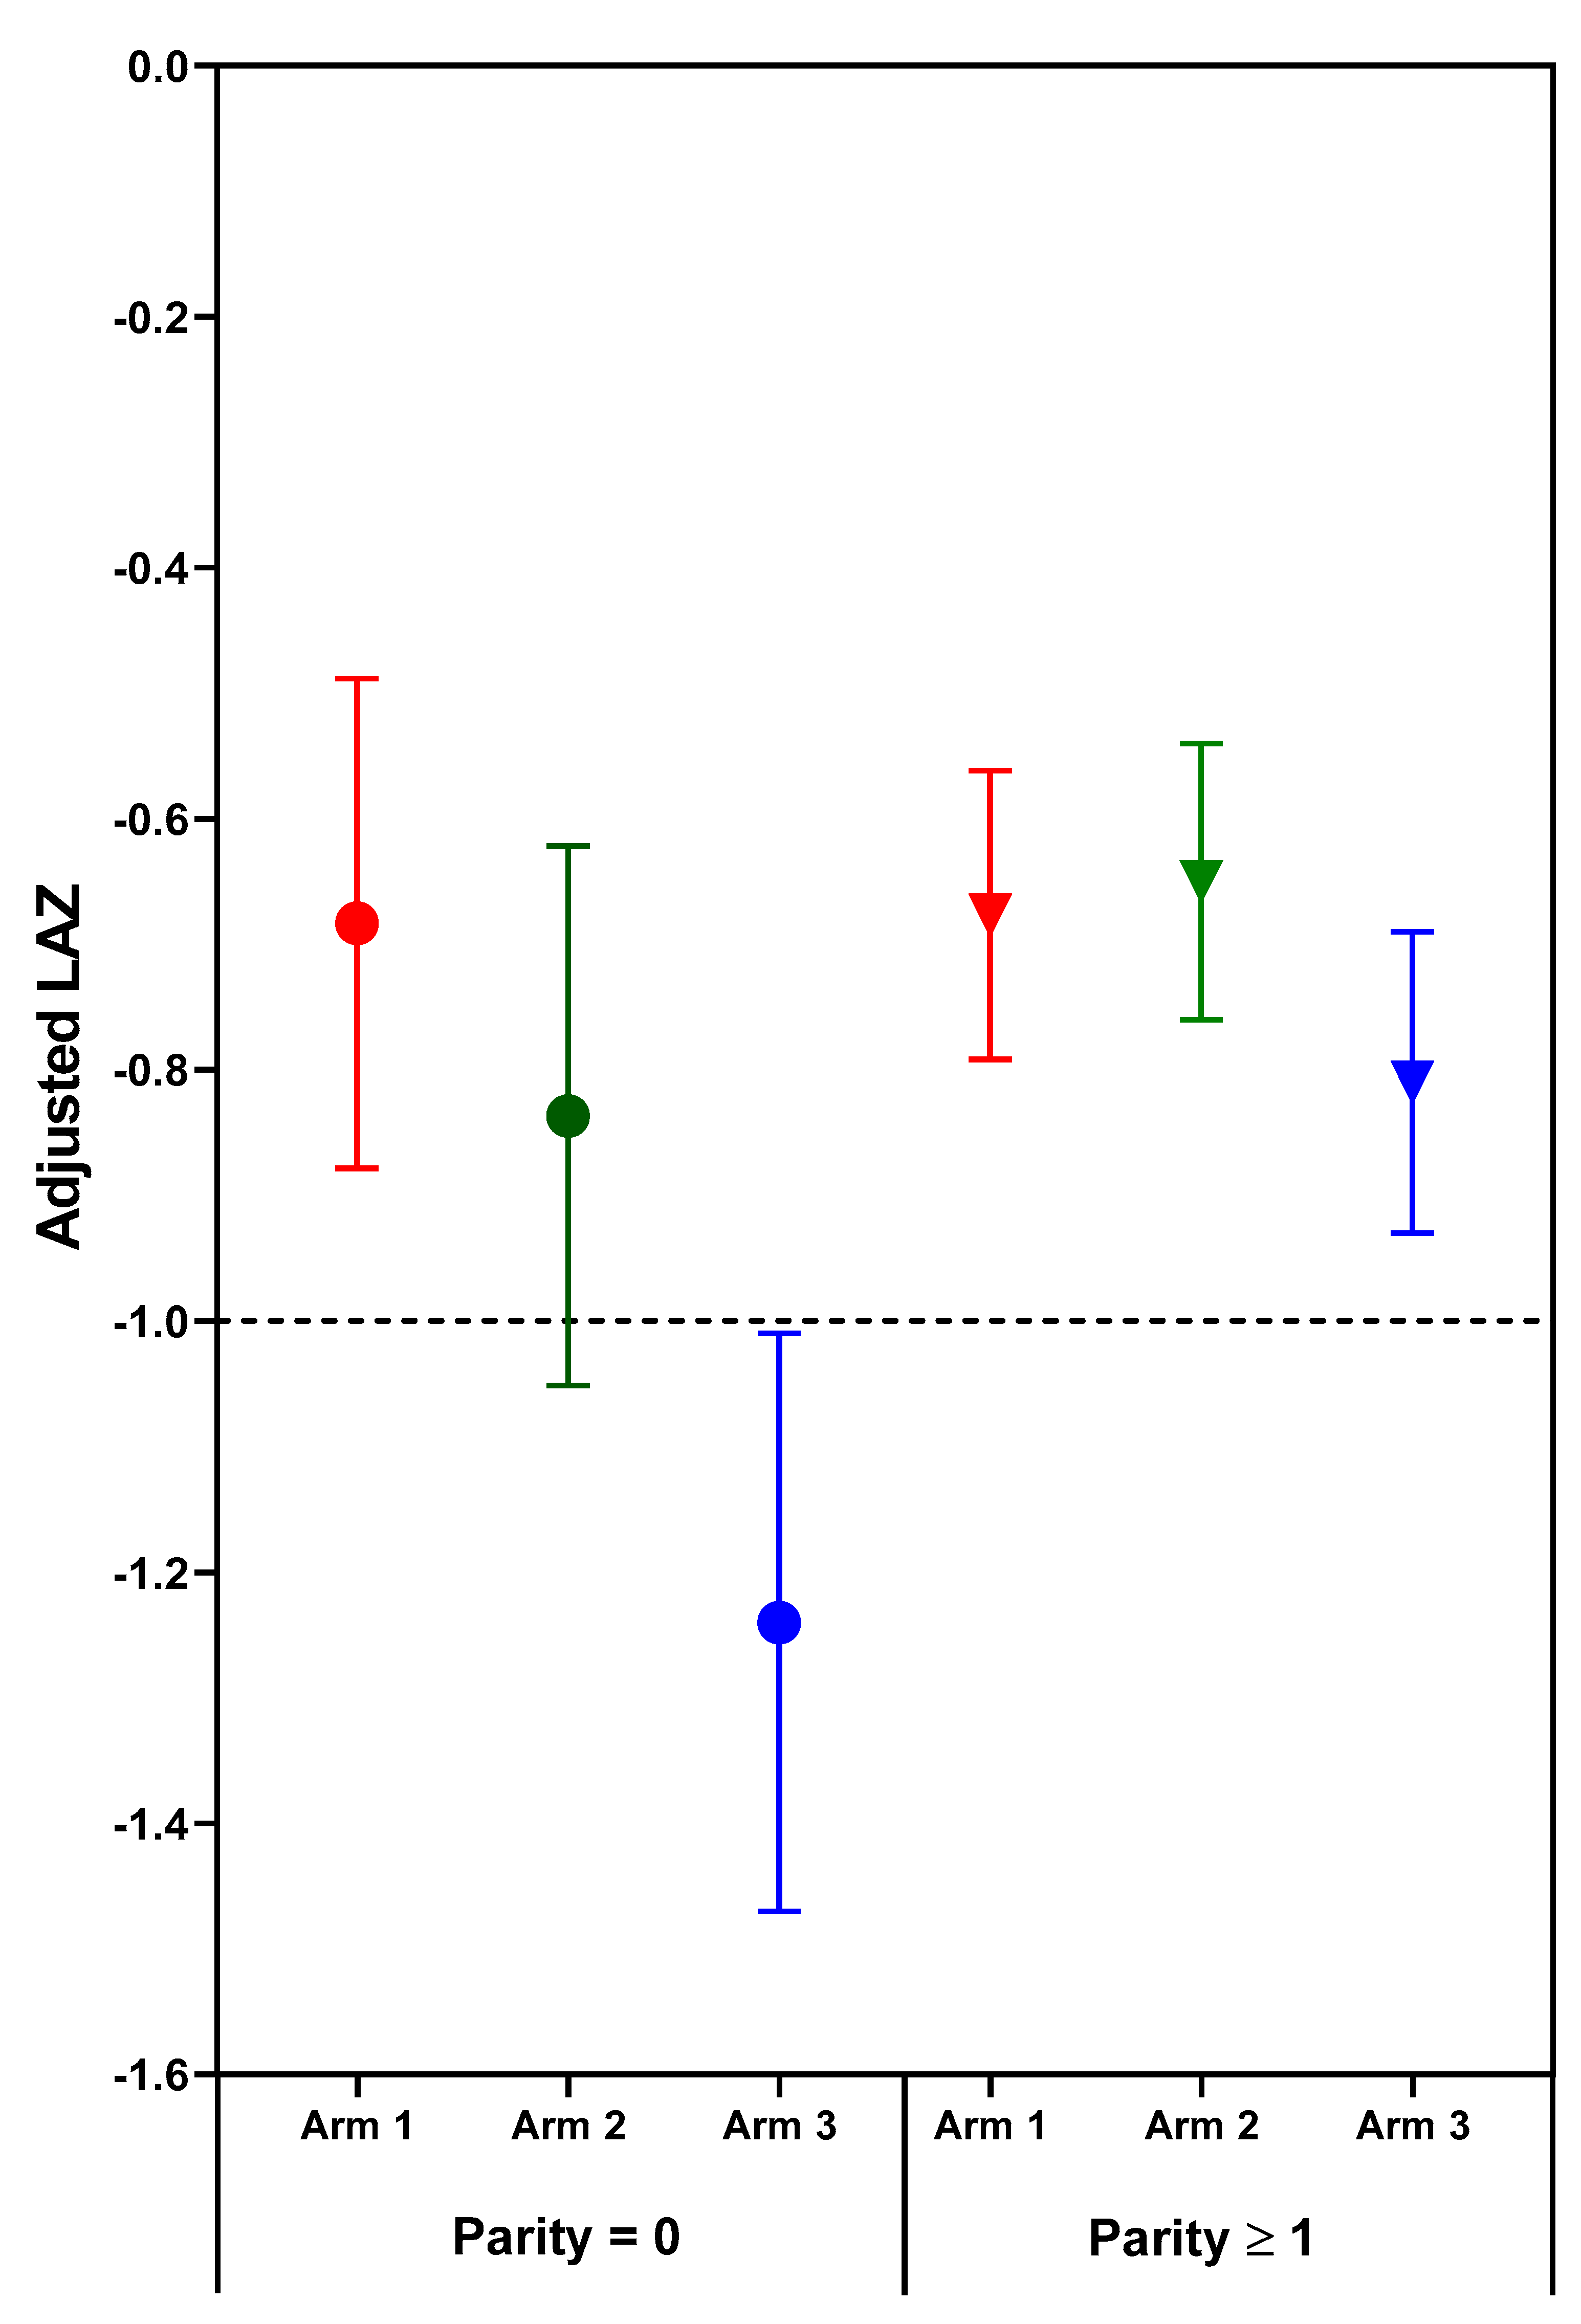
| Length-for-age z-score | ||||||||||
| Parity ≥1 | −0.68 (−0.79, −0.56) | −0.65 (−0.76, −0.54) | −0.81 (−0.93, −0.69) | 0.031 | 0.13 (−0.01, 0.28) | 0.072 | 0.16 (0.02, 0.30) | 0.024 | −0.03 (−0.17, 0.11) | 0.691 |
| Parity = 0 | −0.68 (−0.88, −0.49) | −0.84 (−1.05, −0.62) | −1.24 (−1.47, −1.01) | 0.56 (0.28, 0.84) | <0.001 | 0.40 (0.11, 0.69) | 0.007 | 0.16 (−0.11, 0.43) | 0.254 | |
| Weight-for-age z-score | ||||||||||
| Parity ≥1 | −0.83 (−0.93, −0.73) | −0.84 (−0.94, −0.75) | −0.96 (−1.06, −0.87) | 0.038 | 0.13 (0.00, 0.26) | 0.046 | 0.12 (−0.00, 0.25) | 0.056 | 0.01 (−0.12, 0.14) | 0.883 |
| Parity = 0 | −0.96 (−1.12, −0.79) | −1.26 (−1.45, −1.07) | −1.41 (−1.61, −1.21) | 0.45 (0.20, 0.70) | <0.001 | 0.15 (−0.12, 0.41) | 0.273 | 0.30 (0.06, 0.54) | 0.013 | |
| Weight to length ratio-for-age z-score | ||||||||||
| Parity ≥1 | −1.11 (−1.26, −0.96) | −1.13 (−1.27, −0.99) | −1.29 (−1.44, −1.15) | 0.064 | 0.18 (0.00, 0.37) | 0.047 | 0.17 (−0.01, 0.34) | 0.066 | 0.02 (−0.16, 0.20) | 0.837 |
| Parity = 0 | −1.35 (−1.59, −1.10) | −1.80 (−2.07, −1.53) | −1.87 (−2.16, −1.58) | 0.52 (0.17, 0.88) | 0.004 | 0.07 (−0.30, 0.44) | 0.710 | 0.45 (0.11, 0.79) | 0.009 | |
| Outcome | Arm 1 | Arm 2 | Arm 3 | Parity x Arm | Arm 1 vs. Arm 3 | Arm 2 vs. Arm 3 | Arm 1 vs. Arm 2 | |||
|---|---|---|---|---|---|---|---|---|---|---|
| Adjusted Mean (95% CI) | Adjusted Mean (95% CI) | Adjusted Mean (95% CI) | Interaction (p-Value) | Adjusted Mean Difference (95% CI) | p-Value | Adjusted Mean Difference (95% CI) | p-Value | Adjusted Mean Difference (95% CI) | p-Value | |
| Guatemala | ||||||||||
| Length-for-age z-score | ||||||||||
| Parity ≥1 | −0.84 (−1.03, −0.66) | −0.67 (−0.85, −0.49) | −0.90 (−1.08, −0.71) | 0.219 | 0.05 (−0.14, 0.25) | 0.598 | 0.23 (0.03, 0.42) | 0.022 | −0.17 (−0.37, 0.02) | 0.078 |
| Parity = 0 | −0.92 (−1.43, −0.42) | −1.27 (−1.79, −0.74) | −0.84 (−1.46, −0.23) | −0.08 (−0.85, 0.69) | 0.843 | −0.42 (−1.21, 0.36) | 0.290 | 0.35 (−0.35, 1.04) | 0.330 | |
| Weight-for-age z-score | ||||||||||
| Parity ≥1 | −0.71 (−0.86, −0.56) | −0.61 (−0.75, −0.46) | −0.81 (−0.97, −0.66) | 0.420 | 0.10 (−0.08, 0.28) | 0.279 | 0.21 (0.03, 0.38) | 0.021 | −0.11 (−0.28, 0.07) | 0.228 |
| Parity = 0 | −0.91 (−1.36, −0.45) | −1.04 (−1.51, −0.56) | −0.75 (−1.31, −0.20) | −0.15 (−0.85, 0.55) | 0.666 | −0.28 (−0.99, 0.43) | 0.434 | 0.13 (−0.51, 0.77) | 0.688 | |
| Weight to length ratio-for-age z-score | ||||||||||
| Parity ≥1 | −0.84 (−1.06, −0.63) | −0.72 (−0.93, −0.51) | −1.00 (−1.23, −0.78) | 0.518 | 0.16 (−0.10, 0.42) | 0.228 | 0.28 (0.02, 0.54) | 0.032 | −0.12 (−0.38, 0.14) | 0.358 |
| Parity = 0 | −1.17 (−1.83, −0.51) | −1.24 (−1.93, −0.55) | −0.91 (−1.71, −0.10) | −0.26 (−1.28, 0.75) | 0.613 | −0.34 (−1.37, 0.70) | 0.522 | 0.08 (−0.85, 1.00) | 0.872 | |
| India | ||||||||||
| Length-for-age z-score | ||||||||||
| Parity ≥1 | −0.63 (−0.86, −0.40) | −0.57 (−0.79, −0.36) | −0.79 (−1.03, −0.55) | 0.270 | 0.17 (−0.08, 0.42) | 0.190 | 0.22 (−0.02, 0.46) | 0.075 | −0.05 (−0.29, 0.19) | 0.678 |
| Parity = 0 | −0.73 (−1.04, −0.43) | −0.99 (−1.33, −0.65) | −1.27 (−1.62, −0.91) | 0.53 (0.11, 0.96) | 0.013 | 0.27 (−0.17, 0.71) | 0.224 | 0.26 (−0.14, 0.67) | 0.203 | |
| Weight-for-age z-score | ||||||||||
| Parity ≥1 | −1.12 (−1.32, −0.92) | −1.14 (−1.33, −0.95) | −1.30 (−1.50, −1.09) | 0.101 | 0.18 (−0.05, 0.41) | 0.125 | 0.15 (−0.06, 0.37) | 0.167 | 0.02 (−0.20, 0.24) | 0.829 |
| Parity = 0 | −1.14 (−1.40, −0.87) | −1.47 (−1.77, −1.17) | −1.79 (−2.11, −1.47) | 0.65 (0.27, 1.04) | 0.001 | 0.32 (−0.08, 0.72) | 0.116 | 0.33 (−0.03, 0.70) | 0.073 | |
| Weight to length ratio-for-age z-score | ||||||||||
| Parity ≥1 | −1.68 (−1.96, −1.40) | −1.71 (−1.97, −1.45) | −1.90 (−2.19, −1.62) | 0.041 | 0.23 (−0.09, 0.55) | 0.167 | 0.20 (−0.11, 0.50) | 0.210 | 0.03 (−0.28, 0.34) | 0.853 |
| Parity = 0 | −1.60 (−1.98, −1.22) | −2.19 (−2.61, −1.77) | −2.59 (−3.04, −2.14) | 0.99 (0.45, 1.54) | 0.000 | 0.40 (−0.17, 0.96) | 0.167 | 0.60 (0.08, 1.11) | 0.023 | |
| Pakistan | ||||||||||
| Length-for-age z-score | ||||||||||
| Parity ≥1 | −0.46 (−0.71, −0.22) | −0.69 (−0.92, −0.45) | −0.69 (−0.94, −0.44) | 0.037 | 0.22 (−0.09, 0.54) | 0.167 | 0.00 (−0.31, 0.31) | 0.991 | 0.22 (−0.09, 0.53) | 0.158 |
| Parity = 0 | −0.49 (−0.82, −0.17) | −0.53 (−0.90, −0.16) | −1.27 (−1.64, −0.89) | 0.77 (0.31, 1.24) | 0.001 | 0.74 (0.24, 1.23) | 0.003 | 0.04 (−0.42, 0.49) | 0.875 | |
| Weight-for-age z-score | ||||||||||
| Parity ≥1 | −0.68 (−0.88, −0.47) | −0.84 (−1.03, −0.64) | −0.81 (−1.02, −0.61) | 0.500 | 0.13 (−0.14, 0.41) | 0.334 | −0.03 (−0.29, 0.24) | 0.850 | 0.16 (−0.10, 0.42) | 0.236 |
| Parity = 0 | −0.90 (−1.17, −0.63) | −1.24 (−1.55, −0.93) | −1.31 (−1.63, −1.00) | 0.41 (0.02, 0.81) | 0.041 | 0.07 (−0.35, 0.49) | 0.740 | 0.34 (−0.05, 0.73) | 0.084 | |
| Weight to length ratio-for-age z-score | ||||||||||
| Parity ≥1 | −0.88 (−1.15, −0.60) | −1.08 (−1.34, −0.82) | −1.08 (−1.35, −0.80) | 0.718 | 0.20 (−0.17, 0.57) | 0.291 | −0.01 (−0.37, 0.35) | 0.967 | 0.21 (−0.15, 0.57) | 0.258 |
| Parity = 0 | −1.39 (−1.76, −1.03) | −1.85 (−2.27, −1.43) | −1.64 (−2.07, −1.21) | 0.24 (−0.30, 0.79) | 0.374 | −0.21 (−0.79, 0.36) | 0.465 | 0.46 (−0.07, 0.99) | 0.088 | |
| Outcome | Arm 1 | Arm 2 | Arm 3 | Anemia x Arm Interaction (p-Value) | Arm 1 vs. Arm 3 | Arm 2 vs. Arm 3 | Arm 1 vs. Arm 2 | |||
|---|---|---|---|---|---|---|---|---|---|---|
| Adjusted Mean (95% CI) | Adjusted Mean (95% CI) | Adjusted Mean (95% CI) | Adjusted Mean Difference (95% CI) | p-Value | Adjusted Mean Difference (95% CI) | p-Value | Adjusted Mean Difference (95% CI) | p-Value | ||
| Length-for-age z-score | ||||||||||
| -Anemia | −0.76 (−0.92, −0.60) | −0.73 (−0.89, −0.57) | −0.79 (−0.95, −0.63) | 0.037 | 0.03 (−0.17, 0.23) | 0.759 | 0.06 (−0.13, 0.26) | 0.535 | −0.03 (−0.23, 0.17) | 0.758 |
| +Anemia | −0.72 (−0.86, −0.58) | −0.77 (−0.91, −0.63) | −1.08 (−1.23, −0.93) | 0.36 (0.19, 0.53) | <0.001 | 0.31 (0.15, 0.48) | <0.001 | 0.05 (−0.11, 0.21) | 0.564 | |
| Weight-for-age z-score | ||||||||||
| -Anemia | −0.96 (−1.10, −0.82) | −0.91 (−1.04, −0.77) | −0.94 (−1.08, −0.80) | 0.007 | −0.02 (−0.20, 0.16) | 0.846 | 0.03 (−0.14, 0.21) | 0.699 | −0.05 (−0.23, 0.12) | 0.559 |
| +Anemia | −0.97 (−1.08, −0.85) | −1.13 (−1.24, −1.01) | −1.32 (−1.45, −1.20) | 0.36 (0.21, 0.51) | <0.001 | 0.20 (0.05, 0.34) | 0.010 | 0.16 (0.02, 0.31) | 0.028 | |
| Weight to length ratio-for-age z-score | ||||||||||
| -Anemia | −1.33 (−1.53, −1.13) | −1.26 (−1.46, −1.07) | −1.30 (−1.50, −1.10) | 0.009 | −0.03 (−0.29, 0.22) | 0.785 | 0.03 (−0.21, 0.28) | 0.790 | −0.07 (−0.31, 0.18) | 0.585 |
| +Anemia | −1.30 (−1.47, −1.13) | −1.54 (−1.71, −1.36) | −1.77 (−1.95, −1.59) | 0.47 (0.26, 0.68) | <0.001 | 0.23 (0.02, 0.44) | 0.029 | 0.24 (0.04, 0.44) | 0.022 | |
| Arm 1 | Arm 2 | Arm 3 | Anemia x Arm | Arm 1 vs. Arm 3 | Arm 2 vs. Arm 3 | Arm 1 vs. Arm 2 | ||||
|---|---|---|---|---|---|---|---|---|---|---|
| Adjusted Mean (95% CI) | Adjusted Mean (95% CI) | Adjusted Mean (95% CI) | Interaction p-Value | Adjusted Mean Difference (95% CI) | p-Value | Adjusted Mean Difference (95% CI) | p-Value | Adjusted Mean Difference (95% CI) | p-Value | |
| Guatemala | ||||||||||
| Length-for-age z-score | ||||||||||
| -Anemia | −0.95 (−1.17, −0.74) | −0.74 (−0.96, −0.53) | −0.92 (−1.13, −0.70) | 0.042 | −0.04 (−0.24, 0.16) | 0.716 | 0.17 (−0.03, 0.37) | 0.089 | −0.21 (−0.41, −0.01) | 0.040 |
| +Anemia | −0.67 (−1.06, −0.27) | −0.99 (−1.39, −0.58) | −1.35 (−1.81, −0.89) | 0.68 (0.12, 1.24) | 0.018 | 0.36 (−0.20, 0.92) | 0.209 | 0.32 (−0.19, 0.83) | 0.218 | |
| Weight-for-age z-score | ||||||||||
| -Anemia | −0.87 (−1.05, −0.69) | −0.72 (−0.89, −0.54) | −0.87 (−1.06, −0.69) | 0.022 | −0.00 (−0.19, 0.18) | 0.985 | 0.15 (−0.03, 0.33) | 0.092 | −0.16 (−0.34, 0.02) | 0.091 |
| +Anemia | −0.50 (−0.84, −0.15) | −0.80 (−1.15, −0.45) | −1.24 (−1.65, −0.82) | 0.74 (0.23, 1.25) | 0.005 | 0.44 (−0.07, 0.95) | 0.093 | 0.30 (−0.16, 0.76) | 0.196 | |
| Weight to length ratio-for age z-score | ||||||||||
| -Anemia | −1.09 (−1.35, −0.83) | −0.91 (−1.17, −0.65) | −1.11 (−1.38, −0.85) | 0.050 | 0.02 (−0.25, 0.29) | 0.870 | 0.20 (−0.06, 0.47) | 0.126 | −0.18 (−0.45, 0.08) | 0.176 |
| +Anemia | −0.55 (−1.06, −0.04) | −0.90 (−1.41, −0.39) | −1.55 (−2.15, −0.95) | 1.00 (0.26, 1.75) | 0.008 | 0.65 (−0.09, 1.39) | 0.085 | 0.35 (−0.32, 1.02) | 0.306 | |
| India | ||||||||||
| Length-for-age z-score | ||||||||||
| -Anemia | −0.63 (−1.12, −0.15) | −0.84 (−1.33, −0.35) | −1.08 (−1.70, −0.45) | 0.842 | 0.44 (−0.34, 1.22) | 0.265 | 0.24 (−0.54, 1.02) | 0.554 | 0.21 (−0.46, 0.88) | 0.545 |
| +Anemia | −0.71 (−0.89, −0.54) | −0.73 (−0.90, −0.56) | −0.96 (−1.15, −0.78) | 0.25 (0.03, 0.48) | 0.028 | 0.23 (0.01, 0.45) | 0.037 | 0.02 (−0.20, 0.24) | 0.868 | |
| Weight-for-age z-score | ||||||||||
| -Anemia | −1.30 (−1.73, −0.87) | −1.26 (−1.70, −0.83) | −1.41 (−1.97, −0.85) | 0.821 | 0.11 (−0.60, 0.82) | 0.755 | 0.15 (−0.56, 0.86) | 0.687 | −0.03 (−0.64, 0.58) | 0.916 |
| +Anemia | −1.14 (−1.29, −1.00) | −1.27 (−1.42, −1.13) | −1.47 (−1.62, −1.31) | 0.32 (0.12, 0.53) | 0.002 | 0.20 (−0.01, 0.40) | 0.056 | 0.13 (−0.07, 0.33) | 0.203 | |
| Weight to length ratio-for age z-score | ||||||||||
| -Anemia | −1.99 (−2.59, −1.39) | −1.85 (−2.46, −1.24) | −1.98 (−2.76, −1.19) | 0.592 | −0.02 (−1.01, 0.98) | 0.975 | 0.12 (−0.87, 1.12) | 0.805 | −0.14 (−0.99, 0.71) | 0.746 |
| +Anemia | −1.65 (−1.86, −1.45) | −1.88 (−2.08, −1.67) | −2.12 (−2.34, −1.90) | 0.47 (0.18, 0.76) | 0.001 | 0.25 (−0.03, 0.53) | 0.085 | 0.22 (−0.06, 0.50) | 0.117 | |
| Pakistan | ||||||||||
| Length-for-age z-score | ||||||||||
| -Anemia | −0.29 (−0.65, 0.07) | −0.76 (−1.12, −0.41) | −0.43 (−0.78, −0.08) | 0.032 | 0.14 (−0.35, 0.63) | 0.575 | −0.33 (−0.81, 0.15) | 0.177 | 0.47 (−0.02, 0.97) | 0.061 |
| +Anemia | −0.69 (−0.93, −0.46) | −0.76 (−0.99, −0.52) | −1.19 (−1.45, −0.94) | 0.50 (0.19, 0.81) | 0.002 | 0.44 (0.12, 0.75) | 0.006 | 0.06 (−0.24, 0.36) | 0.676 | |
| Weight-for-age z-score | ||||||||||
| -Anemia | −0.77 (−1.08, −0.47) | −1.06 (−1.36, −0.77) | −0.70 (−1.00, −0.41) | 0.088 | −0.07 (−0.49, 0.35) | 0.746 | −0.36 (−0.77, 0.05) | 0.085 | 0.29 (−0.13, 0.71) | 0.175 |
| +Anemia | −0.89 (−1.08, −0.70) | −1.08 (−1.28, −0.89) | −1.24 (−1.45, −1.04) | 0.35 (0.09, 0.61) | 0.010 | 0.16 (−0.11, 0.43) | 0.240 | 0.19 (−0.06, 0.45) | 0.143 | |
| Weight to length ratio-for age z-score | ||||||||||
| -Anemia | −1.21 (−1.61, −0.80) | −1.52 (−1.92, −1.13) | −1.00 (−1.39, −0.60) | 0.095 | −0.21 (−0.78, 0.36) | 0.468 | −0.53 (−1.09, 0.03) | 0.063 | 0.32 (−0.25, 0.89) | 0.270 |
| +Anemia | −1.17 (−1.42, −0.91) | −1.43 (−1.69, −1.18) | −1.57 (−1.85, −1.30) | 0.40 (0.04, 0.76) | 0.029 | 0.14 (−0.23, 0.50) | 0.458 | 0.27 (−0.08, 0.61) | 0.134 | |
© 2019 by the authors. Licensee MDPI, Basel, Switzerland. This article is an open access article distributed under the terms and conditions of the Creative Commons Attribution (CC BY) license (http://creativecommons.org/licenses/by/4.0/).
Share and Cite
Hambidge, K.M.; Bann, C.M.; McClure, E.M.; Westcott, J.E.; Garcés, A.; Figueroa, L.; Goudar, S.S.; Dhaded, S.M.; Pasha, O.; Ali, S.A.; et al. Maternal Characteristics Affect Fetal Growth Response in the Women First Preconception Nutrition Trial. Nutrients 2019, 11, 2534. https://0-doi-org.brum.beds.ac.uk/10.3390/nu11102534
Hambidge KM, Bann CM, McClure EM, Westcott JE, Garcés A, Figueroa L, Goudar SS, Dhaded SM, Pasha O, Ali SA, et al. Maternal Characteristics Affect Fetal Growth Response in the Women First Preconception Nutrition Trial. Nutrients. 2019; 11(10):2534. https://0-doi-org.brum.beds.ac.uk/10.3390/nu11102534
Chicago/Turabian StyleHambidge, K Michael, Carla M. Bann, Elizabeth M. McClure, Jamie E. Westcott, Ana Garcés, Lester Figueroa, Shivaprasad S. Goudar, Sangappa M. Dhaded, Omrana Pasha, Sumera A. Ali, and et al. 2019. "Maternal Characteristics Affect Fetal Growth Response in the Women First Preconception Nutrition Trial" Nutrients 11, no. 10: 2534. https://0-doi-org.brum.beds.ac.uk/10.3390/nu11102534