Inhibition of Mg2+ Extrusion Attenuates Glutamate Excitotoxicity in Cultured Rat Hippocampal Neurons


1
Department of Bioscience and Informatics, Faculty of Science and Technology, Keio University, Yokohama, Kanagawa 223-8522, Japan
2
Faculty of Pharmaceutical Sciences, Sanyo-Onoda City University, Sanyo-Onoda, Yamaguchi 756-0884, Japan
3
Waseda Research Institute for Science and Engineering, Waseda University, Shinjuku, Tokyo 162-8480, Japan
4
Graduate Institute of Medicine, College of Medicine, Kaohsiung Medical University, Kaohsiung 80708, Taiwan
*
Author to whom correspondence should be addressed.
Nutrients 2020, 12(9), 2768; https://0-doi-org.brum.beds.ac.uk/10.3390/nu12092768
Submission received: 6 August 2020
/
Revised: 4 September 2020
/
Accepted: 8 September 2020
/
Published: 10 September 2020
(This article belongs to the Special Issue Magnesium in Human Health and Disease)
Abstract
:Magnesium plays important roles in the nervous system. An increase in the Mg2+ concentration in cerebrospinal fluid enhances neural functions, while Mg2+ deficiency is implicated in neuronal diseases in the central nervous system. We have previously demonstrated that high concentrations of glutamate induce excitotoxicity and elicit a transient increase in the intracellular concentration of Mg2+ due to the release of Mg2+ from mitochondria, followed by a decrease to below steady-state levels. Since Mg2+ deficiency is involved in neuronal diseases, this decrease presumably affects neuronal survival under excitotoxic conditions. However, the mechanism of the Mg2+ decrease and its effect on the excitotoxicity process have not been elucidated. In this study, we demonstrated that inhibitors of Mg2+ extrusion, quinidine and amiloride, attenuated glutamate excitotoxicity in cultured rat hippocampal neurons. A toxic concentration of glutamate induced both Mg2+ release from mitochondria and Mg2+ extrusion from cytosol, and both quinidine and amiloride suppressed only the extrusion. This resulted in the maintenance of a higher Mg2+ concentration in the cytosol than under steady-state conditions during the ten-minute exposure to glutamate. These inhibitors also attenuated the glutamate-induced depression of cellular energy metabolism. Our data indicate the importance of Mg2+ regulation in neuronal survival under excitotoxicity.
1. Introduction
Magnesium plays important roles in the nervous system [1,2]. Elevation of the Mg2+ concentration in cerebrospinal fluid (CSF) increases synapse formation, enhances recognition and learning abilities in rats [3], and causes neural stem cell proliferation in mice [4]. Further, a deficiency of Mg2+ in the brain is implicated in neuronal diseases, and some researchers have reported lower Mg2+ concentrations than normal in the brain of patients with neurodegenerative diseases [5,6]. In rats, significant loss of dopaminergic neurons in the substantia nigra, similar to the loss seen in Parkinson’s disease, was elicited merely by feeding them a low-magnesium diet for two generations [7]. In contrast, Mg2+ supplementation or overexpression of the Mg2+ channel have neuro-protective effects on cellular and animal models of Parkinson’s [8,9,10] and Alzheimer’s diseases [11]. These evidences show that Mg2+ is intricately involved in nervous system functioning and neuroprotection.
At the cellular level, Mg2+ is essential for maintaining enzymatic activities and energy metabolism, and its intracellular concentration is regulated by a number of ion channels and transporters on cell and organelle membranes [12,13,14,15,16]. Recent researches have revealed that Mg2+ also has more active roles in regulating intracellular signal transduction [17], cellular metabolism [18,19], and cell division [20]. These studies indicate that the concentration changes of Mg2+ is in a small range from 0.5 mM to 1.2 mM but essential for cellular functions. In neurons, the most widely known role of Mg2+ is the extracellular blockade and regulation of N-methyl-D-aspartate (NMDA) receptors, which occurs under physiologically normal extracellular concentrations [21,22]. In addition, intracellular Mg2+ is thought to play an indispensable role in neuronal functions [1]. Previously, we demonstrated that some neurotransmitters, as well as neuronal excitation itself, elicit changes in the intracellular Mg2+ concentration ([Mg2+]i) in cultured neurons [23,24,25,26]. In particular, glutamate induced interesting changes in [Mg2+]i. Although it is the most abundant neurotransmitter in the mammalian brain, excessive accumulation of glutamate around neurons induces neuronal cell death in a phenomenon known as excitotoxicity [27]. Toxic concentration of extracellular glutamate induced the release of Mg2+ from mitochondria, which is triggered by excessive Ca2+ accumulation in the mitochondria, leading to the increase in [Mg2+]i [26]. Subsequently, the [Mg2+]i turns to decrease. Given that Mg2+ deficiency is involved in neuronal diseases, the decreasing [Mg2+]i phase likely has detrimental effects on neuronal survival, and thus plays a key role in excitotoxicity. However, the mechanism causing the decreasing [Mg2+]i phase and its effect on excitotoxicity has not yet been elucidated.
In this study, we examined whether changes in [Mg2+]i are involved in neuronal cell death via excitotoxicity in rat hippocampal neurons. We investigated the mechanisms involved in the phase in which the transient [Mg2+]i increase in response to glutamate is reversed, and the effects of [Mg2+]i on cellular energy metabolism. Quinidine and amiloride were used to inhibit cellular Mg2+ extrusion. Because those inhibitors are not specific for Mg2+ transport, it is important to confirm that both inhibitors show similar effects and that the effects were mediated via the changes in [Mg2+]i. Glutamate excitotoxicity results from continuous activation of the NMDA receptors on neurons, which leads to excessive Ca2+ influx into the cytosol and overload in the mitochondria, resulting in depolarization of the mitochondrial membrane potential and the release of cell death signals [27,28]. Mitochondria begin to release apoptosis signals within 10–20 min in response to toxic concentrations of glutamate [27]. Therefore, the Mg2+ transient elicited during the first 10 min of exposure to the glutamate stimulus may affect intracellular signals prior to the release of cell death signals under excitotoxicity. We investigated the hypothesis that the intracellular Mg2+ homeostasis and the intracellular Mg2+ regulatory system are key to cell protection in neuronal pathology.
2. Materials and Methods
2.1. Ethical Approval
All animal procedures were approved by the ethics committee of Keio University (permit number 09106-(7)). All methods were carried out in accordance with the relevant guidelines and regulations.
2.2. Dissociation Culture of Rat Hippocampal Neurons
The primary cultures of hippocampal neurons were prepared from day 18 embryonic Wistar rats (Charles River Laboratories Japan, Tokyo, Japan). Extracted hippocampi were dissociated using a dissociation kit (Sumitomo Bakelite, Tokyo, Japan). Isolated hippocampal neurons were plated on glass bottom dishes (Iwaki, Tokyo, Japan) coated with poly-D-lysine (PDL; Sigma-Aldrich, St. Louis, MO, USA) for fluorescence imaging or in 96-well plates for MTT assay, and cultured in neurobasal medium (Thermo Fisher Scientific, Waltham, MA, USA) supplemented with B-27 (Thermo Fisher Scientific, Waltham, MA, USA), 2 mM L-glutamine, 50 U/mL penicillin, and 50 μg/mL streptomycin (Nacalai Tesuque, Kyoto, Japan). The neurons were cultured at 37 °C in a humidified atmosphere of 5% CO2 for 7–9 days. Neuronal culture and synaptic formation among neurons were confirmed by immunofluorescence imaging of a neuron marker, βIII-tubulin (Sigma-Aldrich, St. Louis, MO, USA), and a synapse marker, synapsin I (Abcam, Cambridge, UK) (Figure S1).
2.3. MTT Assay
The MTT assay was conducted to measure cell viability. Neurons at the concentration of 8 × 10³ cells/well were cultured on 96-well plates for 7 days. Neurons cultured in 96-well plates were incubated in culture medium with or without an inhibitor of Mg2+ extrusion (quinidine at 200 μM or amiloride at 500 μM; Sigma-Aldrich) and/or an inhibitor of mechanistic target of rapamycin (mTOR) (Torin1 at 2.5 μM; Chem Scene, Monmouth Junction, NJ, USA) for 10 min. Next, 100 μM glutamate with 10 μM glycine or control culture medium was applied and cells were incubated for 10 min. The culture medium containing inhibitor and/or glutamate was then replaced with normal culture medium, and the neurons were incubated for 24 h. The neurons were then incubated in culture medium containing 0.5 mg/mL MTT (Nacalai Tesuque). The culture medium was removed and 100 μL of dimethyl sulfoxide (DMSO; Nacalai Tesuque) was added to each well to dissolve the precipitate, and absorbance at 570 nm was measured using a microplate reader, Fluoroskan Ascent FL (Thermo Fisher Scientific). Cell viability in the treatment cultures is expressed as a proportion of cell viability in the control cultures.
2.4. Simultaneous Fluorescence Imaging of Intracellular Mg2+ and Ca2+
Changes in [Mg2+]i and intracellular Ca2+ concentration ([Ca2+]i) were measured by simultaneous imaging using the probes KMG-104-AM [29] and Fura-Red-AM (Thermo Fisher Scientific), respectively. KMG-104 is sufficiently selective to measure the Mg2+ signal without interference from the Ca2+ signal [29,30]. Neurons cultured on glass-bottom dishes were washed with Hanks’ balanced salt solution (HBSS; NaCl 137 mM, KCl 5.4 mM, CaCl2 1.3 mM, MgCl2 0.5 mM, MgSO4 0.4 mM, Na2HPO4 0.3 mM, KH2PO4 0.4 mM, NaHCO3 4.2 mM, D-glucose 5.6 mM, HEPES 10 mM, pH adjusted to 7.4 with NaOH) and incubated in HBSS containing 5 μM KMG-104-AM, 10 μM Fura-Red-AM and 0.02% pluronic F-127 (Thermo Fisher Scientific) at 37 °C for 30 min. The neurons were then washed twice and incubated in HBSS, in HBSS without CaCl2 (nominally Ca2+-free HBSS) for measurements under Ca2+-free conditions, for 15 min at 37 °C to allow for complete hydrolysis of the acetoxymethyl (AM) ester.
Fluorescence measurements were performed using fluorescence microscope, ECLIPSE TE300 (Nikon, Tokyo, Japan) equipped with 10× and 20× objective lenses, S Fluor (Nikon). Excitation light with a wavelength of approximately 488 nm was selected from a 150W Xe lamp using a monochrometer unit (Hamamatsu photonics, Shizuoka, Japan). The fluorescence signals that passed through a 510 nm dichroic mirror were separated using a 590 nm dichroic mirror and detected with a CCD camera, HiSCA (Hamamatsu photonics) using a 535/55 nm band pass filter for KMG-104 and a 600 nm long-pass filter for Fura-Red, respectively. Time-lapse images were acquired every 5 sec. Fluorescence intensity (F) was calculated as the mean intensity in a region of interest (ROI) containing the entire cell body by using Aquacosmos software (Hamamatsu photonics). The values of F recorded during time-lapse imaging were normalized by the initial fluorescence intensity (F0) of each cell. The KMG-104 data were presented and analyzed as F/F0. Since a decrease in the fluorescence intensity of Fura-Red indicates an increase in [Ca2+], the Fura-Red data were presented and analyzed as F0/F.
2.5. Fluorescence Imaging of Mitochondrial Membrane Potential
Mitochondrial membrane potential was measured using tetramethylrhodamine ethyl ester (TMRE; Thermo Fisher Scientific). The neurons were washed with HBSS and then incubated for 20 min in HBSS containing 25 nM TMRE. Next, the dye was diluted to 2.5 nM in HBSS, and the neurons were incubated for an additional 10 min to equilibrate the dye. For measurements under high Mg2+ conditions, cells were stained and further incubated in HBSS with 8 mM Mg2+.
Fluorescence of the TMRE was measured using the fluorescence microscope, ECLIPSE TE300. Excitation light with a wavelength of approximately 560 nm was selected from a 150W Xe lamp using the monochrometer unit. The fluorescence signals that passed through a 580 nm dichroic mirror and a 600 nm long-pass filter were detected with the CCD camera. F was calculated as the mean fluorescence intensity in a ROI containing the entire cell body. The values of F recorded during time-lapse imaging were normalized by the F0 of each cell, and the data were presented and analyzed as F/F0.
2.6. Fluorescence Imaging of Intracellular ATP
To compare intracellular ATP concentrations, genetically encoded ATP sensor, ATeam [31], was induced in neurons using an adeno-associated virus (AAV) vector. 30 μL of the AAV vector were added to every dish and neurons were incubated for 3–7 days to ensure sufficient expression of the sensor protein. After washing the cells twice with HBSS, or with HBSS with 8 mM Mg2+ for measurements under high Mg2+ conditions, the fluorescence was measured.
Fluorescence imaging of the neurons was performed using a confocal laser scanning microscope system, FV-1000 (Olympus, Tokyo, Japan) with a 40× oil-immersion objective lens. ATeam was excited at 440 nm from a diode laser. The fluorescence signals were separated using a 510 nm dichroic mirror and observed at 460–500 nm for cyan fluorescent protein (CFP) and 515–615 nm for yellow fluorescent protein (YFP). Fluorescence intensity was calculated as the mean intensity in a ROI containing the entire cell body. The intracellular ATP levels are represented by the YFP to CFP fluorescence ratio (ATeam ratio).
2.7. Statistical Analysis
For multiple testing, analysis of variance (ANOVA) was performed, and then Dunnett’s test was used to compare the control group with the other groups or Tukey’s test was used to compare all possible combinations of groups, assuming parametric distribution. p < 0.05 was considered significantly different.
3. Results
3.1. Inhibitors of Mg2+ Extrusion Attenuated the Excitotoxicity
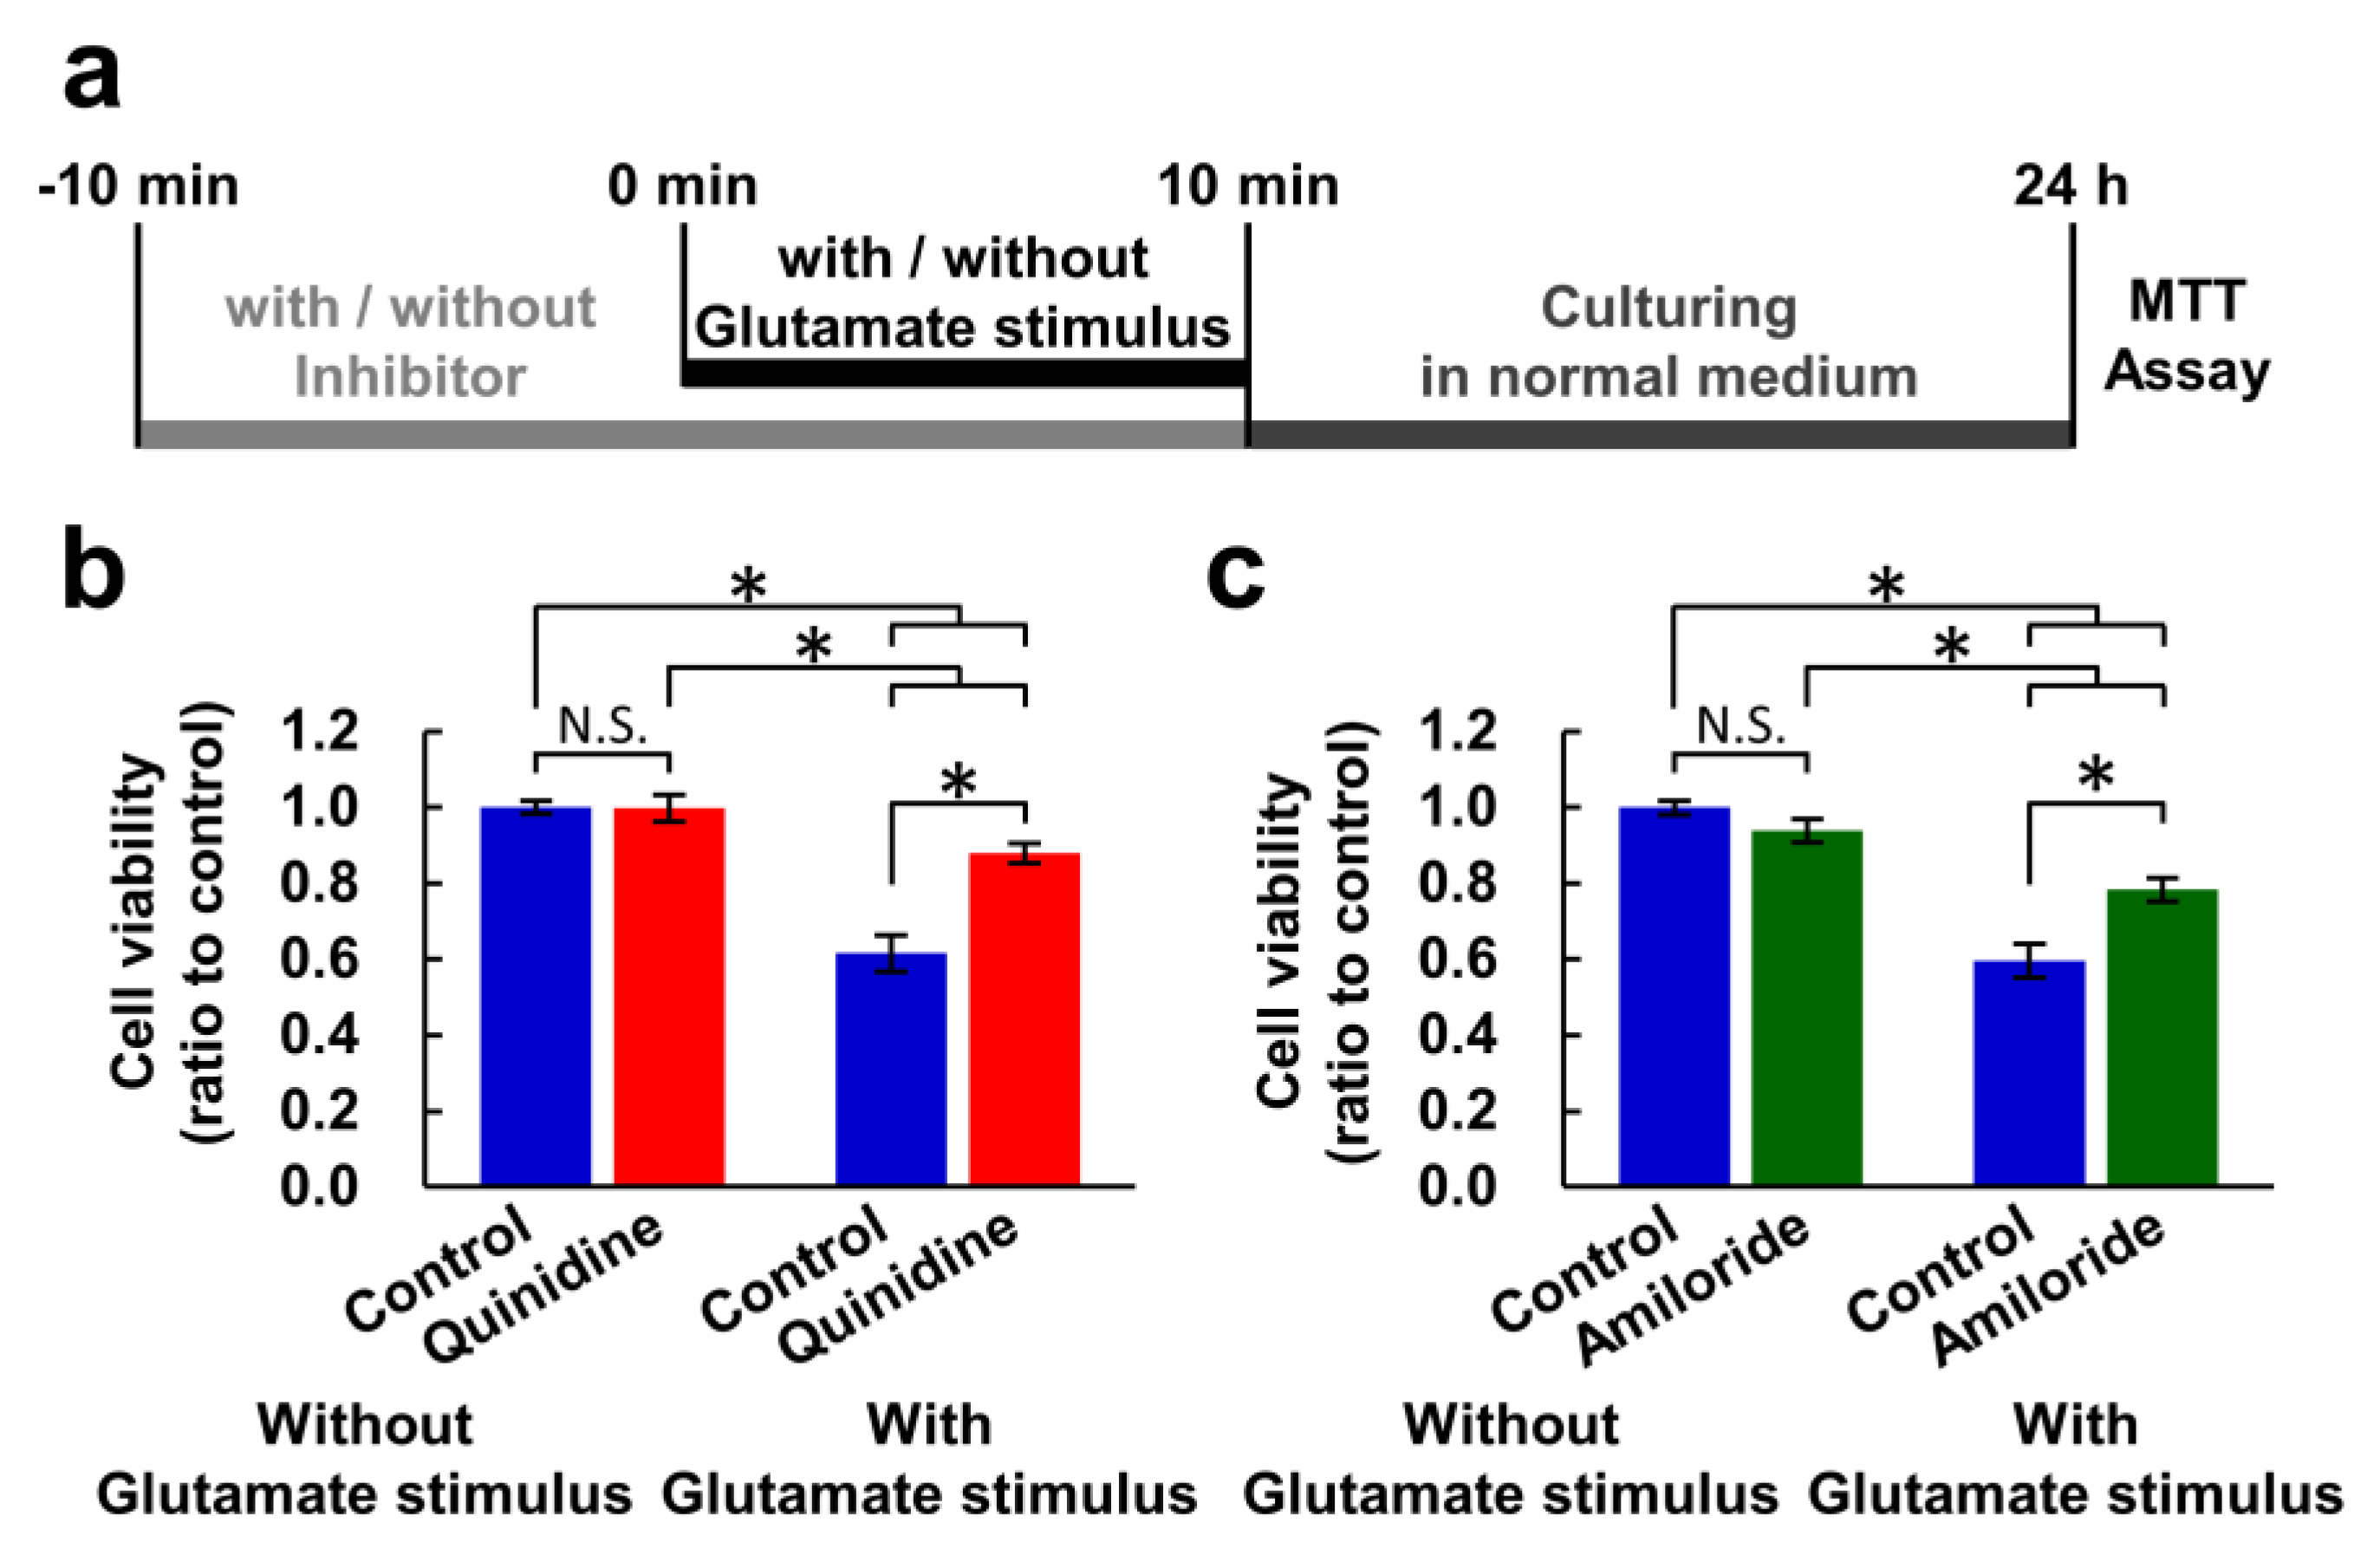
Previous studies have indicated that cells express several Mg2+ extrusion mechanisms, and quinidine, amiloride, and imipramine are used to inhibit these Mg2+ extrusion mechanism [32,33]. Because these inhibitors are not specific for Mg2+ transport, we checked whether both quinidine and amiloride have similar effect on neurons. First, we examined whether inhibitors of Mg2+ extrusion mechanisms had an effect on cell viability under excitotoxic conditions. A combination of 100 μM glutamate and 10 μM glycine was used as an excitotoxic glutamate stimulus. It has been demonstrated that even 10 min of exposure to toxic concentrations of glutamate induces, to some extent, neuronal cell death 24 h after the stimulation [27]. Here, we aimed to assess the impact of the glutamate stimulus for 10 min on cell viability 24 h after the stimulus and to evaluate the effects of inhibition of Mg2+ extrusion on it. We therefore replaced the culture medium for a fresh one not containing glutamate or inhibitors after ten-minute exposure to glutamate stimulus in the presence or absence of an inhibitor to assess the effects of the glutamate stimulus and the inhibition of Mg2+ extrusion only during the ten-minute glutamate stimulus. Then, the cell viability after 24 h was measured with MTT assay (Figure 1a). The ten-minute exposure to glutamate stimulus induced cell death in approximately 40% of the neurons after 24 h (controls with glutamate stimulus in Figure 1b,c). This experimental condition, which induces 40% cell death, was adopted in this study because it is easy to assess the effect of inhibitors on cell viability, whether to accelerate or suppress the toxicity. Both inhibitors partially attenuated this decrease in cell viability, while exposure to the inhibitors for 20 min without glutamate stimulus had no effect on viability (Figure 1b,c).
3.2. The Inhibitors Suppressed the Decreasing Phase of the Glutamate-Induced Mg2+ Transient
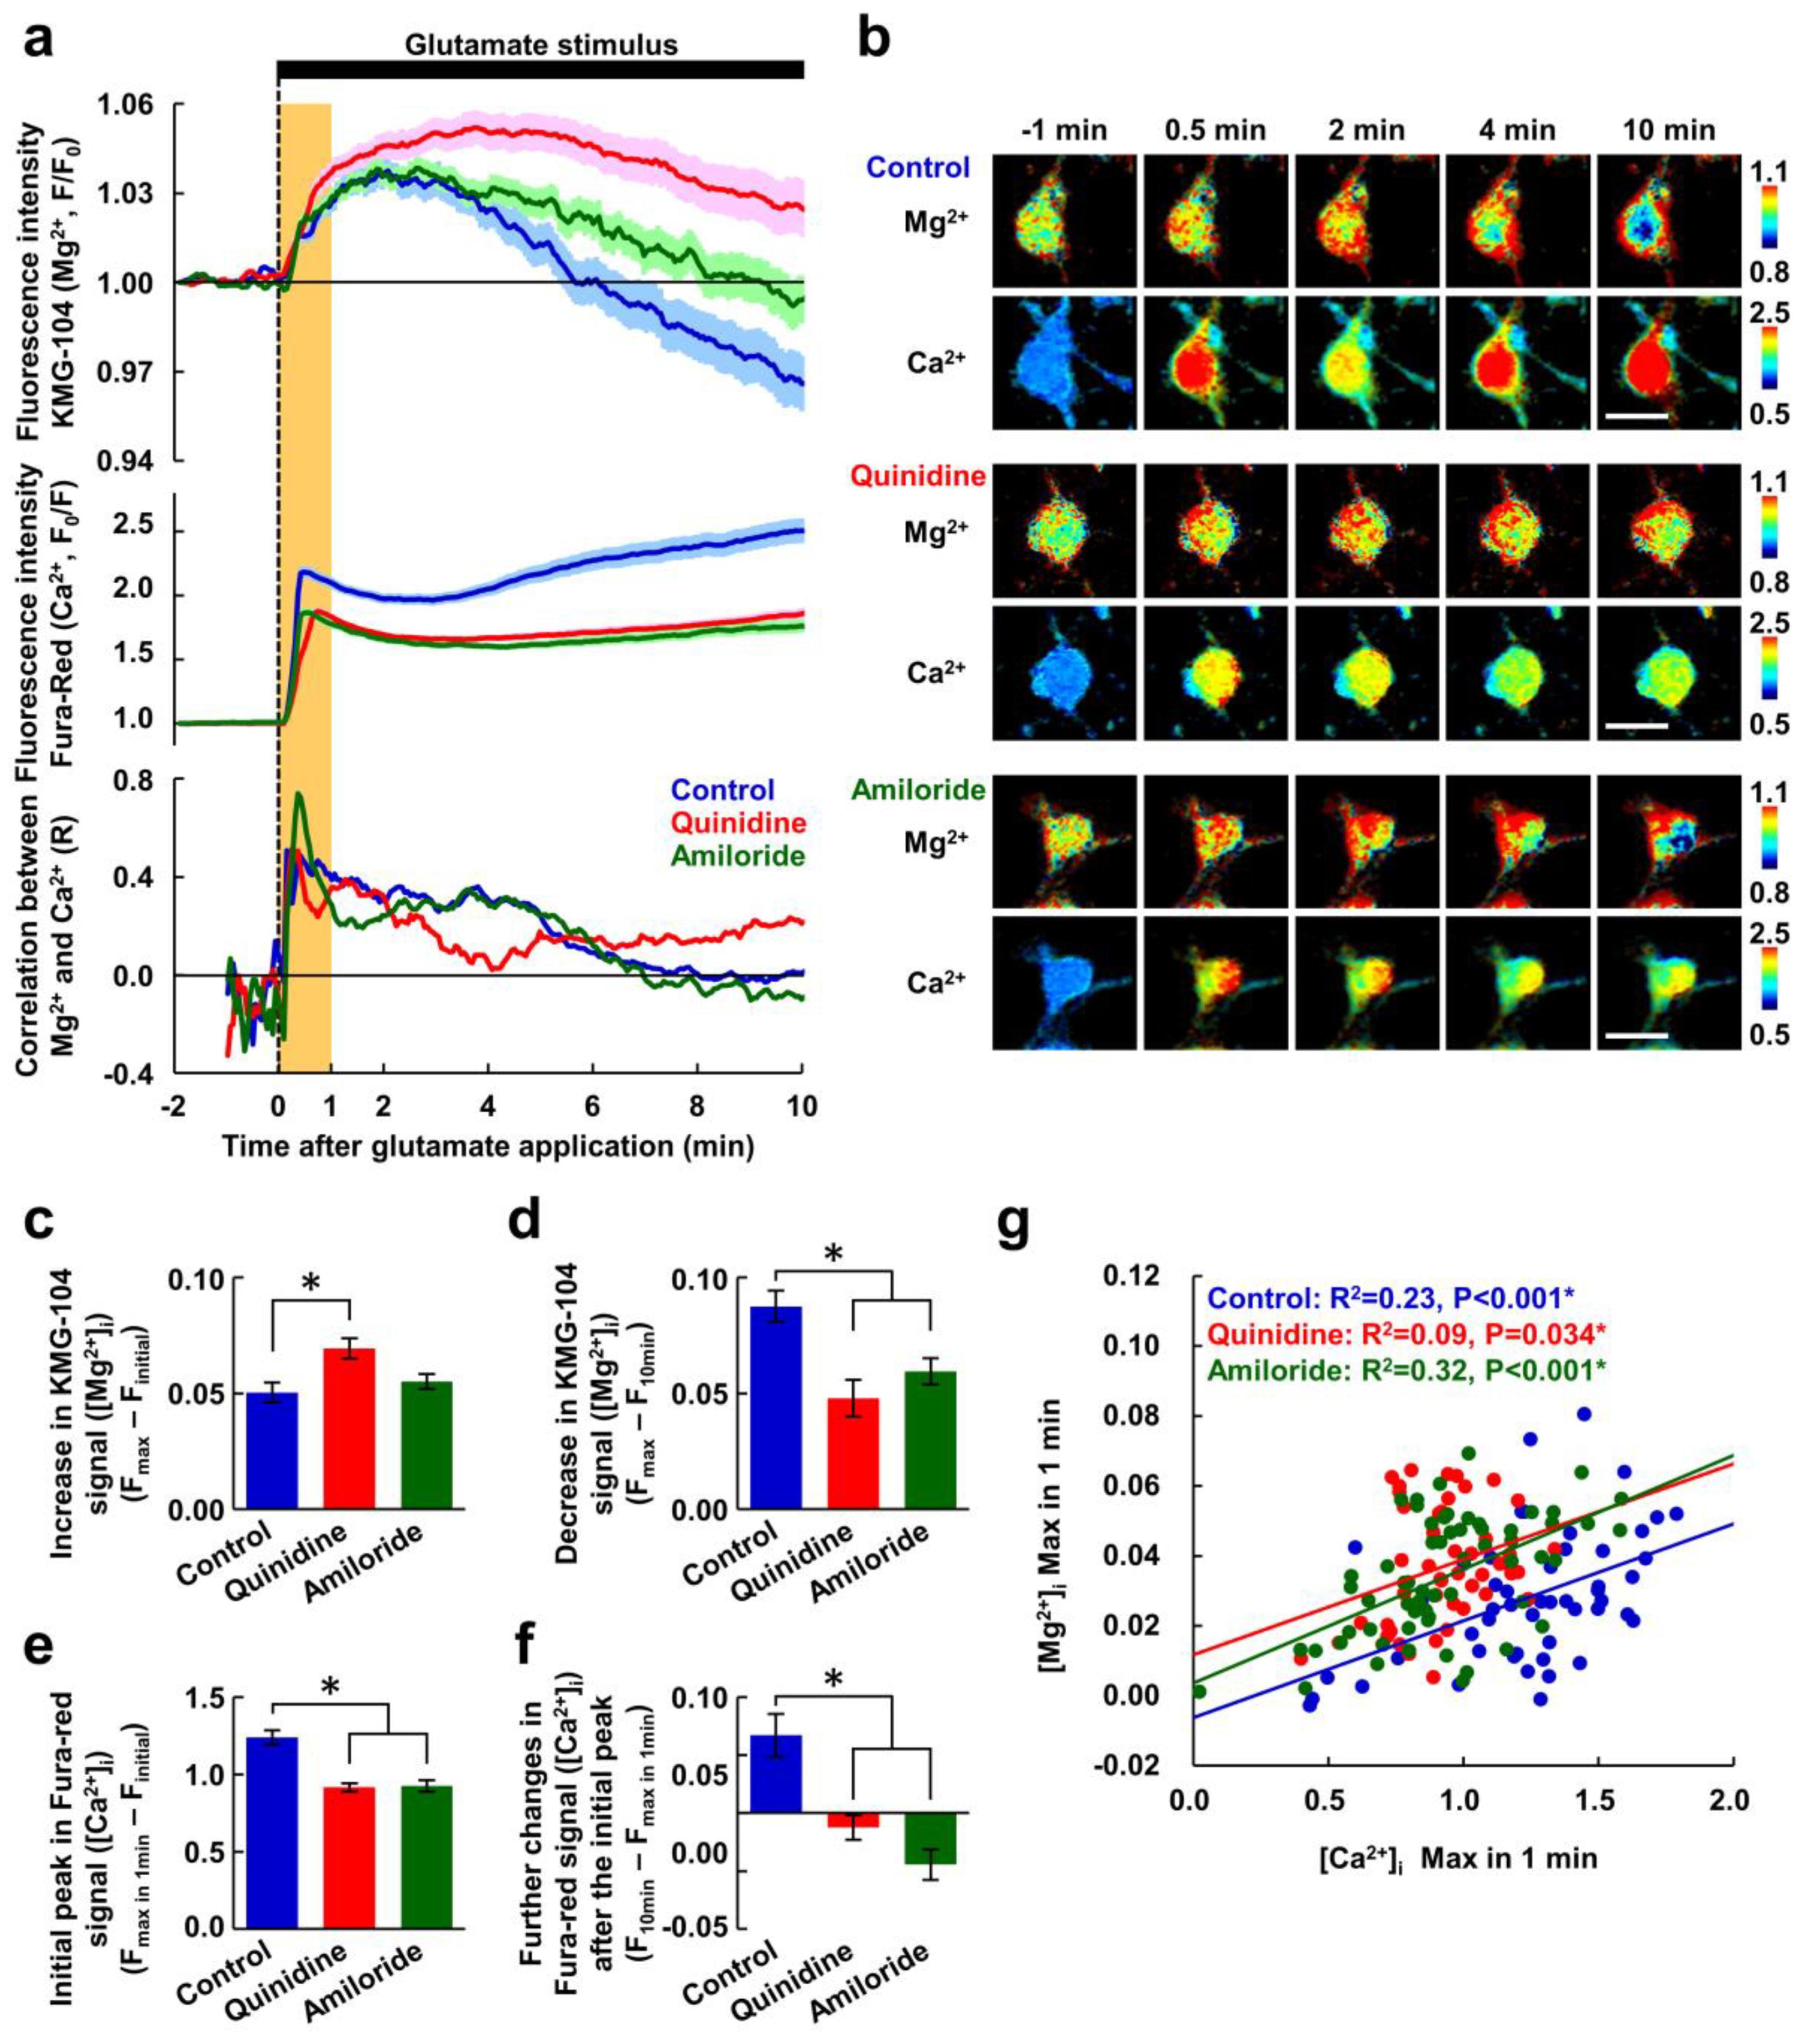
To confirm the effects of the inhibitors on cellular ion transports immediately after the application of glutamate stimulus, [Mg2+]i and [Ca2+]i were simultaneously visualized using KMG-104 and Fura-Red, respectively. The glutamate stimulus elicited a gradual increase in [Mg2+]i and a steep increase in [Ca2+]i, after which [Mg2+]i began to decrease. Within 10 min, [Mg2+]i in the control was below the initial concentration (Figure 2a). Quinidine (200 μM) and amiloride (500 μM) partially suppressed both the [Mg2+]i decrease and the [Ca2+]i increase, but did not suppress the [Mg2+]i increase (Figure 2a,b). Distributions of the increases in [Mg2+]i and [Ca2+]i were different (Figure 2b). In addition, no morphological changes such as cell body rounding or neurite fragmentation were observed, indicating that the neurons are still alive at 10 min. Quinidine enhanced the [Mg2+]i increase (Figure 2c), and both quinidine and amiloride suppressed the Mg2+ decrease (Figure 2d). This indicates that glutamate stimulus simultaneously induced both Mg2+ mobilization and Mg2+ extrusion, which restricts amplitude of the increase in [Mg2+]i. As a result, neurons maintained a higher [Mg2+]i level in the presence of the inhibitors than that in the control during the ten-minute exposure to glutamate stimulus. The inhibitors also partially attenuated the [Ca2+]i peak observed within 1 min of the addition of the glutamate stimulus (Figure 2e). Following the initial peak, while the neurons in the control exhibited a further gradual increase in [Ca2+]i to a level higher than the initial peak, in the presence of the inhibitors, [Ca2+]i showed plateau after 4 min and did not exceed the initial peak level (Figure 2a middle panel,b,f). This was probably due to suppression of the Ca2+ influx via the voltage-gated Ca2+ channels (VGCC) by the higher [Mg2+]i [34].
Under all three conditions, the changes in [Mg2+]i and [Ca2+]i were well correlated with each other immediately after the application of glutamate stimulus, and the correlation coefficient decreased with time (Figure 2a bottom panel). To further analyze the relationship between the [Ca2+]i increase and the increasing phase of [Mg2+]i, we examined the correlation of the [Mg2+]i and [Ca2+]i maxima observed within 1 min of glutamate stimulus (Figure 2g). These correlated well in control neurons, because the increase in [Mg2+]i is triggered by the increase in [Ca2+]i as previously shown [26]. In the presence of the inhibitors, these maxima were still correlated, and although their regression lines shifted upward, they were almost parallel with each other (Figure 2g). This indicates that the inhibitors attenuated the [Ca2+]i response, without affecting the Mg2+ response, immediately after the stimulus.
3.3. Neurons Extruded Mg2+ in Response to the Glutamate Stimulus
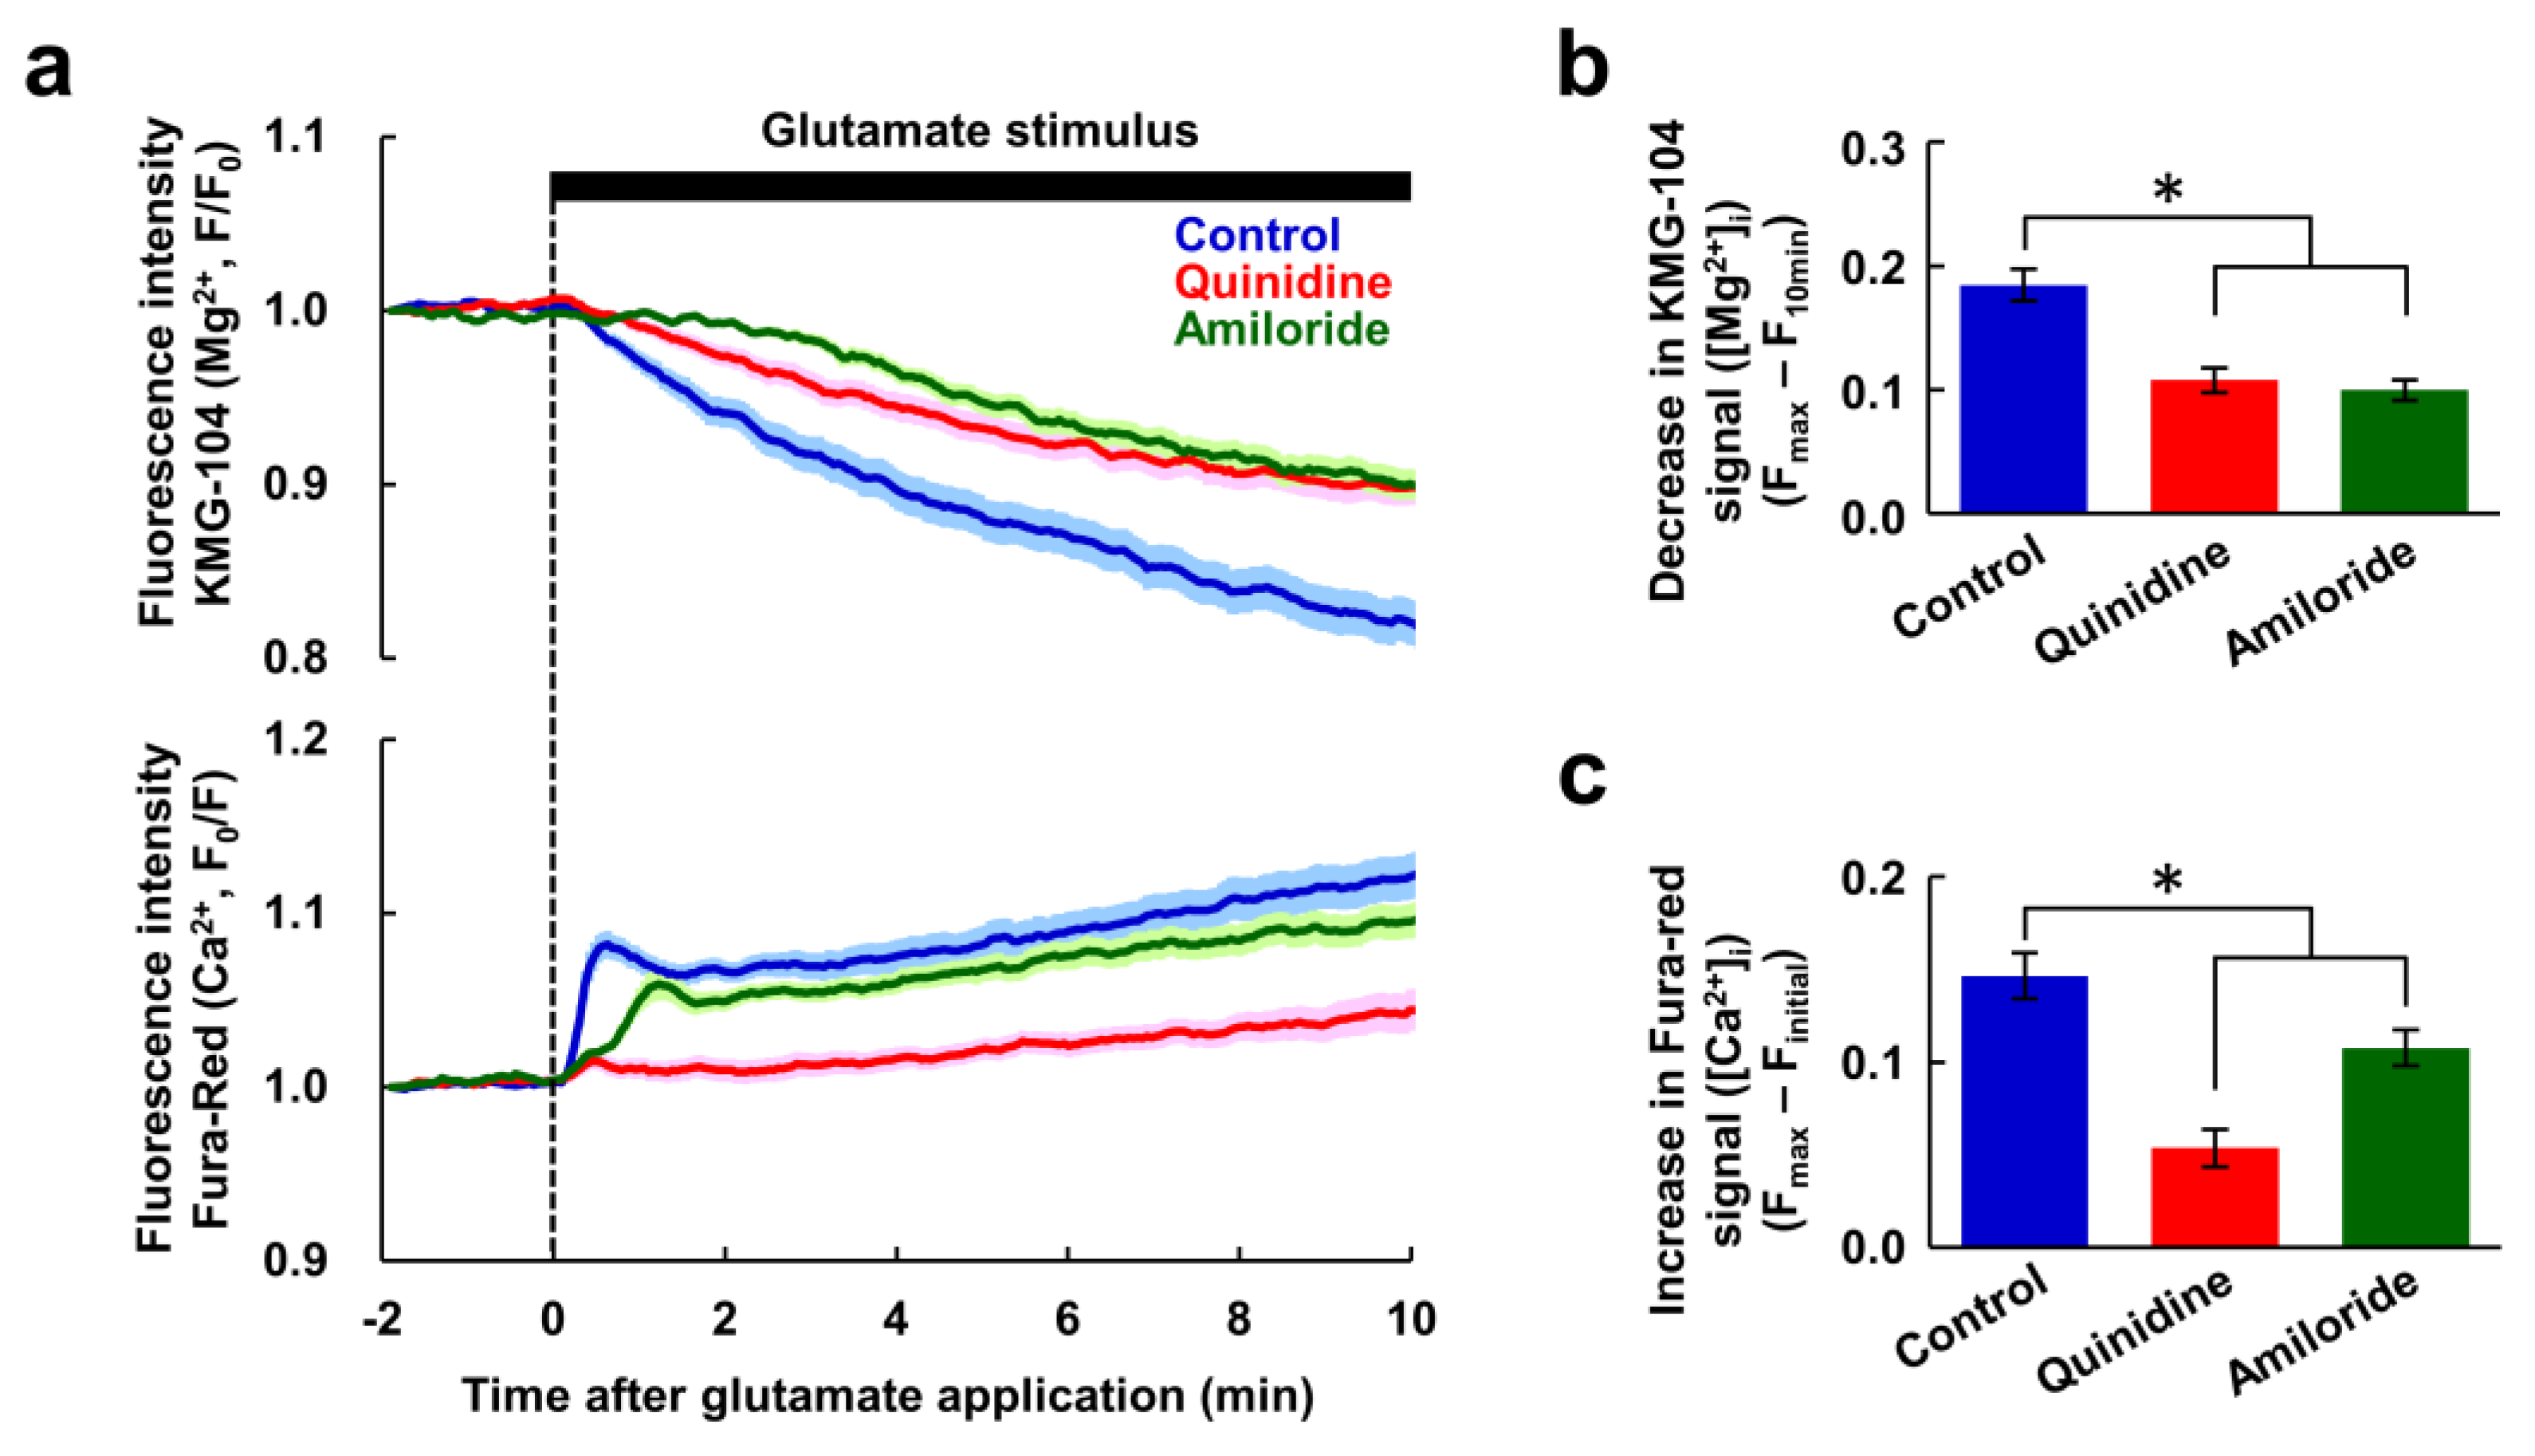
Next, we investigated whether the Ca2+ signal is a prerequisite for the Mg2+ extrusion. To do this, glutamate-induced responses were observed in nominally Ca2+-free conditions. Under this conditions, there was only a small [Ca2+]i response, and the [Mg2+]i increase was completely abolished. However the decrease in [Mg2+]i remained (Figure 3a). Combined with Figure 2g, this suggests that the [Mg2+]i increasing phase is Ca2+-dependent event. Both quinidine and amiloride suppressed this Mg2+ decrease to a similar extent (Figure 3b). Quinidine abolished the small [Ca2+]i increase evoked by the glutamate stimulus, and amiloride partially attenuated it (Figure 3c). This suggests that both inhibitors affect the glutamate-induced Ca2+ mobilization other than Ca2+ influx from extracellular medium. This might have some contribution to the attenuation of glutamate-induced Ca2+ response by these inhibitors shown in Figure 2. These results also indicate that the decrease in [Mg2+]i does not require the preceding [Mg2+]i and [Ca2+]i increases. This means that the [Mg2+]i-decreasing phase is not a homeostatic cellular response attempting to maintain a normal [Mg2+]i, but rather a glutamate-induced activation of Mg2+ extrusion via channels and/or transporters, and that this occurs in response to a neuronal excitation or an intracellular signal other than Ca2+. Taken together, these results indicate that glutamate stimulus induces both Ca2+-dependent Mg2+ release from the mitochondria and Mg2+ extrusion from the cytosol, simultaneously.
3.4. Effect of the Inhibition of the Mg2+ Extrusion on Cellular Energy Metabolism
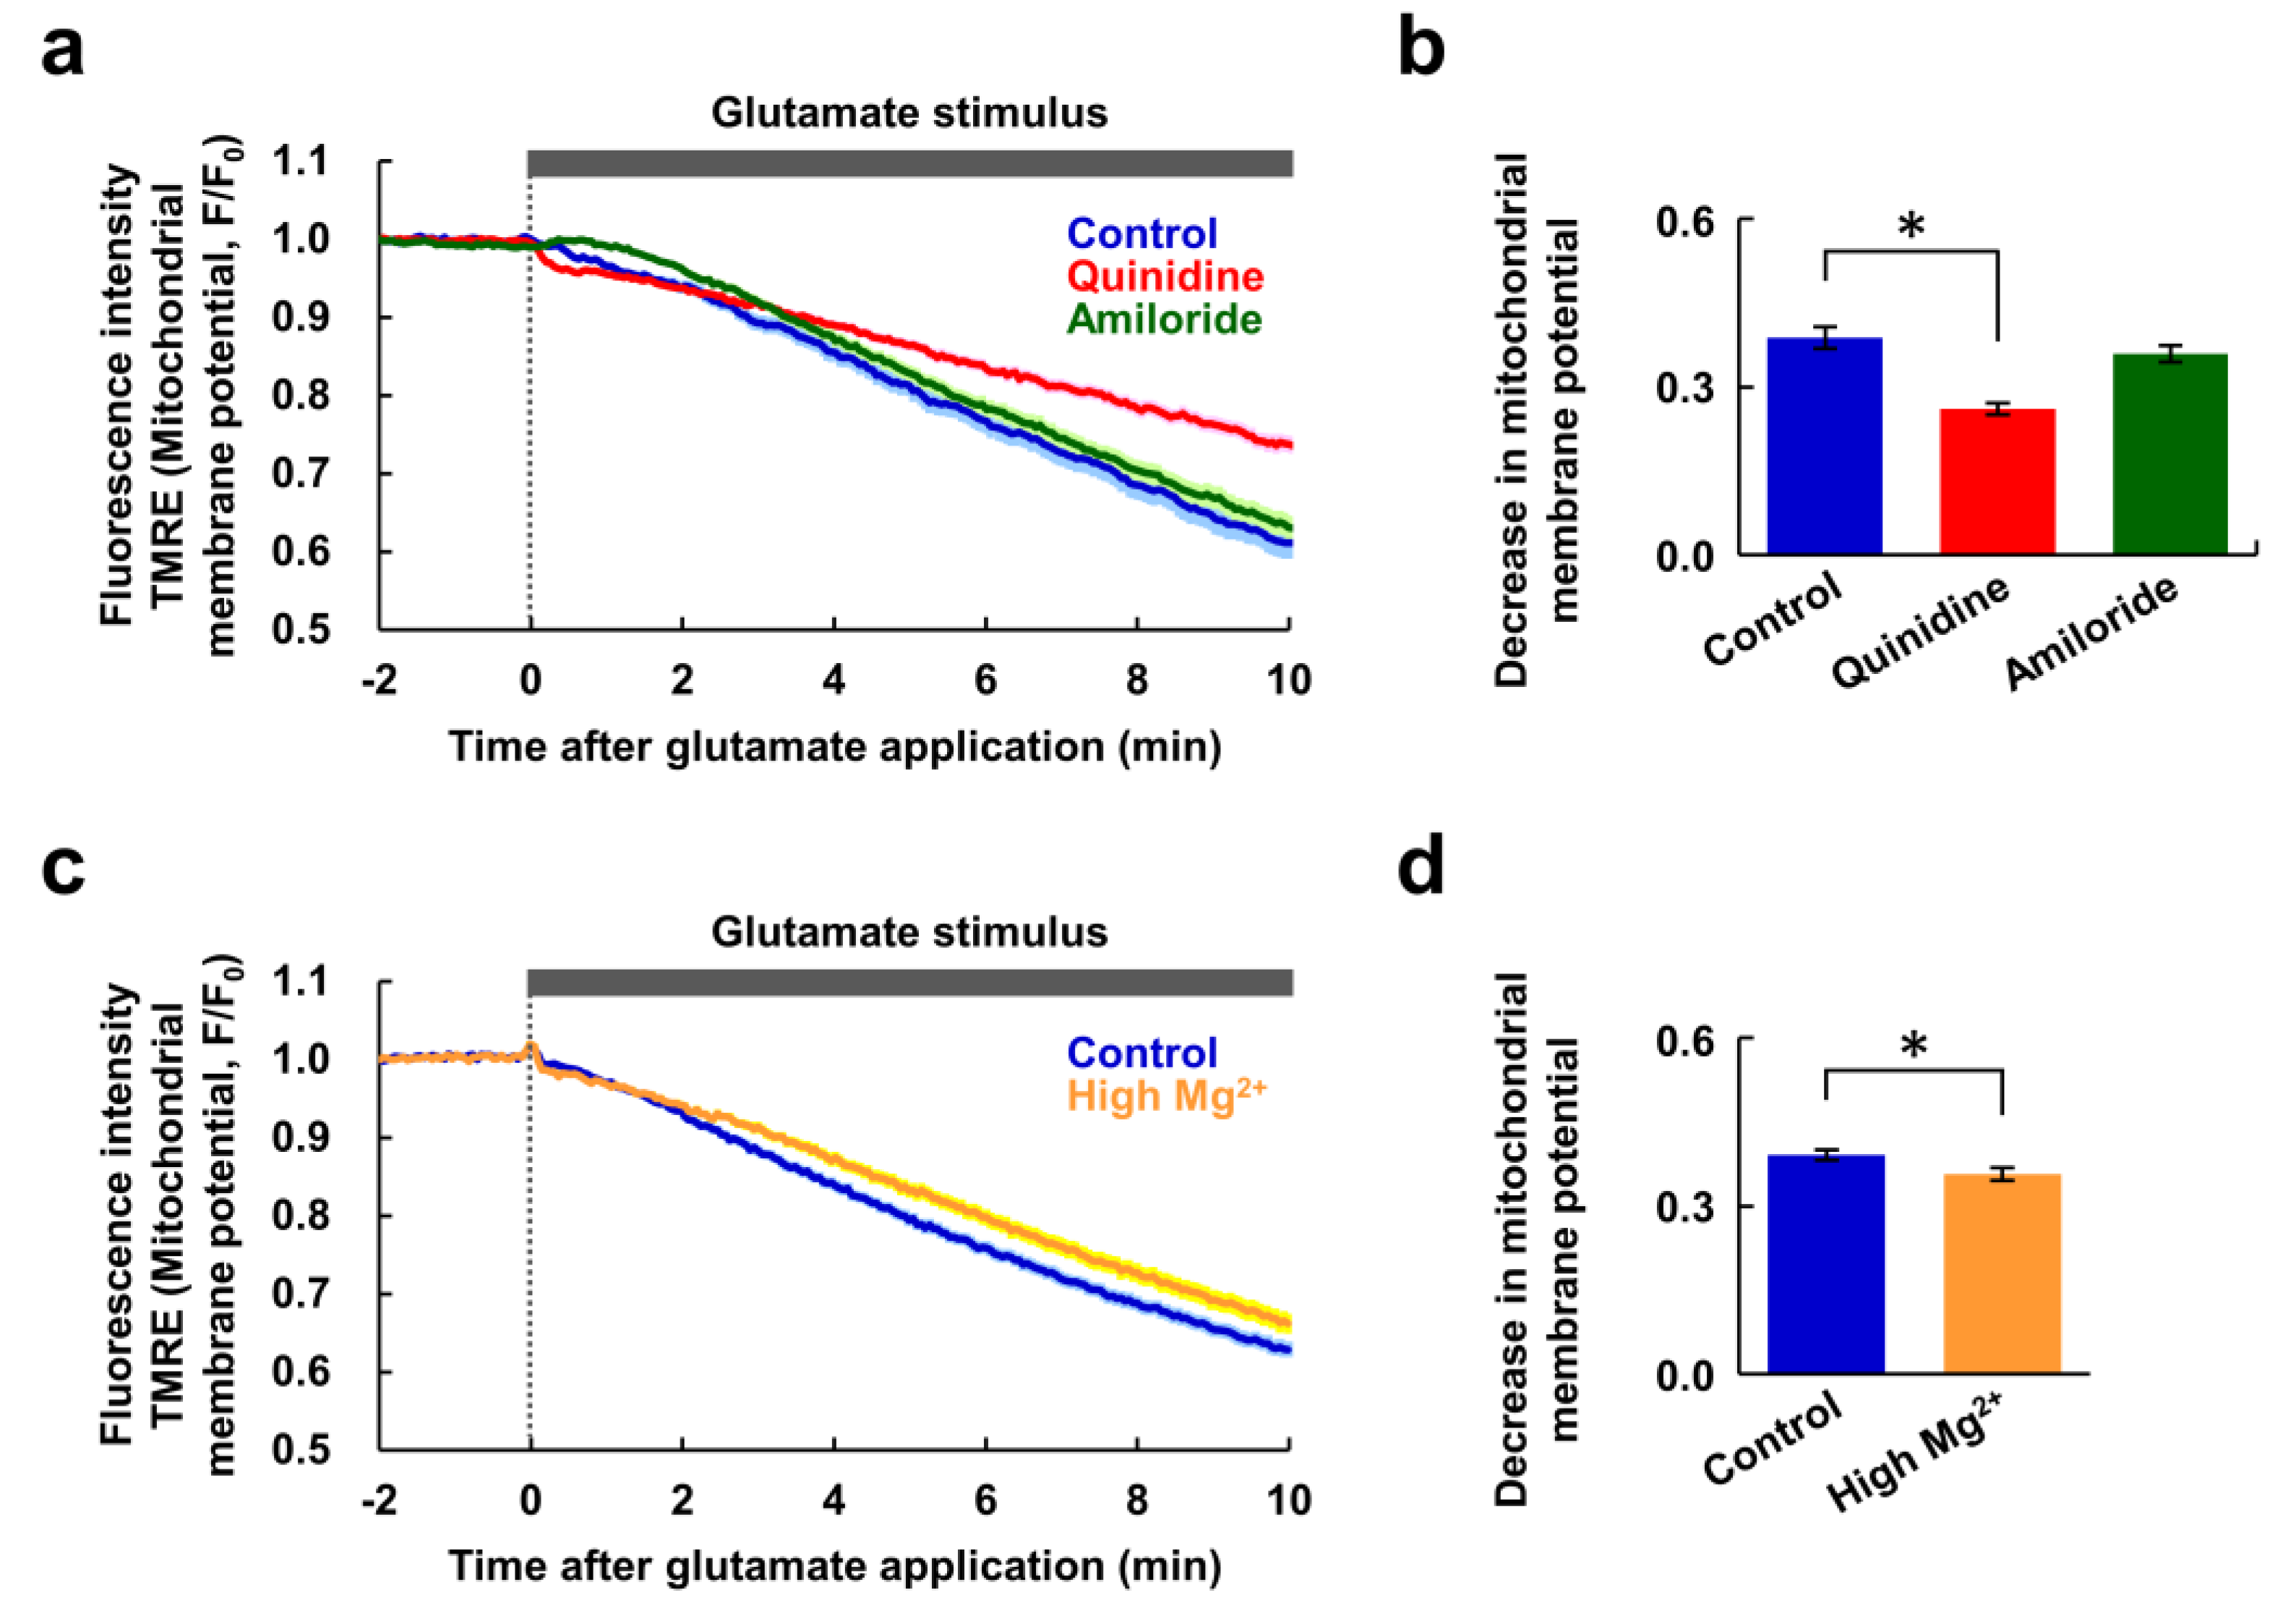
Next, we investigated whether inhibitors of Mg2+ extrusion had any effect on cellular energy metabolism. Since mitochondria play a central role in neuronal ATP synthesis, changes in mitochondrial membrane potential during glutamate stimulus were measured. In response to the glutamate stimulus, mitochondrial membrane potential decreased gradually (Figure 4a). It was still decreasing at 10 min, indicating the neurons still alive at this point. Quinidine partially attenuated this decrease, but amiloride had no effect on it (Figure 4b). Thus, although these inhibitors attenuated the glutamate-induced [Ca2+]i increase to the same extent (Figure 2), amiloride did not suppress the depolarization of mitochondrial membrane potential. To further confirm the contribution of Mg2+ for maintenance of mitochondrial membrane potential, glutamate stimulus-induced changes in the mitochondrial membrane potential under high Mg2+ conditions were compared to those under normal conditions. High Mg2+ partially attenuated the decrease in mitochondrial membrane potential (Figure 4c,d), presumably by keeping [Mg2+]i high. This supports the idea that Mg2+ has a protective effect on depolarization of mitochondrial membrane potential.
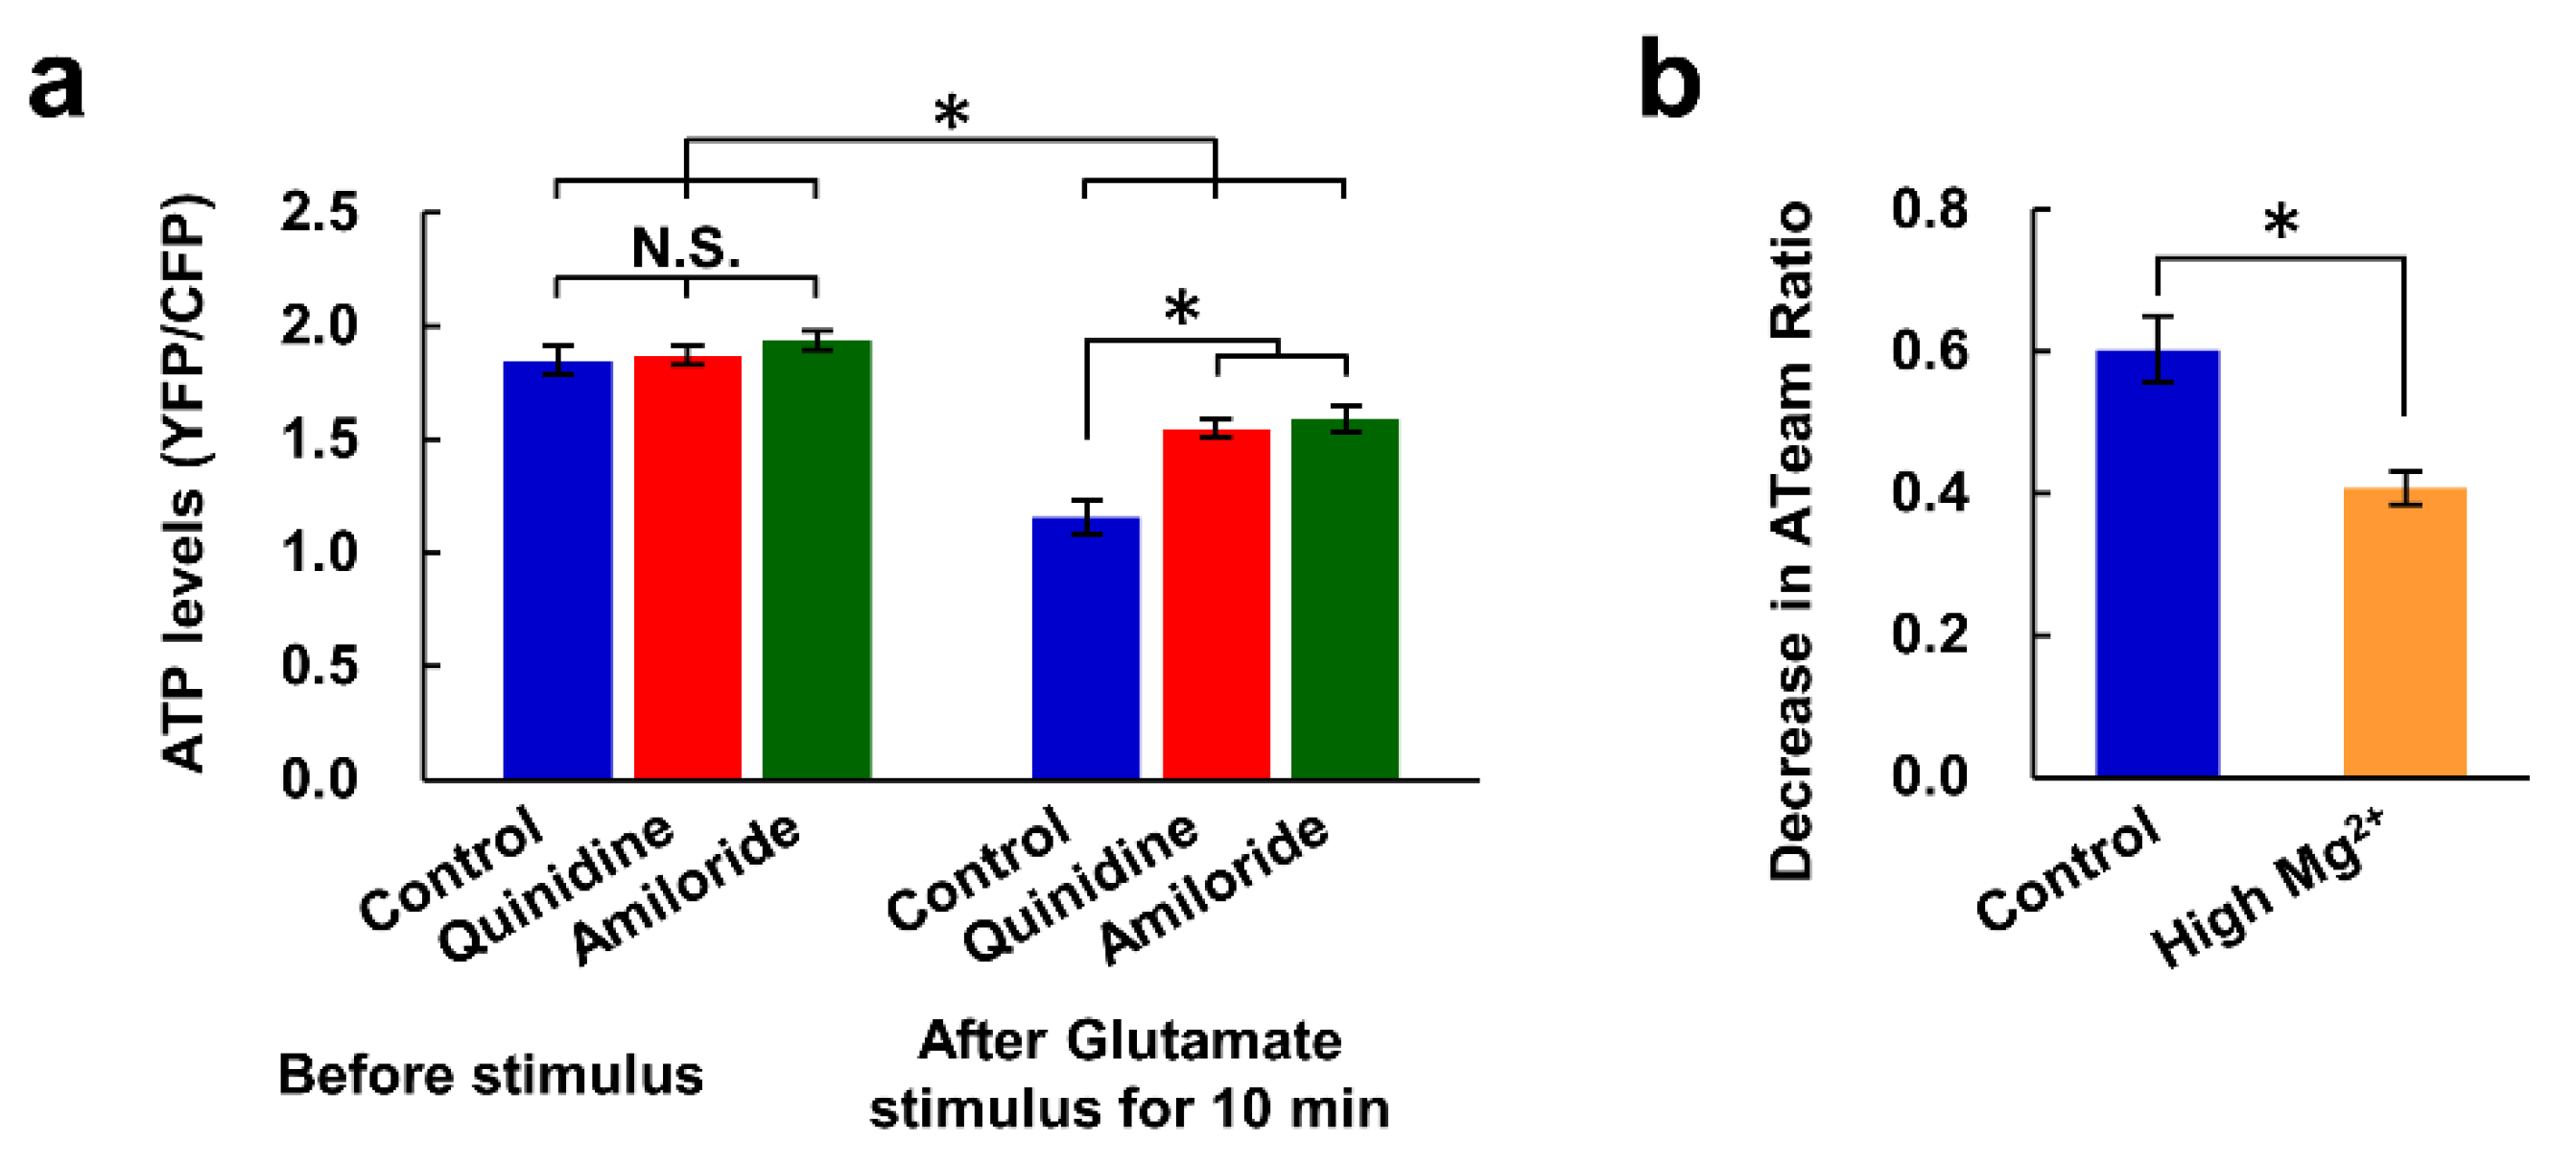
We also investigated whether the inhibition of Mg2+ extrusion and the resulting high [Mg2+]i lead to the maintenance of cellular ATP concentrations during the excitotoxicity process. Intracellular ATP concentrations were compared using a genetically encoded ATP sensor, ATeam [31]. The presence of quinidine or amiloride did not affect ATP levels in steady-state neurons, but both inhibitors partially attenuated the decrease in ATP levels evoked by the glutamate stimulus (Figure 5a). High Mg2+ also suppressed the glutamate-induced decrease in ATP level (Figure 5b). These results suggest that the high [Mg2+]i resulting from the inhibition of Mg2+ extrusion contributes to the maintenance of intracellular ATP levels.
3.5. Involvement of mTOR in the Attenuation of Excitotoxicity by Mg2+
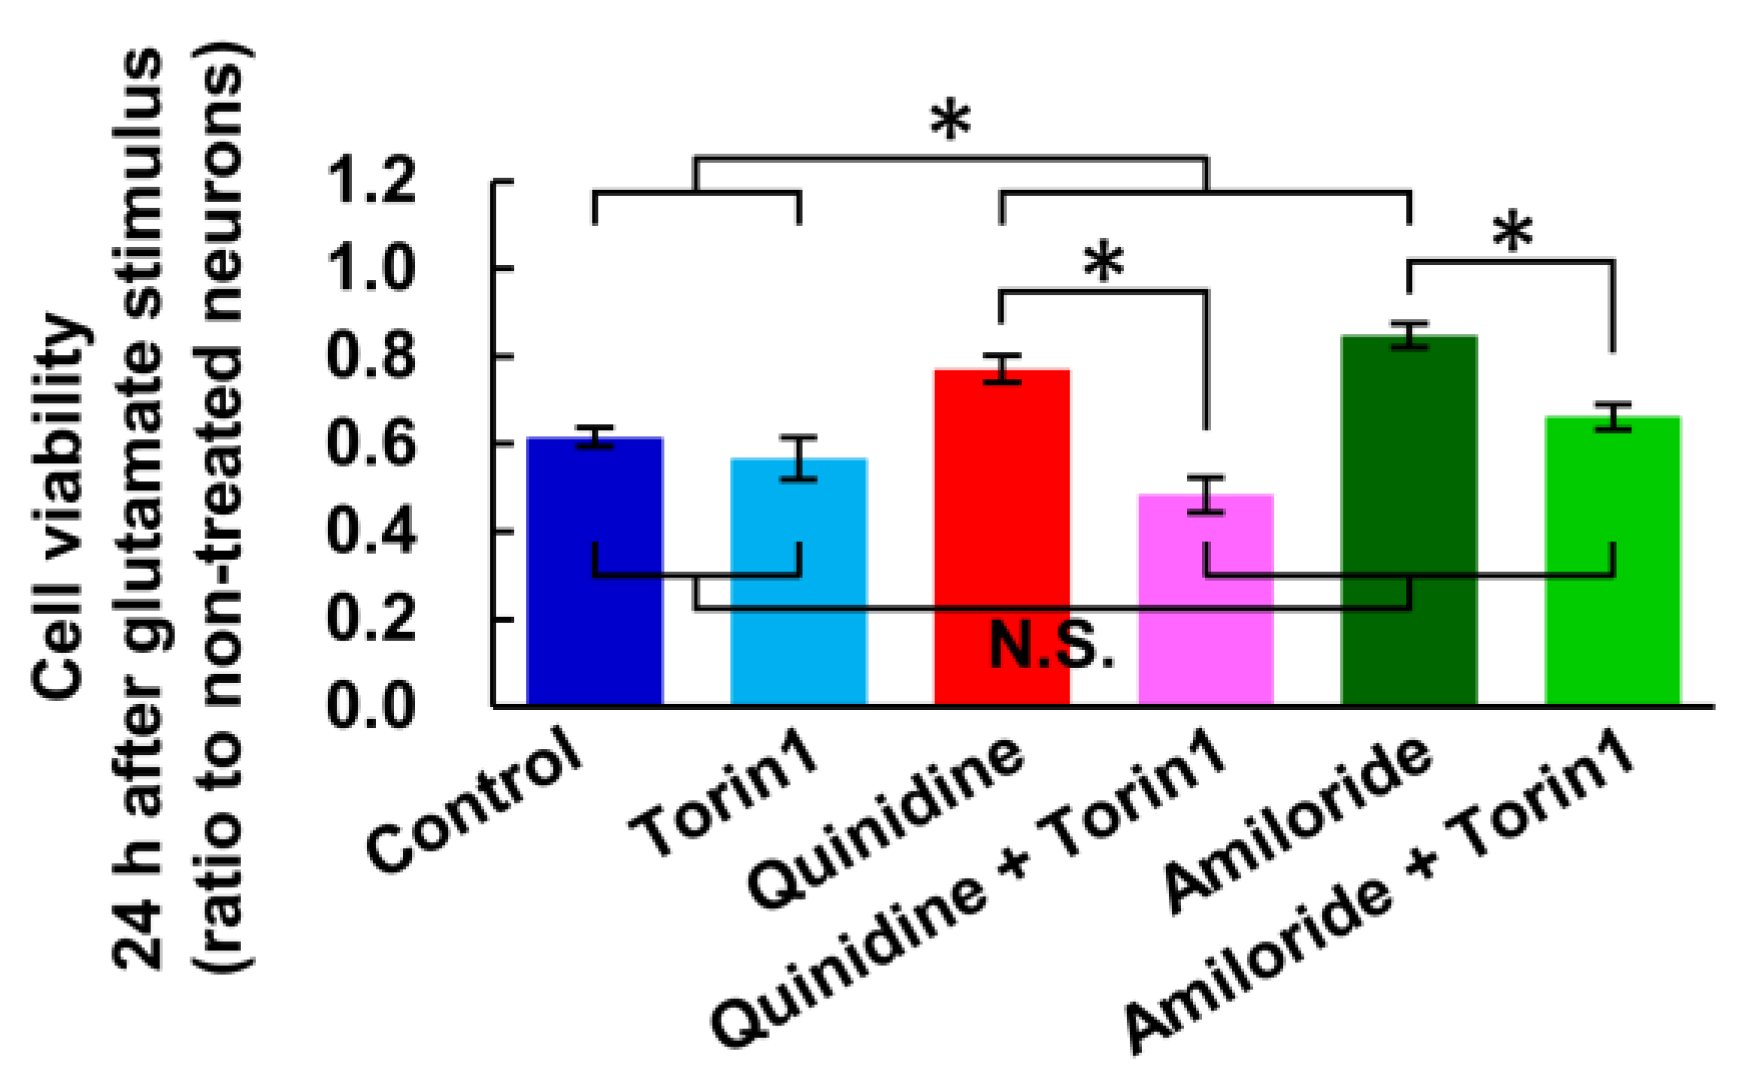
In the previous study, we demonstrated that increase in [Mg2+]i activates mTOR in cultured hippocampal neurons [23]. mTOR is an important signal implicated in the regulation of energy metabolism, cell growth and cell death [35,36]. We therefore examined the effect of mTOR inhibitor, Torin1, on the glutamate-induced neuronal cells death and its attenuation by the inhibitors of Mg2+ extrusion, according to the procedure shown in Figure 1a. While torin1 did not enhance the toxicity of glutamate stimulus, it abolished the attenuation of the toxicity by quinidine or amiloride (Figure 6). This suggests that the mTOR signal is involved in the attenuation of excitotoxicity by increasing [Mg2+]i.
4. Discussion
In this study, we demonstrated that inhibitors of Mg2+ extrusion attenuate glutamate excitotoxicity in cultured rat hippocampal neurons (Figure 1). A toxic concentration of glutamate induced Mg2+ extrusion from neurons, which was suppressed by both quinidine and amiloride (Figure 2 and Figure 3). These inhibitors also attenuated the glutamate-induced depression of cellular energy metabolism (Figure 5). The protective effect of those inhibitors against excitotoxicity was abolished by inhibition of mTOR (Figure 6). While quinidine and amiloride partially attenuated the glutamate-evoked [Ca2+]i response (Figure 2e,f), in particular, mobilization of Ca2+ from other than extracellular medium (Figure 3), they did not suppress the increasing phase of the [Mg2+]i transient (Figure 2c), in spite of its Ca2+-dependency (Figure 2g and Figure 3). Amiloride also had no effect on the glutamate-induced mitochondrial depolarization (Figure 4), despite attenuating the cytosolic Ca2+ increase (Figure 2e,f). Given that the depolarization of mitochondrial membrane potential is a critical event in the process of excitotoxicity [27], the partial attenuation of the [Ca2+]i increase by the amiloride does not affect glutamate excitotoxicity. Therefore, the neuroprotective effect of the inhibitors is probably due to the maintenance of high [Mg2+]i during the glutamate stimulus. This idea is also supported by the results that glutamate-induced decrease in mitochondrial membrane potential and cytosolic ATP level were partially attenuated under high Mg2+ conditions (Figure 4c,d and Figure 5b), presumably by keeping [Mg2+]i high. Our data therefore indicate the importance of Mg2+ regulation in neuronal cell death and survival.
One of the key roles of Mg2+ in ensuring cell survival involves the regulation of mitochondrial functions [37]. It affects enzymatic activities in the tricarboxylic acid (TCA) cycle in mitochondria; thus, a decrease in mitochondrial Mg2+ concentration results in a downregulation of mitochondrial membrane potential and ATP synthesis [38,39,40]. On the other hand, extra-mitochondrial Mg2+ suppresses mitochondrial Ca2+ uptake [41] which depolarizes mitochondrial membrane potential. Either or both of these processes might contribute to the attenuation of mitochondrial membrane potential depolarization by quinidine (Figure 4) and the suppression of the decrease in ATP levels caused by quinidine and amiloride (Figure 5). The idea that elevated [Mg2+]i contributes to the maintenance of cellular ATP levels was also supported by our previous work [42]. Although amiloride did not inhibit the depolarization of mitochondrial membrane potential (Figure 4), it did suppress the decrease in ATP levels and cell death (Figure 1 and Figure 5). This suggests that Mg2+ affects not only mitochondrial functions but also other mechanisms that are involved in maintaining the cellular ATP concentration and cell viability.
One of the ways in which Mg2+ might do this is by regulating intracellular signal transductions [17]. In particular, mTOR is considered an important downstream target of Mg2+ [18,19,43]. The mTOR pathway is implicated in the regulation of cellular metabolism and proliferation [36]. In pancreatic cancer cells, overexpression of SLC41A1, a membrane protein for Mg2+ extrusion [32], and the resulting low [Mg2+]i, inhibited the Akt/mTOR pathway and cancer proliferation [44]. In cultured hippocampal neurons, [Mg2+]i within the physiological concentration range is correlated with mTOR activity [23]. These findings strongly suggest that Mg2+ is a key regulator of mTOR and mTOR-related signal transductions. Inhibition of the Akt/mTOR pathway in cultured neurons in response to toxic concentrations of glutamate has been reported [45]. This inhibition might result from the glutamate-induced decrease in [Mg2+]i demonstrated in this study (Figure 2 and Figure 3). The fact that the Akt/mTOR signal is also involved in regulation of both cellular ATP synthesis and also apoptotic signals [35,46,47] would explain why maintaining a high [Mg2+]i prevent neuronal cell death. In this study, we showed that inhibition of mTOR abolished the attenuation of glutamate excitotoxicity by inhibiting Mg2+ extrusion (Figure 6). This suggests that maintaining high [Mg2+]i protect neurons against excitotoxicity via the mTOR signal.
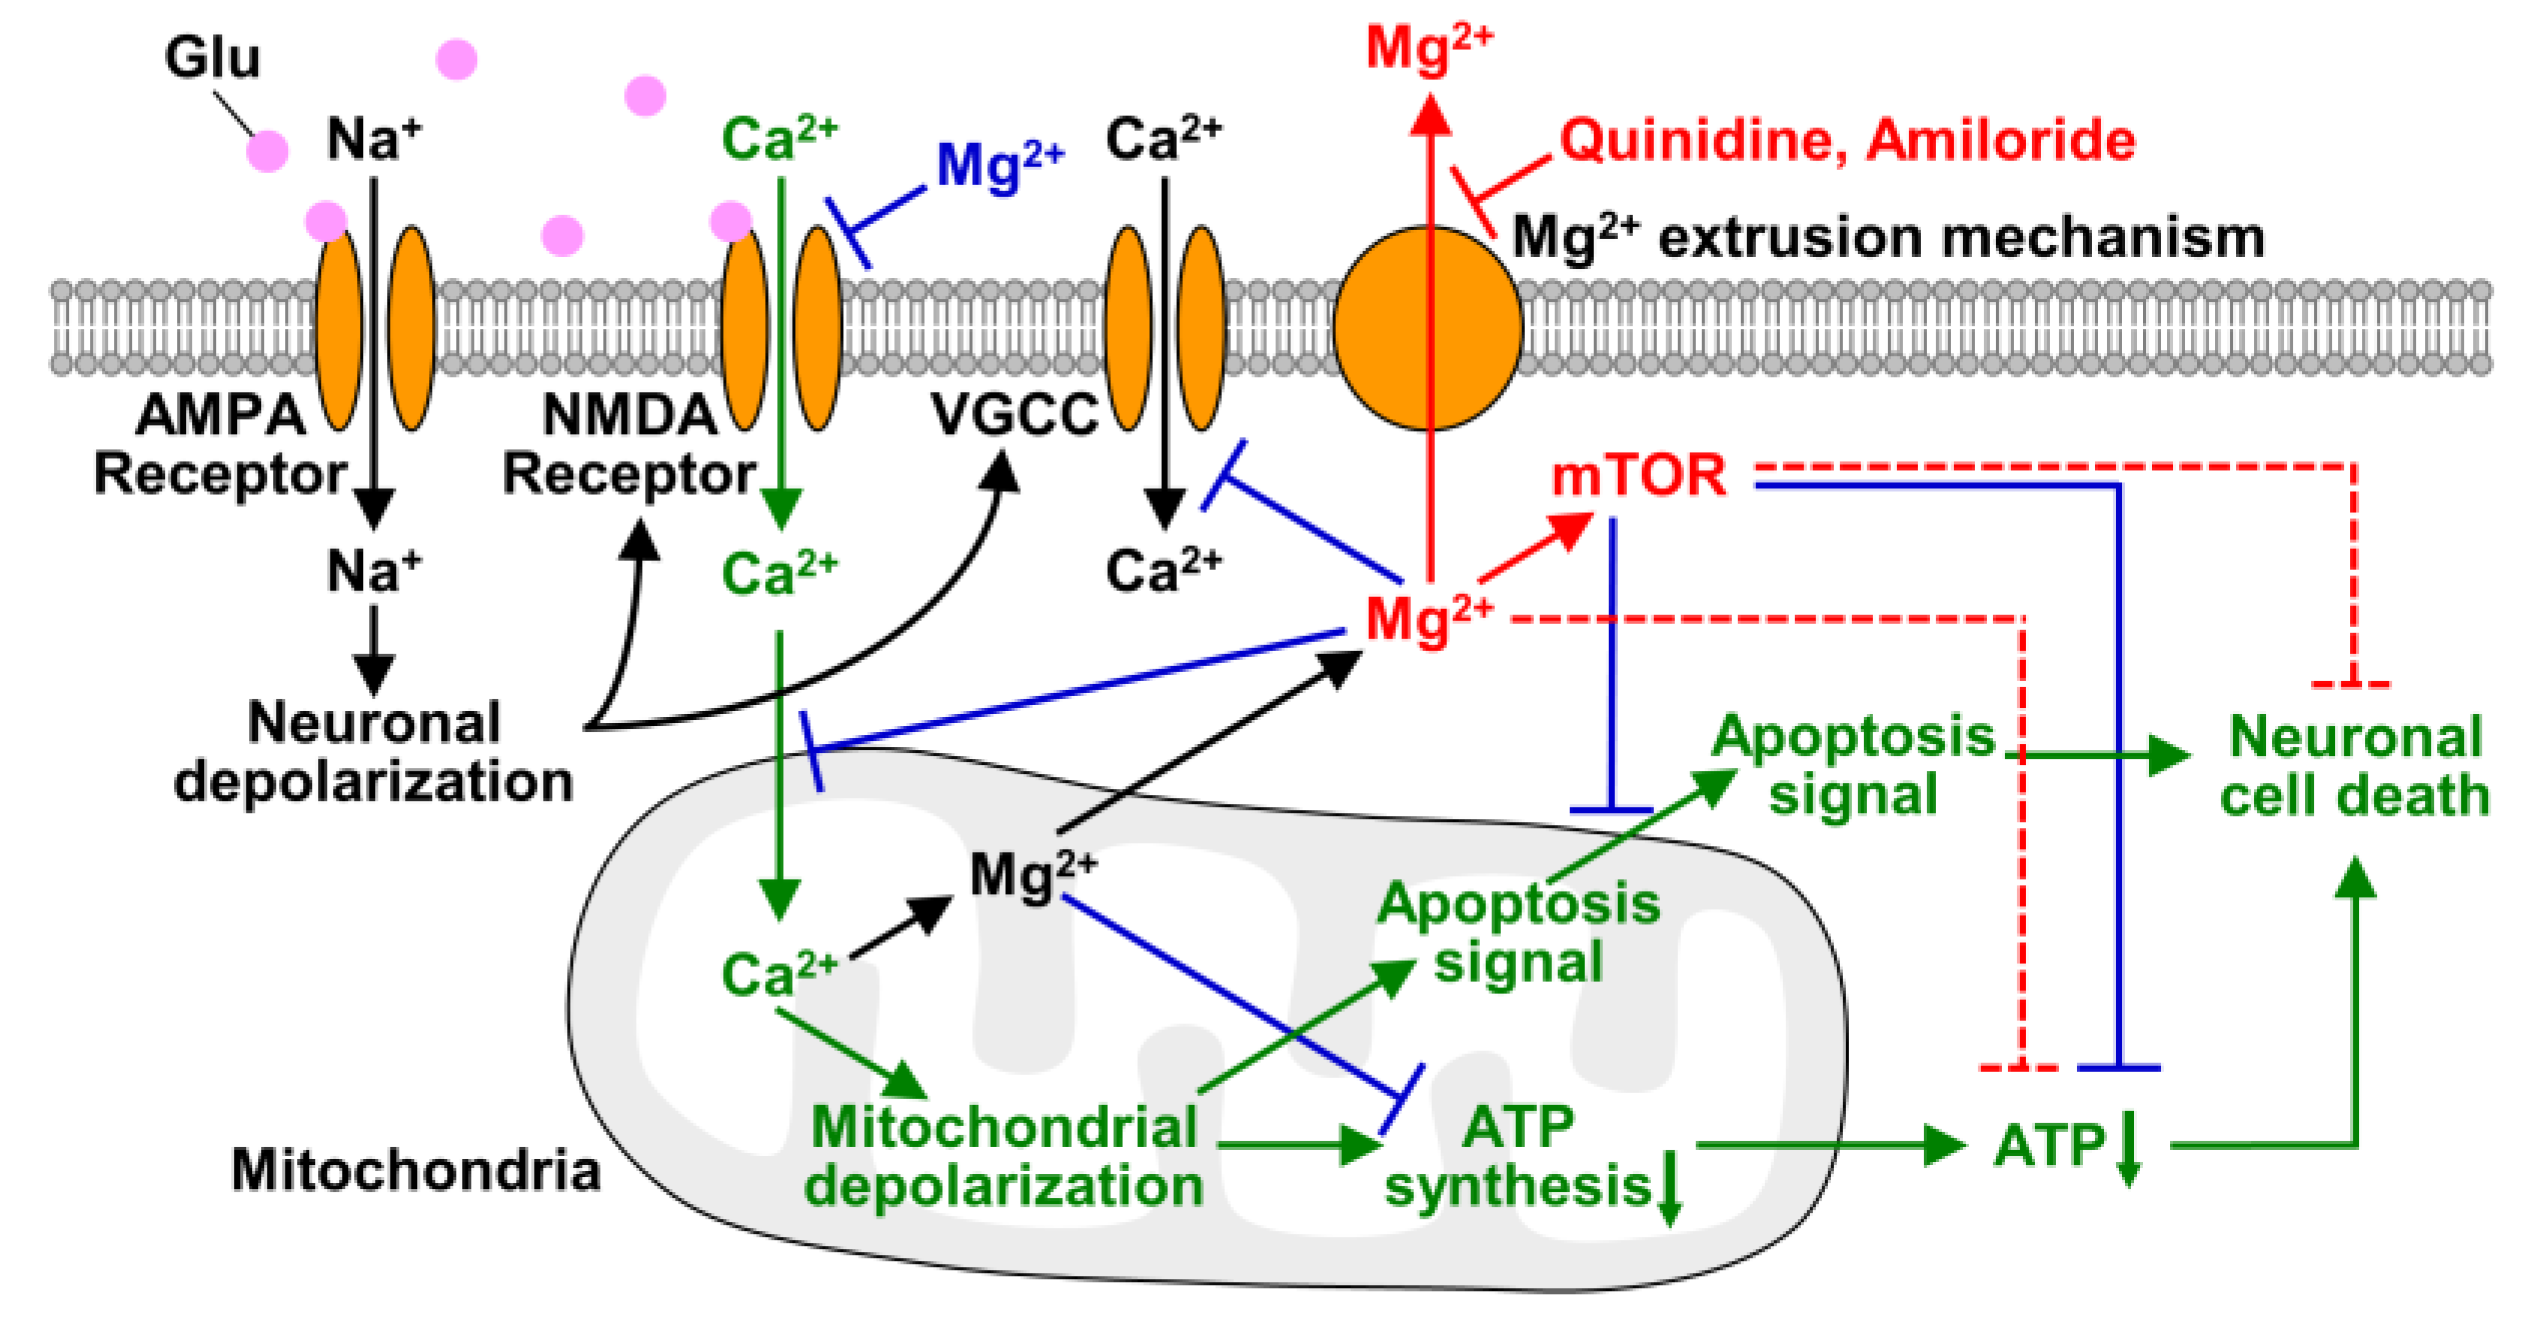
As discussed above and summarized in Figure 7, Mg2+ is a key factor in saving neurons from neurodegenerative diseases. Since inhibition of cellular Mg2+ extrusion and resulting maintenance of high [Mg2+]i protect cells from neurodegenerative disorders, the Mg2+ extrusion mechanisms might be a therapeutic target for neuronal diseases. Among Mg2+ channels and transporters, SLC41A1 is considered to be the major transporter for cellular Mg2+ extrusion [32,48], while it was also suggested that cells has several different mechanisms for extruding cytosolic Mg2+ [49]. Preventing cellular Mg2+ loss by inhibiting such transporters might delay the progression of neurodegeneration. Because Mg2+ is a broad-spectrum regulator of cellular metabolisms and signaling, change in [Mg2+]i affects multiple aspects of the process of excitotoxicity, even though it is not a main signal for inducing neuronal cell death (Figure 7). In present study, we have demonstrated that keeping Mg2+ inside cells is important for neuronal survival under conditions of cellular stress. It may protect neurons from neurodegeneration also in vivo because it has been reported that gain-of-function mutation in SLC41A1, that leads to enhanced Mg2+ release from cytosol, and mutation in a Mg2+ and Ca2+ permeable channel, TRPM7, that attenuates cellular Mg2+ uptake, are associated with the pathogenesis of neurodegenerative diseases in human brain [50,51]. To support this, further studies on Mg2+ dynamics in vivo are needed. Our results demonstrated in this study suggest the potential of cellular Mg2+ homeostasis and the Mg2+ transport system for therapy and the prevention of neurodegenerative diseases.
Supplementary Materials
The following are available online at https://0-www-mdpi-com.brum.beds.ac.uk/2072-6643/12/9/2768/s1, Figure S1: Immunofluorescence images of a synapse marker.
Author Contributions
Data curation, Y.S.; Formal analysis, Y.S. and R.Y.; Funding acquisition, K.O.; Project administration, K.O.; Supervision, K.O.; Writing—original draft, Y.S.; Writing—review & editing, R.Y., K.H. and K.O. All authors have read and agreed to the published version of the manuscript.
Funding
This research was funded by JSPS KAKENHI Grant Number 16H01751 and Life Innovation Platform (LIP) YOKOHAMA.
Acknowledgments
We thank H. Imamura and H. Noji for providing the ATeam plasmid.
Conflicts of Interest
The authors declare no conflict of interest.
References
- Yamanaka, R.; Shindo, Y.; Oka, K. Magnesium Is a Key Player in Neuronal Maturation and Neuropathology. Int. J. Mol. Sci. 2019, 20, 3439. [Google Scholar] [CrossRef] [Green Version]
- Kirkland, A.; Sarlo, G.; Holton, K. The Role of Magnesium in Neurological Disorders. Nutrients 2018, 10, 730. [Google Scholar] [CrossRef] [Green Version]
- Slutsky, I.; Abumaria, N.; Wu, L.J.; Huang, C.; Zhang, L.; Li, B.; Zhao, X.; Govindarajan, A.; Zhao, M.G.; Zhuo, M.; et al. Enhancement of Learning and Memory by Elevating Brain Magnesium. Neuron 2010, 65, 165–177. [Google Scholar] [CrossRef] [PubMed] [Green Version]
- Jia, S.; Liu, Y.; Shi, Y.; Ma, Y.; Hu, Y.; Wang, M.; Li, X. Elevation of Brain Magnesium Potentiates Neural Stem Cell Proliferation in the Hippocampus of Young and Aged Mice. J. Cell. Physiol. 2016, 231, 1903–1912. [Google Scholar] [CrossRef] [PubMed]
- Andrási, E.; Páli, N.; Molnár, Z.; Kösel, S. Brain aluminum, magnesium and phosphorus contents of control and Alzheimer-diseased patients. J. Alzheimer’s Dis. 2005, 7, 273–284. [Google Scholar]
- Yasui, M.; Kihira, T.; Ota, K. Calcium, magnesium and aluminum concentrations in Parkinson’s disease. Neurotoxicology 1992, 13, 593–600. [Google Scholar] [PubMed]
- Oyanagi, K.; Kawakami, E.; Kikuchi-Horie, K.; Ohara, K.; Ogata, K.; Takahama, S.; Wada, M.; Kihira, T.; Yasui, M. Magnesium deficiency over generations in rats with special references to the pathogenesis of the parkinsonism-dementia complex and amyotrophic lateral sclerosis of Guam. Neuropathology 2006, 26, 115–128. [Google Scholar] [CrossRef]
- Hashimoto, T.; Nishi, K.; Nagasao, J.; Tsuji, S.; Oyanagi, K. Magnesium exerts both preventive and ameliorating effects in an in vitro rat Parkinson disease model involving 1-methyl-4-phenylpyridinium (MPP+) toxicity in dopaminergic neurons. Brain Res. 2008, 1197, 143–151. [Google Scholar] [CrossRef]
- Shen, Y.; Dai, L.; Tian, H.; Xu, R.; Li, F.; Li, Z.; Zhou, J.; Wang, L.; Dong, J.; Sun, L. Treatment of Magnesium-L-Threonate Elevates the Magnesium Level in the Cerebrospinal Fluid and Attenuates Motor Deficits and Dopamine Neuron Loss in a Mouse Model of Parkinson’s disease. Neuropsychiatr. Dis. Treat. 2019, 15, 3143–3153. [Google Scholar] [CrossRef] [Green Version]
- Shindo, Y.; Yamanaka, R.; Suzuki, K.; Hotta, K.; Oka, K. Altered expression of Mg2+ transport proteins during Parkinson’s disease-like dopaminergic cell degeneration in PC12 cells. Biochim. Biophys. Acta Mol. Cell Res. 2016, 1863, 1979–1984. [Google Scholar] [CrossRef]
- Li, W.; Yu, J.; Liu, Y.; Huang, X.; Abumaria, N.; Zhu, Y.; Huang, X.; Xiong, W.; Ren, C.; Liu, X.G.; et al. Elevation of brain magnesium prevents synaptic loss and reverses cognitive deficits in Alzheimer’s disease mouse model. Mol. Brain 2014, 7, 1–20. [Google Scholar] [CrossRef] [PubMed] [Green Version]
- Romani, A.M.P. Cellular magnesium homeostasis. Arch. Biochem. Biophys. 2011, 512, 1–23. [Google Scholar] [CrossRef] [PubMed] [Green Version]
- de Baaij, J.H.F.; Hoenderop, J.G.J.; Bindels, R.J.M. Magnesium in Man: Implications for Health and Disease. Physiol. Rev. 2015, 95, 1–46. [Google Scholar] [CrossRef] [PubMed]
- Kubota, T.; Shindo, Y.; Tokuno, K.; Komatsu, H.; Ogawa, H.; Kudo, S.; Kitamura, Y.; Suzuki, K.; Oka, K. Mitochondria are intracellular magnesium stores: Investigation by simultaneous fluorescent imagings in PC12 cells. Biochim. Biophys. Acta Mol. Cell Res. 2005, 1744, 19–28. [Google Scholar] [CrossRef] [Green Version]
- Quamme, G.A. Molecular identification of ancient and modern mammalian magnesium transporters. Am. J. Physiol. Physiol. 2010, 298, C407–C429. [Google Scholar] [CrossRef] [Green Version]
- Nadler, M.J.S.; Hermosura, M.C.; Inabe, K.; Perraud, A.-L.; Zhu, Q.; Stokes, A.J.; Kurosaki, T.; Kinet, J.-P.; Penner, R.; Scharenberg, A.M.; et al. LTRPC7 is a Mg·ATP-regulated divalent cation channel required for cell viability. Nature 2001, 411, 590–595. [Google Scholar] [CrossRef]
- Li, F.Y.; Chaigne-Delalande, B.; Kanellopoulou, C.; Davis, J.C.; Matthews, H.F.; Douek, D.C.; Cohen, J.I.; Uzel, G.; Su, H.C.; Lenardo, M.J. Second messenger role for Mg2+ revealed by human T-cell immunodeficiency. Nature 2011, 475, 471–476. [Google Scholar] [CrossRef]
- Feeney, K.A.; Hansen, L.L.; Putker, M.; Olivares-Yañez, C.; Day, J.; Eades, L.J.; Larrondo, L.F.; Hoyle, N.P.; O’Neill, J.S.; van Ooijen, G. Daily magnesium fluxes regulate cellular timekeeping and energy balance. Nature 2016, 532, 375–379. [Google Scholar] [CrossRef] [Green Version]
- Rubin, H. The logic of the Membrane, Magnesium, Mitosis (MMM) model for the regulation of animal cell proliferation. Arch. Biochem. Biophys. 2007, 458, 16–23. [Google Scholar] [CrossRef]
- Maeshima, K.; Matsuda, T.; Shindo, Y.; Imamura, H.; Tamura, S.; Imai, R.; Kawakami, S.; Nagashima, R.; Soga, T.; Noji, H.; et al. A Transient Rise in Free Mg2+ Ions Released from ATP-Mg Hydrolysis Contributes to Mitotic Chromosome Condensation. Curr. Biol. 2018, 28, 444–451.e6. [Google Scholar] [CrossRef]
- Slutsky, I.; Sadeghpour, S.; Li, B.; Liu, G. Enhancement of Synaptic Plasticity through Chronically Reduced Ca2+ Flux during Uncorrelated Activity. Neuron 2004, 44, 835–849. [Google Scholar] [CrossRef] [Green Version]
- Nowak, L.; Bregestovski, P.; Ascher, P.; Herbet, A.; Prochiantz, A. Magnesium gates glutamate-activated channels in mouse central neurones. Nature 1984, 307, 462–465. [Google Scholar] [CrossRef] [PubMed]
- Yamanaka, R.; Shindo, Y.; Hotta, K.; Suzuki, K.; Oka, K. GABA-Induced Intracellular Mg2+ Mobilization Integrates and Coordinates Cellular Information Processing for the Maturation of Neural Networks. Curr. Biol. 2018, 28, 3984–3991.e5. [Google Scholar] [CrossRef] [PubMed] [Green Version]
- Yamanaka, R.; Shindo, Y.; Hotta, K.; Suzuki, K.; Oka, K. NO/cGMP/PKG signaling pathway induces magnesium release mediated by mitoK ATP channel opening in rat hippocampal neurons. FEBS Lett. 2013, 587, 2643–2648. [Google Scholar] [CrossRef] [PubMed] [Green Version]
- Yamanaka, R.; Shindo, Y.; Karube, T.; Hotta, K.; Suzuki, K.; Oka, K. Neural depolarization triggers Mg2+ influx in rat hippocampal neurons. Neuroscience 2015, 310, 731–741. [Google Scholar] [CrossRef] [PubMed]
- Shindo, Y.; Fujimoto, A.; Hotta, K.; Suzuki, K.; Oka, K. Glutamate-induced calcium increase mediates magnesium release from mitochondria in rat hippocampal neurons. J. Neurosci. Res. 2010, 88, 3125–3132. [Google Scholar] [CrossRef]
- Abramov, A.Y.; Duchen, M.R. Mechanisms underlying the loss of mitochondrial membrane potential in glutamate excitotoxicity. Biochim. Biophys. Acta Bioenerg. 2008, 1777, 953–964. [Google Scholar] [CrossRef] [Green Version]
- Rueda, C.B.; Llorente-Folch, I.; Traba, J.; Amigo, I.; Gonzalez-Sanchez, P.; Contreras, L.; Juaristi, I.; Martinez-Valero, P.; Pardo, B.; del Arco, A.; et al. Glutamate excitotoxicity and Ca2+-regulation of respiration: Role of the Ca2+ activated mitochondrial transporters (CaMCs). Biochim. Biophys. Acta Bioenerg. 2016, 1857, 1158–1166. [Google Scholar] [CrossRef]
- Komatsu, H.; Iwasawa, N.; Citterio, D.; Suzuki, Y.; Kubota, T.; Tokuno, K.; Kitamura, Y.; Oka, K.; Suzuki, K. Design and Synthesis of Highly Sensitive and Selective Fluorescein-Derived Magnesium Fluorescent Probes and Application to Intracellular 3D Mg2+ Imaging. J. Am. Chem. Soc. 2004, 126, 16353–16360. [Google Scholar] [CrossRef]
- Trapani, V.; Farruggia, G.; Marraccini, C.; Iotti, S.; Cittadini, A.; Wolf, F.I. Intracellular magnesium detection: Imaging a brighter future. Analyst 2010, 135, 1855–1866. [Google Scholar] [CrossRef]
- Imamura, H.; Huynh Nhat, K.P.; Togawa, H.; Saito, K.; Iino, R.; Kato-Yamada, Y.; Nagai, T.; Noji, H. Visualization of ATP levels inside single living cells with fluorescence resonance energy transfer-based genetically encoded indicators. Proc. Natl. Acad. Sci. USA 2009, 106, 15651–15656. [Google Scholar] [CrossRef] [PubMed] [Green Version]
- Kolisek, M.; Nestler, A.; Vormann, J.; Schweigel-Röntgen, M. Human gene SLC41A1 encodes for the Na+/Mg2+ exchanger. Am. J. Physiol. Physiol. 2012, 302, C318–C326. [Google Scholar] [CrossRef] [PubMed] [Green Version]
- Cefaratti, C.; Romani, A.; Scarpa, A. Characterization of two Mg2+ transporters in sealed plasma membrane vesicles from rat liver. Am. J. Physiol. Physiol. 1998, 275, C995–C1008. [Google Scholar] [CrossRef] [PubMed] [Green Version]
- Brunet, S.; Scheuer, T.; Catterall, W.A. Cooperative regulation of Cav12 channels by intracellular Mg2+, the proximal C-terminal EF-hand, and the distal C-terminal domain. J. Gen. Physiol. 2009, 134, 81–94. [Google Scholar] [CrossRef] [Green Version]
- Zheng, X.; Boyer, L.; Jin, M.; Kim, Y.; Fan, W.; Bardy, C.; Berggren, T.; Evans, R.M.; Gage, F.H.; Hunter, T. Alleviation of neuronal energy deficiency by mTOR inhibition as a treatment for mitochondria-related neurodegeneration. eLife 2016, 5, 1–23. [Google Scholar] [CrossRef]
- Saxton, R.A.; Sabatini, D.M. mTOR Signaling in Growth, Metabolism, and Disease. Cell 2017, 168, 960–976. [Google Scholar] [CrossRef] [Green Version]
- Pilchova, I.; Klacanova, K.; Tatarkova, Z.; Kaplan, P.; Racay, P. The Involvement of Mg2+ in Regulation of Cellular and Mitochondrial Functions. Oxid. Med. Cell. Longev. 2017, 2017, 6797460. [Google Scholar] [CrossRef] [Green Version]
- Yamanaka, R.; Tabata, S.; Shindo, Y.; Hotta, K.; Suzuki, K.; Soga, T.; Oka, K. Mitochondrial Mg2+ homeostasis decides cellular energy metabolism and vulnerability to stress. Sci. Rep. 2016, 6, 30027. [Google Scholar] [CrossRef]
- Panov, A.; Scarpa, A. Mg2+ Control of Respiration in Isolated Rat Liver Mitochondria. Biochemistry 1996, 35, 12849–12856. [Google Scholar] [CrossRef]
- Rodríguez-Zavala, J.S.; Moreno-Sánchez, R. Modulation of Oxidative Phosphorylation by Mg2+ in Rat Heart Mitochondria. J. Biol. Chem. 1998, 273, 7850–7855. [Google Scholar] [CrossRef] [Green Version]
- Boelens, A.D.; Pradhan, R.K.; Blomeyer, C.A.; Camara, A.K.S.; Dash, R.K.; Stowe, D.F. Extra-matrix Mg2+ limits Ca2+ uptake and modulates Ca2+ uptake–independent respiration and redox state in cardiac isolated mitochondria. J. Bioenerg. Biomembr. 2013, 45, 203–218. [Google Scholar] [CrossRef] [PubMed] [Green Version]
- Shindo, Y.; Yamanaka, R.; Suzuki, K.; Hotta, K.; Oka, K. Intracellular magnesium level determines cell viability in the MPP+ model of Parkinson’s disease. Biochim. Biophys. Acta Mol. Cell Res. 2015, 1853, 3182–3191. [Google Scholar] [CrossRef] [PubMed] [Green Version]
- Trapani, V.; Wolf, F.I. Dysregulation of Mg2+ homeostasis contributes to acquisition of cancer hallmarks. Cell Calcium 2019, 83, 102078. [Google Scholar] [CrossRef] [PubMed]
- Xie, J.; Cheng, C.; Zhu, X.Y.; Shen, Y.H.; Song, L.B.; Chen, H.; Chen, Z.; Liu, L.M.; Meng, Z.Q. Magnesium transporter protein solute carrier family 41 member 1 suppresses human pancreatic ductal adenocarcinoma through magnesium-dependent Akt/mTOR inhibition and bax-associated mitochondrial apoptosis. Aging (Albany NY) 2019, 11, 2681–2698. [Google Scholar] [CrossRef]
- Pomytkin, I.; Krasil’nikova, I.; Bakaeva, Z.; Surin, A.; Pinelis, V. Excitotoxic glutamate causes neuronal insulin resistance by inhibiting insulin receptor/Akt/mTOR pathway. Mol. Brain 2019, 12, 112. [Google Scholar] [CrossRef]
- Sponder, G.; Abdulhanan, N.; Fröhlich, N.; Mastrototaro, L.; Aschenbach, J.R.; Röntgen, M.; Pilchova, I.; Cibulka, M.; Racay, P.; Kolisek, M. Overexpression of Na+/Mg2+ exchanger SLC41A1 attenuates pro-survival signaling. Oncotarget 2018, 9, 5084–5104. [Google Scholar] [CrossRef] [Green Version]
- Hung, Y.P.; Teragawa, C.; Kosaisawe, N.; Gillies, T.E.; Pargett, M.; Minguet, M.; Distor, K.; Rocha-Gregg, B.L.; Coloff, J.L.; Keibler, M.A.; et al. Akt regulation of glycolysis mediates bioenergetic stability in epithelial cells. eLife 2017, 6, 1–25. [Google Scholar] [CrossRef]
- Schäffers, O.J.M.; Hoenderop, J.G.J.; Bindels, R.J.M.; de Baaij, J.H.F. The rise and fall of novel renal magnesium transporters. Am. J. Physiol. Physiol. 2018, 314, F1027–F1033. [Google Scholar] [CrossRef] [Green Version]
- Cefaratti, C.; Romani, A.M.P. Functional characterization of two distinct Mg2+ extrusion mechanisms in cardiac sarcolemmal vesicles. Mol. Cell. Biochem. 2007, 303, 63–72. [Google Scholar] [CrossRef]
- Kolisek, M.; Sponder, G.; Mastrototaro, L.; Smorodchenko, A.; Launay, P.; Vormann, J.; Schweigel-Röntgen, M. Substitution pA350V in Na+/Mg2+ Exchanger SLC41A1, Potentially Associated with Parkinson’s Disease, Is a Gain-of-Function Mutation. PLoS ONE 2013, 8, e71096. [Google Scholar] [CrossRef] [Green Version]
- Hermosura, M.C.; Nayakanti, H.; Dorovkov, M.V.; Calderon, F.R.; Ryazanov, A.G.; Haymer, D.S.; Garruto, R.M. A TRPM7 variant shows altered sensitivity to magnesium that may contribute to the pathogenesis of two Guamanian neurodegenerative disorders. Proc. Natl. Acad. Sci. USA 2005, 102, 11510–11515. [Google Scholar] [CrossRef] [PubMed] [Green Version]
Figure 1.
Inhibitors of Mg2+ extrusion attenuated excitotoxicity. (a) Experimental procedure of the MTT assay for measuring the effect of a ten-minute glutamate stimulus. Comparison of cell viability in the presence or absence of quinidine (200 μM) (b) or amiloride (500 μM) (c) (n = 30 for each). Error bars indicate SEM. * indicates p < 0.05 among all possible combinations by Tukey’s test. N.S. indicates no statistically significant difference.

Figure 2.
Inhibitors of Mg2+ extrusion suppressed the decreasing phase of the glutamate-induced Mg2+ transient. (a) Time-courses of [Mg2+]i (upper) and [Ca2+]i (middle) responses to the glutamate stimulus, and the correlation between them (bottom) in the presence or absence of inhibitor (blue: control, n = 52 cells; red: with quinidine at 200 μM, n = 48 cells; green: with amiloride at 500 μM, n = 64 cells; from 5 replicates each). Mg2+ and Ca2+ were simultaneously measured in the same neurons. Data are presented as the average (solid line) ± SEM (shaded area). The glutamate stimulus (100 μM glutamate with 10 μM glycine) was applied at 0 min (dotted line). The period 0–1 min is shaded orange. (b) Pseudo-colored images showing representative responses of Mg2+ and Ca2+ in each condition. Scale bars, 20 μm. Comparisons of amplitudes of increase in KMG-104 signal ([Mg2+]i) (c), decrease in KMG-104 signal ([Mg2+]i) (d), initial peak in Fura-red signal ([Ca2+]i) (e), and further changes in Fure-red signal ([Ca2+]i) after the initial peak (f) among the conditions extracted from the data shown in (a). Error bars indicate SEM. * indicates p < 0.05 compared with control by Dunnett’s test. (g) Scatter plot of maximum values of [Mg2+]i and [Ca2+]i within the first minute (orange area in Figure 2a) and their regression lines (blue: control; red: with quinidine; green: with amiloride). p values were determined from the correlation coefficient and the number of plots.

Figure 3.
The Mg2+ and Ca2+ increases were not required for Mg2+ extrusion. (a) Time-courses of [Mg2+]i (upper) and [Ca2+]i (bottom) response to glutamate stimulus in nominally Ca2+-free conditions in the presence or absence of inhibitor (blue: control, n = 60 cells; red: with quinidine at 200 μM, n = 52 cells; green: with amiloride at 500 μM, n = 54 cells, from 5 replicates each). Data are presented as the average (solid line) ± SEM (shaded area). Comparison of decrease in KMG-104 signal ([Mg2+]i) (b) and increase in Fura-red signal ([Ca2+]i) (c) at 10 min after application of the glutamate stimulus extracted from the data shown in (a). Error bars indicate SEM. * indicates p < 0.05 compared with control by Dunnett’s test.

Figure 4.
Changes in mitochondrial membrane potential in response to glutamate stimulus. (a) Time-courses of changes in mitochondrial membrane potential in response to the glutamate stimulus (blue: control, n = 90 cells; red: with quinidine at 200 μM, n = 89 cells; green: with amiloride at 500 μM, n = 100 cells, from 5 replicates each). Data are presented as the average (solid line) ± SEM (shaded area). (b) Comparison of decreases in mitochondrial membrane potential after 10 min extracted from the data shown in (a). Error bars indicate SEM. * indicates p < 0.05 compared with control by Dunnett’s test. (c) Time-courses of changes in mitochondrial membrane potential in response to the glutamate stimulus (blue: control, n = 75 cells; yellow: under high Mg2+ (8 mM) condition, n = 80 cells, from 5 replicates each). Data are presented as the average (solid line) ± SEM (shaded area). (d) Comparison of decreases in mitochondrial membrane potential after 10 min extracted from the data shown in (c). Error bars indicate SEM. * indicates p < 0.05 by t-test.

Figure 5.
Inhibitors of Mg2+ extrusion attenuated the glutamate-induced decrease in intracellular ATP level. (a) Comparison of intracellular ATP levels (YFP/CFP ratio of ATeam) before and 10 min after application of the glutamate stimulus in the presence or absence of inhibitor (n = 10, 16, 18 cells from 6 replicates for each). Error bars indicate SEM. * indicates p < 0.05 among all possible combinations by Tukey’s test. N.S. indicates no statistically significant difference. (b) Comparison of decrease in ATeam ratio induced by glutamate stimulus in 10 min under control and high Mg2+ (8 mM) conditions (control: n = 32 cells from 9 replicates; High Mg2+: n = 34 cells from 11 replicates). Error bars indicate SEM. * indicates p < 0.05 by t-test.

Figure 6.
Inhibitor of mTOR abolished the attenuation of excitotoxicity by inhibiting Mg2+ extrusion. Comparison of cell viability 24 h after ten-minute glutamate stimulus with or without inhibitor of mTOR (Torin1: 2.5 μM) and/or inhibitors of Mg2+ extrusion (Quinidine: 200 μM, Amiloride: 500 μM) (n = 12, 9, 12, 12, 12, 12 for each). Error bars indicate SEM. * indicates p < 0.05 among all possible combinations by Tukey’s test. N.S. indicates no statistically significant difference.

Figure 7.
Schematic of roles of Mg2+ in excitotoxicity. The transport and effects of Mg2+ and mTOR demonstrated in this study are shown in red. In this study, we demonstrated that glutamate stimulus induces not only Mg2+ released from mitochondria but also Mg2+ extrusion from the cytosol, and quinidine and amiloride inhibit it. Maintaining Mg2+ in neurons suppressed glutamate-induced decrease in cellular ATP level and also attenuated neuronal cell death via mTOR signaling pathway. Dotted lines indicate pathways that are still obscure whether they are direct or indirect effects. The effects of Mg2+ demonstrated previous studies are shown in blue, and the main excitotoxic signals are shown in green.

© 2020 by the authors. Licensee MDPI, Basel, Switzerland. This article is an open access article distributed under the terms and conditions of the Creative Commons Attribution (CC BY) license (http://creativecommons.org/licenses/by/4.0/).
Share and Cite
MDPI and ACS Style
Shindo, Y.; Yamanaka, R.; Hotta, K.; Oka, K. Inhibition of Mg2+ Extrusion Attenuates Glutamate Excitotoxicity in Cultured Rat Hippocampal Neurons. Nutrients 2020, 12, 2768. https://0-doi-org.brum.beds.ac.uk/10.3390/nu12092768
AMA Style
Shindo Y, Yamanaka R, Hotta K, Oka K. Inhibition of Mg2+ Extrusion Attenuates Glutamate Excitotoxicity in Cultured Rat Hippocampal Neurons. Nutrients. 2020; 12(9):2768. https://0-doi-org.brum.beds.ac.uk/10.3390/nu12092768
Chicago/Turabian StyleShindo, Yutaka, Ryu Yamanaka, Kohji Hotta, and Kotaro Oka. 2020. "Inhibition of Mg2+ Extrusion Attenuates Glutamate Excitotoxicity in Cultured Rat Hippocampal Neurons" Nutrients 12, no. 9: 2768. https://0-doi-org.brum.beds.ac.uk/10.3390/nu12092768
Note that from the first issue of 2016, this journal uses article numbers instead of page numbers. See further details here.