KiwiC for Vitality: Results of a Placebo-Controlled Trial Testing the Effects of Kiwifruit or Vitamin C Tablets on Vitality in Adults with Low Vitamin C Levels

 , , , and
Abstract
:1. Introduction
2. Materials and Methods
2.1. Trial Design
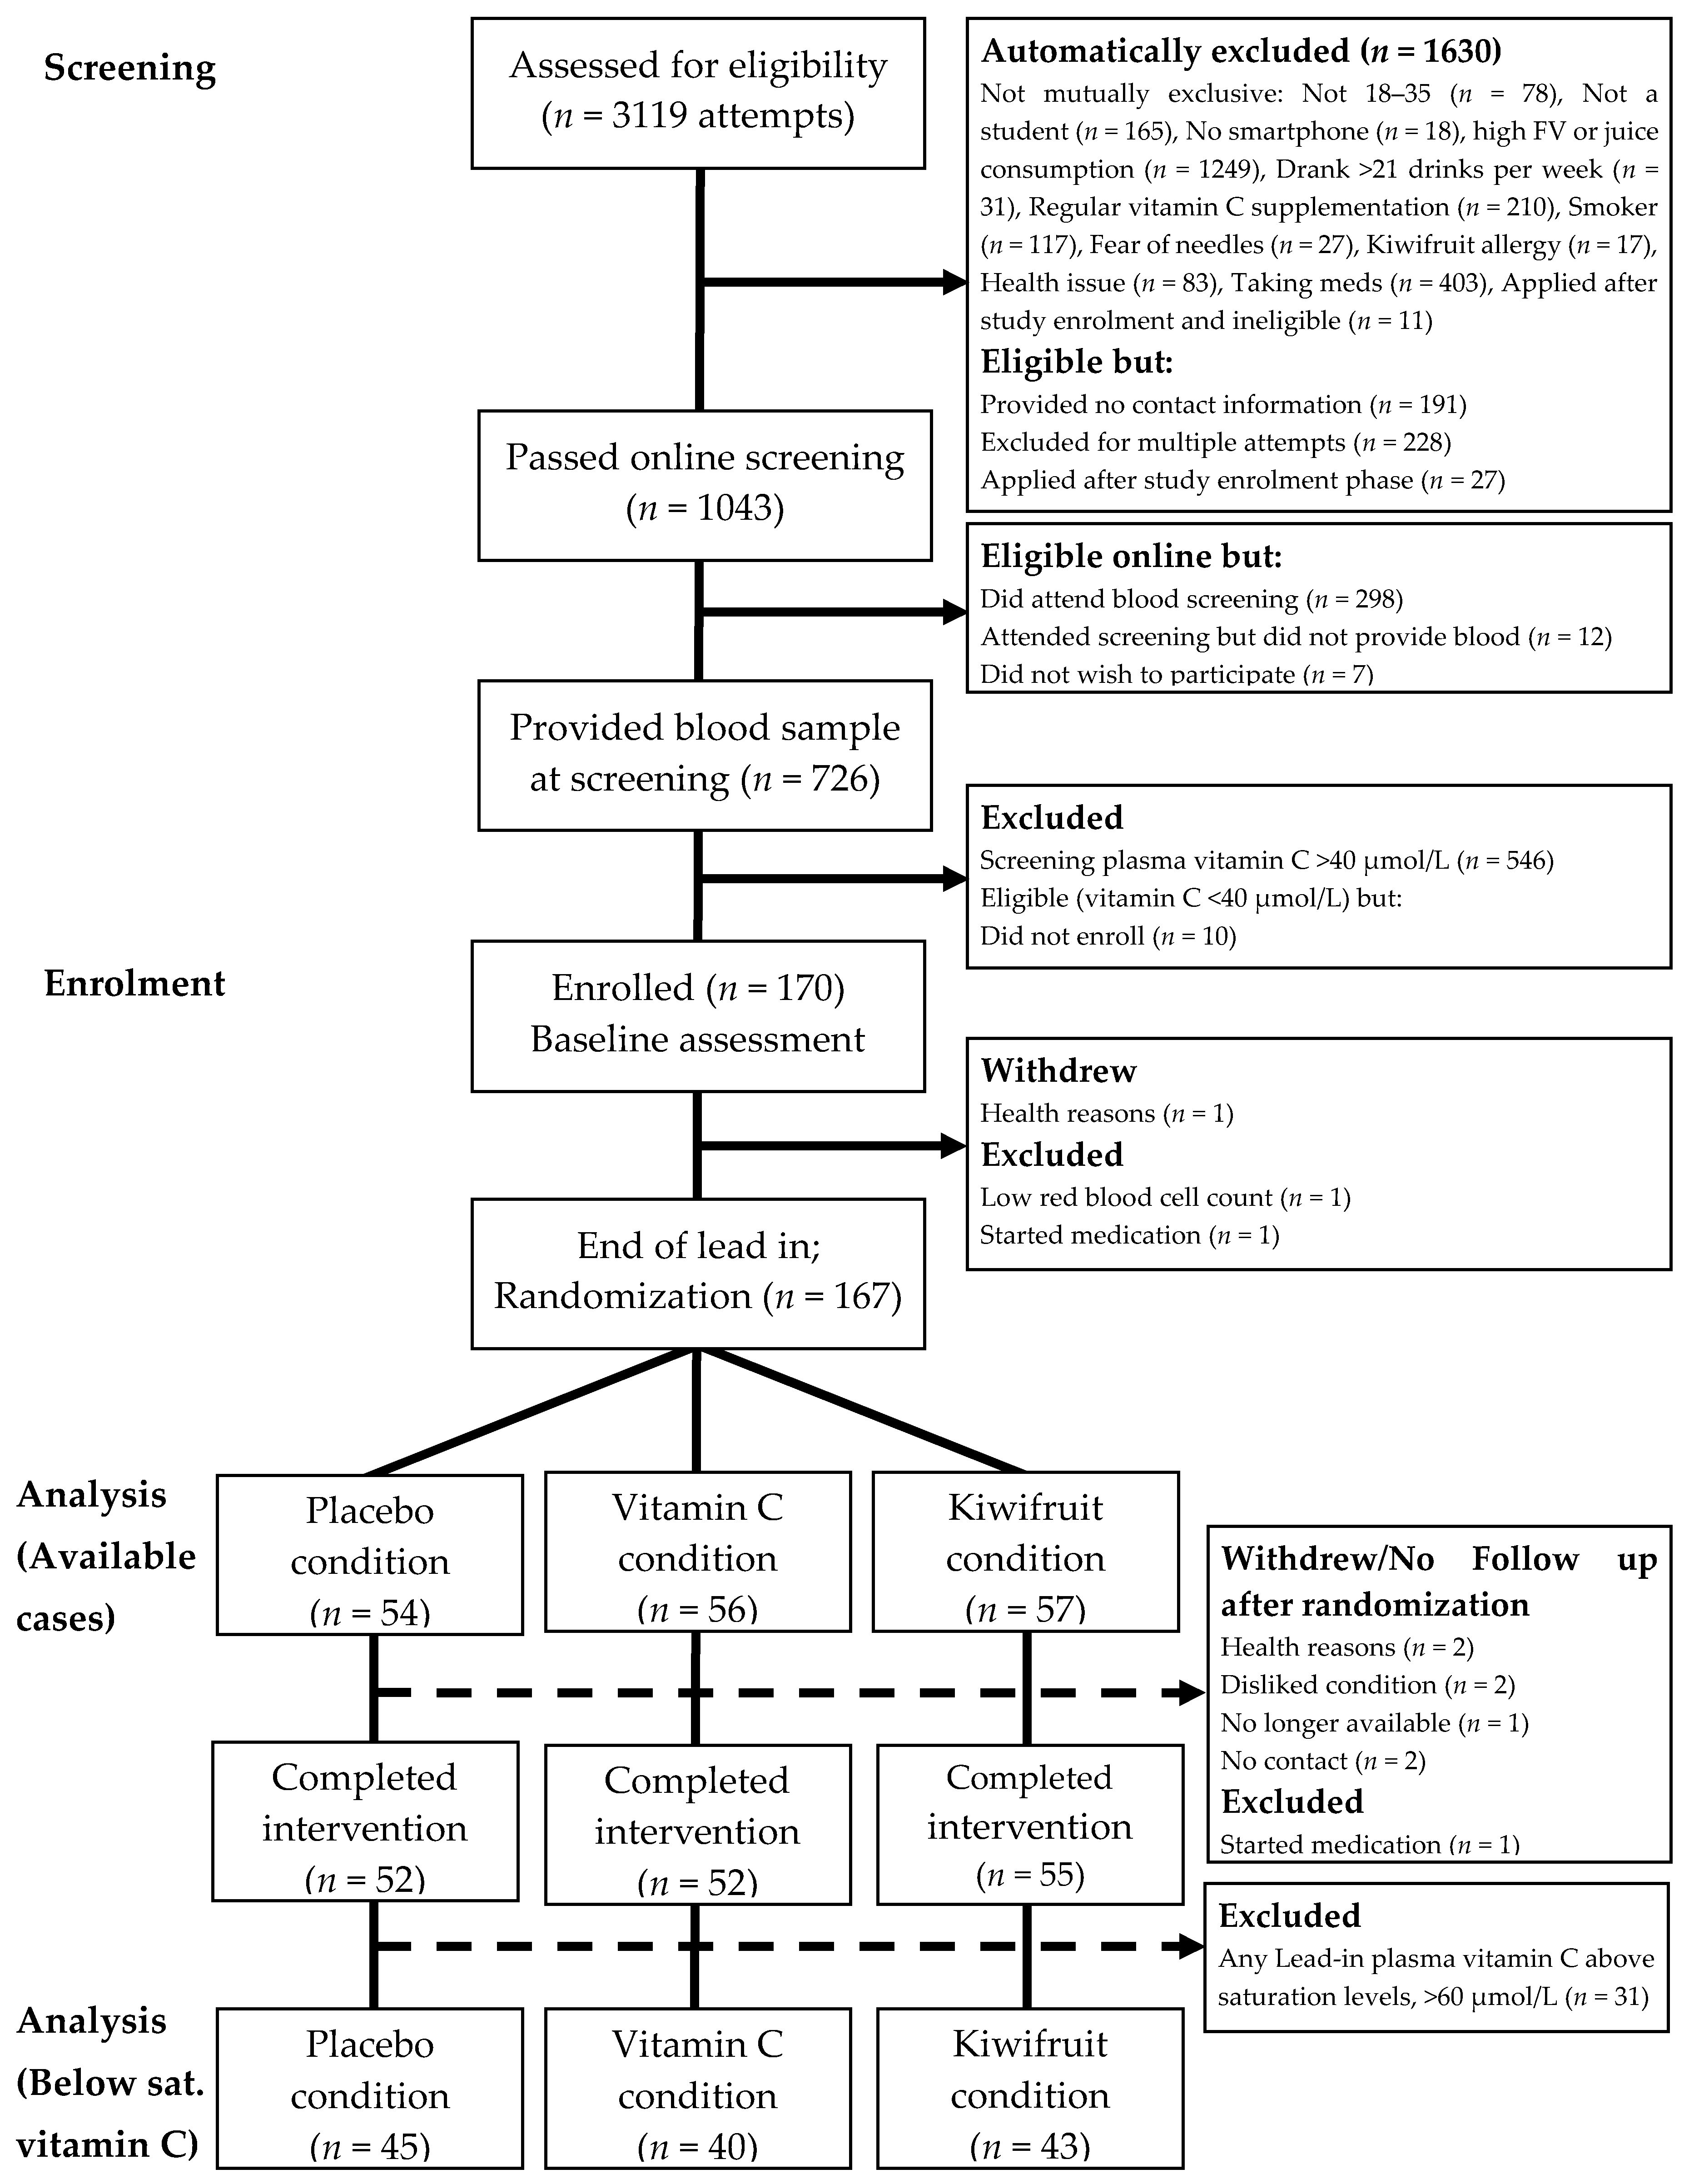
2.2. Participant Recruitment and Screening
2.3. Condition Allocation
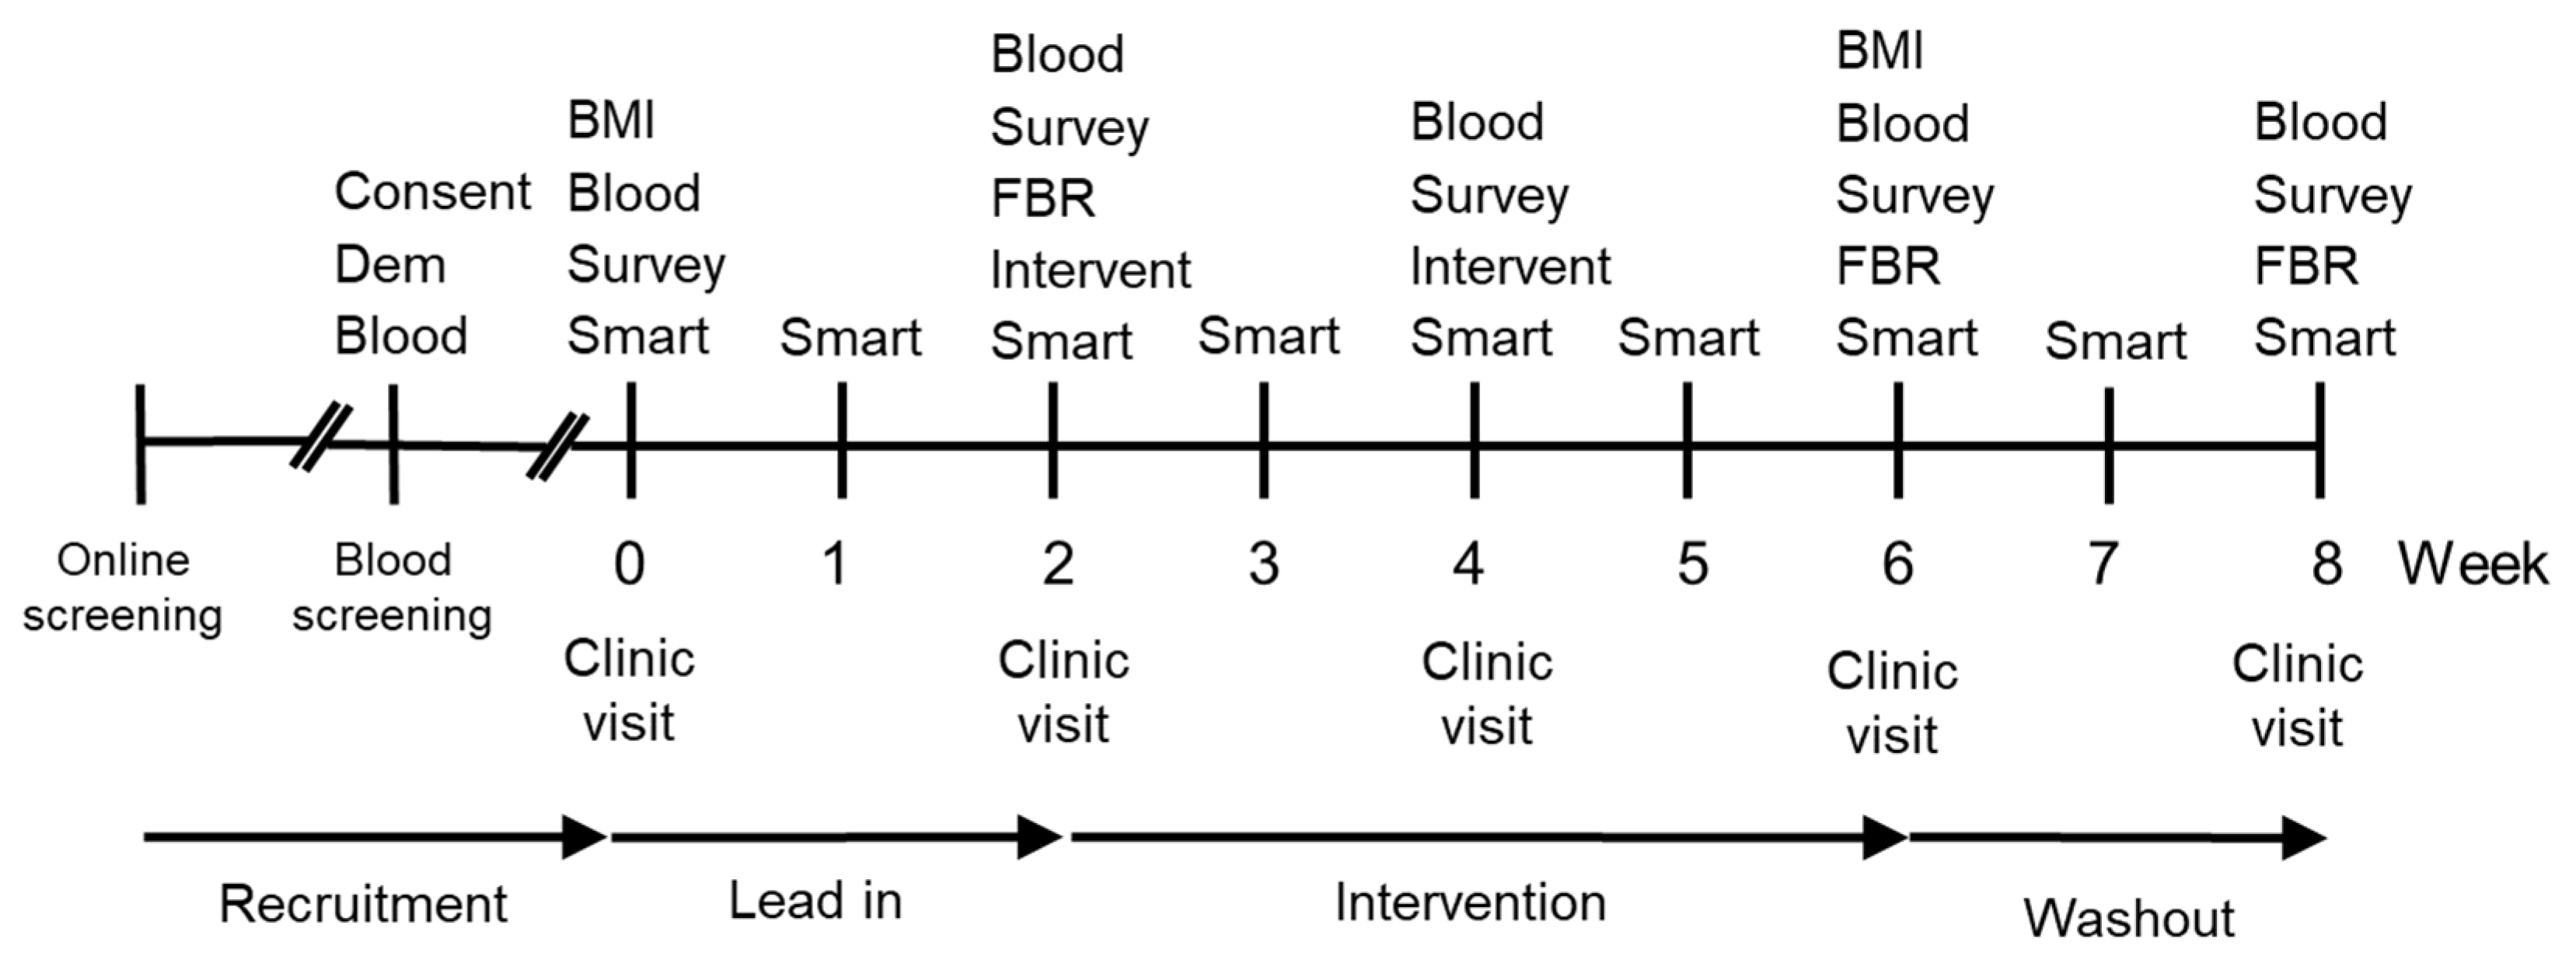
2.4. Procedure
2.5. Intervention
2.6. Demographic and Health Characteristics
2.7. Primary Outcome Vitality Measures
2.8. Smartphone Surveys
2.9. Dietary Intake
2.10. Vitamin C Analysis
2.11. Missing Data Treatment and Statistical Analyses
3. Results
4. Discussion
Supplementary Materials
Author Contributions
Funding
Acknowledgments
Conflicts of Interest
References
- Blanchflower, D.G.; Oswald, A.J.; Stewart-Brown, S. Is psychological well-being linked to the consumption of fruit and vegetables? Soc. Indic. Res. 2012, 114, 785–801. [Google Scholar] [CrossRef]
- Piqueras, J.A.; Kuhne, W.; Vera-Villarroel, P.; Van Straten, A.; Cuijpers, P. Happiness and health behaviours in Chilean college students: A cross-sectional survey. BMC Public Health 2011, 11, 443. [Google Scholar] [CrossRef] [PubMed]
- White, B.A.; Horwath, C.C.; Conner, T.S. Many apples a day keep the blues away-daily experiences of negative and positive affect and food consumption in young adults. Br. J. Health Psychol. 2013, 18, 782–798. [Google Scholar] [CrossRef] [PubMed]
- Crichton, G.E.; Bryan, J.; Hodgson, J.M.; Murphy, K.J. Mediterranean diet adherence and self-reported psychological functioning in an Australian sample. Appetite 2013, 70, 53–59. [Google Scholar] [CrossRef]
- Głąbska, D.; Guzek, D.; Groele, B.; Gutkowska, K. Fruit and vegetable intake and mental health in adults: A systematic review. Nutrients 2020, 12, 115. [Google Scholar] [CrossRef]
- Block, G.; Norkus, E.; Hudes, M.; Mandel, S.; Helzlsouer, K. Which plasma antioxidants are most related to fruit and vegetable consumption? Am. J. Epidemiol. 2001, 154, 1113–1118. [Google Scholar] [CrossRef]
- Granger, M.; Eck, P. Dietary Vitamin C in human health. Adv. Food Nutr. Res. 2018, 83, 281–310. [Google Scholar]
- Levine, M.; Rumsey, S.C.; Wang, Y.; Park, J.; Kwon, O.; Amano, N. In situ kinetics: An approach to recommended intake of vitamin C. Methods Enzymol. 1997, 281, 425–437. [Google Scholar]
- Rumsey, S.; Levine, M. Absorption, transport, and disposition of ascorbic acid in humans. Nutr. Biochem. 1998, 9, 116–130. [Google Scholar] [CrossRef]
- Levine, M.; Wang, Y.; Padayatty, S.J.; Morrow, J. A new recommended dietary allowance of vitamin C for healthy young women. Proc. Natl. Acad. Sci. USA 2001, 98, 9842–9846. [Google Scholar] [CrossRef]
- Hasselholt, S.; Tveden-Nyborg, P.; Lykkesfeldt, J. Distribution of vitamin C is tissue specific with early saturation of the brain and adrenal glands following differential oral dose regimens in guinea pigs. Br. J. Nutr. 2015, 113, 1539–1549. [Google Scholar] [CrossRef] [PubMed]
- Meredith, M.E.; May, J.M. Regulation of embryonic neurotransmitter and tyrosine hydroxylase protein levels by ascorbic acid. Brain Res. 2013, 1539, 7–14. [Google Scholar] [CrossRef] [PubMed]
- Prigge, S.T.; Mains, R.E.; Eipper, B.A.; Amzel, L.M. New insights into copper monooxygenases and peptide amidation: Structure, mechanism and function. Cell. Mol. Life Sci. 2000, 57, 1236–1259. [Google Scholar] [CrossRef]
- Levine, M. Ascorbic acid specifically enhances dopamine beta-monooxygenase activity in resting and stimulated chromaffin cells. J. Biol. Chem. 1986, 261, 7347–7356. [Google Scholar] [PubMed]
- Pihlajaniemi, T.; Myllyla, R.; Kivirikko, K.I. Prolyl 4-hydroxylase and its role in collagen synthesis. J. Hepatol. 1991, 13 (Suppl. S3), S2–S7. [Google Scholar] [CrossRef]
- Levine, M.; Conry-Cantilena, C.; Wang, Y.; Welch, R.W.; Washko, P.W.; Dhariwal, K.R.; Park, J.B.; Lazarev, A.; Graumlich, J.F.; King, J.; et al. Vitamin C pharmacokinetics in healthy volunteers: Evidence for a recommended dietary allowance. Proc. Natl. Acad. Sci. USA 1996, 93, 3704–3709. [Google Scholar] [CrossRef]
- Carr, A.C.; Frei, B. Toward a new recommended dietary allowance for vitamin C based on antioxidant and health effects in humans. Am. Soc. Clin. Nutr. 1999, 69, 1086–1107. [Google Scholar] [CrossRef]
- Agarwal, A.; Shaharyar, A.; Kumar, A.; Bhat, M.S.; Mishra, M. Scurvy in pediatric age group—A disease often forgotten? J. Clin. Orthop. Trauma 2015, 6, 101–107. [Google Scholar] [CrossRef]
- Harrison, F.E.; May, J.M. Vitamin C function in the brain: Vital role of the ascorbate transporter SVCT2. Free Radic. Biol. Med. 2009, 46, 719–730. [Google Scholar] [CrossRef]
- Kinsman, R.A.; Hood, J. Some behavioral effects of ascorbic acid deficiency. Am. J. Clin. Nutr. 1971, 24, 455–464. [Google Scholar] [CrossRef]
- Lykkesfeldt, J.; Poulsen, H.E. Is vitamin C supplementation beneficial? Lessons learned from randomised controlled trials. Br. J. Nutr. 2010, 103, 1251–1259. [Google Scholar] [CrossRef] [PubMed]
- Léger, D. Scurvy. Can. Fam. Physician 2008, 54, 1403–1406. [Google Scholar] [PubMed]
- Cheraskin, E.; Ringsdorf, W.M.J.; Medford, F.H. Daily vitamin C consumption and fatigability. J. Am. Geriatr. Soc. 1976, 24, 136–137. [Google Scholar] [CrossRef] [PubMed]
- Johnston, C.S.; Barkyoumb, G.M.; Schumacher, S.S. Vitamin C supplementation slightly improves physical activity levels and reduces cold incidence in men with marginal vitamin C status: A randomized controlled trial. Nutrients 2014, 6, 2572–2583. [Google Scholar] [CrossRef]
- Conner, T.S.; Brookie, K.L.; Carr, A.C.; Mainvil, L.A.; Vissers, M.C. Let them eat fruit! The effect of fruit and vegetable consumption on psychological well-being in young adults: A randomized controlled trial. PLoS ONE 2017, 12, e0171206. [Google Scholar] [CrossRef]
- Mujcic, R.; Oswald, A.J. Evolution of well-being and happiness after increases in consumption of fruit and vegetables. Am. J. Public Health 2016, 106, 1504–1510. [Google Scholar] [CrossRef]
- Rooney, C.; McKinley, M.C.; Woodside, J.V. The potential role of fruit and vegetables in aspects of psychological well-being: A review of the literature and future directions. Proc. Nutr. Soc. 2013, 72, 420–432. [Google Scholar] [CrossRef]
- Jacka, F.N.; Pasco, J.A.; Mykletun, A.; Williams, L.J.; Hodge, A.M.; O’Reilly, S.L.; Nicholson, G.C.; Kotowicz, M.A.; Berk, M. Association of western and traditional diets with depression and anxiety in women. Am. J. Psychiatry 2010, 211, 55–68. [Google Scholar] [CrossRef]
- Choi, J.E.; Ainsworth, B.E. Associations of food consumption, serum vitamins and metabolic syndrome risk with physical activity level in middle-aged adults: The National Health and Nutrition Examination Survey (NHANES) 2005–2006. Public Health Nutr. 2016, 19, 1674–1683. [Google Scholar] [CrossRef]
- Paschalis, V.; Theodorou, A.A.; Kyparos, A.; Dipla, K.; Zafeiridis, A.; Panayiotou, G.; Vrabas, I.S.; Nikolaidis, M.G. Low vitamin C values are linked with decreased physical performance and increased oxidative stress: Reversal by vitamin C supplementation. Eur. J. Nutr. 2016, 55, 45–53. [Google Scholar] [CrossRef]
- Harding, A.H.; Wareham, N.J.; Bingham, S.A.; Khaw, K.; Luben, R.; Welch, A.; Forouhi, N.G. Plasma vitamin C level, fruit and vegetable consumption, and the risk of new-onset type 2 diabetes mellitus: The European prospective investigation of cancer—Norfolk prospective study. Arch. Intern. Med. 2008, 168, 1493–1499. [Google Scholar] [CrossRef] [PubMed]
- Carr, A.C.; Bozonet, S.M.; Pullar, J.M.; Vissers, M.C. Mood improvement in young adult males following supplementation with gold kiwifruit, a high-vitamin C food. J. Nutr. Sci. 2013, 2, e24. [Google Scholar] [CrossRef]
- Nishiyama, I.; Yamashita, Y.; Yamanaka, M.; Shimohashi, A.; Fukuda, T.; Oota, T. Varietal difference in vitamin C content in the fruit of kiwifruit and other actinidia species. J. Agric. Food Chem. 2004, 52, 5472–5475. [Google Scholar] [CrossRef] [PubMed]
- Griskevicius, V.; Delton, A.W.; Robertson, T.E.; Tybur, J.M. Environmental contingency in life history strategies: The influence of mortality and socioeconomic status on reproductive timing. J. Personal. Soc. Psychol. 2011, 100, 241–254. [Google Scholar] [CrossRef] [PubMed]
- McNair, D.M.; Heuchert, J.W.P. Profiles of Mood States—Technical Update; Multi-Health Systems Inc.: Toronto, ON, Canada, 2005. [Google Scholar]
- Stein, K.D.; Jacobsen, P.B.; Blanchard, C.M.; Thors, C. Further Validation of the Multidimensional Fatigue Symptom Inventory-Short Form. J. Pain Symptom Manag. 2004, 27, 14–23. [Google Scholar] [CrossRef] [PubMed]
- Tennant, R.; Hiller, L.; Fishwick, R.; Platt, S.; Joseph, S.; Weich, S.; Parkinson, J.; Secker, J.; Stewart-Brown, S. The Warwick-Edinburgh Mental Well-being Scale (WEMWBS): Development and UK validation. Health Qual. Life Outcomes 2007, 5, 63. [Google Scholar] [CrossRef]
- Pullar, J.M.; Bayer, S.; Carr, A.C. Appropriate handling, processing and analysis of blood samples is essential to avoid oxidation of vitamin C to dehydroascorbic acid. Antioxidants 2018, 7, 29. [Google Scholar] [CrossRef]
- Carr, A.C.; Bozonet, S.M.; Pullar, J.M.; Simcock, J.W.; Vissers, M.C. A randomized steady-state bioavailability study of synthetic versus natural (kiwifruit-derived) vitamin C. Nutrients 2013, 5, 3684–3695. [Google Scholar] [CrossRef]
- Kruse, R.L.; Alper, B.S.; Reust, C.; Stevermer, J.J.; Shannon, S.; Williams, R.H. Intention-to-treat analysis: Who is in? Who is out? J. Fam. Pract. 2002, 51, 969–971. [Google Scholar]
- Jakobsen, J.C.; Gluud, C.; Wetterslev, J.; Winkel, P. When and how should multiple imputation be used for handling missing data in randomised clinical trials–a practical guide with flowcharts. BMC Med Res. Methodol. 2017, 17, 162. [Google Scholar] [CrossRef]
- Dettori, J.R.; Norvell, D.C.; Chapman, J.R. The sin of missing data: Is all forgiven by way of imputation? Glob. Spine J. 2018, 8, 892–894. [Google Scholar] [CrossRef] [PubMed]
- National Research Council. The prevention and treatment of missing data in clinical trials. In Panel on Handling Missing Data in Clinical Trials; National Academies Press: Washington, DC, USA, 2010. [Google Scholar]
- Carr, A.C.; Vissers, M.C. Synthetic or food-derived vitamin C-are they equally bioavailable? Nutrients 2013, 5, 4284–4304. [Google Scholar] [CrossRef] [PubMed]
- Richardson, D.P.; Ansell, J.; Drummond, L.N. The nutritional and health attributes of kiwifruit: A review. Eur. J. Nutr. 2018, 57, 2659–2676. [Google Scholar] [CrossRef]
- U.S. Department of Agriculture. National Nutrient Database for Standard Reference Legacy Release; Agricultural Research Service: Beltsville, MD, USA, 2018.
- Dash, S.; Clarke, G.; Berk, M.; Jacka, F.N. The gut microbiome and diet in psychiatry: Focus on depression. Curr. Opin. Psychiatry 2015, 28, 1–6. [Google Scholar] [CrossRef] [PubMed]
- Scott, K.P.; Duncan, S.H.; Flint, H.J. Dietary fibre and the gut microbiota. Nutr. Bull. 2008, 33, 201–211. [Google Scholar] [CrossRef]
- Tap, J.; Furet, J.-P.; Bensaada, M.; Philippe, C.; Roth, H.; Rabot, S.; Lakhdari, O.; Lombard, V.; Henrissat, E.; Corthier, G.; et al. Gut microbiota richness promotes its stability upon increased dietary fibre intake in healthy adults. Environ. Microbiol. 2015, 17, 4954–4964. [Google Scholar] [CrossRef]
- Morris, M.S.; Fava, M.; Jacques, P.F.; Selhub, J.; Rosenberg, I.H. Depression and folate status in the US population. Psychother. Psychosom. 2003, 72, 80–87. [Google Scholar] [CrossRef]
- Torres, S.J.; Nowson, C.A.; Worsley, A. Dietary electrolytes are related to mood. Br. J. Nutr. 2008, 100, 1038–1045. [Google Scholar] [CrossRef]
- Staudacher, H.M.; Irving, P.M.; Lomer, M.C.; Whelan, K. The challenges of control groups, placebos and blinding in clinical trials of dietary interventions. Proc. Nutr. Soc. 2017, 76, 203–212. [Google Scholar] [CrossRef]
- Adan, R.A.; van der Beek, E.M.; Buitelaar, J.K.; Cryan, J.F.; Hebebrand, J.; Higgs, S.; Schellekens, H.; Dickson, S.L. Nutritional psychiatry: Towards improving mental health by what you eat. Eur. Neuropsychopharmacol. 2019, 29, 1321–1332. [Google Scholar] [CrossRef]
- Michels, A.J.; Frei, B. Myths, artifacts, and fatal flaws: Identifying limitations and opportunities in vitamin C research. Nutrients 2013, 5, 5161–5192. [Google Scholar] [CrossRef]
- Dunn, W.A.; Rettura, G.; Seifter, E.; Englard, S. Carnitine biosynthesis from gamma-butyrobetaine and from exogenous protein-bound 6-N-trimethyl-L-lysine by the perfused guinea pig liver. Effect of ascorbate deficiency on the in situ activity of gamma-butyrobetaine hydroxylase. J. Biol. Chem. 1984, 259, 10764–10770. [Google Scholar]
- Rebouche, C.J. Ascorbic acid and carnitine biosynthesis. Am. J. Clin. Nutr. 1991, 54 (Suppl. S6), 1147S–1152S. [Google Scholar] [CrossRef] [PubMed]
- Nelson, P.J.; Pruitt, R.E.; Henderson, L.L.; Jenness, R.; Henderson, L.M. Effect of ascorbic acid deficiency on the in vivo synthesis of carnitine. Biochim. Biophys. Acta 1981, 672, 123–127. [Google Scholar] [CrossRef]
- Noland, R.C.; Koves, T.R.; Seiler, S.E.; Lum, H.; Lust, R.M.; Ilkayeva, O.; Stevens, R.D.; Hegardt, F.G.; Muoio, D.M. Carnitine insufficiency caused by aging and overnutrition compromises mitochondrial performance and metabolic control. J. Biol. Chem. 2009, 284, 22840–22852. [Google Scholar] [CrossRef] [PubMed]
- Rush, R.A.; Geffen, L.B. Dopamine beta-hydroxylase in health and disease. Crit. Rev. Clin. Lab. Sci. 1980, 12, 241–277. [Google Scholar] [CrossRef] [PubMed]
- May, J.M.; Qu, Z.C.; Nazarewicz, R.; Dikalov, S. Ascorbic acid efficiently enhances neuronal synthesis of norepinephrine from dopamine. Brain Res. Bull. 2013, 90, 35–42. [Google Scholar] [CrossRef]
- Hoehn, S.K.; Kanfer, J.N. Effects of chronic ascorbic acid deficiency on guinea pig lysosomal hydrolase activities. J. Nutr. 1980, 110, 2085–2094. [Google Scholar] [CrossRef]
- Deana, R.; Bharaj, B.S.; Verjee, Z.H.; Galzigna, L. Changes relevant to catecholamine metabolism in liver and brain of ascorbic acid deficient guinea-pigs. Int. J. Vitam. Nutr. Res. 1975, 45, 175–182. [Google Scholar]
- Bornstein, S.R.; Yoshida-Hiroi, M.; Sotiriou, S.; Levine, M.; Hartwig, H.G.; Nussbaum, R.L.; Eisenhofer, G. Impaired adrenal catecholamine system function in mice with deficiency of the ascorbic acid transporter (SVCT2). FASEB J. 2003, 17, 1928–1930. [Google Scholar] [CrossRef]
- May, J.M.; Qu, Z.C.; Meredith, M.E. Mechanisms of ascorbic acid stimulation of norepinephrine synthesis in neuronal cells. Biochem. Biophys. Res. Commun. 2012, 426, 148–152. [Google Scholar] [CrossRef]
- Kringelbach, M.L.; Berridge, K.C. Toward a functional neuroanatomy of pleasure and happiness. Trends Cogn. Sci. 2009, 13, 479–487. [Google Scholar] [CrossRef] [PubMed]
- Englard, S.; Seifter, S. The biochemical functions of ascorbic acid. Annu. Rev. Nutr. 1986, 6, 365–406. [Google Scholar] [CrossRef] [PubMed]
- Eipper, B.A.; Mains, R.E. The role of ascorbate in the biosynthesis of neuroendocrine peptides. Am. J. Clin. Nutr. 1991, 54 (Suppl. S6), 1153S–1156S. [Google Scholar] [CrossRef]
- Kukucka, M.A.; Misra, H.P. HPLC determination of an oxytocin-like peptide produced by isolated guinea pig Leydig cells: Stimulation by ascorbate. Arch. Androl. 1992, 29, 185–190. [Google Scholar] [CrossRef] [PubMed]
- Sheldrick, E.L.; Flint, A.P. Post-translational processing of oxytocin-neurophysin prohormone in the ovine corpus luteum: Activity of peptidyl glycine alpha-amidating mono-oxygenase and concentrations of its cofactor, ascorbic acid. J. Endocrinol. 1989, 122, 313–322. [Google Scholar] [CrossRef]
- Ishak, W.W.; Kahloon, M.; Fakhry, H. Oxytocin role in enhancing well-being: A literature review. J. Affect. Disord. 2011, 130, 1–9. [Google Scholar] [CrossRef]
- Luck, M.R.; Jungclas, B. Catecholamines and ascorbic acid as stimulators of bovine ovarian oxytocin secretion. J. Endocrinol. 1987, 114, 423–430. [Google Scholar] [CrossRef]


| Inclusion Criteria (All Required for Inclusion) | Exclusion Criteria (Only One Required for Exclusion) |
|---|---|
| Males and females aged 18–35 years | Taking prescription medication (within past three months) |
| Plasma vitamin C levels <40 µmol/L | Allergy/intolerance to kiwifruit |
| Non-smoker | Recent smoker (within previous year) |
| Currently a student | Taking vitamin C supplements (within past three months) |
| High fruit/juice & vegetable consumption (≥5 servings/day) | |
| Excessive alcohol consumption (>21 standard drinks/week) | |
| Diabetes mellitusBleeding disorders | |
| Fainting due to fear of needles |
| Condition | ||||
|---|---|---|---|---|
| Total Sample | Placebo | Vitamin C | Kiwifruit | |
| Week 0 (Lead in) | n = 170 | |||
| Randomization | n = 167 | n = 54 | n = 56 | n = 57 |
| Week 2 (Lead in) | n = 164 | n = 52 | n = 55 | n = 57 |
| Week 4 (Intervention) | n = 161 | n = 52 | n = 53 | n = 56 |
| Week 6 (Intervention) | n = 159 | n = 52 | n = 52 | n = 55 |
| Week 8 (Washout) | n = 155 | n = 51 | n = 51 | n = 53 |
| Total Sample (n = 167) | Placebo (n = 54) | Vitamin C (n = 56) | Kiwifruit (n = 57) | |
|---|---|---|---|---|
| Age (years) | 21.69 (3.54) | 21.87 (3.31) | 22.95 (4.46) | 20.28 (1.87) |
| Gender: | ||||
| Male | 64 (38.3%) | 20 (37.0%) | 22 (39.3%) | 22 (38.6%) |
| Female | 102 (61.1%) | 34 (63.0%) | 34 (60.7%) | 34 (59.6%) |
| Gender diverse | 1 (0.6%) | 0 (0.0%) | 0 (0.0%) | 1 (1.8%) |
| Ethnicity: | ||||
| European | 64 (38.3%) | 19 (35.2%) | 19 (33.9%) | 26 (45.6%) |
| Asian | 67 (40.1%) | 25 (46.3%) | 26 (46.4%) | 16 (28.1%) |
| Indian | 15 (9.0%) | 5 (9.3%) | 6 (10.7%) | 4 (7.0%) |
| Māori & Pasifika | 9 (5.4%) | 2 (3.7%) | 2 (3.6%) | 5 (8.8%) |
| Other & multiple | 12 (7.2%) | 3 (5.6%) | 3 (5.4%) | 6 (10.5%) |
| Year of study at university | 2.80 (1.51) | 2.81 (1.53) | 3.16 (1.74) | 2.44 (1.17) |
| Socioeconomic status (1 to 7) 1 | 4.64 (1.34) | 4.81 (1.25) | 4.58 (1.34) | 4.52 (1.41) |
| Height (cm) | 168.49 (10.31) | 168.21 (11.09) | 168.51 (9.91) | 168.73 (10.10) |
| Weight (kg): | ||||
| Pre-intervention | 68.01 (15.71) | 67.72 (18.83) | 67.82 (14.92) | 68.47 (13.29) |
| Post-intervention 2 | 68.08 (15.89) | 67.70 (19.12) | 68.01 (15.12) | 68.50 (13.30) |
| BMI (kg/m2): | ||||
| Pre-intervention | 23.84 (4.44) | 23.85 (5.73) | 23.70 (3.76) | 23.98 (3.65) |
| Post-intervention 2 | 23.88 (4.44) | 24.00 (5.86) | 23.66 (3.66) | 23.95 (3.53) |
| No History of Smoking: | 150 (89.8%) | 49 (90.7%) | 49 (87.5%) | 52 (91.2%) |
| Vegetables servings/day | 1.00 (0.756) | 0.97 (0.80) | 0.99 (0.72) | 1.02 (0.76) |
| Fruit servings/day | 0.39 (0.38) | 0.37 (0.36) | 0.38 (0.32) | 0.43 (0.46) |
| Alcoholic standards /week | 3.43 (5.23) | 2.60 (4.02) | 3.04 (5.97) | 4.59 (5.36) |
| Sleep duration (hours) 3 | 7.18 (1.04) | 7.07 (1.11) | 7.35 (0.86) | 7.11 (1.11) |
| Sleep quality (1 to 10) 3 | 6.54 (1.29) | 6.21 (1.42) | 6.80 (1.29) | 6.61 (1.12) |
| Physical activity (30 min/ day): | ||||
| % of days 3 | 46.1% | 47.5% | 45.5% | 45.5% |
| Placebo | Vitamin C | Kiwifruit | ||||
|---|---|---|---|---|---|---|
| n | Mean (SD) | n | Mean (SD) | n | Mean (SD) | |
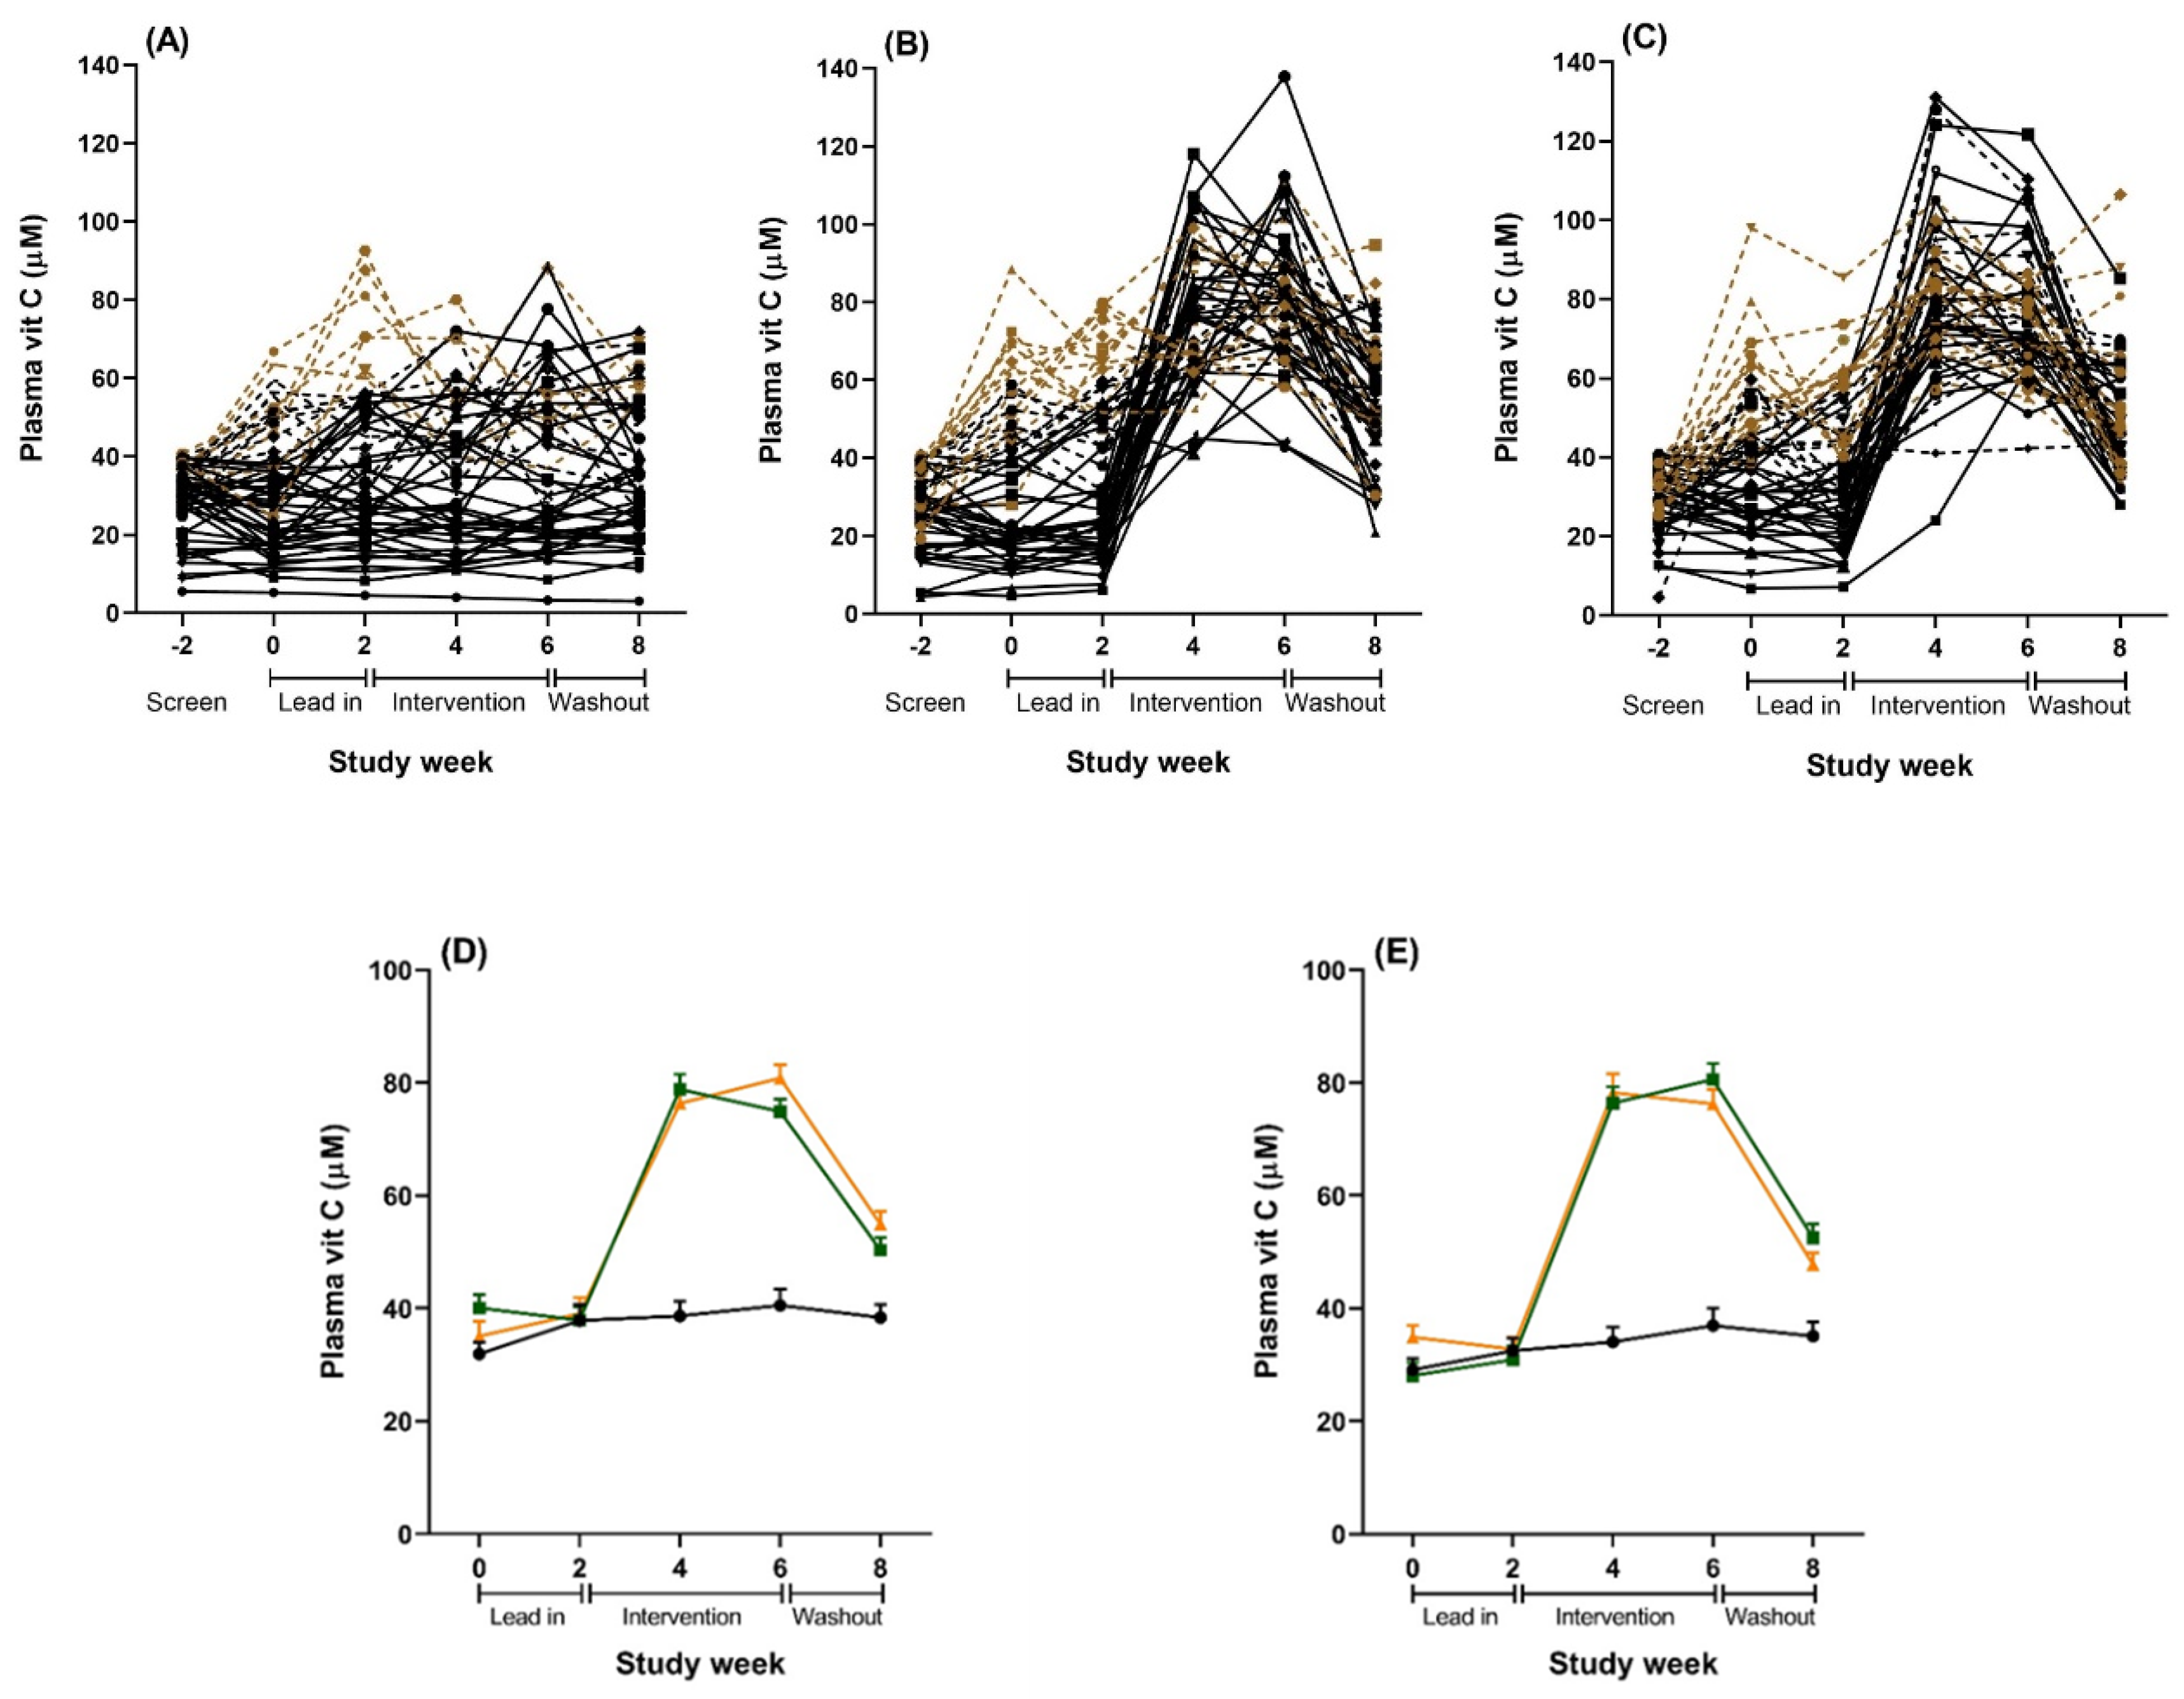
| Week 0 (Lead-in) | 54 | 31.93 (15.33) | 56 | 35.10 (19.6) | 56 | 40.08 (17.7) |
| Week 2 (Lead-in) | 52 | 38.19 (20.82) | 55 | 39.10 (20.96) | 57 | 37.90 (17.88) |
| Week 4 (Intervention) | 52 | 36.82 (18.89) | 53 | 76.34 (17.57) ****a | 55 | 78.91 (20.21) ****a |
| Week 6 (Intervention) | 52 | 39.25 (20.82) | 52 | 80.84 (17.14) ****a | 55 | 74.88 (16.03) ****a *b |
| Week 8 (Washout) | 51 | 38.27 (17.66) | 51 | 54.94 (16.52) ****abc | 53 | 50.35 (16.15) ****abc |
| Placebo Group (n = 52) | Vitamin C Tablet Group (n = 53) | Kiwifruit Group (n = 56) | ||||||||
|---|---|---|---|---|---|---|---|---|---|---|
| Baseline Mean (SD) | Mean Change from Baseline (SD) | Baseline Mean (SD) | Mean Change from Baseline (SD) | Mean Difference in Change (95% CI) Compared to Placebo a | p-Value | Baseline Mean (SD) | Mean Change from Baseline (SD) | Mean Difference in Change (95% CI) Compared to Placebo a | p- Value | |
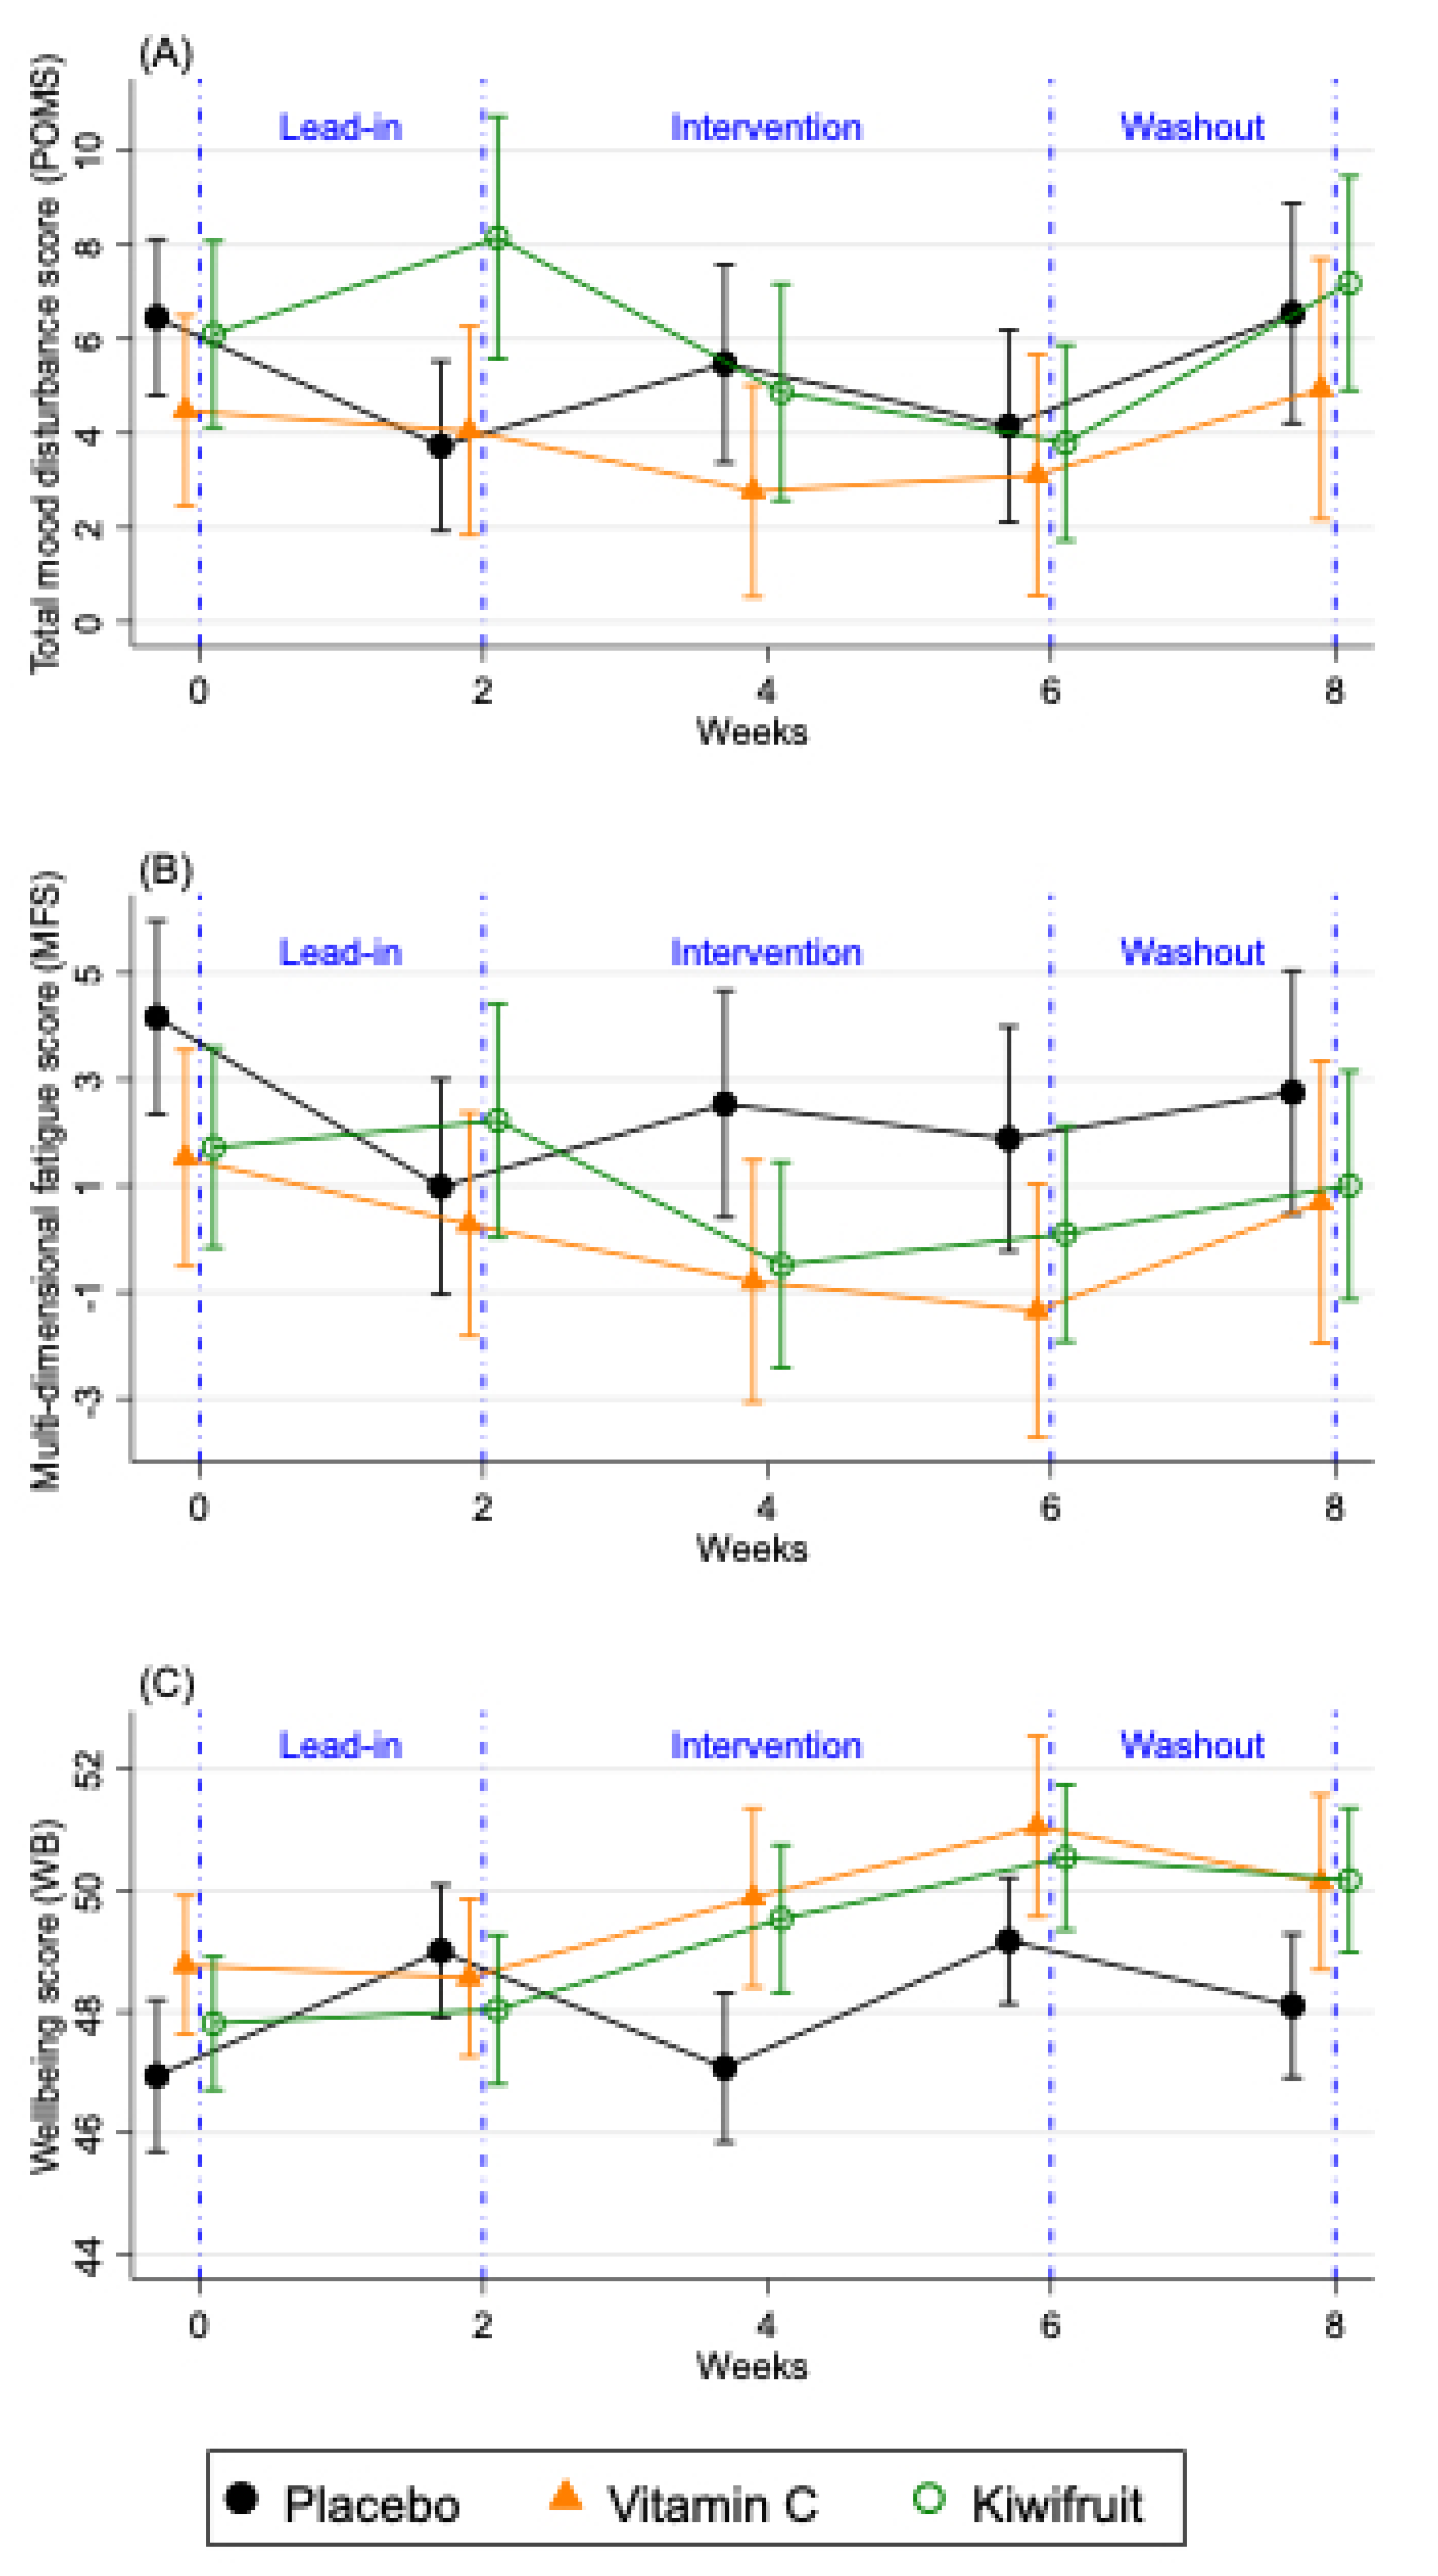
| POMS total score b | ||||||||||
| 2 weeks of intervention | 3.7 (13.0) | 1.8 (13.1) | 3.9 (16.7) | −1.1 (10.1) | −3.0 (−6.9, 0.8) | 0.121 | 8.6 (19.4) | −3.7 (8.9) | −4.0 (−8.1, 0.2) | 0.062 |
| 4 weeks of intervention c | 3.7 (13.0) | 0.4 (9.9) | 3.9 (16.9) | −0.8 (14.8) | −1.2 (−5.5, 3.2) | 0.604 | 7.3 (17.0) | −3.5 (11.4) | −3.0 (−7.3, 1.3) | 0.177 |
| Fatigue score d | ||||||||||
| 2 weeks of intervention | 1.0 (14.6) | 1.6 (8.9) | 0.2 (15.8) | −1.0 (9.2) | −2.8 (−6.3, 0.6) | 0.108 | 2.4 (16.7) | −2.8 (10.7) | −3.8 (−7.4, −0.2) | 0.038 |
| 4 weeks of intervention c | 1.0 (14.6) | 0.9 (8.9) | 0.1 (16.0) | −1.5 (12.8) | −2.6 (−6.4, 1.3) | 0.194 | 1.6 (15.9) | −1.5 (9.7) | 1.5 (−4.4, 7.4) | 0.617 |
| Well-being score e | ||||||||||
| 2 weeks of intervention | 49.0 (7.0) | −1.9 (8.3) | 49.0 (9.4) | 0.8 (4.4) | 2.8 (0.5, 5.1) | 0.018 | 47.8 (9.3) | 1.7 (5.4) | 3.4 (1.2, 5.7) | 0.003 |
| 4 weeks of intervention c | 49.0 (7.9) | 0.2 (6.6) | 49.2 (9.4) | 1.8 (7.8) | 1.7 (−0.8, 4.3) | 0.180 | 48.2 (9.0) | 2.4 (7.0) | 2.0 (−0.5, 4.5) | 0.124 |
| Plasma Vitamin C Below Saturation (n = 128) | Per Protocol (n = 92) | |||||||
|---|---|---|---|---|---|---|---|---|
| Vitamin C Tablet Group (n = 40) | Kiwifruit Group (n = 43) | Vitamin C Tablet Group (n = 29) | Kiwifruit Group (n = 27) | |||||
| Mean Difference in Change (95% CI) Compared to Placebo a | p-Value | Mean Difference in Change (95% CI) Compared to Placebo a | p-Value | Mean Difference in Change (95% CI) Compared to Placebo a | p-Value | Mean Difference in Change (95% CI) Compared to Placebo a | p-Value | |
| POMS total score b | ||||||||
| 2 weeks of intervention | −4.2 (−8.5, 0.2) | 0.060 | −3.9 (−8.5, 0.6) | 0.087 | −7.9 (−13.2, −2.6) | 0.003 | −4.5 (−10.3, 1.2) | 0.121 |
| 4 weeks of intervention c | −3.5 (−7.8, 0.7) | 0.105 | −2.8 (−7.3, 1.6) | 0.212 | −3.6 (−8.4, 1.2) | 0.137 | −3.6 (−8.7, 1.6) | 0.174 |
| Fatigue score c | ||||||||
| 2 weeks of intervention | −3.7 (−7.2, −0.2) | 0.036 | −4.4 (−8.0, −0.8) | 0.017 | −5.9 (−9.9, −1.8) | 0.005 | −4.1 (−8.5, 0.4) | 0.073 |
| 4 weeks of intervention c | −4.7 (−8.5, −0.9) | 0.016 | −1.4 (−5.3, 2.6) | 0.505 | −4.4 (−8.9, 0.1) | 0.057 | −0.7 (−5.5, 4.2) | 0.790 |
| Well-being score d | ||||||||
| 2 weeks of intervention | 2.5 (0.01, 5.0) | 0.049 | 4.8 (2.2, 7.4) | < 0.001 | 3.0 (0.0, 6.0) | 0.047 | 4.1 (0.7, 7.6) | 0.017 |
| 4 weeks of intervention c | 2.3 (−0.3, 4.9) | 0.077 | 2.7 (−0.01, 5.4) | 0.051 | 2.2 (−0.7, 5.1) | 0.143 | 2.6 (−0.6, 5.7) | 0.112 |
© 2020 by the authors. Licensee MDPI, Basel, Switzerland. This article is an open access article distributed under the terms and conditions of the Creative Commons Attribution (CC BY) license (http://creativecommons.org/licenses/by/4.0/).
Share and Cite
Conner, T.S.; Fletcher, B.D.; Haszard, J.J.; Pullar, J.M.; Spencer, E.; Mainvil, L.A.; Vissers, M.C.M. KiwiC for Vitality: Results of a Placebo-Controlled Trial Testing the Effects of Kiwifruit or Vitamin C Tablets on Vitality in Adults with Low Vitamin C Levels. Nutrients 2020, 12, 2898. https://0-doi-org.brum.beds.ac.uk/10.3390/nu12092898
Conner TS, Fletcher BD, Haszard JJ, Pullar JM, Spencer E, Mainvil LA, Vissers MCM. KiwiC for Vitality: Results of a Placebo-Controlled Trial Testing the Effects of Kiwifruit or Vitamin C Tablets on Vitality in Adults with Low Vitamin C Levels. Nutrients. 2020; 12(9):2898. https://0-doi-org.brum.beds.ac.uk/10.3390/nu12092898
Chicago/Turabian StyleConner, Tamlin S., Benjamin D. Fletcher, Jillian J. Haszard, Juliet M. Pullar, Emma Spencer, Louise A. Mainvil, and Margreet C. M. Vissers. 2020. "KiwiC for Vitality: Results of a Placebo-Controlled Trial Testing the Effects of Kiwifruit or Vitamin C Tablets on Vitality in Adults with Low Vitamin C Levels" Nutrients 12, no. 9: 2898. https://0-doi-org.brum.beds.ac.uk/10.3390/nu12092898