Vitamin D Metabolite Profile in Cholecalciferol- or Calcitriol-Supplemented Healthy and Mammary Gland Tumor-Bearing Mice

 , , , , , and
Abstract
:
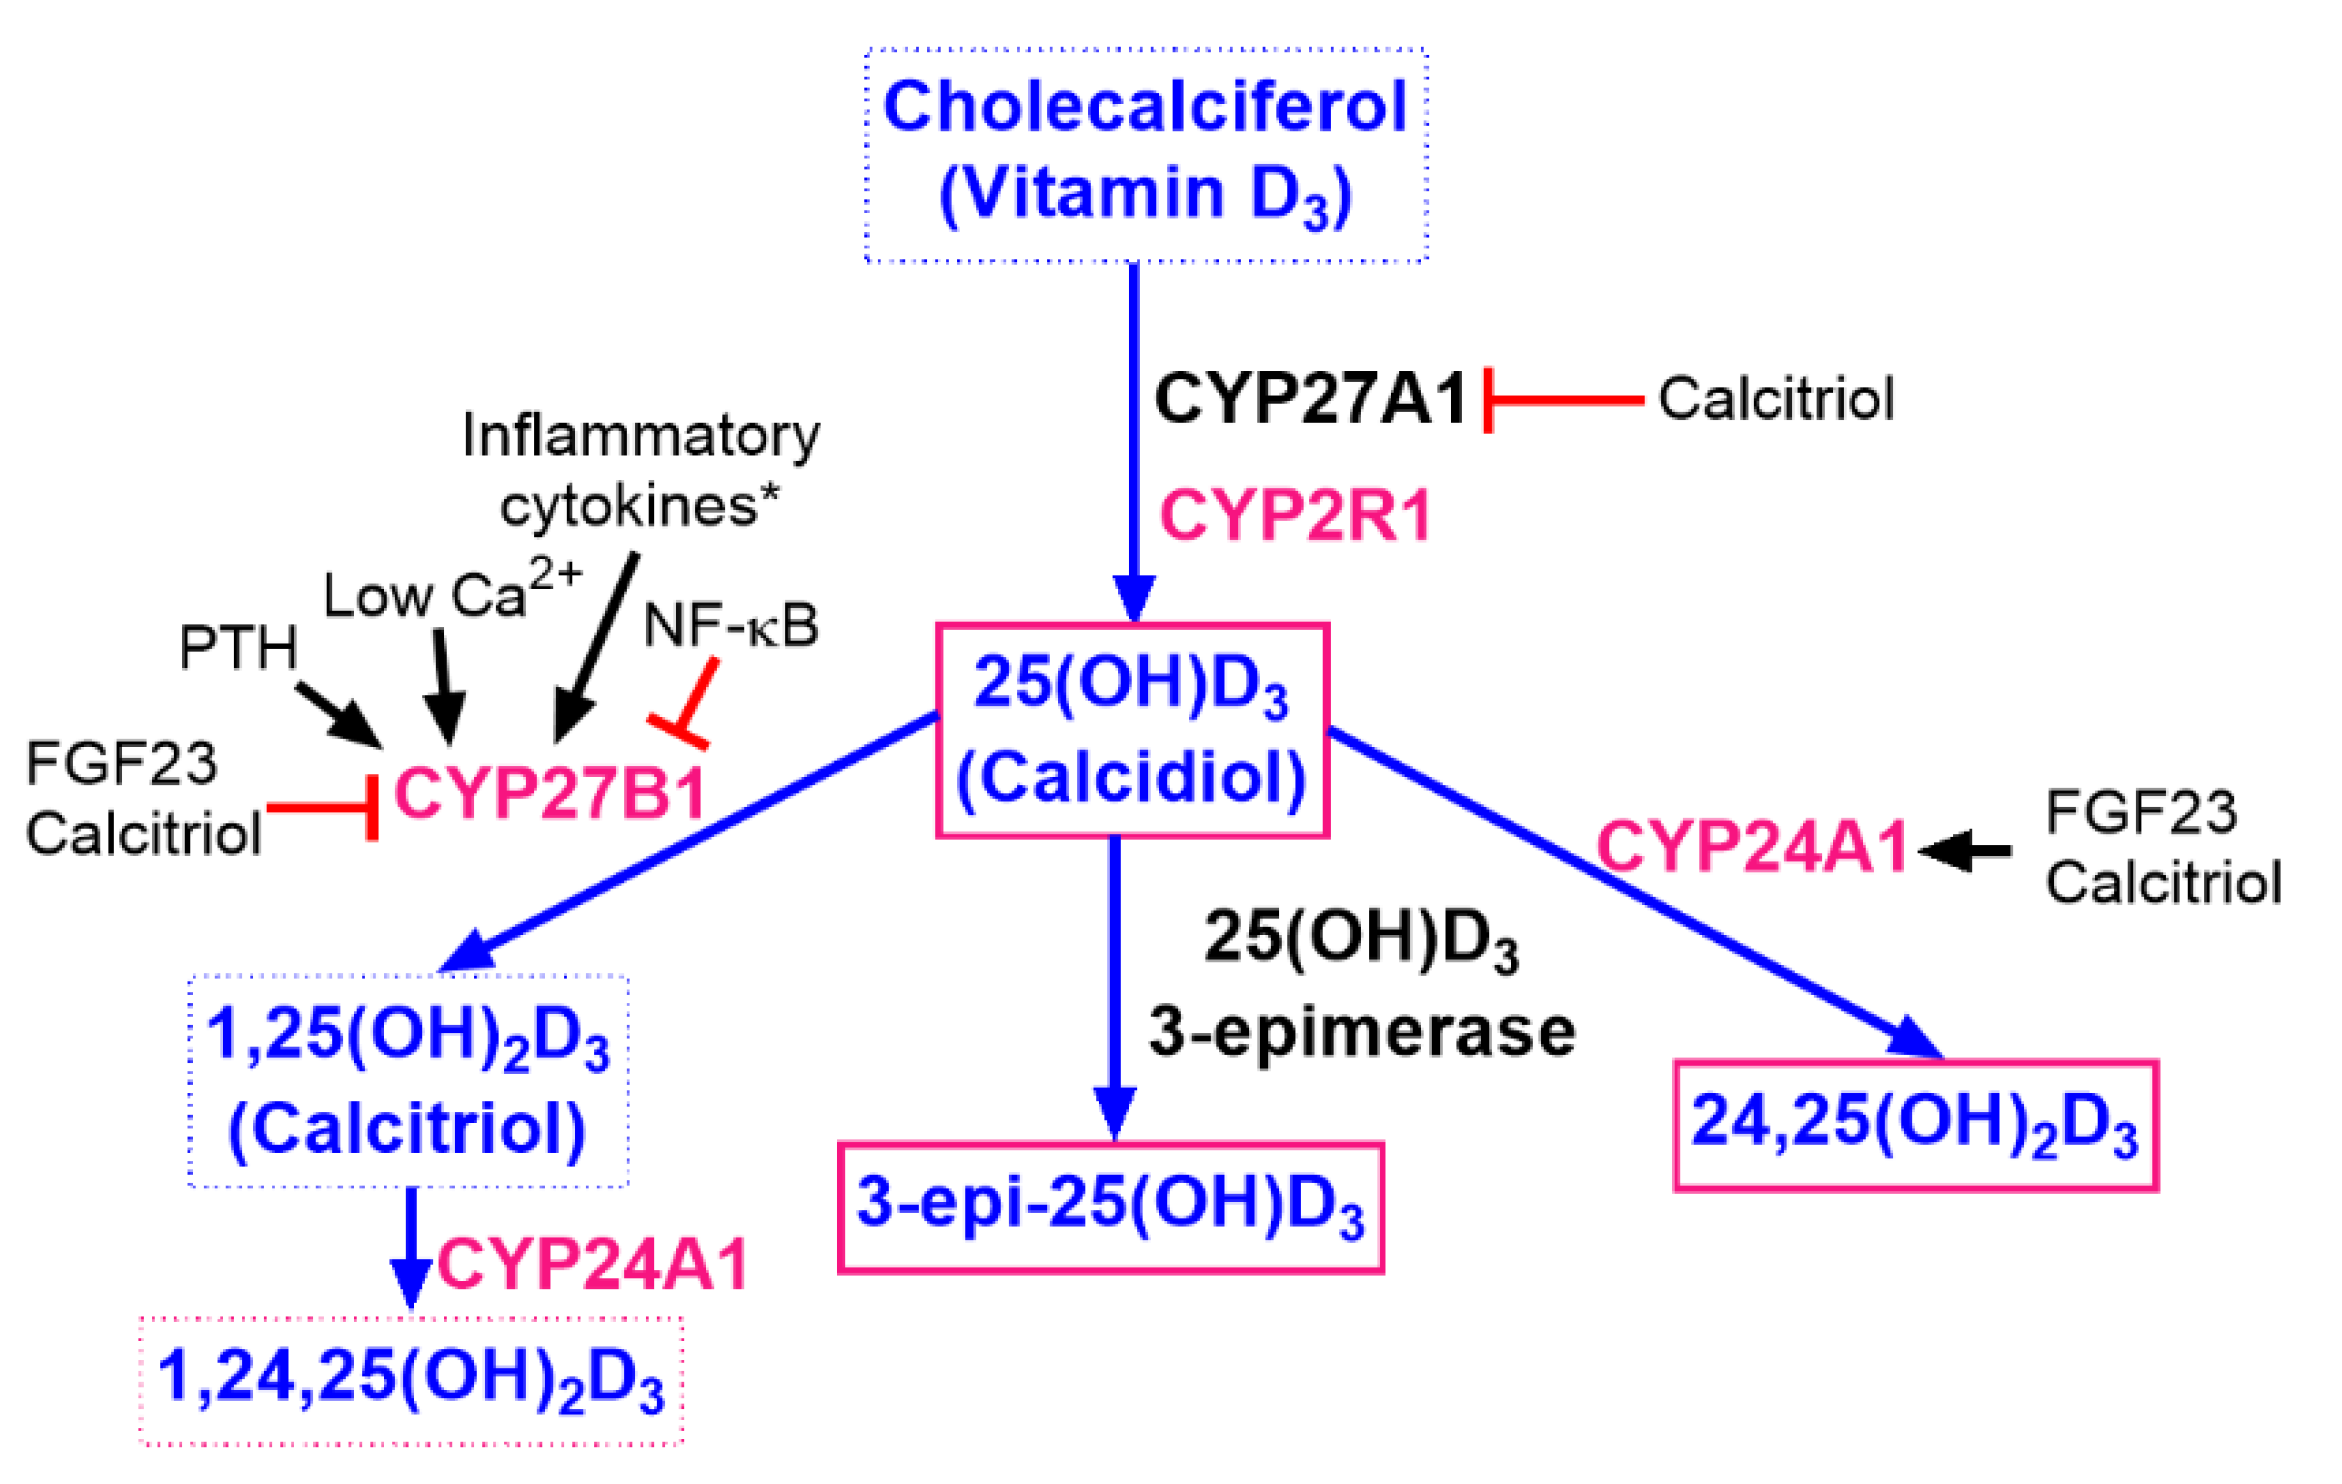
1. Introduction
2. Materials and Methods
2.1. Mice
2.2. Cell Lines
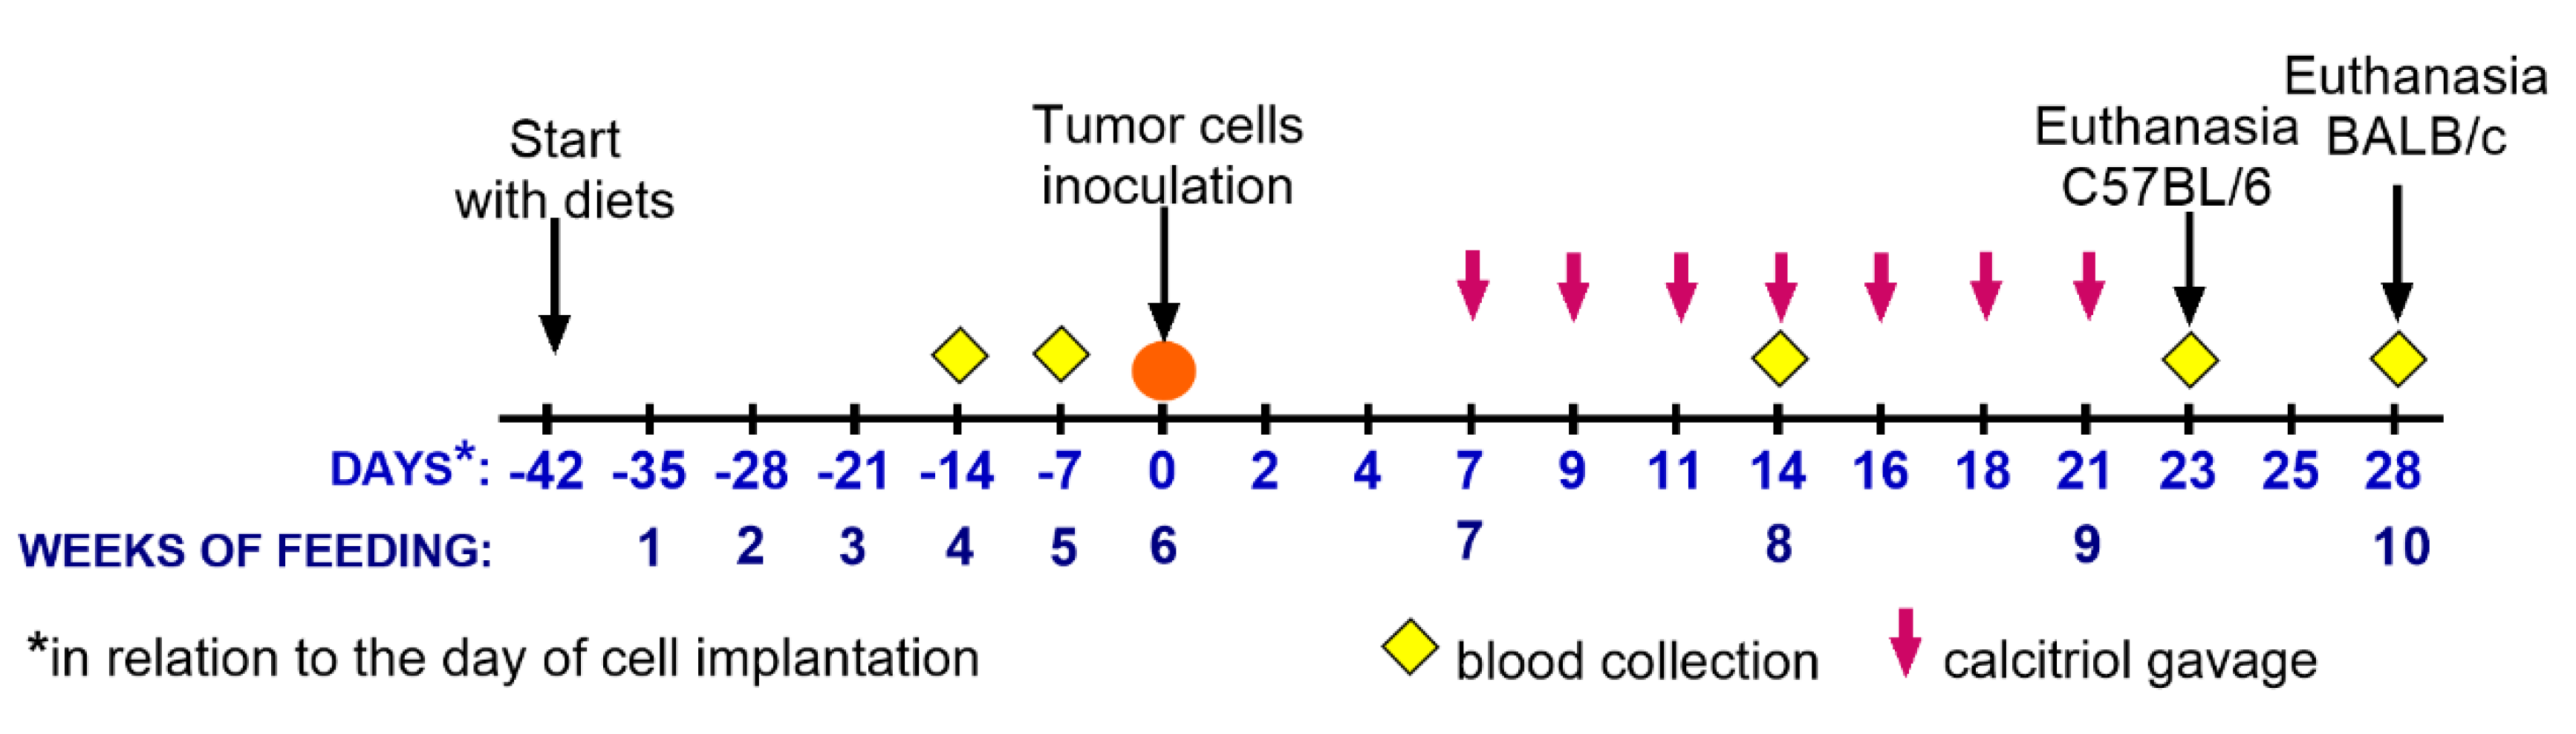
2.3. Tumor Cell Transplantation, Tumor Growth and Metastasis, Diet Composition, and Calcitriol Administration
2.4. Measurements of Vitamin D Metabolites
2.5. Western Blot Analysis of CYP2R1, CYP27A1, CYP24, and VDR
2.5.1. Tissue Lysate Preparation
2.5.2. Western Blot Analyses
2.6. Immunohistochemical Staining for VDR Expression of Lung and Tumor Tissue
2.7. Plasma Biochemical Parameters
2.8. Blood Morphology
2.9. Statistical Analysis
3. Results
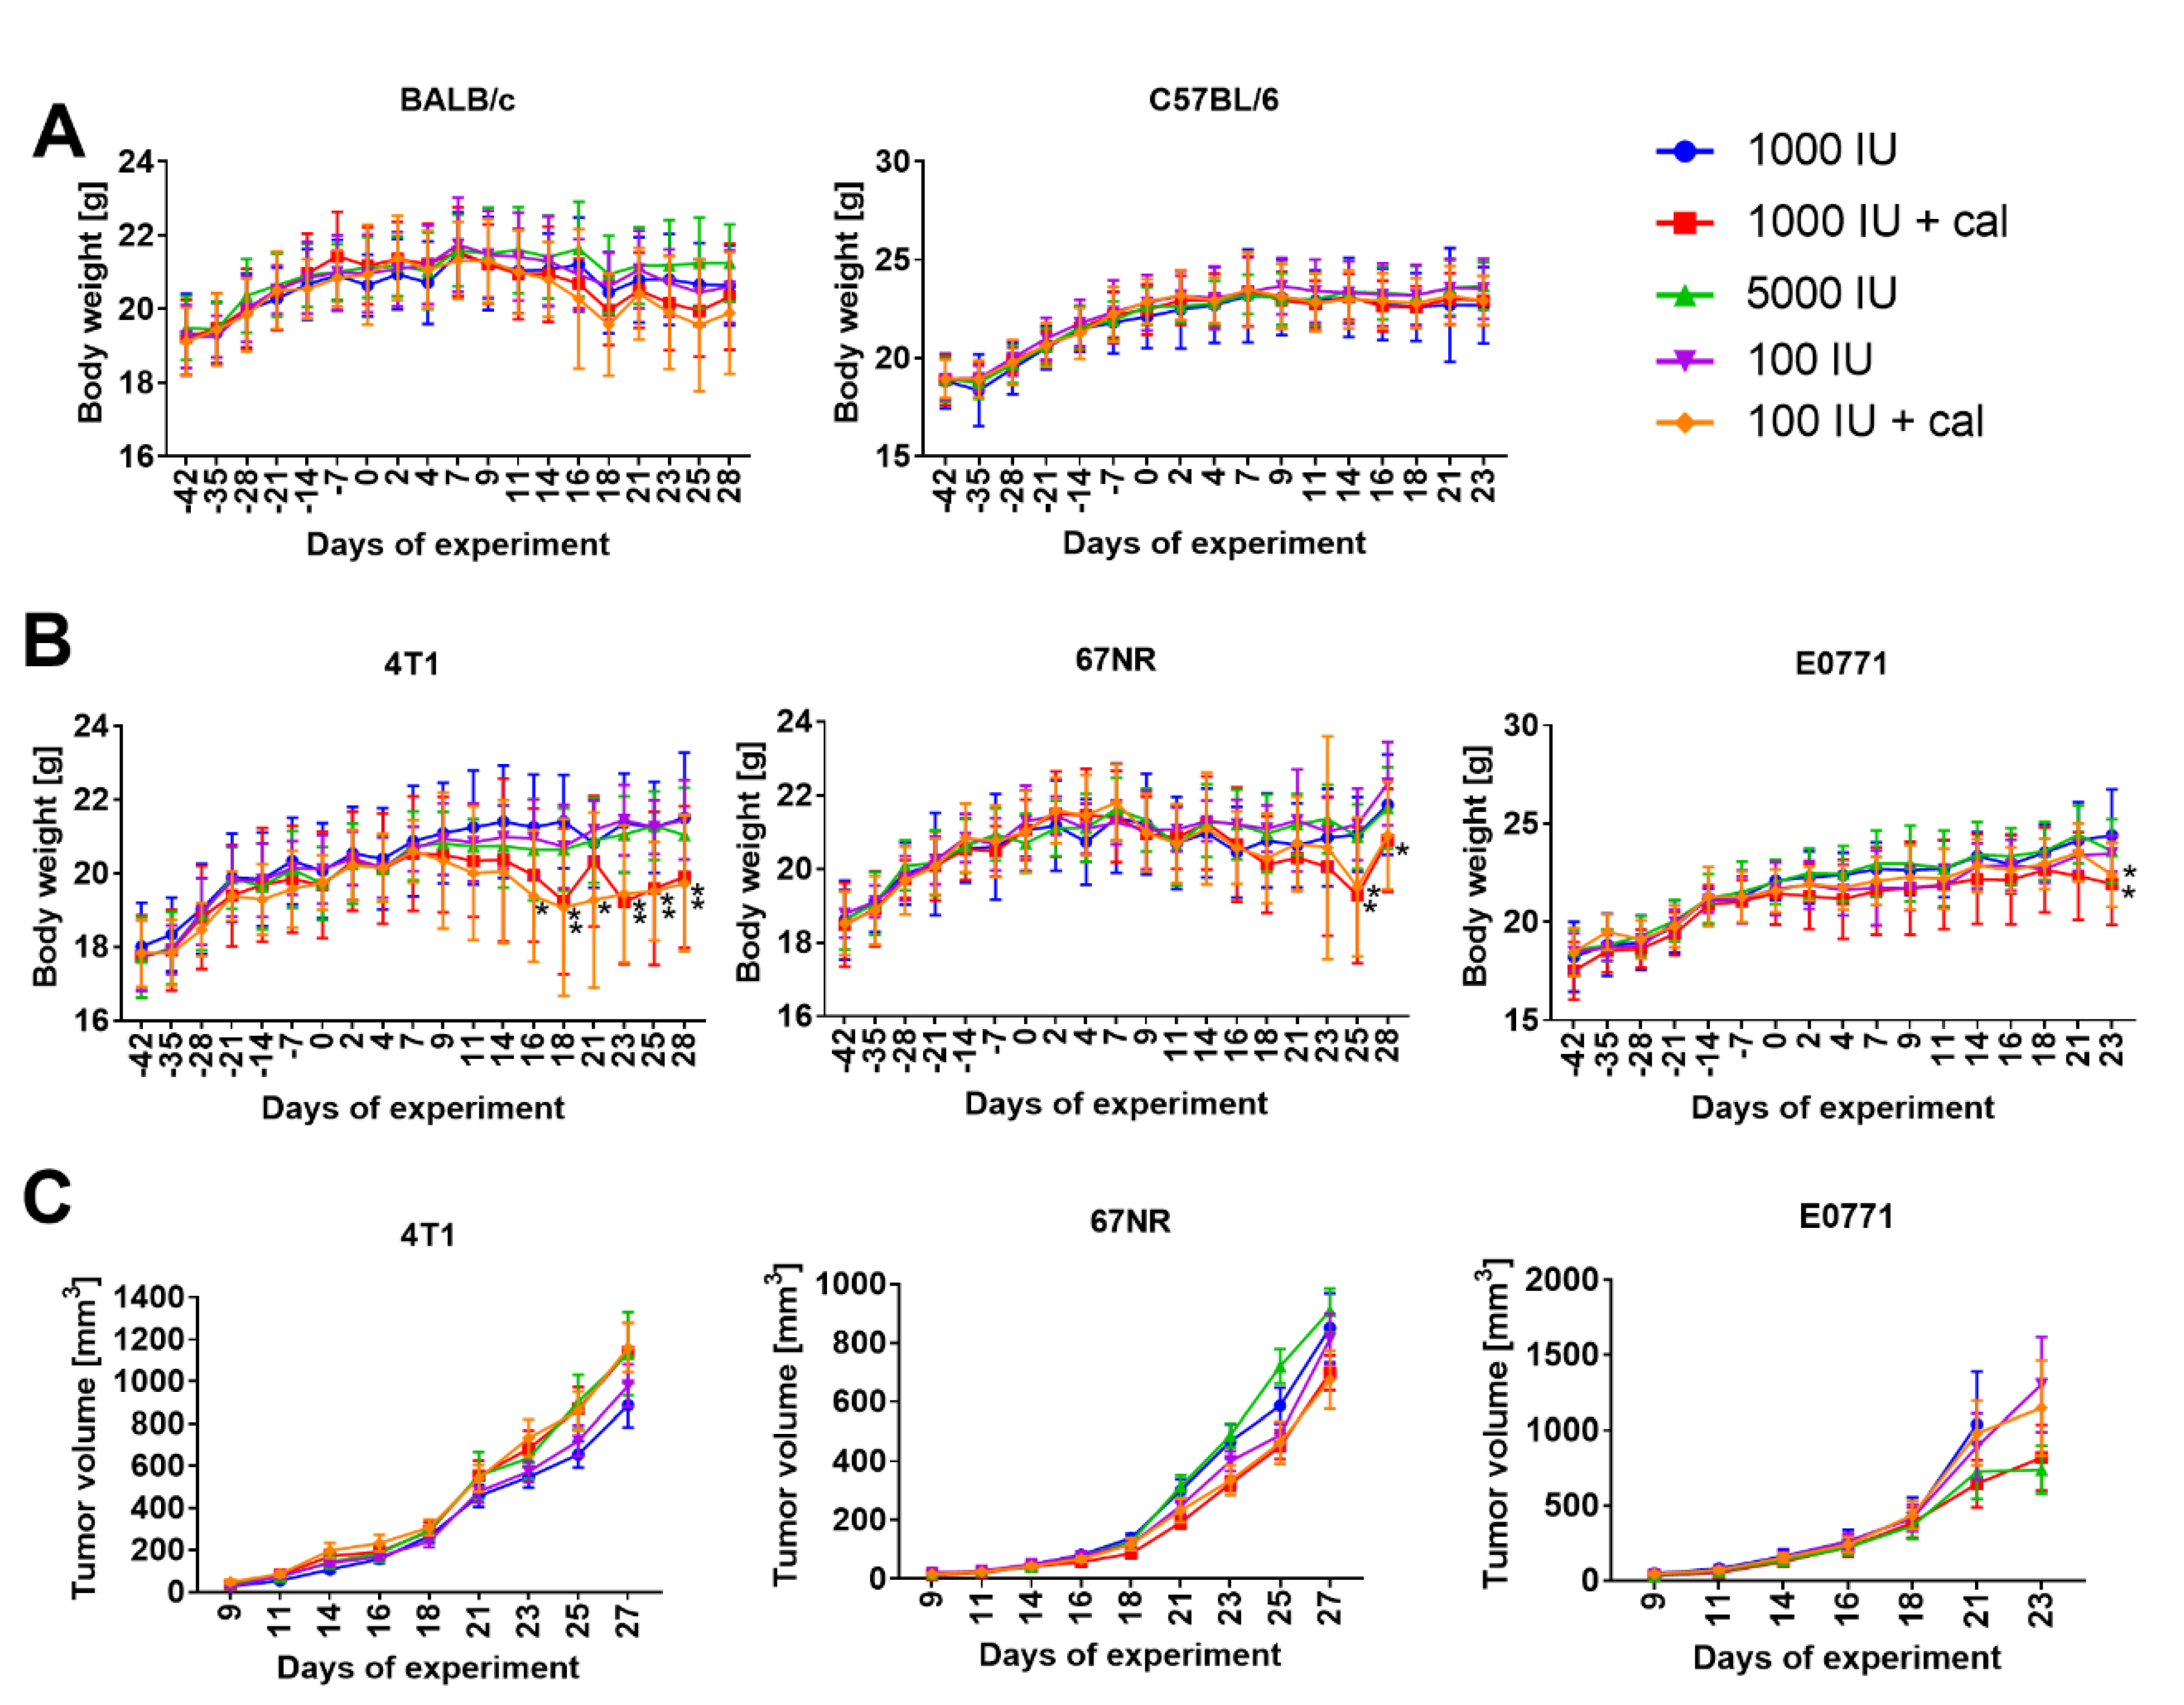
3.1. Body Weight and Tumor Growth Kinetics in BALB/c and C57BL/6 Mice
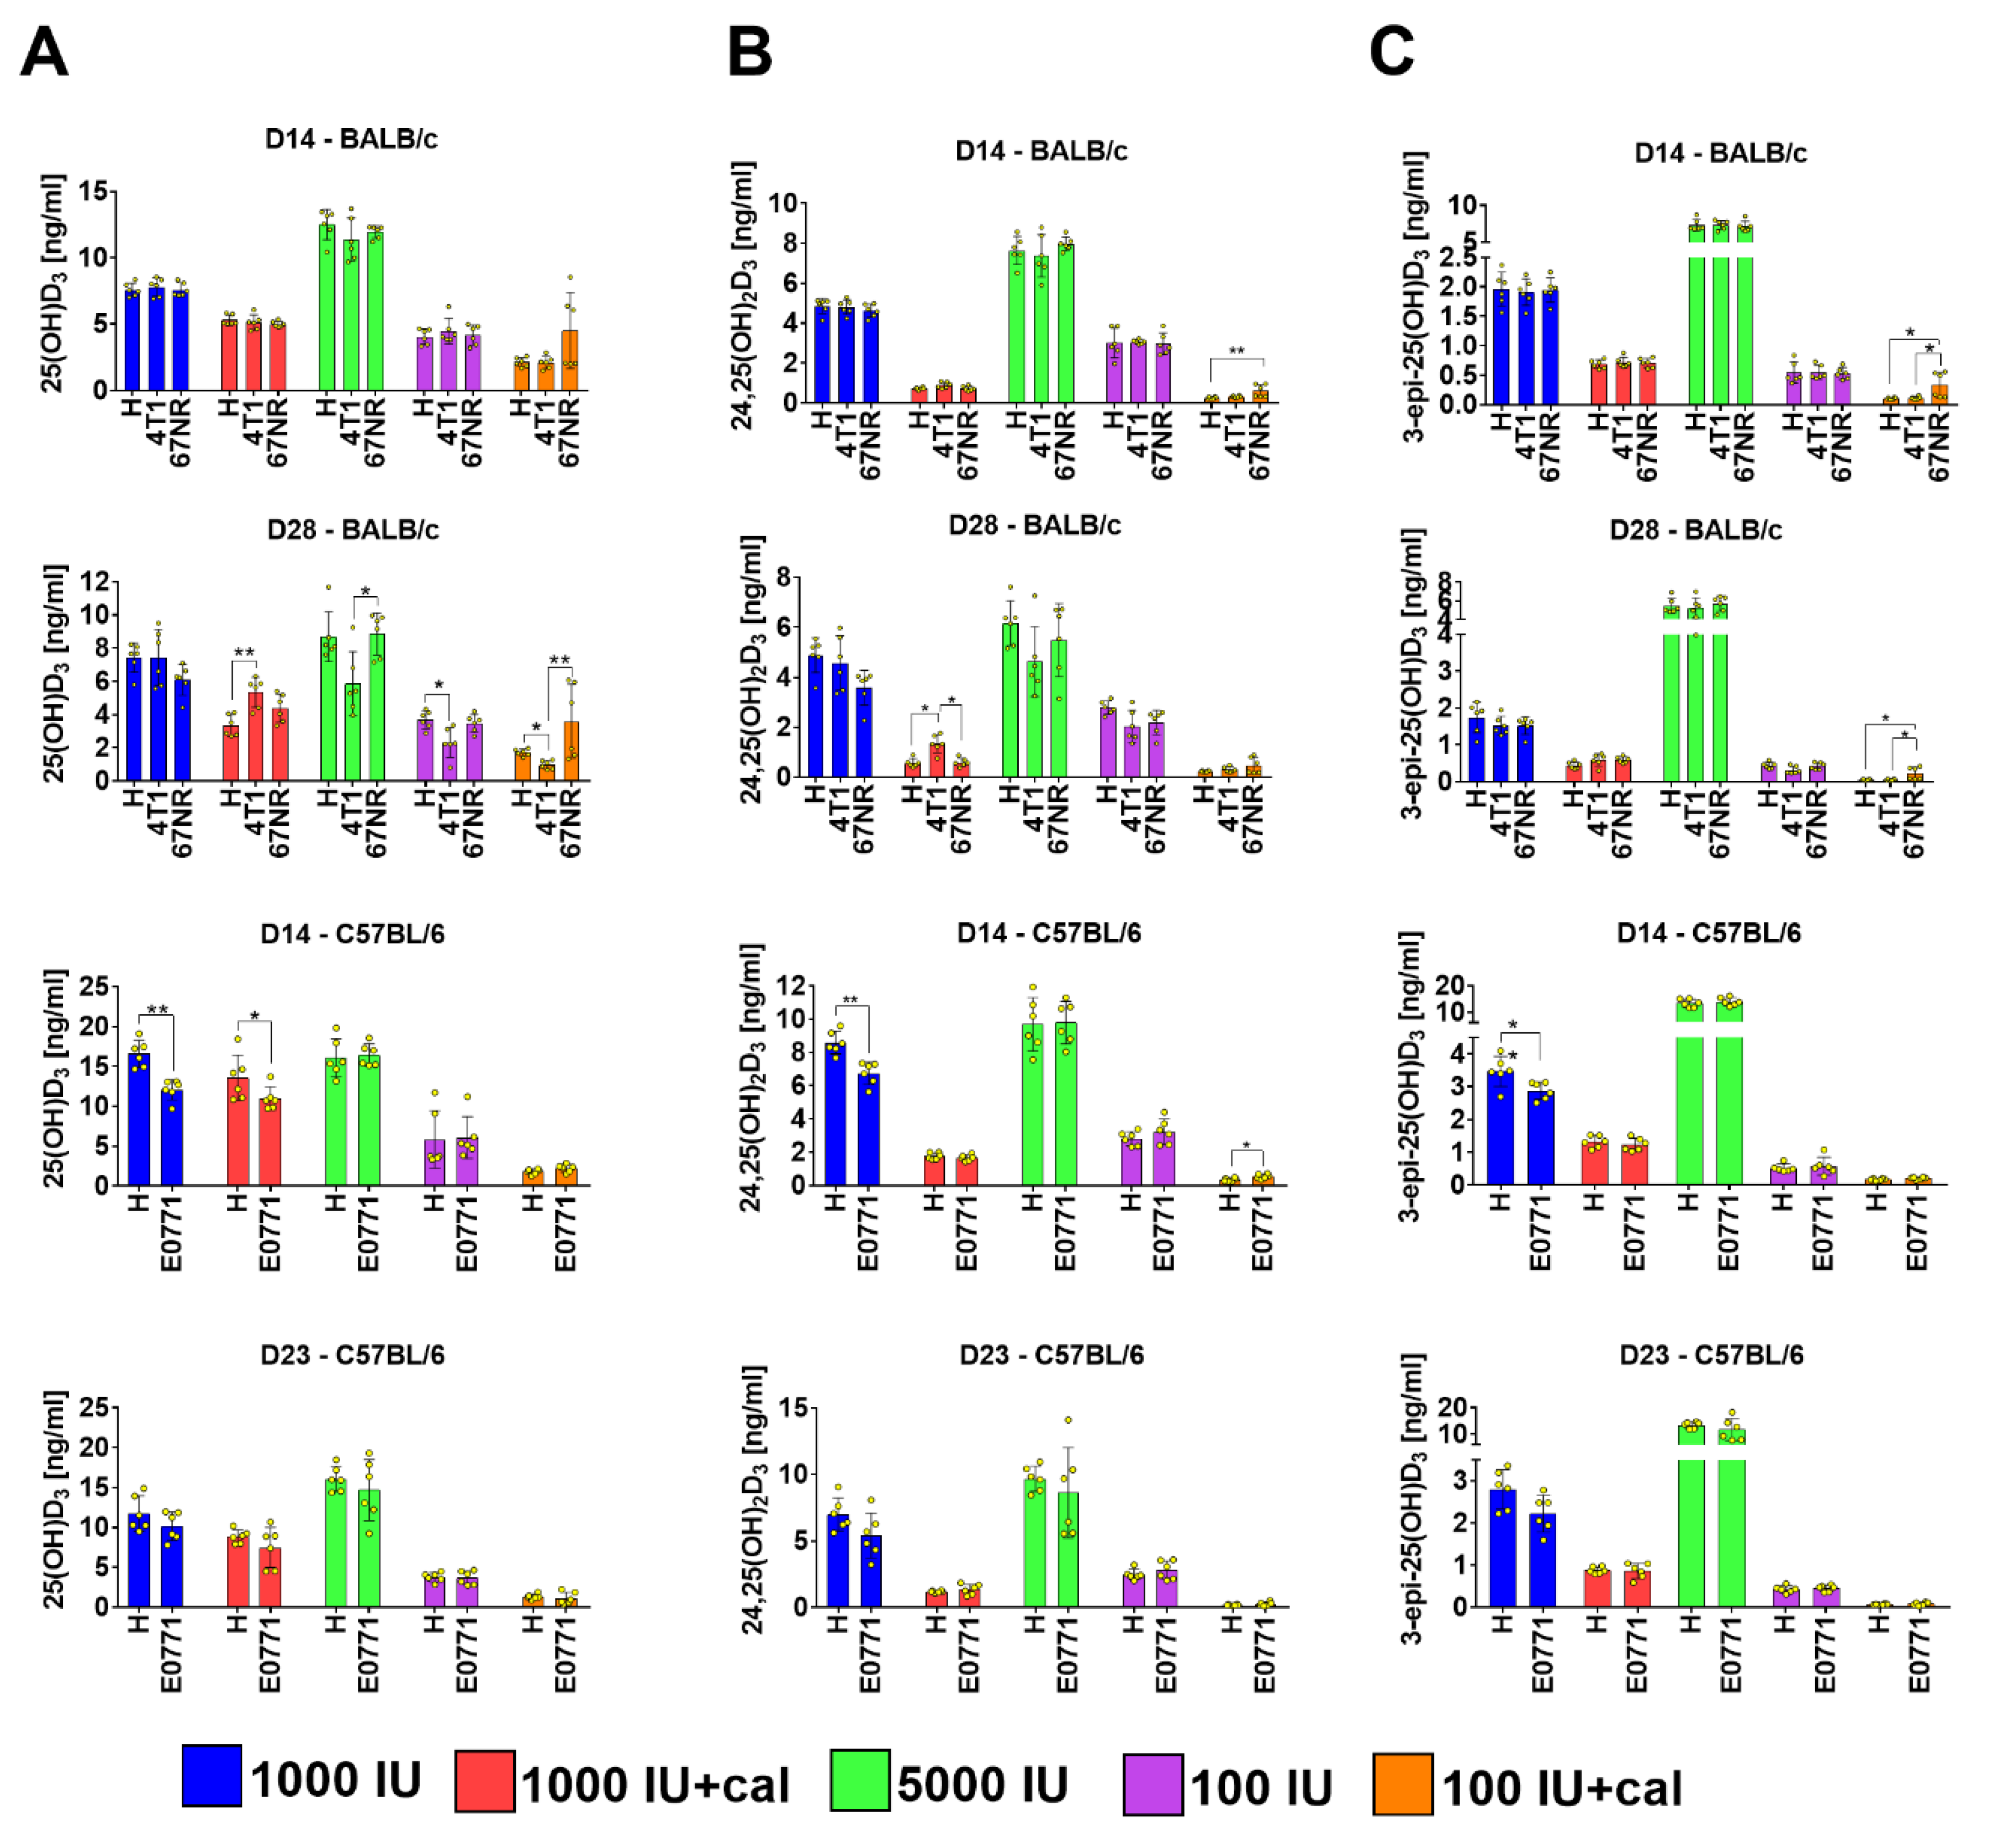
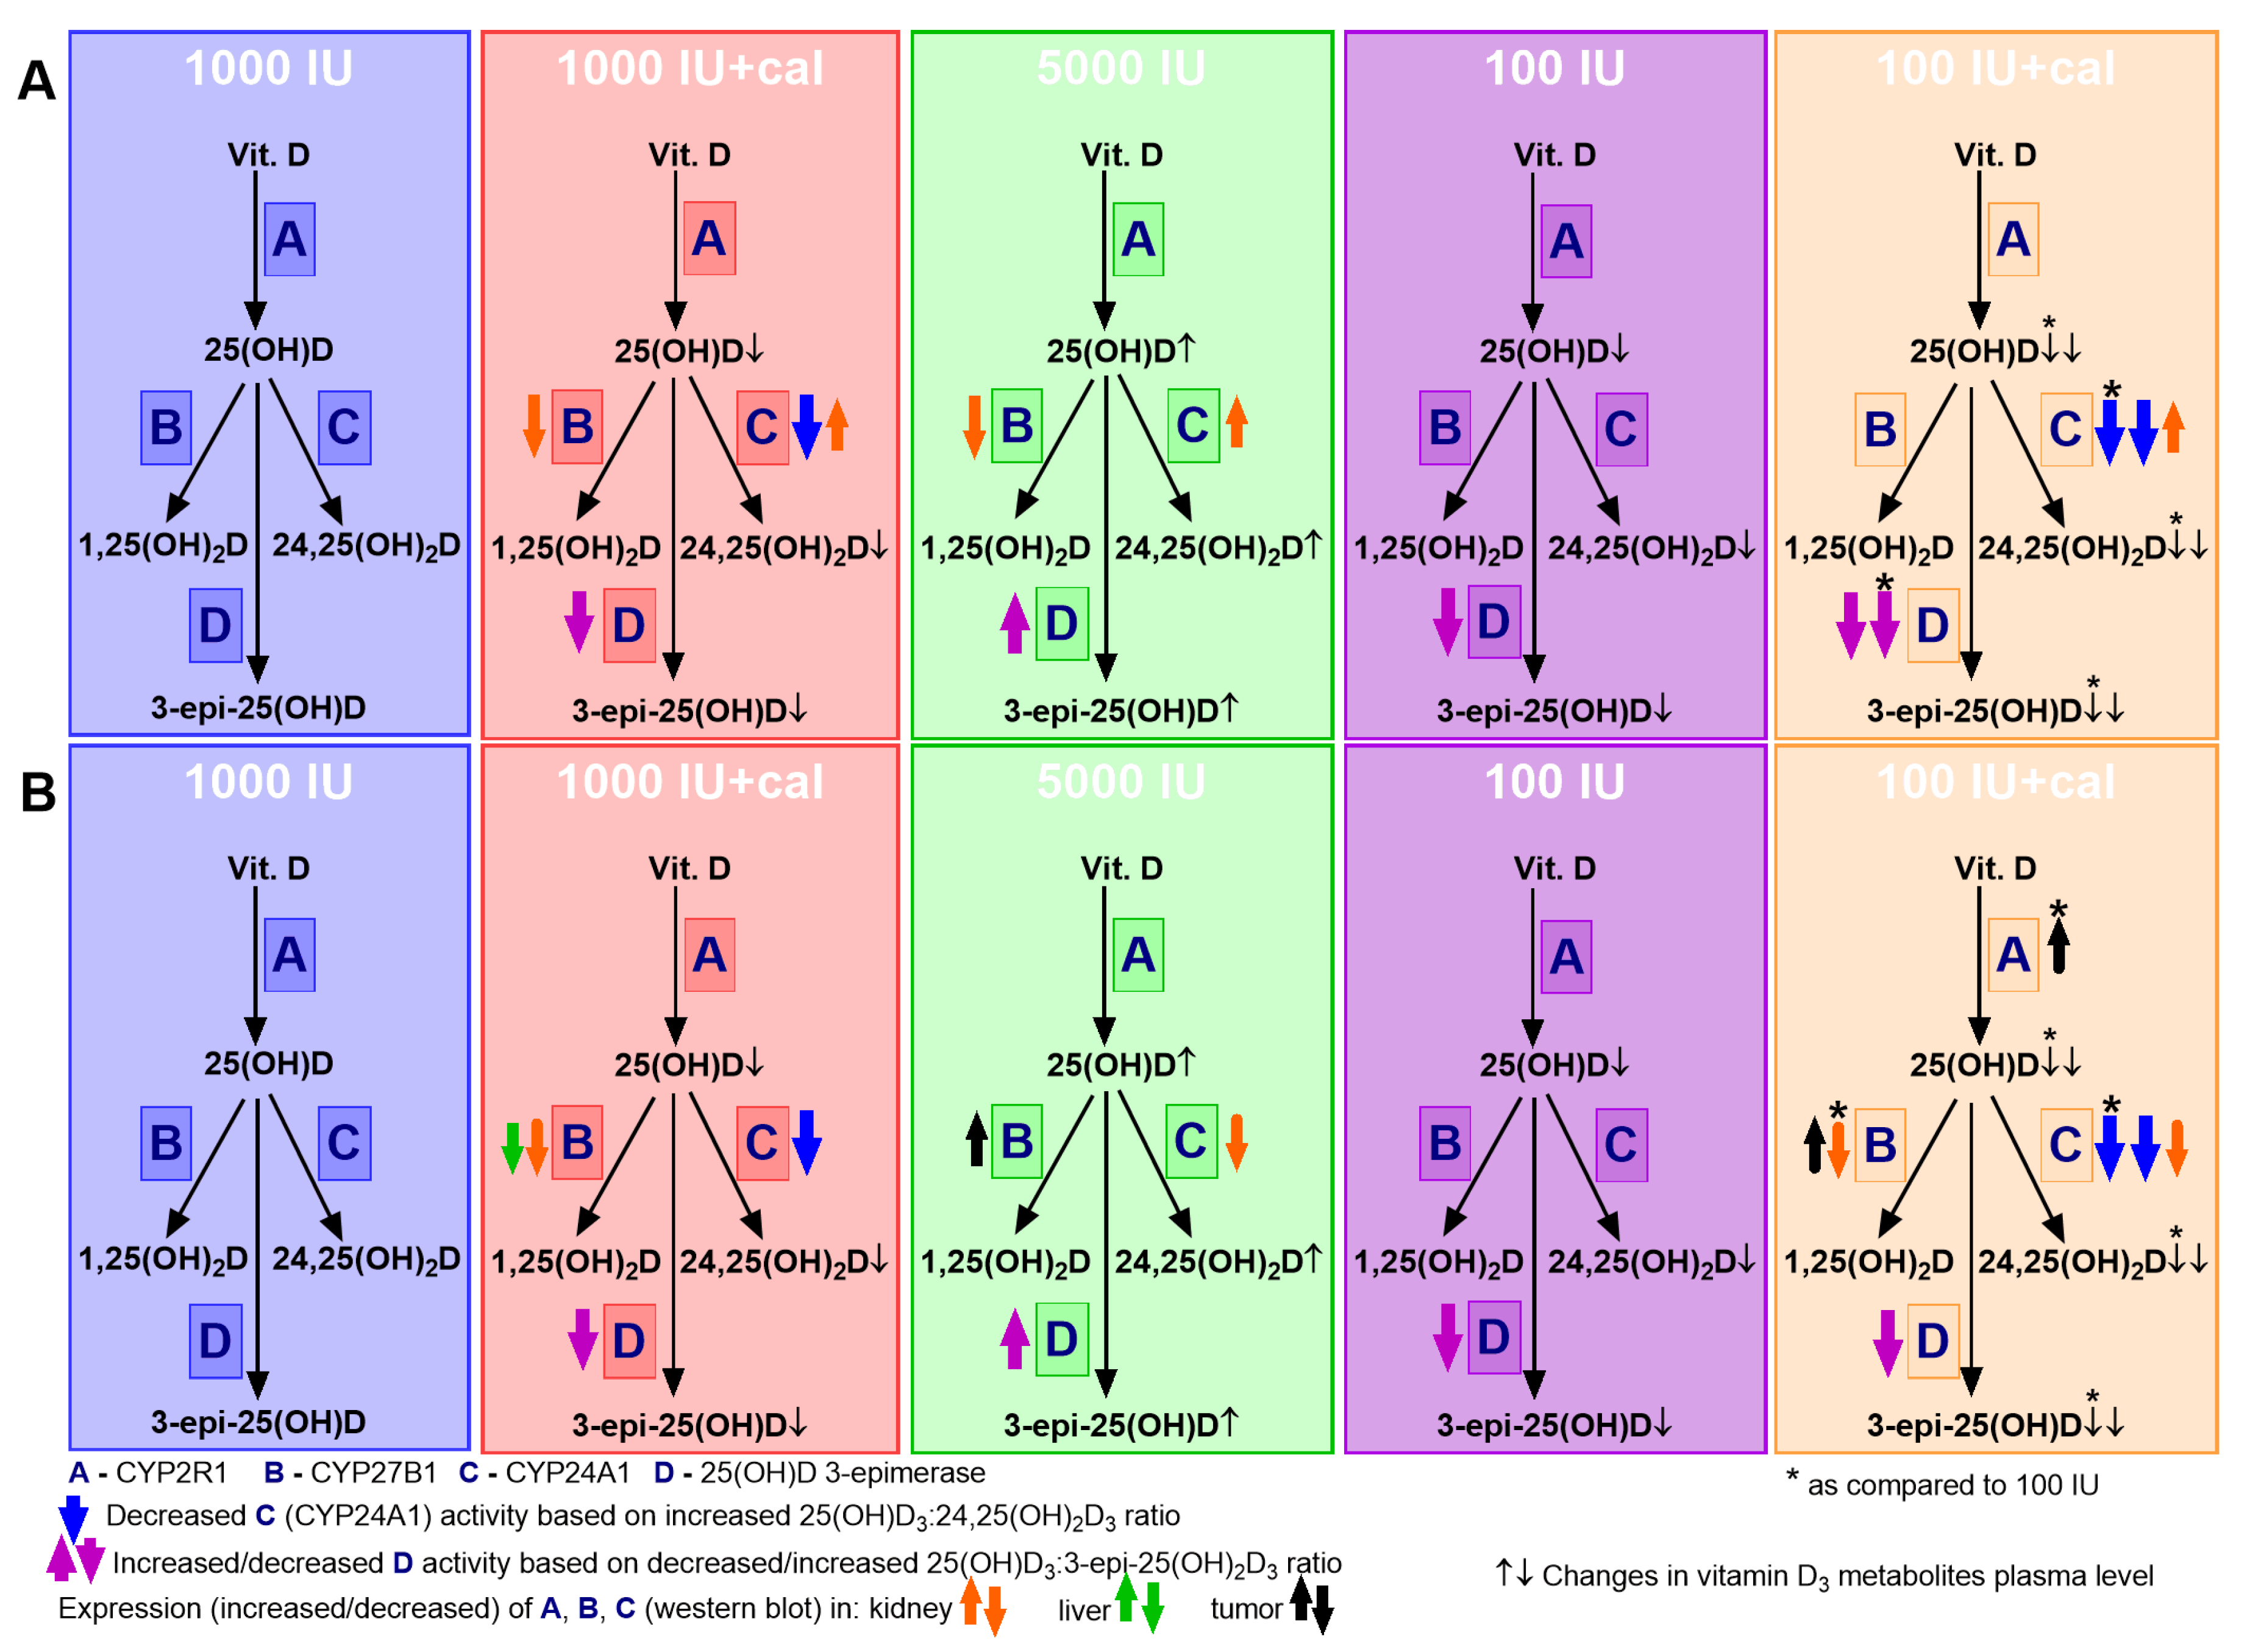
3.2. Vitamin D Metabolite Plasma Levels in Healthy Mice
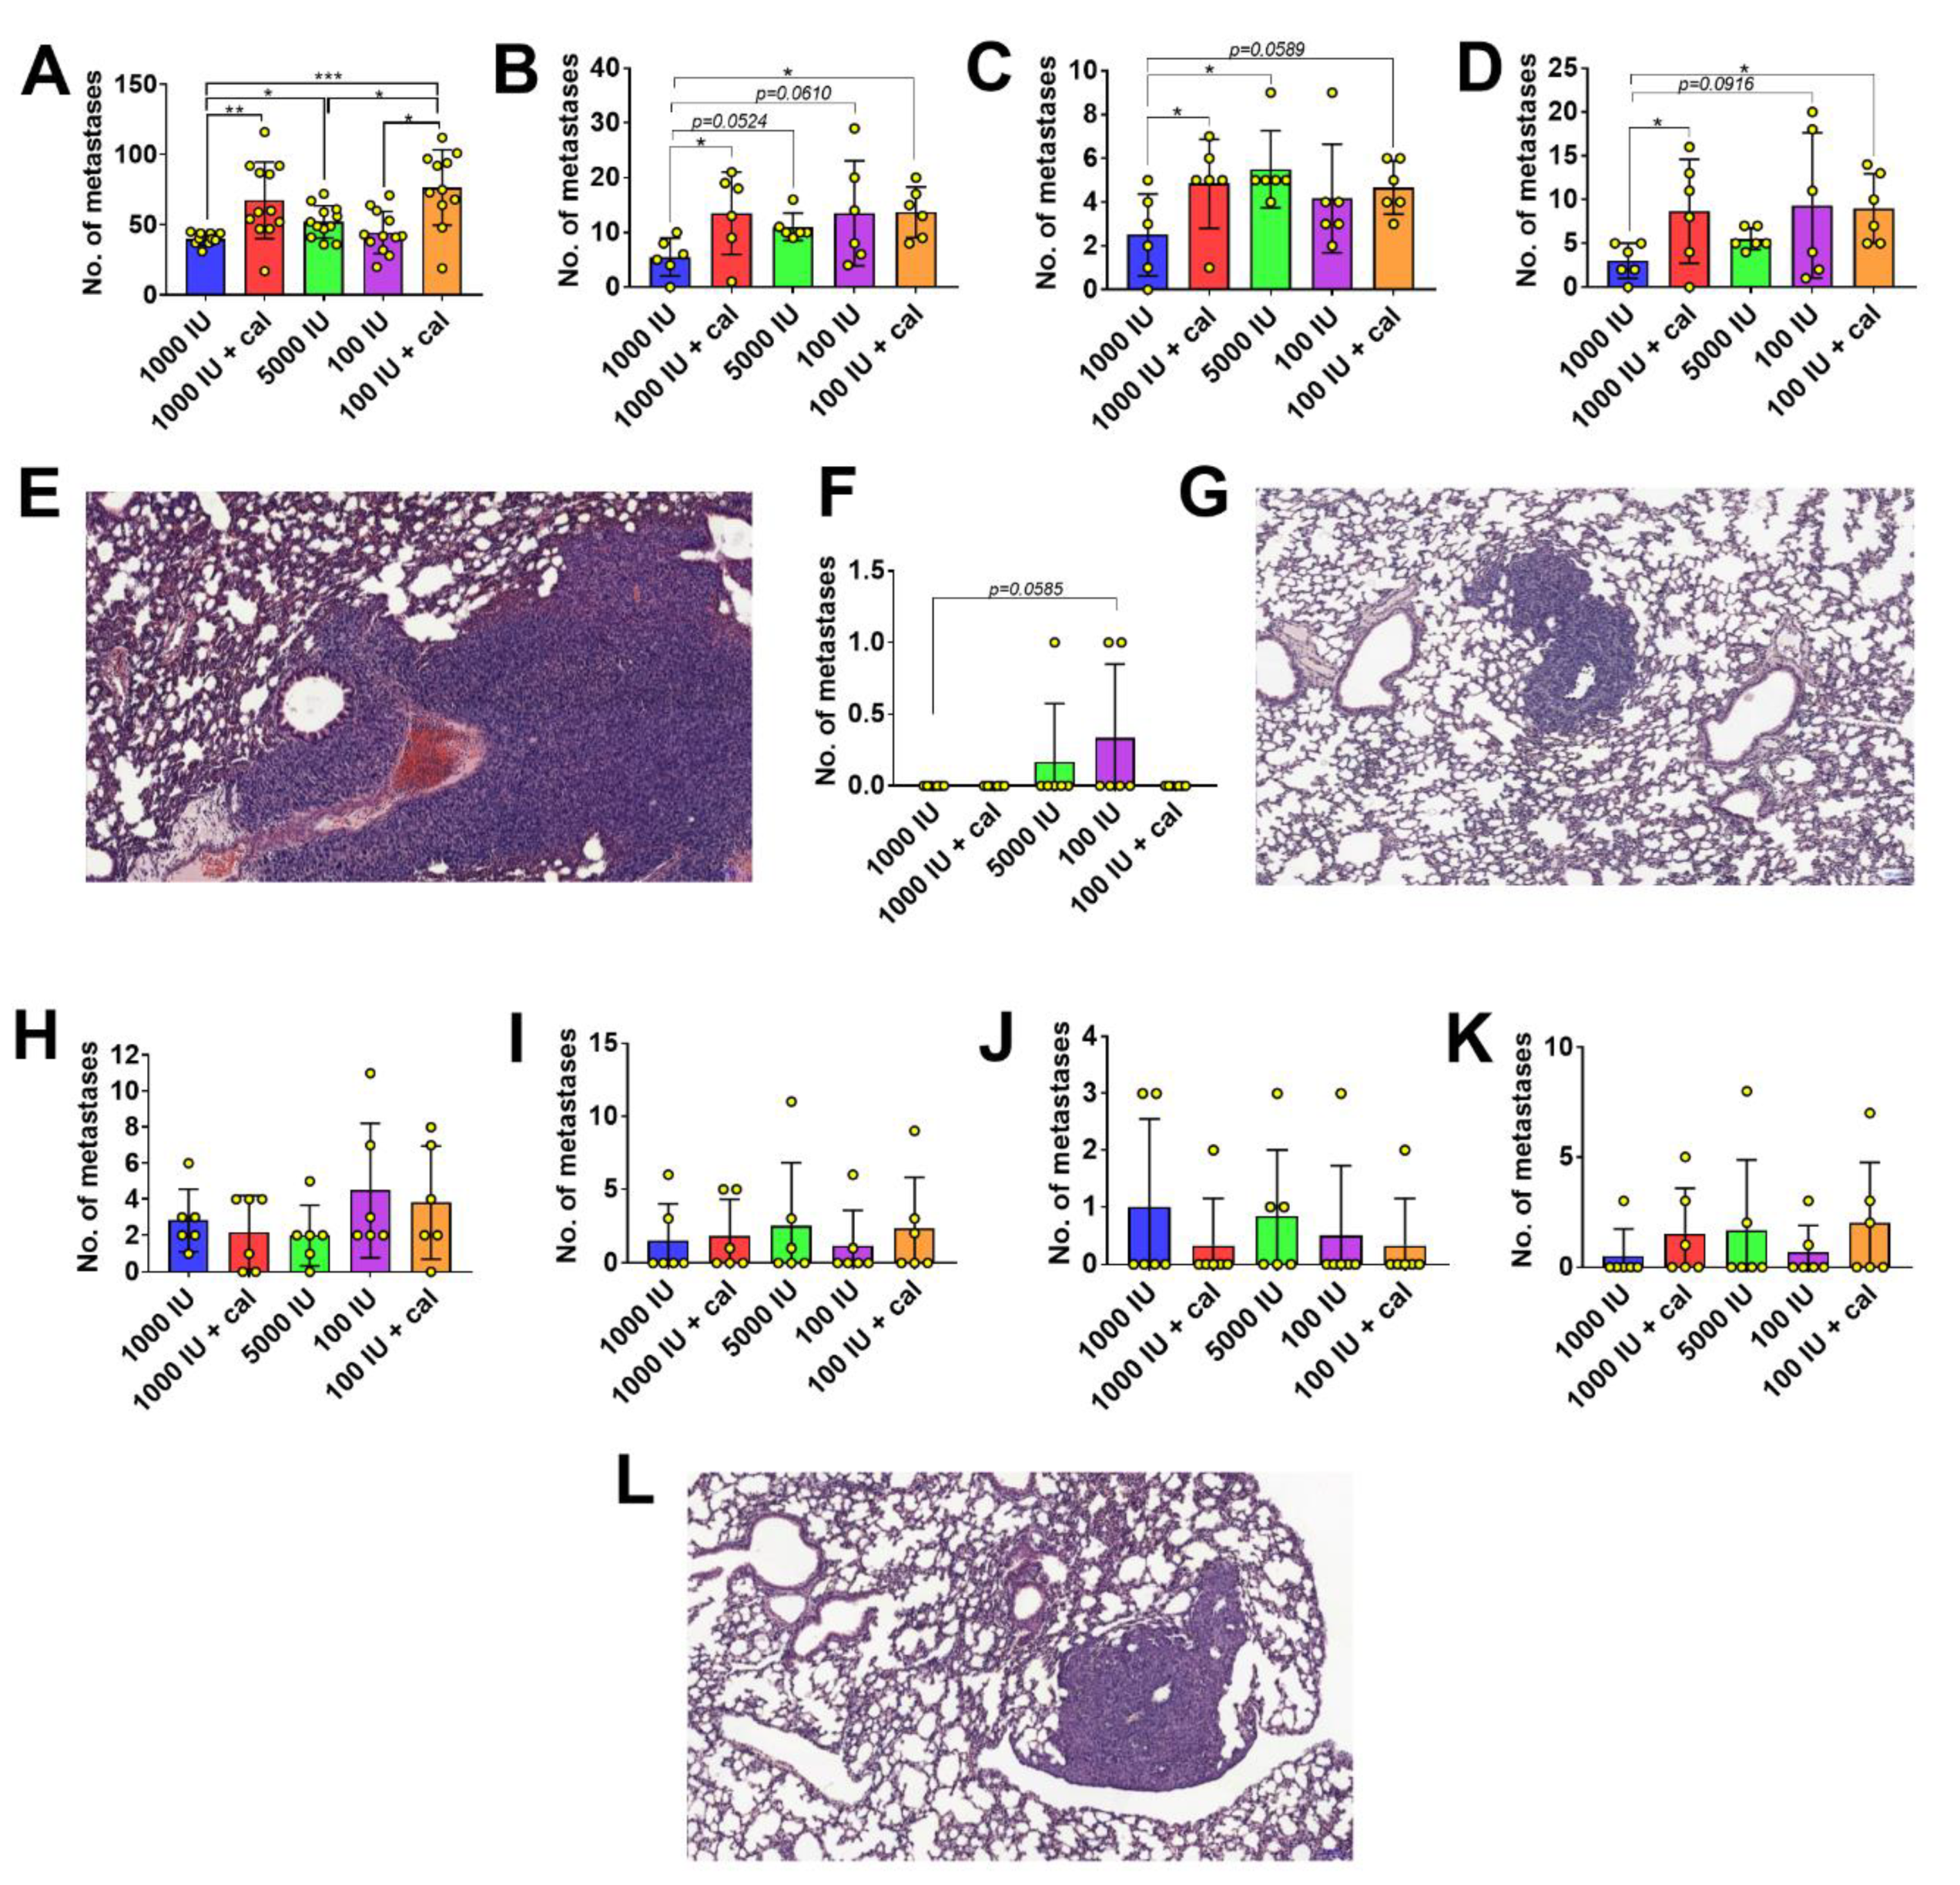
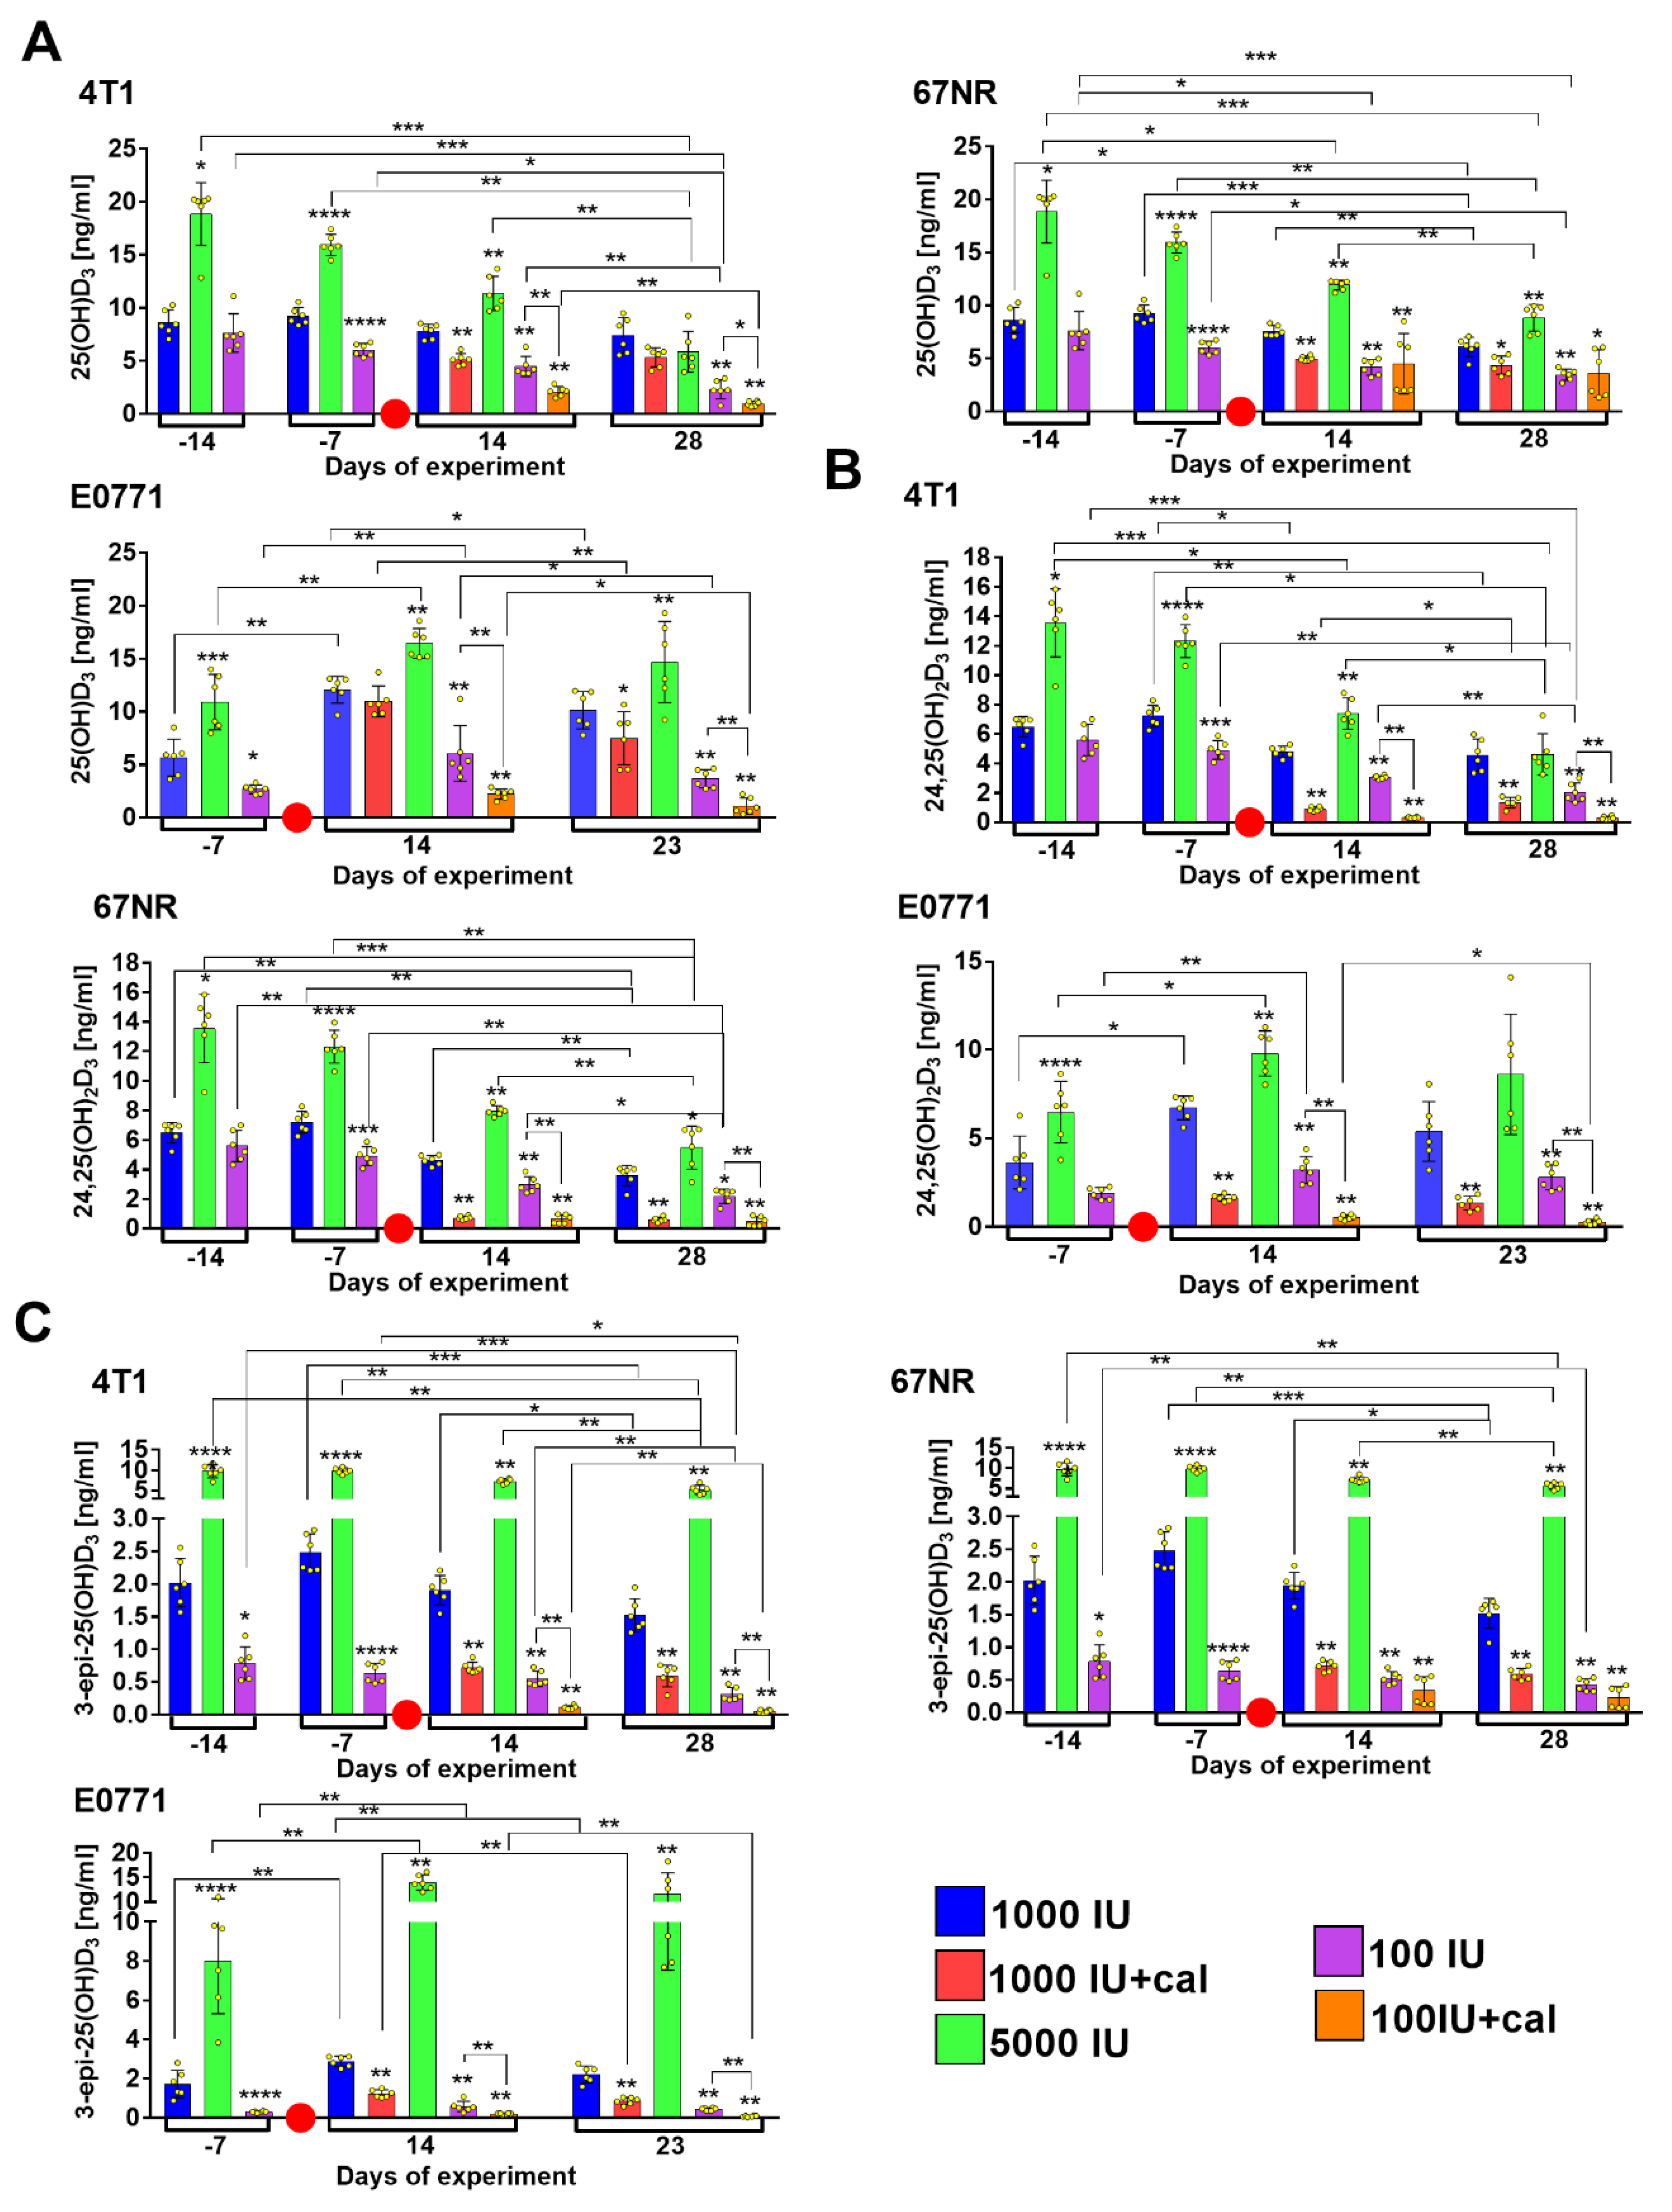
3.3. Vitamin D Metabolite Plasma Levels in Mammary Gland Tumor-Bearing Mice
3.4. Ratio of 25(OH)D3 to 24,25(OH)2D3 and to 3-epi-25(OH)D3
3.5. Blood Biochemical Parameters
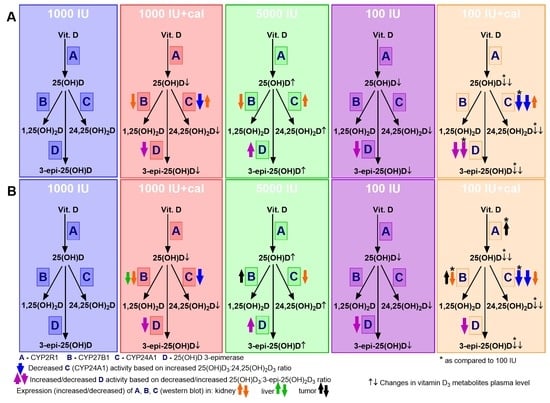
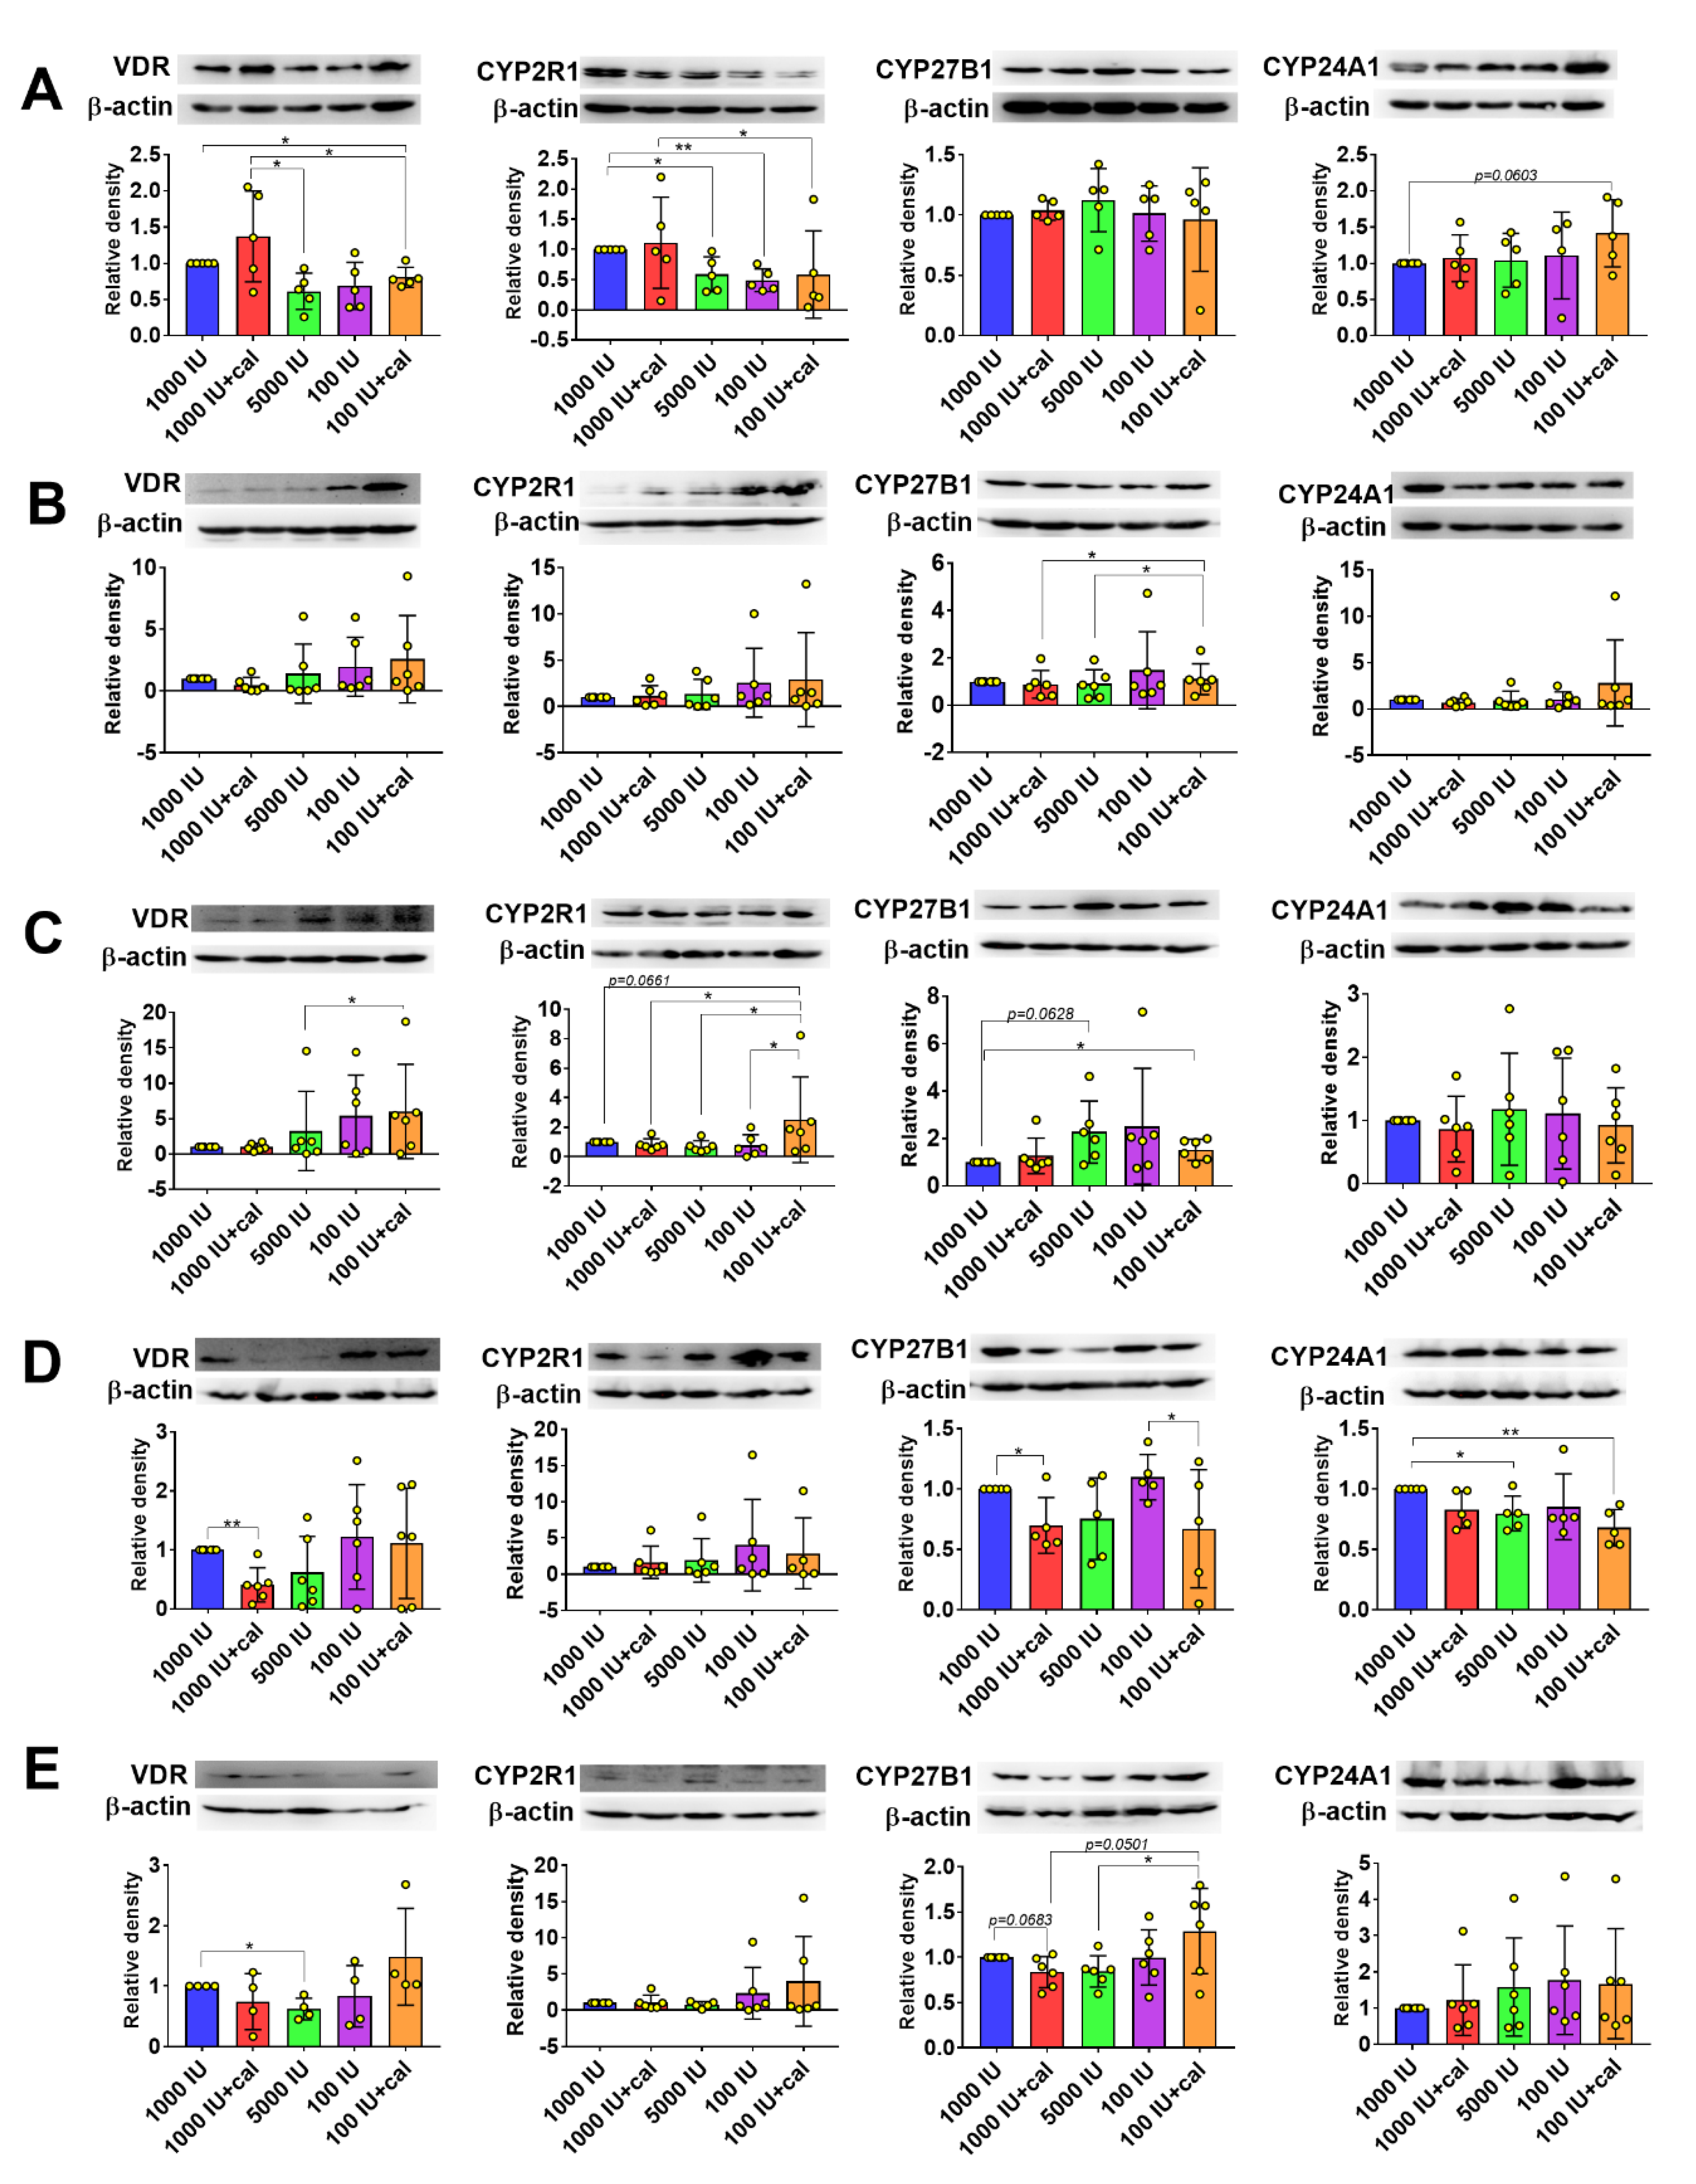
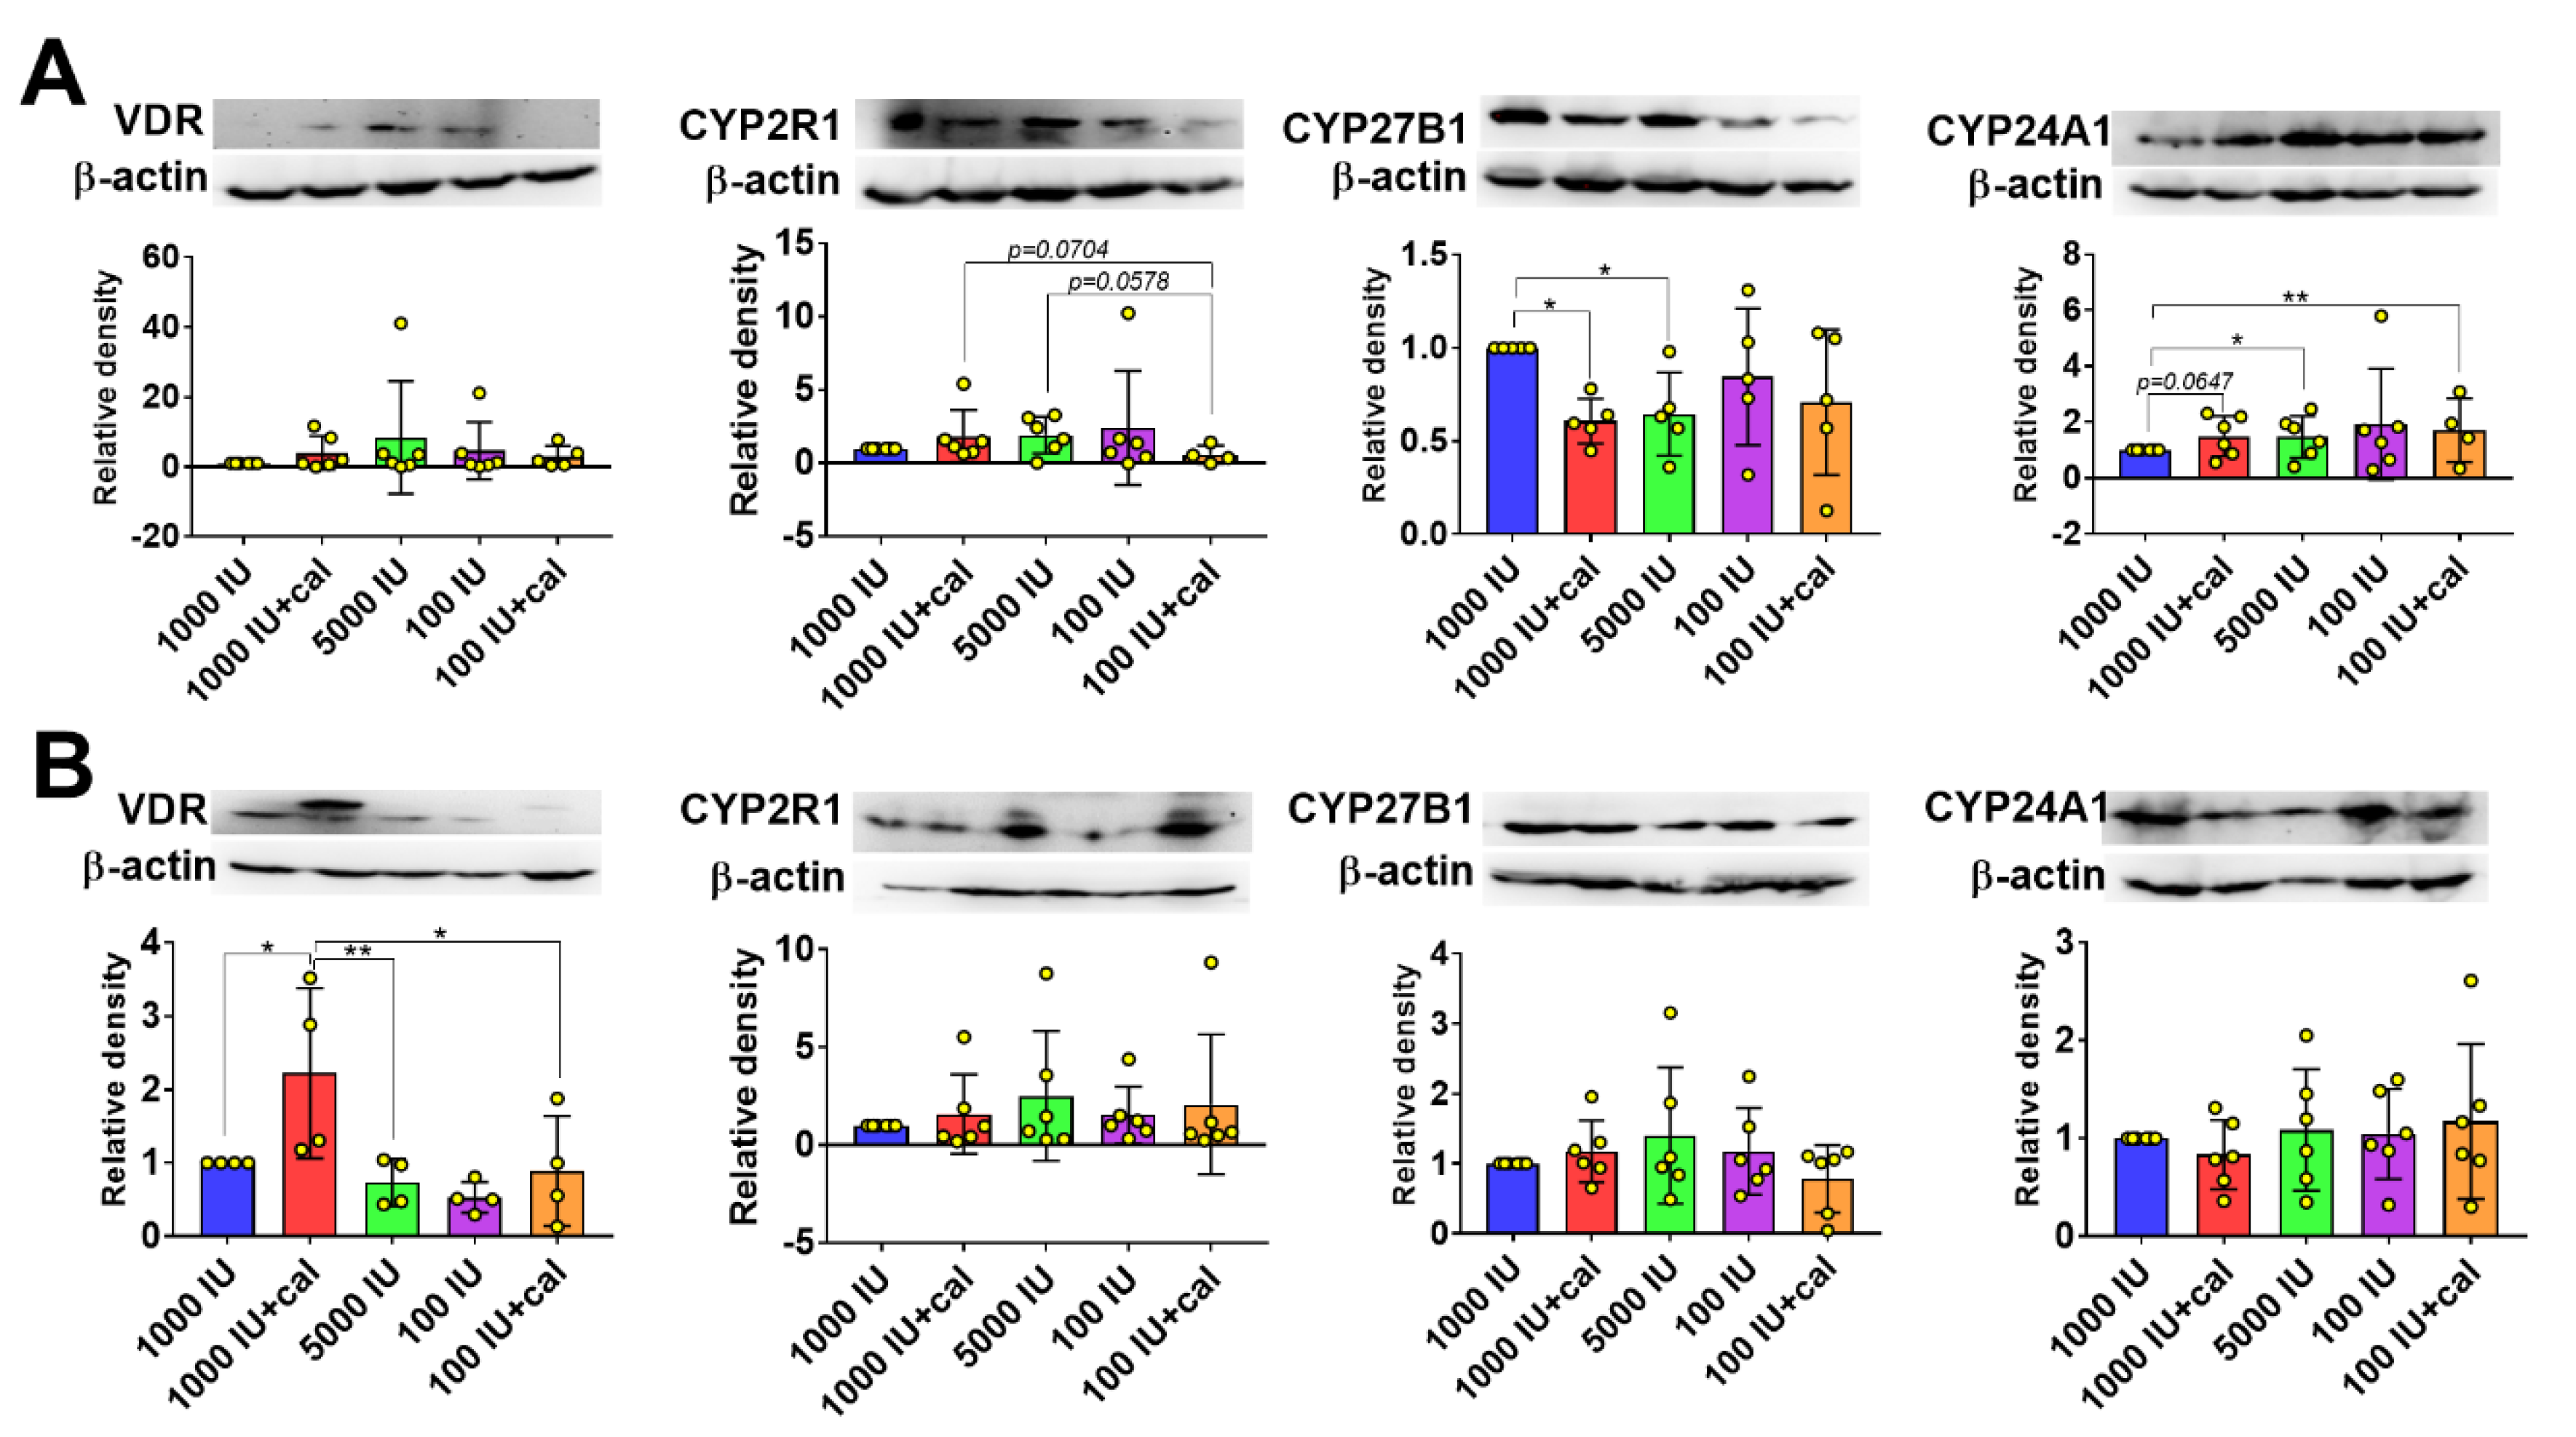
3.6. VDR, CYP2R1, CYP27B1, and CYP24A1 Expression in Tumor Tissue, Liver, and Kidney
3.7. Blood Morphological Parameters Measured on the Last Day of Observation
4. Discussion
5. Conclusions
Supplementary Materials
Author Contributions
Funding
Conflicts of Interest
References
- Feldman, D.; Krishnan, A.V.; Swami, S.; Giovannucci, E.; Feldman, B.J. The role of vitamin D in reducing cancer risk and progression. Nat. Rev. Cancer 2014, 14, 342–357. [Google Scholar] [CrossRef] [PubMed]
- Jacobs, E.T.; Kohler, L.N.; Kunihiro, A.G.; Jurutka, P.W. Vitamin D and Colorectal, Breast, and Prostate Cancers: A Review of the Epidemiological Evidence. J. Cancer 2016, 7, 232–240. [Google Scholar] [CrossRef] [PubMed]
- Cepa, M.; Vaz, C. Management of bone loss in postmenopausal breast cancer patients treated with aromatase inhibitors. Acta Reumatol. Port. 2015, 40, 323–330. [Google Scholar]
- Al-Azhri, J.; Zhang, Y.; Bshara, W.; Zirpoli, G.; McCann, S.E.; Khoury, T.; Morrison, C.D.; Edge, S.B.; Ambrosone, C.B.; Yao, S. Tumor expression of vitamin D receptor and breast cancer histopathological characteristics and prognosis. Clin. Cancer Res. 2017, 23, 97–103. [Google Scholar] [CrossRef] [PubMed] [Green Version]
- Shirazi, L.; Almquist, M.; Borgquist, S.; Malm, J.; Manjer, J. Serum vitamin D (25OHD3) levels and the risk of different subtypes of breast cancer: A nested case-control study. Breast 2016, 28, 184–190. [Google Scholar] [CrossRef] [PubMed]
- Thanasitthichai, S.; Chaiwerawattana, A.; Prasitthipayong, A. Association of vitamin D level with clinicopathological features in breast cancer. Asian Pac. J. Cancer Prev. 2015, 16, 4881–4883. [Google Scholar] [CrossRef] [PubMed] [Green Version]
- Jacot, W.; Pouderoux, S.; Thezenas, S.; Chapelle, A.; Bleuse, J.P.; Romieu, G.; Lamy, P.J. Increased prevalence of vitamin D insufficiency in patients with breast cancer after neoadjuvant chemotherapy. Breast Cancer Res. Treat. 2012, 134, 709–717. [Google Scholar] [CrossRef] [PubMed]
- Singer, O.; Cigler, T.; Moore, A.B.; Levine, A.B.; Do, H.T.; Mandl, L.A. Hypovitaminosis D is a predictor of aromatase inhibitor musculoskeletal symptoms. Breast J. 2014, 20, 174–179. [Google Scholar] [CrossRef] [PubMed]
- LaPorta, E.; Welsh, J. Modeling vitamin D actions in triple negative/basal-like breast cancer. J. Steroid Biochem. Mol. Biol. 2014, 144 Pt A, 65–73. [Google Scholar] [CrossRef] [Green Version]
- Peppone, L.J.; Rickles, A.S.; Janelsins, M.C.; Insalaco, M.R.; Skinner, K.A. The Association Between Breast Cancer Prognostic Indicators and Serum 25-OH Vitamin D Levels. Ann. Surg. Oncol. 2012, 19, 2590–2599. [Google Scholar] [CrossRef] [Green Version]
- Estébanez, N.; Gómez-Acebo, I.; Palazuelos, C.; Llorca, J.; Dierssen-Sotos, T. Vitamin D exposure and Risk of Breast Cancer: A meta-analysis. Sci. Rep. 2018, 8, 9039. [Google Scholar] [CrossRef]
- Manson, J.E.; Cook, N.R.; Lee, I.-M.; Christen, W.; Bassuk, S.S.; Mora, S.; Gibson, H.; Gordon, D.; Copeland, T.; D’Agostino, D.; et al. Vitamin D Supplements and Prevention of Cancer and Cardiovascular Disease. N. Engl. J. Med. 2018, 380, NEJMoa1809944. [Google Scholar] [CrossRef]
- Ordóñez-Mena, J.M.; Schöttker, B.; Fedirko, V.; Jenab, M.; Olsen, A.; Halkjær, J.; Kampman, E.; de Groot, L.; Jansen, E.; Bueno-de-Mesquita, H.B.; et al. Pre-diagnostic vitamin D concentrations and cancer risks in older individuals: An analysis of cohorts participating in the CHANCES consortium. Eur. J. Epidemiol. 2016, 31, 311–323. [Google Scholar] [CrossRef]
- Kanstrup, C.; Teilum, D.; Rejnmark, L.; Bigaard, J.V.; Eiken, P.; Kroman, N.; Tjønneland, A.; Mejdahl, M.K. 25-Hydroxyvitamin D at time of breast cancer diagnosis and breast cancer survival. Breast Cancer Res. Treat. 2019. [Google Scholar] [CrossRef]
- Ooi, L.L.; Zhou, H.; Kalak, R.; Zheng, Y.; Conigrave, A.D.; Seibel, M.J.; Dunstan, C.R. Vitamin D deficiency promotes human breast cancer growth in a murine model of bone metastasis. Cancer Res. 2010, 70, 1835–1844. [Google Scholar] [CrossRef] [PubMed] [Green Version]
- Williams, J.D.; Aggarwal, A.; Swami, S.; Krishnan, A.V.; Ji, L.; Albertelli, M.A.; Feldman, B.J. Tumor autonomous effects of Vitamin D deficiency promote breast cancer metastasis. Endocrinology 2016, 157, 1341–1347. [Google Scholar] [CrossRef] [Green Version]
- Lu, G.; Li, J.; Chu, J.; Jin, S.; Fu, Z.; Miao, D.; Yin, Y. 1,25(OH)2D3 deficiency increases TM40D tumor growth in bone and accelerates tumor-induced bone destruction in a breast cancer bone metastasis model. Biomed. Pharmacother. 2017, 95, 1033–1039. [Google Scholar] [CrossRef]
- Chen, L.; Yang, R.; Qiao, W.; Yuan, X.; Wang, S.; Goltzman, D.; Miao, D. 1,25-Dihydroxy vitamin D prevents tumorigenesis by inhibiting oxidative stress and inducing tumor cellular senescence in mice. Int. J. Cancer 2018, 143, 368–382. [Google Scholar] [CrossRef] [Green Version]
- Milczarek, M.; Chodyński, M.; Filip-Psurska, B.; Martowicz, A.; Krupa, M.; Krajewski, K.; Kutner, A.; Wietrzyk, J. Synthesis and Biological Activity of Diastereomeric and Geometric Analogs of Calcipotriol, PRI-2202 and PRI-2205, Against Human HL-60 Leukemia and MCF-7 Breast Cancer Cells. Cancers 2013, 5, 1355–1378. [Google Scholar] [CrossRef] [PubMed] [Green Version]
- Chiang, K.-C.; Yeh, C.-N.; Yeh, T.-S.; Juang, H.-H.; Chen, L.-W.; Kuo, S.-F.; Chen, M.-H.; Chen, T.C.; Takano, M.; Kittaka, A.; et al. MART-10, a 1alpha,25(OH)2D3 Analog, Potently Represses Metastasis of ER+ Breast Cancer Cells with VEGF-A Overexpression. Anticancer Res. 2018, 38, 3879–3887. [Google Scholar] [CrossRef]
- Wilmanski, T.; Barnard, A.; Parikh, M.R.; Kirshner, J.; Buhman, K.; Burgess, J.; Teegarden, D. 1α,25-Dihydroxyvitamin D Inhibits the Metastatic Capability of MCF10CA1a and MDA-MB-231 Cells in an In Vitro Model of Breast to Bone Metastasis. Nutr. Cancer 2016, 68, 1202–1209. [Google Scholar] [CrossRef] [PubMed] [Green Version]
- Anisiewicz, A.; Pawlik, A.; Filip-Psurska, B.; Turlej, E.; Dzimira, S.; Milczarek, M.; Gdesz, K.; Papiernik, D.; Jarosz, J.; Kłopotowska, D.; et al. Unfavorable effect of calcitriol and its low-calcemic analogs on metastasis of 4T1 mouse mammary gland cancer. Int. J. Oncol. 2017, 52, 103–126. [Google Scholar] [CrossRef]
- Zhang, Y.; Guo, Q.; Zhang, Z.; Bai, N.; Liu, Z.; Xiong, M.; Wei, Y.; Xiang, R.; Tan, X. VDR status arbitrates the prometastatic effects of tumor-associated macrophages. Mol. Cancer Res. 2014, 12, 1181–1191. [Google Scholar] [CrossRef] [Green Version]
- Cao, Y.; Du, Y.; Liu, F.; Feng, Y.; Cheng, S.; Guan, S.; Wang, Y.; Li, X.; Li, B.; Jin, F.; et al. Vitamin D aggravates breast cancer by inducing immunosuppression in the tumor bearing mouse. Immunotherapy 2018, 10, 555–566. [Google Scholar] [CrossRef]
- Marcinkowska, E.; Wallace, G.R.; Brown, G. The Use of 1α,25-Dihydroxyvitamin D3 as an Anticancer Agent. Int. J. Mol. Sci. 2016, 17, 729. [Google Scholar] [CrossRef] [Green Version]
- Prentice, A.; Goldberg, G.R.; Schoenmakers, I. Vitamin D across the lifecycle: Physiology and biomarkers. Am. J. Clin. Nutr. 2008, 88, 500S–506S. [Google Scholar] [CrossRef]
- Krishnan, A.V.; Swami, S.; Feldman, D. Equivalent anticancer activities of dietary vitamin D and calcitriol in an animal model of breast cancer: Importance of mammary CYP27B1 for treatment and prevention. J. Steroid Biochem. Mol. Biol. 2013, 136, 289–295. [Google Scholar] [CrossRef] [Green Version]
- Jeong, Y.; Swami, S.; Krishnan, A.V.; Williams, J.D.; Martin, S.; Horst, R.L.; Albertelli, M.A.; Feldman, B.J.; Feldman, D.; Diehn, M. Inhibition of Mouse Breast Tumor-Initiating Cells by Calcitriol and Dietary Vitamin D. Mol. Cancer Ther. 2015, 14, 1951–1961. [Google Scholar] [CrossRef] [Green Version]
- Swami, S.; Krishnan, A.; Wang, J.; Jensen, K.; Horst, R.; Albertelli, M.; Feldman, D. Dietary vitamin D₃ and 1,25-dihydroxyvitamin D3 (calcitriol) exhibit equivalent anticancer activity in mouse xenograft models of breast and prostate cancer. Endocrinology 2012, 153, 2576–2587. [Google Scholar] [CrossRef] [Green Version]
- Anisiewicz, A.; Filip-Psurska, B.; Pawlik, A.; Nasulewicz-Goldeman, A.; Piasecki, T.; Kowalski, K.; Maciejewska, M.; Jarosz, J.; Banach, J.; Papiernik, D.; et al. Calcitriol Analogues Decrease Lung Metastasis but Impair Bone Metabolism in Aged Ovariectomized Mice Bearing 4T1 Mammary Gland Tumours. Aging Dis. 2019, 10, 977. [Google Scholar] [CrossRef] [Green Version]
- Johnstone, C.N.; Smith, Y.E.; Cao, Y.; Burrows, A.D.; Cross, R.S.N.; Ling, X.; Redvers, R.P.; Doherty, J.P.; Eckhardt, B.L.; Natoli, A.L.; et al. Functional and molecular characterisation of EO771.LMB tumours, a new C57BL/6-mouse-derived model of spontaneously metastatic mammary cancer. Dis. Model. Mech. 2015, 8, 237–251. [Google Scholar] [CrossRef] [Green Version]
- Ogawa, S.; Ooki, S.; Morohashi, M.; Yamagata, K.; Higashi, T. A novel Cookson-type reagent for enhancing sensitivity and specificity in assessment of infant vitamin D status using liquid chromatography/tandem mass spectrometry. Rapid Commun. Mass Spectrom. 2013, 27, 2453–2460. [Google Scholar] [CrossRef]
- Rola, R.; Kowalski, K.; Bieńkowski, T.; Kołodyńska-Goworek, A.; Studzińska, S. Development of a method for multiple vitamin D metabolite measurements by liquid chromatography coupled with tandem mass spectrometry in dried blood spots. Analyst 2019, 144, 299–309. [Google Scholar] [CrossRef]
- Jones, G.; Prosser, D.E.; Kaufmann, M. The Activating Enzymes of Vitamin D Metabolism (25- and 1α-Hydroxylases). In Vitamin D, 4th ed.; Elsevier Inc.: Amsterdam, The Netherlands, 2018; Volume 1, pp. 57–79. ISBN 9780128099667. [Google Scholar]
- Halloran, B.P.; Bikle, D.D.; Levens, M.J.; Castro, M.E.; Globus, R.K.; Holton, E. Chronic 1,25-dihydroxyvitamin D3 administration in the rat reduces the serum concentration of 25-hydroxyvitamin D by increasing metabolic clearance rate. J. Clin. Investig. 1986, 78, 622–628. [Google Scholar] [CrossRef]
- Zhang, H.; Huang, Q.R.; Gu, J.M.; Hu, W.W.; Liu, Y.J.; Hu, Y.Q.; Zhang, Z.L. Comparison of the effects of cholecalciferol and calcitriol on calcium metabolism and bone turnover in Chinese postmenopausal women with vitamin D insufficiency. Acta Pharmacol. Sin. 2012, 33, 490–495. [Google Scholar] [CrossRef] [Green Version]
- Clements, M.R.; Davies, M.; Hayes, M.E.; Hlckey, C.D.; Lumb, G.A.; Mawer, E.B.; Adams, P.H. The role of 1,25-dihydroxyvitamin D in the mechanism of acquired vitamin D deficiency. Clin. Endocrinol. (Oxf.) 1992, 37, 17–27. [Google Scholar] [CrossRef]
- Tang, J.C.Y.Y.; Jackson, S.; Walsh, N.P.; Greeves, J.; Fraser, W.D.; Ball, N.; Dutton, J.; Nicholls, H.; Piec, I.; Washbourne, C.J. The dynamic relationships between the active and catabolic vitamin D metabolites, their ratios, and associations with PTH. Sci. Rep. 2019, 9, 6974. [Google Scholar] [CrossRef]
- Gröschel, C.; Tennakoon, S.; Kállay, E. Cytochrome P450 Vitamin D Hydroxylases in Inflammation and Cancer. In Advances in Pharmacology; Academic Press Inc.: Cambridge, MA, USA, 2015; Volume 74, pp. 413–458. ISBN 9780128031193. [Google Scholar]
- Zhu, J.G.; Ochalek, J.T.; Kaufmann, M.; Jones, G.; DeLuca, H.F. CYP2R1 is a major, but not exclusive, contributor to 25-hydroxyvitamin D production in vivo. Proc. Natl. Acad. Sci. USA 2013, 110, 15650–15655. [Google Scholar] [CrossRef] [Green Version]
- Blackburn, A.C.; McLary, S.C.; Naeem, R.; Luszcz, J.; Stockton, D.W.; Donehower, L.A.; Mohammed, M.; Mailhes, J.B.; Soferr, T.; Naber, S.P.; et al. Loss of heterozygosity occurs via mitotic recombination in Trp53 +/− mice and associates with mammary tumor susceptibility of the BALB/c strain. Cancer Res. 2004, 64, 5140–5147. [Google Scholar] [CrossRef] [Green Version]
- Blackburn, A.C.; Hill, L.Z.; Roberts, A.L.; Wang, J.; Aud, D.; Jung, J.; Nikolcheva, T.; Allard, J.; Peltz, G.; Otis, C.N.; et al. Genetic mapping in mice identifies DMBT1 as a candidate modifier of mammary tumors and breast cancer risk. Am. J. Pathol. 2007, 170, 2030–2041. [Google Scholar] [CrossRef] [Green Version]
- Ratnadiwakara, M.; Rooke, M.; Williams, R.; Blackburn, A. Contribution of genetic variation within SuprMam1 and SuprMam2 to breast cancer susceptibility. Hered. Cancer Clin. Pract. 2012, 10, A90. [Google Scholar] [CrossRef] [Green Version]
- Ratnadiwakara, M.; Williams, R.B.; Blackburn, A.C. Abstract A117: Vitamin D, parathyroid hormone, Cyp2r1, and breast cancer susceptibility in mice. In Proceedings of the AACR Special Conference on Advances in Breast Cancer Research: Genetics, Biology, and Clinical Applications, San Diego, CA, USA, 3–6 October 2013; AACR: Philadelphia, PA, USA, 2013; Volume 11. Abstract nr A117. [Google Scholar]
- Li, J.; Luco, A.L.; Ochietti, B.; Fadhil, I.; Camirand, A.; Reinhardt, T.A.; St-Arnaud, R.; Muller, W.; Kremer, R. Tumoral Vitamin D synthesis by CYP27B1 1-α-hydroxylase delays mammary tumor progression in the PyMT-MMTV mouse model and its action involves NF-κB modulation. Endocrinology 2016, 157, 2204–2216. [Google Scholar] [CrossRef] [Green Version]
- Zou, M.; Baitei, E.Y.; BinEssa, H.A.; Al-Mohanna, F.A.; Parhar, R.S.; St-Arnaud, R.; Kimura, S.; Pritchard, C.; Alzahrani, A.S.; Assiri, A.M.; et al. Cyp24a1 attenuation limits progression of BrafV600E-induced papillary thyroid cancer cells and sensitizes them to BRAFV600E inhibitor PLX4720. Cancer Res. 2017, 77, 2161–2172. [Google Scholar] [CrossRef] [Green Version]
- Al-Zohily, B.; Al-Menhali, A.; Gariballa, S.; Haq, A.; Shah, I. Epimers of Vitamin D: A Review. Int. J. Mol. Sci. 2020, 21, 470. [Google Scholar] [CrossRef] [Green Version]
- Tuckey, R.C.; Tang, E.K.Y.; Maresse, S.R.; Delaney, D.S. Catalytic properties of 25-hydroxyvitamin D3 3-epimerase in rat and human liver microsomes. Arch. Biochem. Biophys. 2019, 666, 16–21. [Google Scholar] [CrossRef]
- Rhieu, S.Y.; Annalora, A.J.; Wang, G.; Flarakos, C.C.; Gathungu, R.M.; Vouros, P.; Sigüeiro, R.; Mouriño, A.; Schuster, I.; Palmore, G.T.R.; et al. Metabolic stability of 3-Epi-1α,25-dihydroxyvitamin D3 over 1 α 25-dihydroxyvitamin D3: Metabolism and molecular docking studies using rat CYP24A1. J. Cell. Biochem. 2013, 114, 2293–2305. [Google Scholar] [CrossRef]
- Messerlian, S.; Gao, X.; St-Arnaud, R. The 3-epi- and 24-oxo-derivatives of 1α,25 dihydroxyvitamin D3 stimulate transcription through the vitamin D receptor. J. Steroid Biochem. Mol. Biol. 2000, 72, 29–34. [Google Scholar] [CrossRef]
- Rehan, V.K.; Torday, J.S.; Peleg, S.; Gennaro, L.; Vouros, P.; Padbury, J.; Sunita Rao, D.; Satyanarayana Reddy, G. 1α,25-Dihydroxy-3-epi-vitamin D3, a natural metabolite of 1α,25-dihydroxy vitamin D3: Production and biological activity studies in pulmonary alveolar type II cells. Mol. Genet. Metab. 2002, 76, 46–56. [Google Scholar] [CrossRef]
- Ghaly, S.; Bliuc, D.; Center, J.R.; Clarke, M.W.; Jones, A.P.; Trend, S.; Kermode, A.G.; Neale, R.E.; Hart, P.H. Vitamin D C3-epimer levels are proportionally higher with oral vitamin D supplementation compared to ultraviolet irradiation of skin in mice but not humans. J. Steroid Biochem. Mol. Biol. 2019, 186, 110–116. [Google Scholar] [CrossRef] [PubMed]
- Schoenmakers, I.; Jones, K.S. Pharmacology and Pharmacokinetics. In Vitamin D, 4th ed.; Elsevier Inc.: Amsterdam, The Netherlands, 2018; Volume 1, pp. 635–661. ISBN 9780128099667. [Google Scholar]
- DuPré, S.A.; Redelman, D.; Hunter, K.W. The mouse mammary carcinoma 4T1: Characterization of the cellular landscape of primary tumours and metastatic tumour foci. Int. J. Exp. Pathol. 2007, 88, 351–360. [Google Scholar] [CrossRef]
- Pawlik, A.; Anisiewicz, A.; Filip-Psurska, B.; Nowak, M.; Turlej, E.; Trynda, J.; Banach, J.; Gretkierewicz, P.; Wietrzyk, J. Calcitriol and Its Analogs Establish the Immunosuppressive Microenvironment That Drives Metastasis in 4T1 Mouse Mammary Gland Cancer. Int. J. Mol. Sci. 2018, 19, 2116. [Google Scholar] [CrossRef] [Green Version]
- Pawlik, A.; Anisiewicz, A.; Filip-Psurska, B.; Klopotowska, D.; Maciejewska, M.; Mazur, A.; Wietrzyk, J. Divergent Effect of Tacalcitol (PRI-2191) on Th17 Cells in 4T1 Tumor Bearing Young and Old Ovariectomized Mice. Aging Dis. 2020, 11, 241. [Google Scholar] [CrossRef] [Green Version]
- Rossdeutscher, L.; Li, J.; Luco, A.-L.; Fadhil, I.; Ochietti, B.; Camirand, A.; Huang, D.C.; Reinhardt, T.A.; Muller, W.; Kremer, R. Chemoprevention activity of 25-hydroxyvitamin D in the MMTV-PyMT mouse model of breast cancer. Cancer Prev. Res. (Phila.) 2015, 8, 120–128. [Google Scholar] [CrossRef] [Green Version]
- Wietrzyk, J.; Pełczyńska, M.; Madej, J.; Dzimira, S.; Kuśnierczyk, H.; Kutner, A.; Szelejewski, W.; Opolski, A. Toxicity and antineoplastic effect of (24R)-1,24-dihydroxyvitamin D 3 (PRI-2191). Steroids 2004, 69, 629–635. [Google Scholar] [CrossRef]
- Karkeni, E.; Morin, S.O.; Bou Tayeh, B.; Goubard, A.; Josselin, E.; Castellano, R.; Fauriat, C.; Guittard, G.; Olive, D.; Nunès, J.A. Vitamin D Controls Tumor Growth and CD8+ T Cell Infiltration in Breast Cancer. Front. Immunol. 2019, 10, 1307. [Google Scholar] [CrossRef] [Green Version]
- Anisiewicz, A.; Pawlik, A.; Filip-Psurska, B.; Wietrzyk, J. Differential Impact of Calcitriol and Its Analogs on Tumor Stroma in Young and Aged Ovariectomized Mice Bearing 4T1 Mammary Gland Cancer. Int. J. Mol. Sci. 2020, 21, 6359. [Google Scholar] [CrossRef]
- DeNardo, D.G.; Johansson, M.; Coussens, L.M. Immune cells as mediators of solid tumor metastasis. Cancer Metastasis Rev. 2008, 27, 11–18. [Google Scholar] [CrossRef]
- Su, X.; Ye, J.; Hsueh, E.C.; Zhang, Y.; Hoft, D.F.; Peng, G. Tumor Microenvironments Direct the Recruitment and Expansion of Human Th17 Cells. J. Immunol. 2010, 184, 1630–1641. [Google Scholar] [CrossRef] [PubMed]


| Tumor Model/Mouse Strain/Cell Number | 4T1—BALB/c 1 × 10⁴ | 67NR—BALB/c 2 × 10⁵ | E0771—C57BL/6 5 × 10⁴ |
|---|---|---|---|
| Autopsy day * | 28 | 28 | 23 |
| Diet cholecalciferol (vitamin D3) content; calcitriol p.o. injections | Control 1000 IU | ||
| Control 1000 IU+calcitriol from day 7 after tumor implantation (1 µg/kg/dose 3× a week) | |||
| Supplemented 5000 IU | |||
| Deficient 100 IU | |||
| Deficient 100 IU+calcitriol from day 7 after tumor implantation (1 µg/kg/dose 3× a week) | |||
| Time of Blood Collection | Group | BALB/c | |||||
|---|---|---|---|---|---|---|---|
| 25(OH)D3:24,25(OH)2D3 | 25(OH)D3:3-epi-25(OH)D3 | ||||||
| Healthy | 4T1 | 67NR | healthy | 4T1 | 67NR | ||
| Day-14 (4 weeks) | 1000 IU | 1.3 ± 0.2 | 4.3 ± 0.6 | ||||
| 5000 IU | 1.4 ± 0.1 | 1.9 ± 0.2 * | |||||
| 100 IU | 1.4 ± 0.2 | 10.2 ± 2.3 * | |||||
| Day-7 (5 weeks) | 1000 IU | 1.3 ± 0.1 | 3.7 ± 0.2 | ||||
| 5000 IU | 1.3 ± 0.1 | 1.6 ± 0.7 * | |||||
| 100 IU | 1.2 ± 0.1 | 9.8 ± 2.2 * | |||||
| Day 14 (8 weeks) | 1000 IU | 1.6 ± 0.1 # | 1.6 ± 0.1 # | 1.7 ± 0.2 | 3.9 ± 0.4 | 3.6 ± 1.1 | 3.9 ± 0.5 |
| 1000 IU+cal | 7.3 ± 0.8 * | 5.8 ± 0.7 * | 7.0 ± 0.9 * | 7.8 ±0.6 * | 7.2 ± 0.4 * | 7.1 ± 0.6 * | |
| 5000 IU | 1.6 ± 0.1 # | 1.5 ± 0.1 # | 1.5 ± 0.1 | 1.7 ± 0.2 *,$ | 1.5 ± 0.1 * | 1.6 ± 0.2 * | |
| 100 IU | 1.2 ± 0.2 | 1.5 ± 0.3 | 1.4 ± 0.3 | 7.9 ± 1.5 * | 8.2 ± 1.4 * | 8.1 ± 2.0 * | |
| 100 IU+cal | 8.2 ± 0.5 *,@ | 6.5 ± 0.8 *,@ | 6.9 ± 1.3 *,@ | 20.0 ± 3.1 *,@ | 18.6 ± 3.1 *,@ | 13.8 ± 2.6 *,@ | |
| Day 28 (10 weeks) | 1000 IU | 1.5 ± 0.1 | 1.6 ± 0.1 $,# | 1.7 ± 0.2 $,# | 4.4 ± 1.0 | 4.9 ± 0.8 #,& | 4.0 ± 0.2 |
| 1000 IU+cal | 6.1 ± 0.9 * | 4.2 ± 1.0 *,& | 7.8 ± 2.0 * | 7.6 ± 0.5 * | 9.4 ± 2.2 *,& | 7.4 ± 1.3 * | |
| 5000 IU | 1.4 ± 0.1 & | 1.3 ± 0.2 & | 1.7 ± 0.3 # | 1.6 ± 0.1 * | 1.1 ± 0.2 *,$,& | 1.6 ± 0.1 *,$ | |
| 100 IU | 1.3 ± 0.2 | 1.1 ± 0.3 | 1.6 ± 0.2 # | 8.7 ± 2.5 * | 7.5 ± 2.4 | 8.4 ± 1.4 * | |
| 100 IU+cal | 7.5 ± 1.3 *,@ | 3.6 ± 1.7 *,@,& | 8.3 ± 2.4 *,@ | 32.6 ± 5.9 *,@,& | 19.2 ± 8.3 *,@ | 17.9 ± 3.9 *,@ | |
| Time of Blood Collection | Group | C57BL/6 | |||
|---|---|---|---|---|---|
| 25(OH)D3/24,25(OH)2D3 | 25(OH)D3/3-epi-25(OH)D3 | ||||
| Healthy | E0771 | Healthy | E0771 | ||
| Day-7 (5 weeks) | 1000 IU | 1.6 ± 0.3 | 3.6 ± 1.6 | ||
| 5000 IU | 1.7 ± 0.3 | 1.4 ± 0.3 * | |||
| 100 IU | 1.4 ± 0.3 | 8.7 ± 1.2 * | |||
| Day 14 (8 weeks) | 1000 IU | 1.9 ± 0.2 # | 1.8 ± 0.2 | 4.9 ± 0.9 # | 4.2 ± 0.7 |
| 1000 IU+cal | 7.8 ± 1.7 * | 6.7 ± 1.1 * | 10.2 ± 1.0 * | 9.1 ± 2.0 * | |
| 5000 IU | 1.7 ± 0.2 | 1.7 ± 0.1 | 1.2 ± 0.1 * | 1.2 ± 0.1 * | |
| 100 IU | 2.0 ± 1.1 | 1.9 ± 0.4 # | 11.1 ± 6.5 * | 11.2 ± 4.3 * | |
| 100 IU+cal | 5.4 ± 1.1 *,@ | 4.4 ± 1.4 *,@ | 10.6 ± 1.6 *,& | 11.0 ± 2.2 * | |
| Day 23 (9 weeks) | 1000 IU | 1.7 ± 0.4 | 2.0 ± 0.5 | 4.3 ± 1.0 | 4.6 ± 0.9 |
| 1000 IU+cal | 7.4 ± 0.6 * | 5.6 ± 1.2 * | 10.1 ± 0.5 * | 8.6 ± 2.1 * | |
| 5000 IU | 1.7 ± 0.1 | 1.8 ± 0.3 | 1.2 ± 0.1 * | 1.3 ± 0.2 * | |
| 100 IU | 1.5 ± 0.1 | 1.3 ± 0.1 & | 9.0 ± 1.0 * | 8.1 ± 0.9 * | |
| 100 IU+cal | 6.8 ± 1.0 *,@,& | 4.0 ± 1.6 *,@,& | 21.2 ± 7.1 *,@ | 13.6 ± 5.8 * | |
| Parameter Measured | Group | BALB/c Mice | C57BL/6 Mice | |||
|---|---|---|---|---|---|---|
| Healthy | 4T1 | 67NR | Healthy | E0771 | ||
| Ca2+ (mmol/L) | 1000 IU | 3.1 ± 0.1 | 3.2 ± 0.2 | 3.2 ± 0.2 | 3.1 ± 0.2 | 3.2 ± 0.1 |
| 1000 IU+cal | 3.1 ± 0.2 | 3.4 ± 0.2 # | 3.3 ± 0.2 | 3.4 ± 0.2 * | 3.6 ± 0.2 * | |
| 5000 IU | 3.1 ± 0.1 | 3.3 ± 0.2 | 3.2 ± 0.2 | 3.2 ± 0.2 | 3.2 ± 0.2 | |
| 100 IU | 3.1 ± 0.1 | 3.2 ± 0.2 | 3.2 ± 0.2 | 3.1 ± 0.1 | 3.1 ± 0.2 | |
| 100 IU+cal | 3.4 ± 0.2 | 3.4 ± 0.3 * | 3.3 ± 0.3 | 3.4 ± 0.2 *,@ | 3.6 ± 0.3 #,*,@ | |
| Phosphate (mmol/L) | 1000 IU | 2.1 ± 0.4 | 2.6 ± 0.9 | 2.1 ± 0.5 | 2.4 ± 0.6 | 2.2 ± 0.7 |
| 1000 IU+cal | 2.0 ± 0.4 | 2.1 ± 0.5 | 2.0 ± 0.5 | 3.4 ± 0.7 * | 2.3 ± 0.6 # | |
| 5000 IU | 2.0 ± 0.4 | 2.6 ± 0.7 | 2.3 ± 0.4 | 3.3 ± 0.3 * | 2.8 ± 0.6 * | |
| 100 IU | 2.1 ± 0.4 | 2.7 ± 0.5 | 2.2 ± 0.8 | 2.7 ± 0.4 | 2.5 ± 0.7 | |
| 100 IU+cal | 2.4 ± 0.9 | 1.6 ± 0.3 #,*,@ | 1.5 ± 0.3 # | 3.3 ± 0.3 *,@ | 2.4 ± 0.6 # | |
| Creatinine (µmol/L) | 1000 IU | 13.4 ± 1.6 | 9.6 ± 1.0 # | 11.4 ± 1.8 | 9.6 ± 2.6 | 11 ± 2.5 |
| 1000 IU+cal | 12.6 ± 3.0 | 9.6 ± 2.6 # | 11.3 ± 0.8 | 8.6 ± 2.2 | 9.4 ± 1.5 | |
| 5000 IU | 12.8 ± 2.0 | 8.6 ± 2.6 # | 10.6 ± 2.5 | 10.5 ± 2.1 | 9.5 ± 2.4 | |
| 100 IU | 12.9 ± 2.5 | 11.6 ± 4.5 | 10.5 ± 1.3 | 8.8 ± 1.5 | 8.9 ± 1.0 | |
| 100 IU+cal | 12.2 ± 0.3 | 9.5 ± 1.0 # | 11.5 ± 1.6 & | 9.8 ± 0.9 | 9.2 ± 1.2 | |
| Alkaline phosphatase (U/L) | 1000 IU | 67.0 ± 10.0 | 39.1 ± 6.0 # | 49.3 ± 10.4 # | 72.8 ± 25.4 | 39.8 ± 23.9 # |
| 1000 IU+cal | 69.0 ± 5.8 | 36.6 ± 4.5 # | 49.3 ± 14.5 # | 55.1 ± 4.4 | 29.5 ± 17.8 | |
| 5000 IU | 66.5 ± 6.6 | 38.4 ± 4.8 # | 45.1 ± 6.5 # | 76.4 ± 11.6 | 41.1 ± 20.2 # | |
| 100 IU | 65.1 ± 6.1 | 38.2 ± 2.4 # | 50.4 ± 7.2 # | 82.4 ± 13.5 | 40.9 ± 21.2 # | |
| 100 IU+cal | 67.9 ± 5.3 | 34.2 ± 4.0 # | 43.6 ± 9.7 # | 73.3 ± 31.1 | 34.9 ± 22.1 # | |
| Total protein (g/L) | 1000 IU | 42.4 ± 1.5 | 43.7 ± 1.7 | 39.4 ± 3.3 #,& | 43.7 ± 1.0 | 40.8 ± 4.8 |
| 1000 IU+cal | 42.0 ± 3.3 | 46.1 ± 1.0# | 41.2 ± 1.7& | 43.0 ± 0.3 | 39.6 ± 4.0 | |
| 5000 IU | 41.4 ± 2.4 | 45.5 ± 2.0 # | 41.5 ± 1.4 & | 45.2 ± 1.0 | 39.6 ± 5.8 # | |
| 100 IU | 41.7 ± 1.0 | 43.6 ± 1.7 | 40.1 ± 1.7 & | 43.1 ± 0.1 | 40.0 ± 5.6 | |
| 100 IU+cal | 44.4 ± 2.9 | 46.3 ± 2.9 *,@ | 42.2 ± 1.2 & | 43.7 ± 2.8 | 36.9 ± 7.0 # | |
| Albumin (g/L) | 1000 IU | 9.7 ± 1.6 | 10.8 ± 2.2 | 8.4 ± 2.7 & | 10.7 ± 2.1 | 10.3 ± 1.4 |
| 1000 IU+cal | 9.7 ± 3.0 | 11.1 ± 1.8 | 9.7 ± 1.7 | 13.0 ± 1.5 * | 9.6 ± 2.8 # | |
| 5000 IU | 10.1 ± 1.2 | 11.5 ± 4.0 | 10.6 ± 1.6 | 14.1 ± 2.0 * | 10.1 ± 2.8 # | |
| 100 IU | 9.9 ± 0.8 | 11.8 ± 1.0 | 9.9 ± 1.8 | 12.2 ± 2.8 | 9.9 ± 2.5 | |
| 100 IU+cal | 11.7 ± 2.0 | 8.9 ± 1.8 #,@ | 9.0 ± 1.4 # | 13.0 ± 1.2 | 9.2 ± 3.3 # | |
| Blood Parameter | Group | Strain | ||||
|---|---|---|---|---|---|---|
| BALB/c | C57BL/6 | |||||
| Healthy | 4T1 | 67NR | Healthy | E0771 | ||
| WBC (103/µL) | 1000 IU | 4.7 ± 1.2 | 135.0 ± 71.2 | 6.6 ± 1.4 | 5.5 ± 0.9 | 6.8 ± 3.3 |
| 1000 IU+cal | 4.4 ± 1.3 | 181.0 ± 97.1 | 6.6 ± 0.9 | 6.0 ± 1.9 * | 10.8 ± 6.5 | |
| 5000 IU | 4.0 ± 0.9 | 199.4 ± 105.9 | 7.8 ± 1.9 | 5.6 ± 1.4 | 8.4 ± 5.1 | |
| 100 IU | 3.8 ± 1.1 * | 142.0 ± 92.0 | 7.1 ± 2.4 | 6.0 ± 1.2 | 12.1 ± 7.6 * | |
| 100 IU+cal | 3.9 ± 1.1 | 231.6 ± 136.8 *,@ | 5.8 ± 1.4 | 5.2 ± 0.9 | 11.1 ± 6.8 * | |
| Lymph (103/µL) | 1000 IU | 4.8 ± 1.2 | 31.4 ± 17.3 | 4.8 ± 1.1 | 5.1 ± 1.6 | 5.6 ± 3.2 |
| 1000 IU+cal | 4.4 ± 1.3 | 42.7 ± 23.9 | 5.2 ± 0.9 | 5.3 ± 1.7 | 9.2 ± 6.2 | |
| 5000 IU | 4.0 ± 0.9 | 49.5 ± 28.1 | 6.1 ± 1.7 | 4.9 ± 1.2 | 7.2 ± 4.8 | |
| 100 IU | 3.8 ± 1.1 | 38.1 ± 26.4 * | 5.4 ± 1.8 | 4.9 ± 0.5 | 10.4 ± 7.2 * | |
| 100 IU+cal | 3.9 ± 1.1 | 62.3 ± 33.6 *,@ | 4.4 ± 1.1 | 4.4 ± 0.8 | 9.6 ± 6.0 * | |
| Gran (103/µL) | 1000 IU | 0.6 ± 1.7 | 79.7 ± 37.0 | 1.4 ± 0.5 | 0.3 ± 0.1 | 0.6±0.4 |
| 1000 IU+cal | 0.7 ± 0.3 | 99.9 ± 48.7 | 1.3 ± 0.2 | 0.3 ± 0.1 | 0.7 ± 0.5 | |
| 5000 IU | 0.5 ± 0.2 | 107.6 ± 47.4 | 1.4 ± 0.4 | 0.3 ± 0.1 | 0.4 ± 0.2 | |
| 100 IU | 0.5 ± 0.1 | 79.2 ± 42.1 | 1.4 ± 0.7 | 0.4 ± 0.2 | 0.6 ± 0.3 | |
| 100 IU+cal | 0.5 ± 0.2 | 116.6 ± 54.2 | 1.2 ± 0.4 | 0.3 ± 0.1 | 0.4 ± 0.2 | |
| Mon (103/µL) | 1000 IU | 0.3 ± 0.2 | 23.8 ± 18.3 | 0.3 ± 0.1 | 0.5 ± 0.2 | 0.8 ± 0.4 |
| 1000 IU+cal | 0.3 ± 0.2 | 38.3 ± 30.8 | 0.4 ± 0.2 | 0.3 ± 0.1 | 0.9 ± 0.6 | |
| 5000 IU | 0.3 ± 0.1 | 35.2 ± 25.7 | 0.3 ± 0.1 | 0.4 ± 0.2 | 0.6 ± 0.3 | |
| 100 IU | 0.2 ± 0.1 | 18.3 ± 13.2 | 0.2 ± 0.1 | 0.4 ± 0.2 | 0.9 ± 0.5 | |
| 100 IU+cal | 0.2 ± 0.0 | 52.7 ± 52.5 *,@ | 0.2 ± 0.1 | 0.4 ± 0.2 | 0.9 ± 0.4 | |
Publisher’s Note: MDPI stays neutral with regard to jurisdictional claims in published maps and institutional affiliations. |
© 2020 by the authors. Licensee MDPI, Basel, Switzerland. This article is an open access article distributed under the terms and conditions of the Creative Commons Attribution (CC BY) license (http://creativecommons.org/licenses/by/4.0/).
Share and Cite
Anisiewicz, A.; Kowalski, K.; Banach, J.; Łabędź, N.; Stachowicz-Suhs, M.; Piotrowska, A.; Milczarek, M.; Kłopotowska, D.; Dzięgiel, P.; Wietrzyk, J. Vitamin D Metabolite Profile in Cholecalciferol- or Calcitriol-Supplemented Healthy and Mammary Gland Tumor-Bearing Mice. Nutrients 2020, 12, 3416. https://0-doi-org.brum.beds.ac.uk/10.3390/nu12113416
Anisiewicz A, Kowalski K, Banach J, Łabędź N, Stachowicz-Suhs M, Piotrowska A, Milczarek M, Kłopotowska D, Dzięgiel P, Wietrzyk J. Vitamin D Metabolite Profile in Cholecalciferol- or Calcitriol-Supplemented Healthy and Mammary Gland Tumor-Bearing Mice. Nutrients. 2020; 12(11):3416. https://0-doi-org.brum.beds.ac.uk/10.3390/nu12113416
Chicago/Turabian StyleAnisiewicz, Artur, Konrad Kowalski, Joanna Banach, Natalia Łabędź, Martyna Stachowicz-Suhs, Aleksandra Piotrowska, Magdalena Milczarek, Dagmara Kłopotowska, Piotr Dzięgiel, and Joanna Wietrzyk. 2020. "Vitamin D Metabolite Profile in Cholecalciferol- or Calcitriol-Supplemented Healthy and Mammary Gland Tumor-Bearing Mice" Nutrients 12, no. 11: 3416. https://0-doi-org.brum.beds.ac.uk/10.3390/nu12113416