Appetitive Traits in a Population-Based Study of Polish Adolescents within the PLACE-19 Study: Validation of the Adult Eating Behavior Questionnaire


Abstract
:1. Introduction
2. Materials and Methods
2.1. Study Design
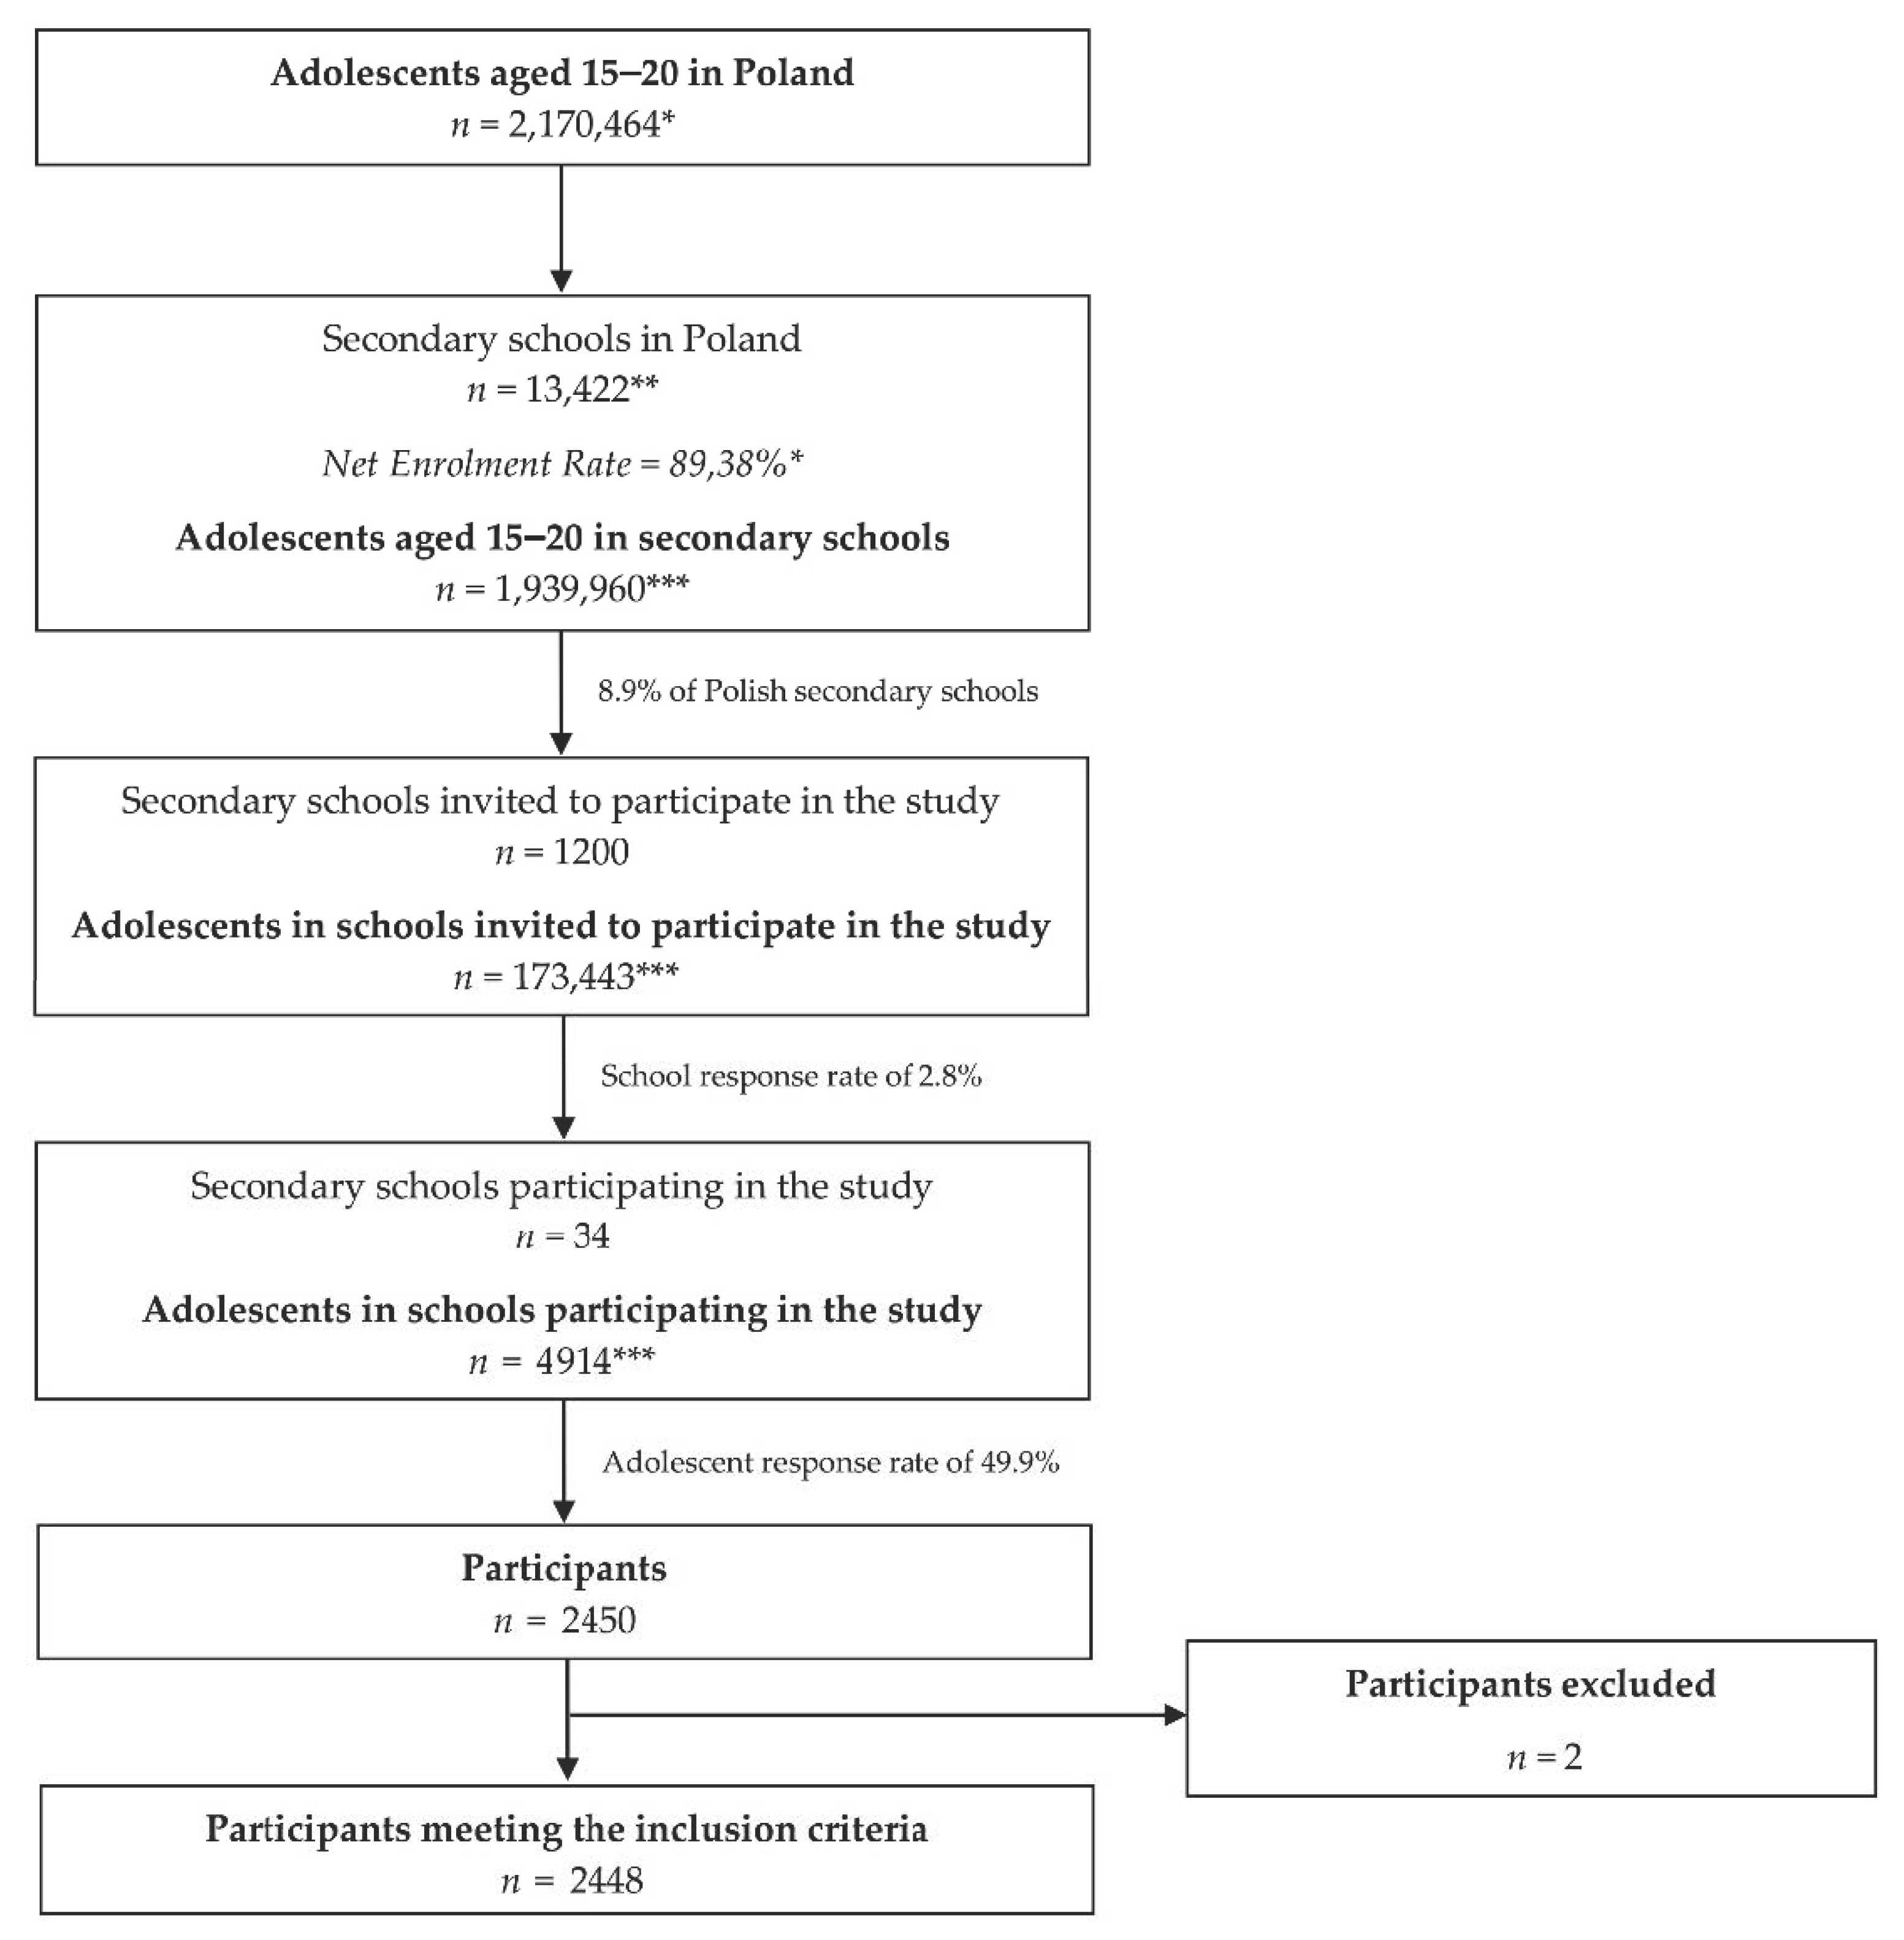
2.2. Participants
2.3. Methods
2.4. Measures
2.4.1. Adult Eating Behavior Questionnaire (AEBQ)
2.4.2. Sociodemographic Questionnaire
2.5. Statistical Analysis
3. Results
4. Discussion
5. Conclusions
Supplementary Materials
Author Contributions
Funding
Conflicts of Interest
References
- Tovar, A.; Risica, P.M.; Ramirez, A.; Mena, N.; Lofgren, I.E.; Stowers, K.C.; Gans, K.M. Exploring the Provider-Level Socio-Demographic Determinants of Diet Quality of Preschool-Aged Children Attending Family Childcare Homes. Nutrients 2020, 12, 1368. [Google Scholar] [CrossRef] [PubMed]
- Gahagan, S. Development of eating behavior: Biology and context. J. Dev. Behav. Pediatr. 2012, 33, 261–271. [Google Scholar] [CrossRef] [PubMed] [Green Version]
- Jenkins, S.; Horner, S.D. Barriers that influence eating behaviors in adolescents. J. Pediatr. Nurs. 2005, 20, 258–267. [Google Scholar] [CrossRef] [PubMed]
- Reicks, M.; Banna, J.; Cluskey, M.; Gunther, C.; Hongu, N.; Richards, R.; Topham, G.; Wong, S.S. Influence of Parenting Practices on Eating Behaviors of Early Adolescents during Independent Eating Occasions: Implications for Obesity Prevention. Nutrients 2015, 22, 8783–8801. [Google Scholar] [CrossRef] [PubMed]
- Neumark-Sztainer, D.; Wall, M.; Larson, N.I.; Eisenberg, M.E.; Loth, K. Dieting and disordered eating behaviors from adolescence to young adulthood: Findings from a 10-year longitudinal study. J. Am. Diet. Assoc. 2011, 111, 1004–1011. [Google Scholar] [CrossRef] [PubMed] [Green Version]
- Mallan, K.M.; Fildes, A.; de la Piedad Garcia, X.; Drzezdzon, J.; Sampson, M.; Llewellyn, C. Appetitive traits associated with higher and lower body mass index: Evaluating the validity of the adult eating behaviour questionnaire in an Australian sample. Int. J. Behav. Nutr. Phys. Act. 2017, 14, 130. [Google Scholar] [CrossRef] [PubMed] [Green Version]
- Syrad, H.; Johnson, L.; Wardle, J.; Llewellyn, C.H. Appetitive traits and food intake patterns in early life. Am. J. Clin. Nutr. 2016, 103, 231–235. [Google Scholar] [CrossRef] [Green Version]
- Carnell, S.; Benson, L.; Pryor, K.; Driggin, E. Appetitive traits from infancy to adolescence: Using behavioral and neural measures to investigate obesity risk. Physiol. Behav. 2013, 121, 79–88. [Google Scholar] [CrossRef] [Green Version]
- Hunot, C.; Fildes, A.; Croker, H.; Llewellyn, C.H.; Wardle, J.; Beeken, R.J. Appetitive traits and relationships with BMI in adults: Development of the adult Eating Behaviour Questionnaire. Appetite 2016, 105, 356–363. [Google Scholar] [CrossRef] [Green Version]
- Wardle, J.; Carnell, S. Appetite is a heritable phenotype associated with adiposity. Behav. Med. 2009, 38, 25–30. [Google Scholar] [CrossRef]
- Ashcroft, J.L.; Semmler, C.; Carnell, S.; van Jaarsveld, C.H.; Wardle, J. Continuity and stability of eating behaviour traits in children. Eur. J. Clin. Nutr. 2008, 62, 985–990. [Google Scholar] [CrossRef] [PubMed] [Green Version]
- Hunot-Alexander, C.; Beeken, R.J.; Goodman, W.; Fildes, A.; Croker, H.; Llewellyn, C.; Steinsbekk, S. Confirmation of the Factor Structure and Reliability of the ‘Adult Eating Behavior Questionnaire’ in an Adolescent Sample. Front. Psychol. 2019, 4, 1991. [Google Scholar] [CrossRef] [Green Version]
- Wardle, J.; Guthrie, C.A.; Sanderson, S.; Rapoport, L. Development of the Children’s Eating Behaviour Questionnaire. J. Child Psychol. Psychiatry 2001, 42, 963–970. [Google Scholar] [CrossRef] [PubMed] [Green Version]
- He, J.; Sun, S.; Zickgraf, H.F.; Ellis, J.M.; Fan, X. Assessing Appetitive Traits Among Chinese Young Adults Using the Adult Eating Behavior Questionnaire: Factor Structure, Gender Invariance and Latent Mean Differences, and Associations With BMI. Assessment 2019, 21, 1–13. [Google Scholar] [CrossRef]
- Hristova, V. Psychometric Properties of Bulgarian Version of Adult Eating Behaviour Questionnaire. In Modern Age and Competencies of Psychologists; International Thematic Proceedia; Available online: http://psihologijanis.rs/dpp/arhiva/zbornik-14.pdf (accessed on 19 September 2020).
- Zickgraf, H.F.; Rigby, A. The Adult Eating Behaviour Questionnaire in a bariatric surgery-seeking sample: Factor structure, convergent validity, and associations with BMI. Eur. Eat. Disord. Rev. 2019, 27, 97–104. [Google Scholar] [CrossRef] [Green Version]
- de la Fuente-Reynoso, A.L.; Romero-Velarde, E.; Hunot-Alexander, C.E.; Vásquez-Garibay, E.M.; Mariscal-Rizo, A.G. Appetitive traits in children aged 6 to 12 years: Association with obesity and differences by gender. Bol. Med. Hosp. Infant. Mex. 2020, 77, 83–89. [Google Scholar]
- Keller, K.L.; Kling, S.M.R.; Fuchs, B.; Pearce, A.L.; Reigh, N.A.; Masterson, T.; Hickok, K. A Biopsychosocial Model of Sex Differences in Children’s Eating Behaviors. Nutrients 2019, 11, 682. [Google Scholar] [CrossRef] [Green Version]
- Haleem, A.; Javaid, M.; Vaishya, R. Effects of COVID-19 pandemic in daily life. Curr. Med. Res. Pract. 2020, 10, 78–79. [Google Scholar] [CrossRef]
- Di Renzo, L.; Gualtieri, P.; Pivari, F.; Soldati, L.; Attinà, A.; Cinelli, G.; Leggeri, C.; Caparello, G.; Barrea, L.; Scerbo, F.; et al. Eating habits and lifestyle changes during COVID-19 lockdown: An Italian survey. J. Transl. Med. 2020, 18, 229. [Google Scholar] [CrossRef]
- Sidor, A.; Rzymski, P. Dietary Choices and Habits during COVID-19 Lockdown: Experience from Poland. Nutrients 2020, 12, 1657. [Google Scholar] [CrossRef]
- Phillipou, A.; Meyer, D.; Neill, E.; Tan, E.J.; Toh, W.L.; Van Rheenen, T.E.; Rossell, S.L. Eating and exercise behaviors in eating disorders and the general population during the COVID-19 pandemic in Australia: Initial results from the COLLATE project. Int. J. Eat Disord. 2020, 53, 1158–1165. [Google Scholar] [CrossRef] [PubMed]
- Robinson, E.; Boyland, E.; Chisholm, A.; Harrold, J.; Maloney, N.G.; Marty, L.; Mead, B.R.; Noonan, R.; Hardman, C.A. Obesity, eating behavior and physical activity during COVID-19 lockdown: A study of UK adults. Appetite 2020, 3, 104853. [Google Scholar] [CrossRef]
- Owen, A.J.; Tran, T.; Hammarberg, K.; Kirkman, M.; Fisher, J. COVID-19 Restrictions Impact Research Group. Poor appetite and overeating reported by adults in Australia during the coronavirus-19 disease pandemic: A population-based study. Public Health Nutr. 2020, 25, 1–7. [Google Scholar] [CrossRef] [PubMed]
- Głąbska, D.; Skolmowska, D.; Guzek, D. Population-Based Study of the Influence of the COVID-19 Pandemic on Hand Hygiene Behaviors—Polish Adolescents’ COVID-19 Experience (PLACE-19) Study. Sustainability 2020, 12, 4930. [Google Scholar] [CrossRef]
- Guzek, D.; Skolmowska, D.; Głąbska, D. Analysis of Gender-Dependent Personal Protective Behaviors in a National Sample: Polish Adolescents’ COVID-19 Experience (PLACE-19) Study. Int. J. Environ. Res. Public Health 2020, 17, 5770. [Google Scholar] [CrossRef]
- Głąbska, D.; Skolmowska, D.; Guzek, D. Population-Based Study of the Changes in the Food Choice Determinants of Secondary School Students: Polish Adolescents’ COVID-19 Experience (PLACE-19) Study. Nutrients 2020, 12, 2640. [Google Scholar] [CrossRef] [PubMed]
- The Statistics Poland. Statistical Data According to Field. December 2019. Available online: https://bdl.stat.gov.pl/BDL/dane/podgrup/temat (accessed on 19 September 2020).
- The Statistics Poland. Demographics Databases—December 2019. Available online: http://demografia.stat.gov.pl/bazademografia/Tables.aspx (accessed on 19 September 2020).
- Polish Ministry of National Education. Available online: https://rspo.men.gov.pl/ (accessed on 19 September 2020).
- He, J.; Zickgraf, H.F.; Essayli, J.H.; Fan, X. Classifying and characterizing Chinese young adults reporting picky eating: A latent profile analysis. Int. J. Eat. Disord. 2020, 53, 883–893. [Google Scholar] [CrossRef]
- He, J.; Chen, G.; Wu, S.; Niu, R.; Fan, X. Patterns of negative emotional eating among Chinese young adults: A latent class analysis. Appetite 2020, 155, 104808. [Google Scholar] [CrossRef]
- World Health Organization (WHO). Process of Translation and Adaptation of Instruments. Available online: https://www.coursehero.com/file/30372721/WHO-Process-of-translation-and-adaptation-of-instrumentspdf/ (accessed on 19 September 2020).
- Vandeweghe, L.; Vervoort, L.; Verbeken, S.; Moens, E.; Braet, C. Food Approach and Food Avoidance in Young Children: Relation with Reward Sensitivity and Punishment Sensitivity. Front. Psychol. 2016, 24, 928. [Google Scholar] [CrossRef] [Green Version]
- Nunnally, J.C.; Bernstein, I.H. Psychometric Theory, 3rd ed.; McGraw-Hill: New York, NY, USA, 1994. [Google Scholar]
- Dunn, T.J.; Baguley, T.; Brunsden, V. From alpha to omega: A practical solution to the pervasive problem of internal consistency estimation. Br. J. Psychol. 2014, 105, 399–412. [Google Scholar] [CrossRef] [Green Version]
- Santor, D.A.; Haggerty, J.L.; Lévesque, J.F.; Burge, F.; Beaulieu, M.D.; Gass, D.; Pineault, R. An overview of confirmatory factor analysis and item response analysis applied to instruments to evaluate primary healthcare. Healthc. Policy 2011, 7, 79–92. [Google Scholar] [CrossRef] [PubMed] [Green Version]
- Leem, S.T.H. Testing for Measurement Invariance: Does your measure mean the same thing for different participants? APS Obs. 2018, 31, 32–33. [Google Scholar]
- Hu, L.; Bentler, P.M. Cutoff criteria for fit indexes in covariance structure analysis: Conventional criteria versus new alternatives. Struct. Equ. Modeling 1999, 6, 1–55. [Google Scholar] [CrossRef]
- Browne, M.W. An overview of analytic rotation in exploratory factor analysis. Multivar. Behav. Res. 2001, 36, 111–150. [Google Scholar] [CrossRef]
- Zainudin, A. Structural Equation Modeling Using AMOS Graphic; Penerbit Universiti Teknologi MARA: Shah Alam, Malaysia, 2012; pp. 1–167. [Google Scholar]
- Swami, V.; Barron, D. Translation and validation of body image instruments: Challenges, good practice guidelines, and reporting recommendations for test adaptation. Body Image 2019, 31, 204–220. [Google Scholar] [CrossRef]
- Landis, J.R.; Koch, G.G. The measurement of observer agreement for categorical data. Biometrics 1977, 33, 159–174. [Google Scholar] [CrossRef] [Green Version]
- Rajkumar, R.P. COVID-19 and mental health: A review of the existing literature. Asian J. Psychiatry 2020, 102066. [Google Scholar] [CrossRef]
- United Nations International Children’s Emergency Fund. The Impact of COVID-19 on the Mental Health of Adolescents and Youth. Available online: https://www.unicef.org/lac/en/impact-covid-19-mental-health-adolescents-and-youth (accessed on 16 October 2020).
- Hou, W.K.; Lai, F.T.; Ben-Ezra, M.; Goodwin, R. Regularizing daily routines for mental health during and after the COVID-19 pandemic. J. Glob. Health 2020, 10, 020315. [Google Scholar] [CrossRef]
- Di Renzo, L.; Gualtieri, P.; Cinelli, G.; Bigioni, G.; Soldati, L.; Attinà, A.; Bianco, F.F.; Caparello, G.; Camodeca, V.; Carrano, E.; et al. Psychological Aspects and Eating Habits during COVID-19 Home Confinement: Results of EHLC-COVID-19 Italian Online Survey. Nutrients 2020, 12, 2152. [Google Scholar] [CrossRef]
- Shen, W.; Long, L.M.; Shih, C.H.; Ludy, M.J. A Humanities-Based Explanation for the Effects of Emotional Eating and Perceived Stress on Food Choice Motives during the COVID-19 Pandemic. Nutrients 2020, 12, 2712. [Google Scholar] [CrossRef]
- Mattioli, A.V.; Pinti, M.; Farinetti, A.; Nasi, M. Obesity risk during collective quarantine for the COVID-19 epidemic. Obes. Med. 2020, 20, 100263. [Google Scholar] [CrossRef] [PubMed]
- Beydoun, M.A. The interplay of gender, mood, and stress hormones in the association between emotional eating and dietary behavior. J. Nutr. 2014, 144, 1139–1141. [Google Scholar] [CrossRef] [PubMed] [Green Version]
- Nguyen-Rodriguez, S.T.; Unger, J.B.; Spruijt-Metz, D. Psychological determinants of emotional eating in adolescence. Eat. Disord. 2009, 17, 211–224. [Google Scholar] [CrossRef] [PubMed] [Green Version]
- Jalo, E.; Konttinen, H.; Vepsäläinen, H.; Chaput, J.P.; Hu, G.; Maher, C.; Maia, J.; Sarmiento, O.L.; Standage, M.; Tudor-Locke, C.; et al. Emotional eating, health behaviours, and obesity in children: A 12-country cross-sectional study. Nutrients 2019, 11, 351. [Google Scholar] [CrossRef] [Green Version]
- Leblanc, V.; Bégin, C.; Corneau, L.; Dodin, S.; Lemieux, S. Gender differences in dietary intakes: What is the contribution of motivational variables? J. Hum. Nutr. Diet. 2015, 28, 37–46. [Google Scholar] [CrossRef]
- Thompson, S.H. Gender and Racial Differences in Emotional Eating. Food Addiction Symptoms, and Body Weight Satisfaction among Undergraduates. J. Diab. Obes. 2015, 2, 93–98. [Google Scholar] [CrossRef] [Green Version]
- Saade, S.; Hallit, S.; Haddad, C.; Hallit, R.; Akel, M.; Honein, K.; Akiki, M.; Kheir, N.; Obeid, S. Factors associated with restrained eating and validation of the Arabic version of the restrained eating scale among an adult representative sample of the Lebanese population: A cross-sectional study. J. Eat. Disord. 2019, 7, 24. [Google Scholar] [CrossRef]
- Lipowska, M.; Lipowski, M.; Jurek, P.; Jankowska, A.M.; Pawlicka, P. Gender and body-fat status as predictors of parental feeding styles and children’s nutritional knowledge, eating habits and behaviours. Int. J. Environ. Res. Public Health 2018, 15, 852. [Google Scholar] [CrossRef] [Green Version]
- Striegel-Moore, R.H.; Rosselli, F.; Perrin, N.; DeBar, L.; Wilson, G.T.; May, A.; Kraemer, H.C. Gender difference in the prevalence of eating disorder symptoms. Int. J. Eat. Disord. 2009, 42, 471–474. [Google Scholar] [CrossRef] [Green Version]
- Barry, D.T.; Grilo, C.M.; Masheb, R.M. Gender differences in patients with binge eating disorder. Int. J. Eat. Disord. 2002, 31, 63–70. [Google Scholar] [CrossRef]
- Saraceni, R.; Russell-Mayhew, S. Cultural expectations of thinness in women: A partial replication and update of magazine content. Eat. Weight Disord. 2007, 12, 68–74. [Google Scholar] [CrossRef] [PubMed]
- Izydorczyk, B.; Sitnik-Warchulska, K. Sociocultural appearance standards and risk factors for eating disorders in adolescents and women of various ages. Front. Psychol. 2018, 9, 429. [Google Scholar] [CrossRef] [PubMed]
- Omidvar, S.; Amiri, F.N.; Bakouei, F.; Begum, K. Weight-related concerns and diet behaviors among urban young females: A cross-sectional study. J. Family Med. Prim. Care 2016, 5, 326. [Google Scholar] [CrossRef] [PubMed]
- Fowler, N.; Vo, P.T.; Sisk, C.L.; Klump, K.L. Stress as a potential moderator of ovarian hormone influences on binge eating in women. F1000Research 2019, 8. [Google Scholar] [CrossRef] [Green Version]
- Racine, S.E.; Keel, P.K.; Burt, S.A.; Sisk, C.L.; Neale, M.; Boker, S.; Klump, K.L. Individual differences in the relationship between ovarian hormones and emotional eating across the menstrual cycle: A role for personality? Eat. Behav. 2013, 14, 161–166. [Google Scholar] [CrossRef] [Green Version]
- Hildebrandt, B.A.; Racine, S.E.; Keel, P.K.; Burt, S.A.; Neale, M.; Boker, S.; Sisk, C.L.; Klump, K.L. The effects of ovarian hormones and emotional eating on changes in weight preoccupation across the menstrual cycle. Int. J. Eat. Disord. 2015, 48, 477–486. [Google Scholar] [CrossRef] [Green Version]
- Wardle, J. Eating style: A validation study of the Dutch Eating Behaviour Questionnaire in normal subjects and women with eating disorders. J. Psychosom. Res. 1987, 31, 161–169. [Google Scholar] [CrossRef]
- Stunkard, A.J.; Messick, S. The three-factor eating questionnaire to measure dietary restraint, disinhibition and hunger. J. Psychosom. Res. 1985, 29, 71–83. [Google Scholar] [CrossRef]
- Macht, M. How emotions affect eating: A five-way model. Appetite 2008, 50, 1–11. [Google Scholar] [CrossRef]


| Characteristics | Results n (%) | |
|---|---|---|
| Sex | Female | 1552 (63.4%) |
| Male | 896 (36.6%) | |
| Years | Mean ± SD | 16.8 ± 1.1 |
| Median (range) | 17 (15–20) | |
| Region | North | 270 (11.0%) |
| North-West | 160 (6.5%) | |
| South | 479 (19.6%) | |
| South-West | 335 (13.7%) | |
| Central | 407 (16.6%) | |
| East | 797 (32.6%) | |
| Type of school | Comprehensive school | 1238 (50.6%) |
| Technical school | 1210 (49.4%) | |
| AEBQ Subscale | Weighted κ Statistic | Cross-Classification—Share of Consistent Results (%) |
|---|---|---|
| Food Responsiveness | 0.68 | 95 |
| Emotional Over-Eating | 0.60 | 95 |
| Enjoyment of Food | 0.52 | 90 |
| Food avoidance subscales | ||
| Satiety Responsiveness | 0.36 | 80 |
| Emotional Under-Eating | 0.60 | 90 |
| Food Fussiness | 0.76 | 100 |
| Slowness in Eating | 0.68 | 100 |
| AEBQ Subscale | Items | Standardized Factor Loadings CFA with WLS | 95% Confidence Interval | |
|---|---|---|---|---|
| Lower | Upper | |||
| Food Responsiveness | I often feel hungry when I am with someone who is eating | 0.529 | 0.490 | 0.567 |
| Given the choice, I would eat most of the time | 0.574 | 0.540 | 0.609 | |
| I am always thinking about food | 0.412 | 0.382 | 0.441 | |
| When I see or smell food that I like, it makes me want to eat | 0.661 | 0.617 | 0.705 | |
| Emotional Over-Eating | I eat more when I’m annoyed | 0.738 | 0.704 | 0.772 |
| I eat more when I’m worried | 0.705 | 0.673 | 0.737 | |
| I eat more when I’m upset | 0.299 | 0.258 | 0.340 | |
| I eat more when I’m anxious | 0.625 | 0.595 | 0.655 | |
| I eat more when I’m angry | 0.517 | 0.489 | 0.546 | |
| Enjoyment of Food | I love food | 0.881 | 0.845 | 0.917 |
| I enjoy eating | 0.890 | 0.855 | 0.924 | |
| I look forward to mealtimes | 0.678 | 0.642 | 0.714 | |
| Satiety Responsiveness | I often leave food on my plate at the end of a meal | 0.515 | 0.475 | 0.555 |
| I often get full before my meal is finished | 0.671 | 0.629 | 0.713 | |
| I cannot eat a meal if I have had a snack just before | 0.446 | 0.407 | 0.486 | |
| I get full easily | 0.692 | 0.651 | 0.734 | |
| Emotional Under-Eating | I eat less when I’m worried | 0.786 | 0.747 | 0.826 |
| I eat less when I’m angry | 0.723 | 0.687 | 0.759 | |
| I eat less when I’m upset | 0.792 | 0.757 | 0.827 | |
| I eat less when I’m annoyed | 0.755 | 0.723 | 0.787 | |
| I eat less when I’m anxious | 0.818 | 0.784 | 0.852 | |
| Food Fussiness | I often decide that I don’t like a food before tasting it | 0.727 | 0.696 | 0.757 |
| I refuse new foods at first | 0.614 | 0.589 | 0.640 | |
| I enjoy tasting new foods * | 0.894 | 0.859 | 0.928 | |
| I am interested in tasting new food I haven’t tasted before * | 0.945 | 0.908 | 0.981 | |
| I enjoy a wide variety of foods * | 0.791 | 0.753 | 0.830 | |
| Slowness in Eating | I often finish my meals quickly * | 0.626 | 0.597 | 0.655 |
| I eat more and more slowly during the course of a meal | 0.867 | 0.829 | 0.906 | |
| I eat slowly | 0.628 | 0.593 | 0.663 | |
| I am often last at finishing a meal | 0.803 | 0.764 | 0.841 | |
| AEBQ Subscale | Mean ± SD | Median (IQR) | McDonald’s ω |
|---|---|---|---|
| Food approach subscales | |||
| Food Responsiveness | 2.84 ± 0.66 | 2.75 (0.75) | 0.66 |
| Emotional Over-Eating | 2.78 ± 0.55 | 2.60 (0.60) | 0.79 |
| Enjoyment of Food | 3.58 ± 0.89 | 3.67 (1.33) | 0.84 |
| Food avoidance subscales | |||
| Satiety Responsiveness | 2.88 ± 0.70 | 2.75 (1.00) | 0.70 |
| Emotional Under-Eating | 2.77 ± 0.83 | 2.60 (1.20) | 0.88 |
| Food Fussiness | 2.65 ± 0.76 | 2.06 (1.20) | 0.78 |
| Slowness in Eating | 2.92 ± 0.76 | 2.75 (1.00) | 0.77 |
| Total AEBQ | 2.82 ± 0.34 | 2.80 (0.46) | 0.75 |
| Model | χ2 | df | CFI | RMSEA (90% CI) | SRMR | ΔCFI | ΔRMSEA |
|---|---|---|---|---|---|---|---|
| Boys | 2032.779 | 384 | 0.847 | 0.069 (0.066, 0.072) | 0.089 | - | - |
| Girls | 3307.669 | 384 | 0.845 | 0.070 (0.068, 0.072) | 0.085 | - | - |
| Configural invariance | 5340.479 * | 761 | 0.846 | 0.070 (0.068, 0.072) | 0.086 | - | - |
| Metric invariance | 5402.345 * | 784 | 0.844 | 0.069 (0.068, 0.071) | 0.084 | −0.002 | −0.001 |
| Scalar invariance | 5557.986 * | 814 | 0.840 | 0.069 (0.067, 0.071) | 0.085 | −0.004 | 0.000 |
| AEBQ Subscale | Girls | Boys | p-Value * | ||
|---|---|---|---|---|---|
| Mean ± SD | Median (IQR) | Mean ± SD | Median (IQR) | ||
| Food approach subscales | |||||
| Food Responsiveness | 2.89 ± 0.68 | 2.75 (0.75) | 2.77 ± 0.61 | 2.75 (0.75) | 0.0001 |
| Emotional Over-Eating | 2.84 ± 0.59 | 2.60 (0.60) | 2.69 ± 0.46 | 2.60 (0.40) | 0.0001 |
| Enjoyment of Food | 3.58 ± 0.90 | 3.67 (1.33) | 3.57 ± 0.87 | 3.67 (1.33) | 1.0000 |
| Food avoidance subscales | |||||
| Satiety Responsiveness | 2.99 ± 0.72 | 3.00 (1.00) | 2.69 ± 0.61 | 2.50 (0.75) | 0.0001 |
| Emotional Under-Eating | 2.93 ± 0.88 | 2.80 (1.60) | 2.51 ± 0.66 | 2.20 (1.00) | 0.0001 |
| Food Fussiness | 2.68 ± 0.78 | 2.60 (1.20) | 2.62 ± 0.71 | 2.60 (1.20) | 0.1015 |
| Slowness in Eating | 3.03 ± 0.77 | 3.00 (1.00) | 2.74 ± 0.70 | 2.50 (1.00) | 0.0001 |
| Total AEBQ | 2.89 ± 0.34 | 2.89 (0.46) | 2.71 ± 0.30 | 2.69 (0.43) | 0.0001 |
| AEBQ Subscale | FR | EOE | EF | SR | EUE | FF | SE |
|---|---|---|---|---|---|---|---|
| Food Responsiveness (FR) | - | ||||||
| Emotional Over-Eating (EOE) | 0.23 ** | - | |||||
| Enjoyment of Food (EF) | 0.61 ** | 0.18 ** | - | ||||
| Satiety Responsiveness (SR) | 0.13 ** | 0.08 ** | 0.00 | - | |||
| Emotional Under-Eating (EUE) | 0.28 ** | 0.07 ** | 0.12 ** | 0.41 ** | - | ||
| Food Fussiness (FF) | −0.20 ** | −0.01 | −0.31 ** | 0.05 * | −0.08 ** | - | |
| Slowness in Eating (SE) | 0.04 | 0.02 | 0.01 | 0.34 ** | 0.22 ** | −0.04 | - |
| Total AEBQ | 0.58 ** | 0.59 ** | 0.41 ** | 0.57 ** | 0.65 ** | 0.17 ** | 0.45 ** |
Publisher’s Note: MDPI stays neutral with regard to jurisdictional claims in published maps and institutional affiliations. |
© 2020 by the authors. Licensee MDPI, Basel, Switzerland. This article is an open access article distributed under the terms and conditions of the Creative Commons Attribution (CC BY) license (http://creativecommons.org/licenses/by/4.0/).
Share and Cite
Guzek, D.; Skolmowska, D.; Głąbska, D. Appetitive Traits in a Population-Based Study of Polish Adolescents within the PLACE-19 Study: Validation of the Adult Eating Behavior Questionnaire. Nutrients 2020, 12, 3889. https://0-doi-org.brum.beds.ac.uk/10.3390/nu12123889
Guzek D, Skolmowska D, Głąbska D. Appetitive Traits in a Population-Based Study of Polish Adolescents within the PLACE-19 Study: Validation of the Adult Eating Behavior Questionnaire. Nutrients. 2020; 12(12):3889. https://0-doi-org.brum.beds.ac.uk/10.3390/nu12123889
Chicago/Turabian StyleGuzek, Dominika, Dominika Skolmowska, and Dominika Głąbska. 2020. "Appetitive Traits in a Population-Based Study of Polish Adolescents within the PLACE-19 Study: Validation of the Adult Eating Behavior Questionnaire" Nutrients 12, no. 12: 3889. https://0-doi-org.brum.beds.ac.uk/10.3390/nu12123889