
Folic Acid Supplementation Improves Glycemic Control for Diabetes Prevention and Management: A Systematic Review and Dose-Response Meta-Analysis of Randomized Controlled Trials


 , ,
, , 
 and
and
Abstract
:1. Introduction
2. Materials and Methods
2.1. Search Strategy
2.2. Inclusion Criteria
2.3. Exclusion Criteria
2.4. Data Extraction
2.5. Quality Assessment
2.6. Statistical Analysis
2.7. Certainty Assessment
3. Results
3.1. Study Selection
3.2. Characteristics of the Included Studies
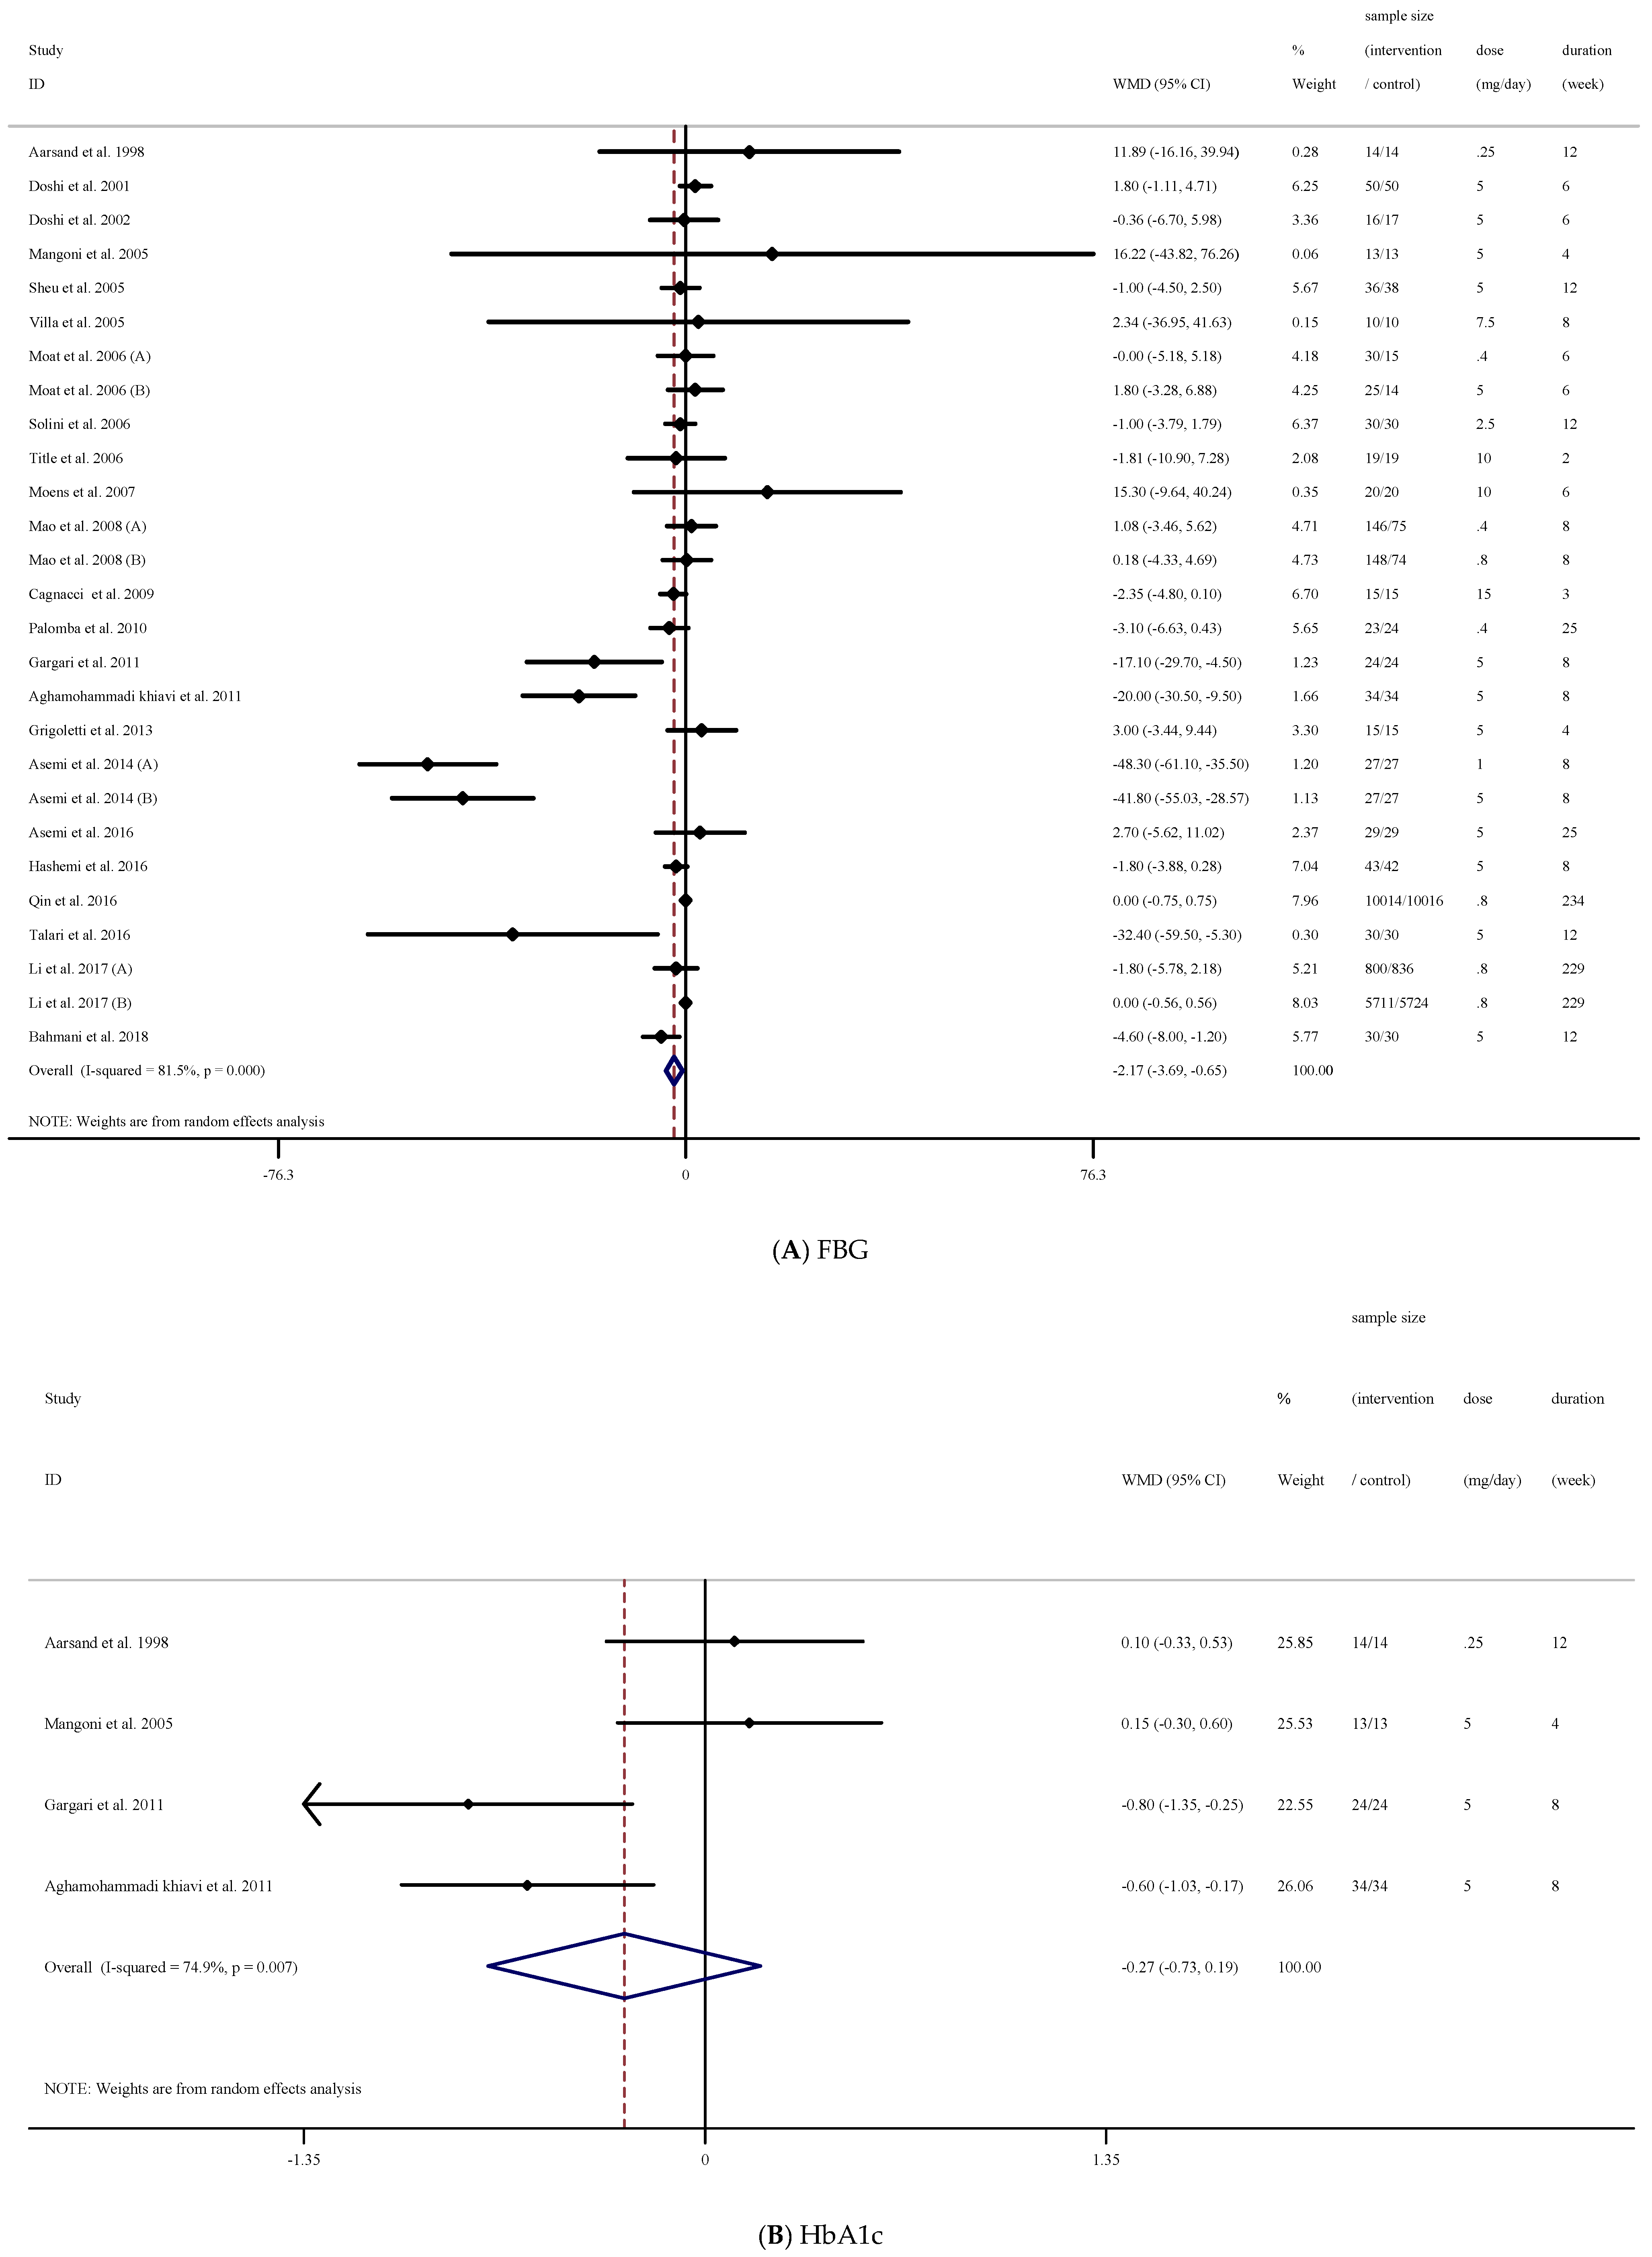
3.3. The Effect of Folic Acid Supplementation on FBG
3.4. The Effect of Folic Acid Supplementation on HbA1c
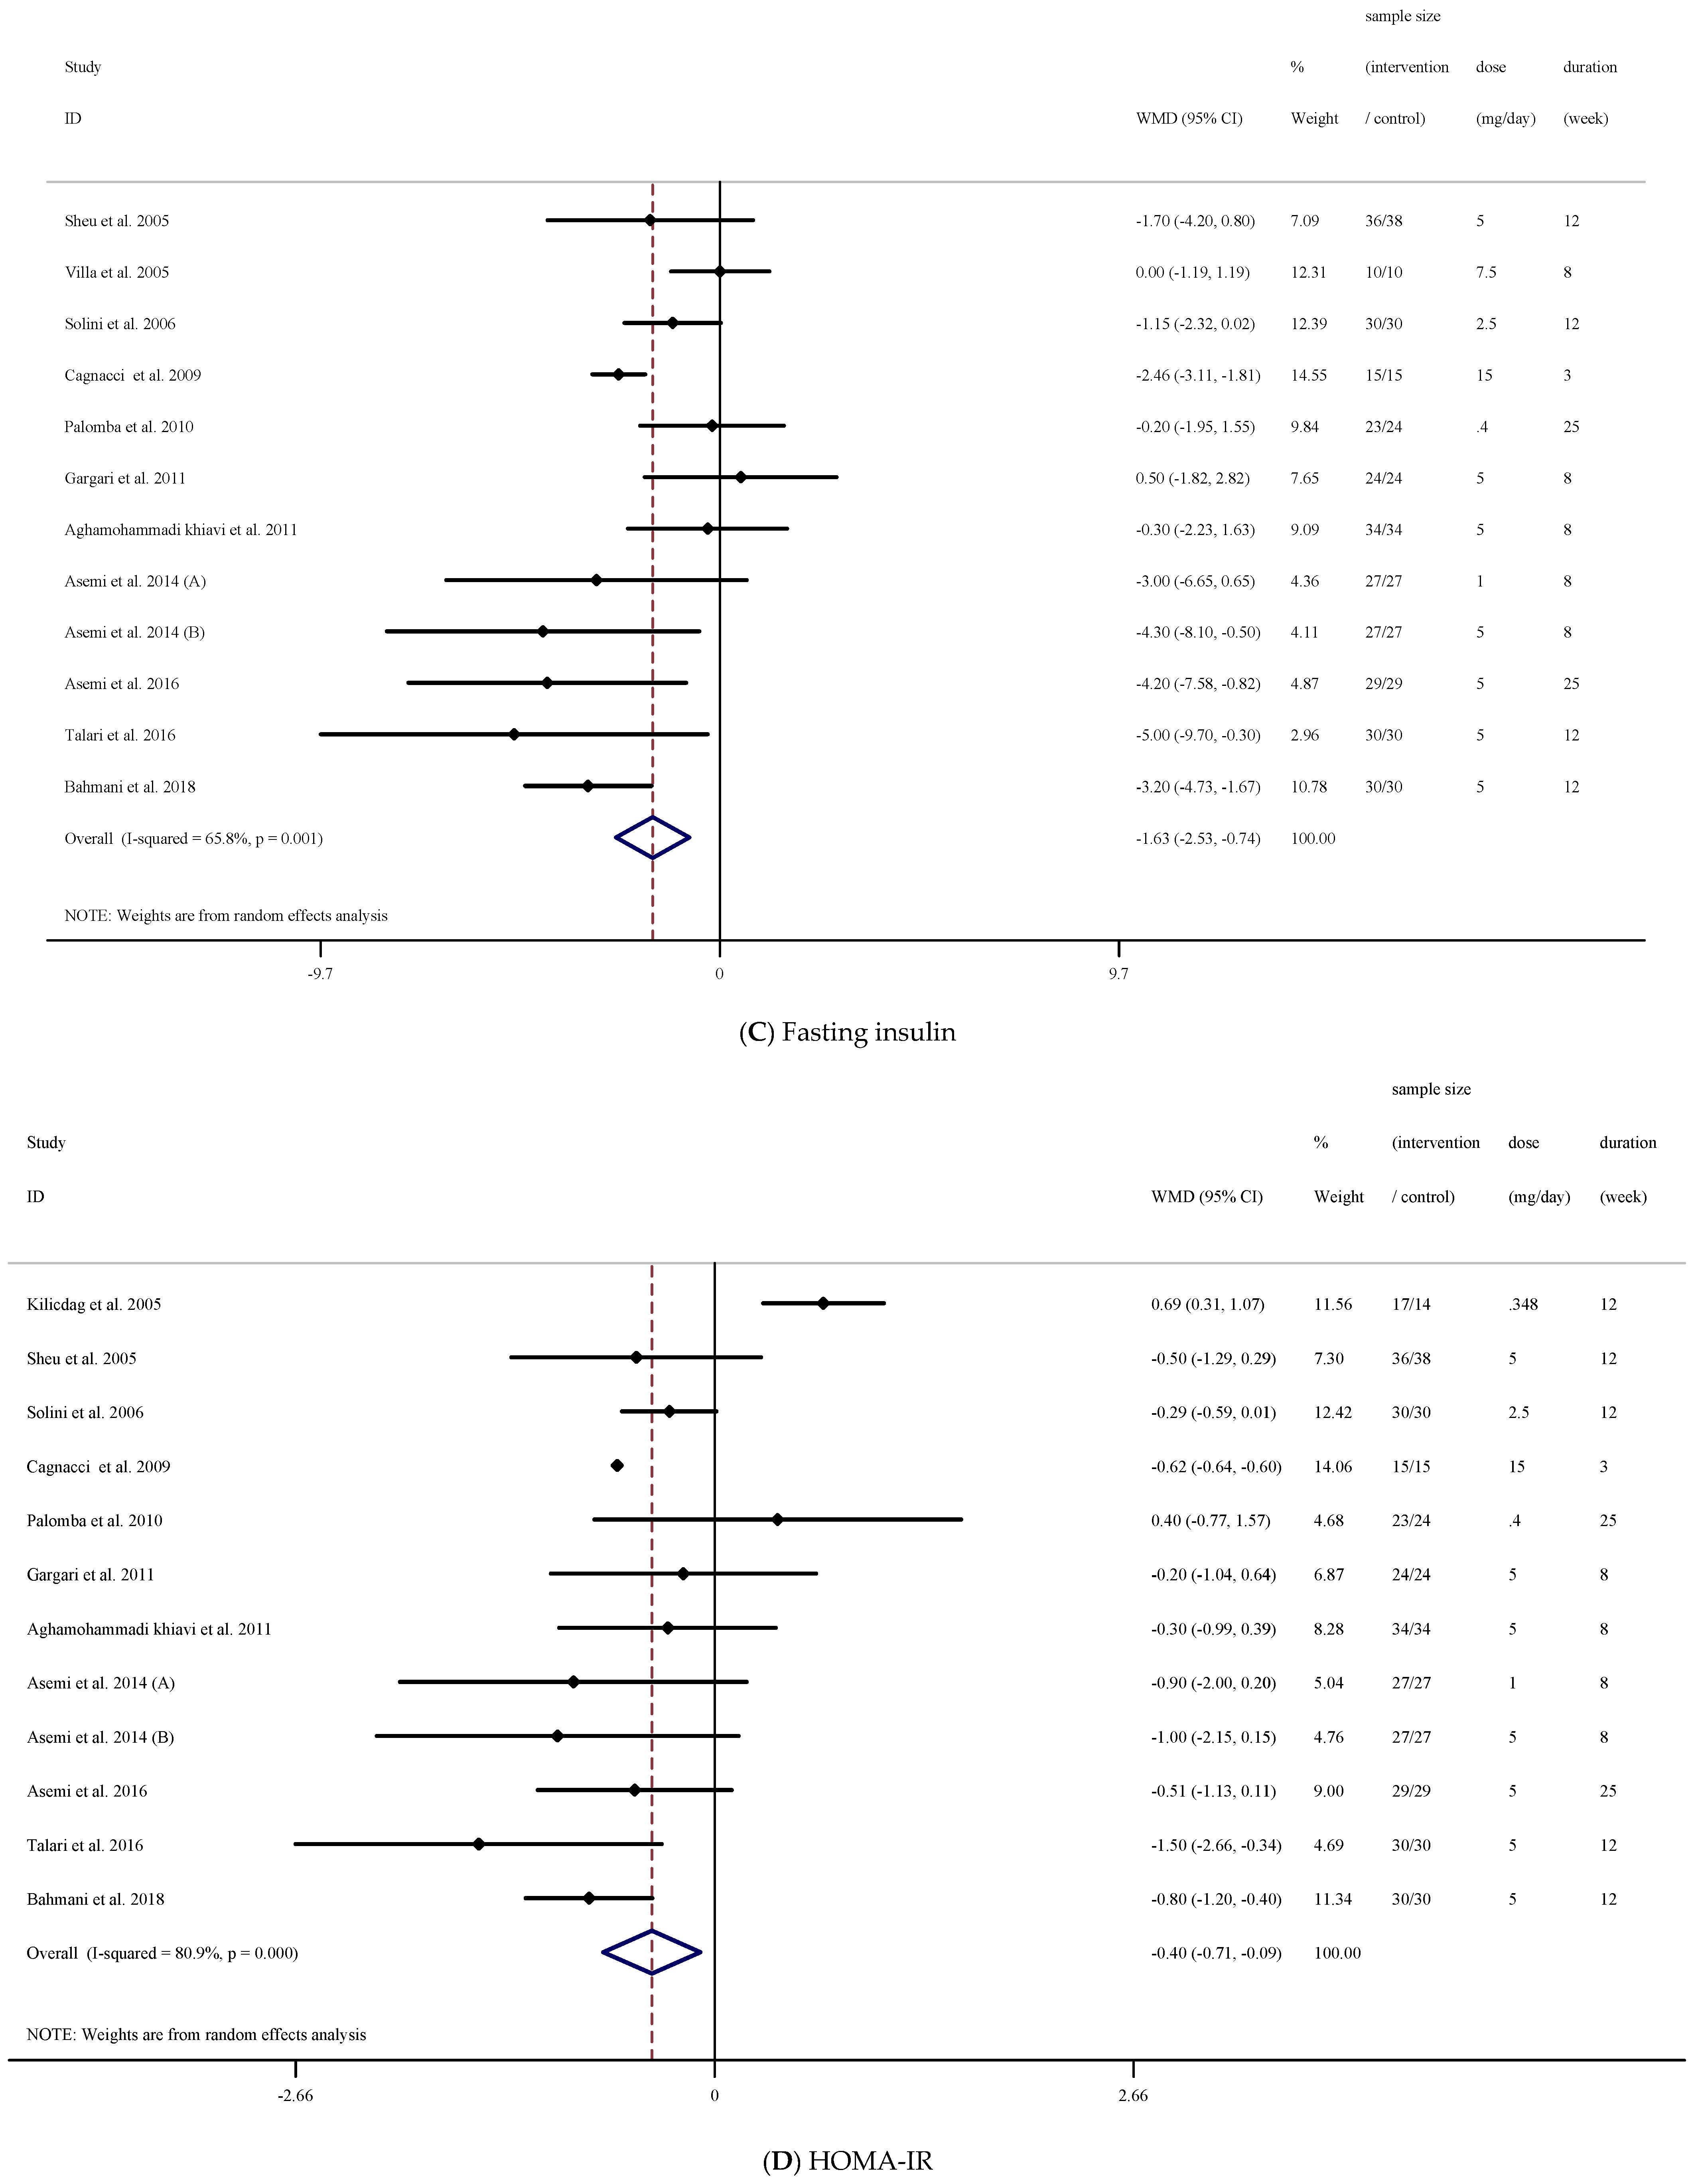
3.5. The Effect of Folic Acid Supplementation on Fasting Insulin
3.6. The Effect of Folic Acid Supplementation on HOMA-IR
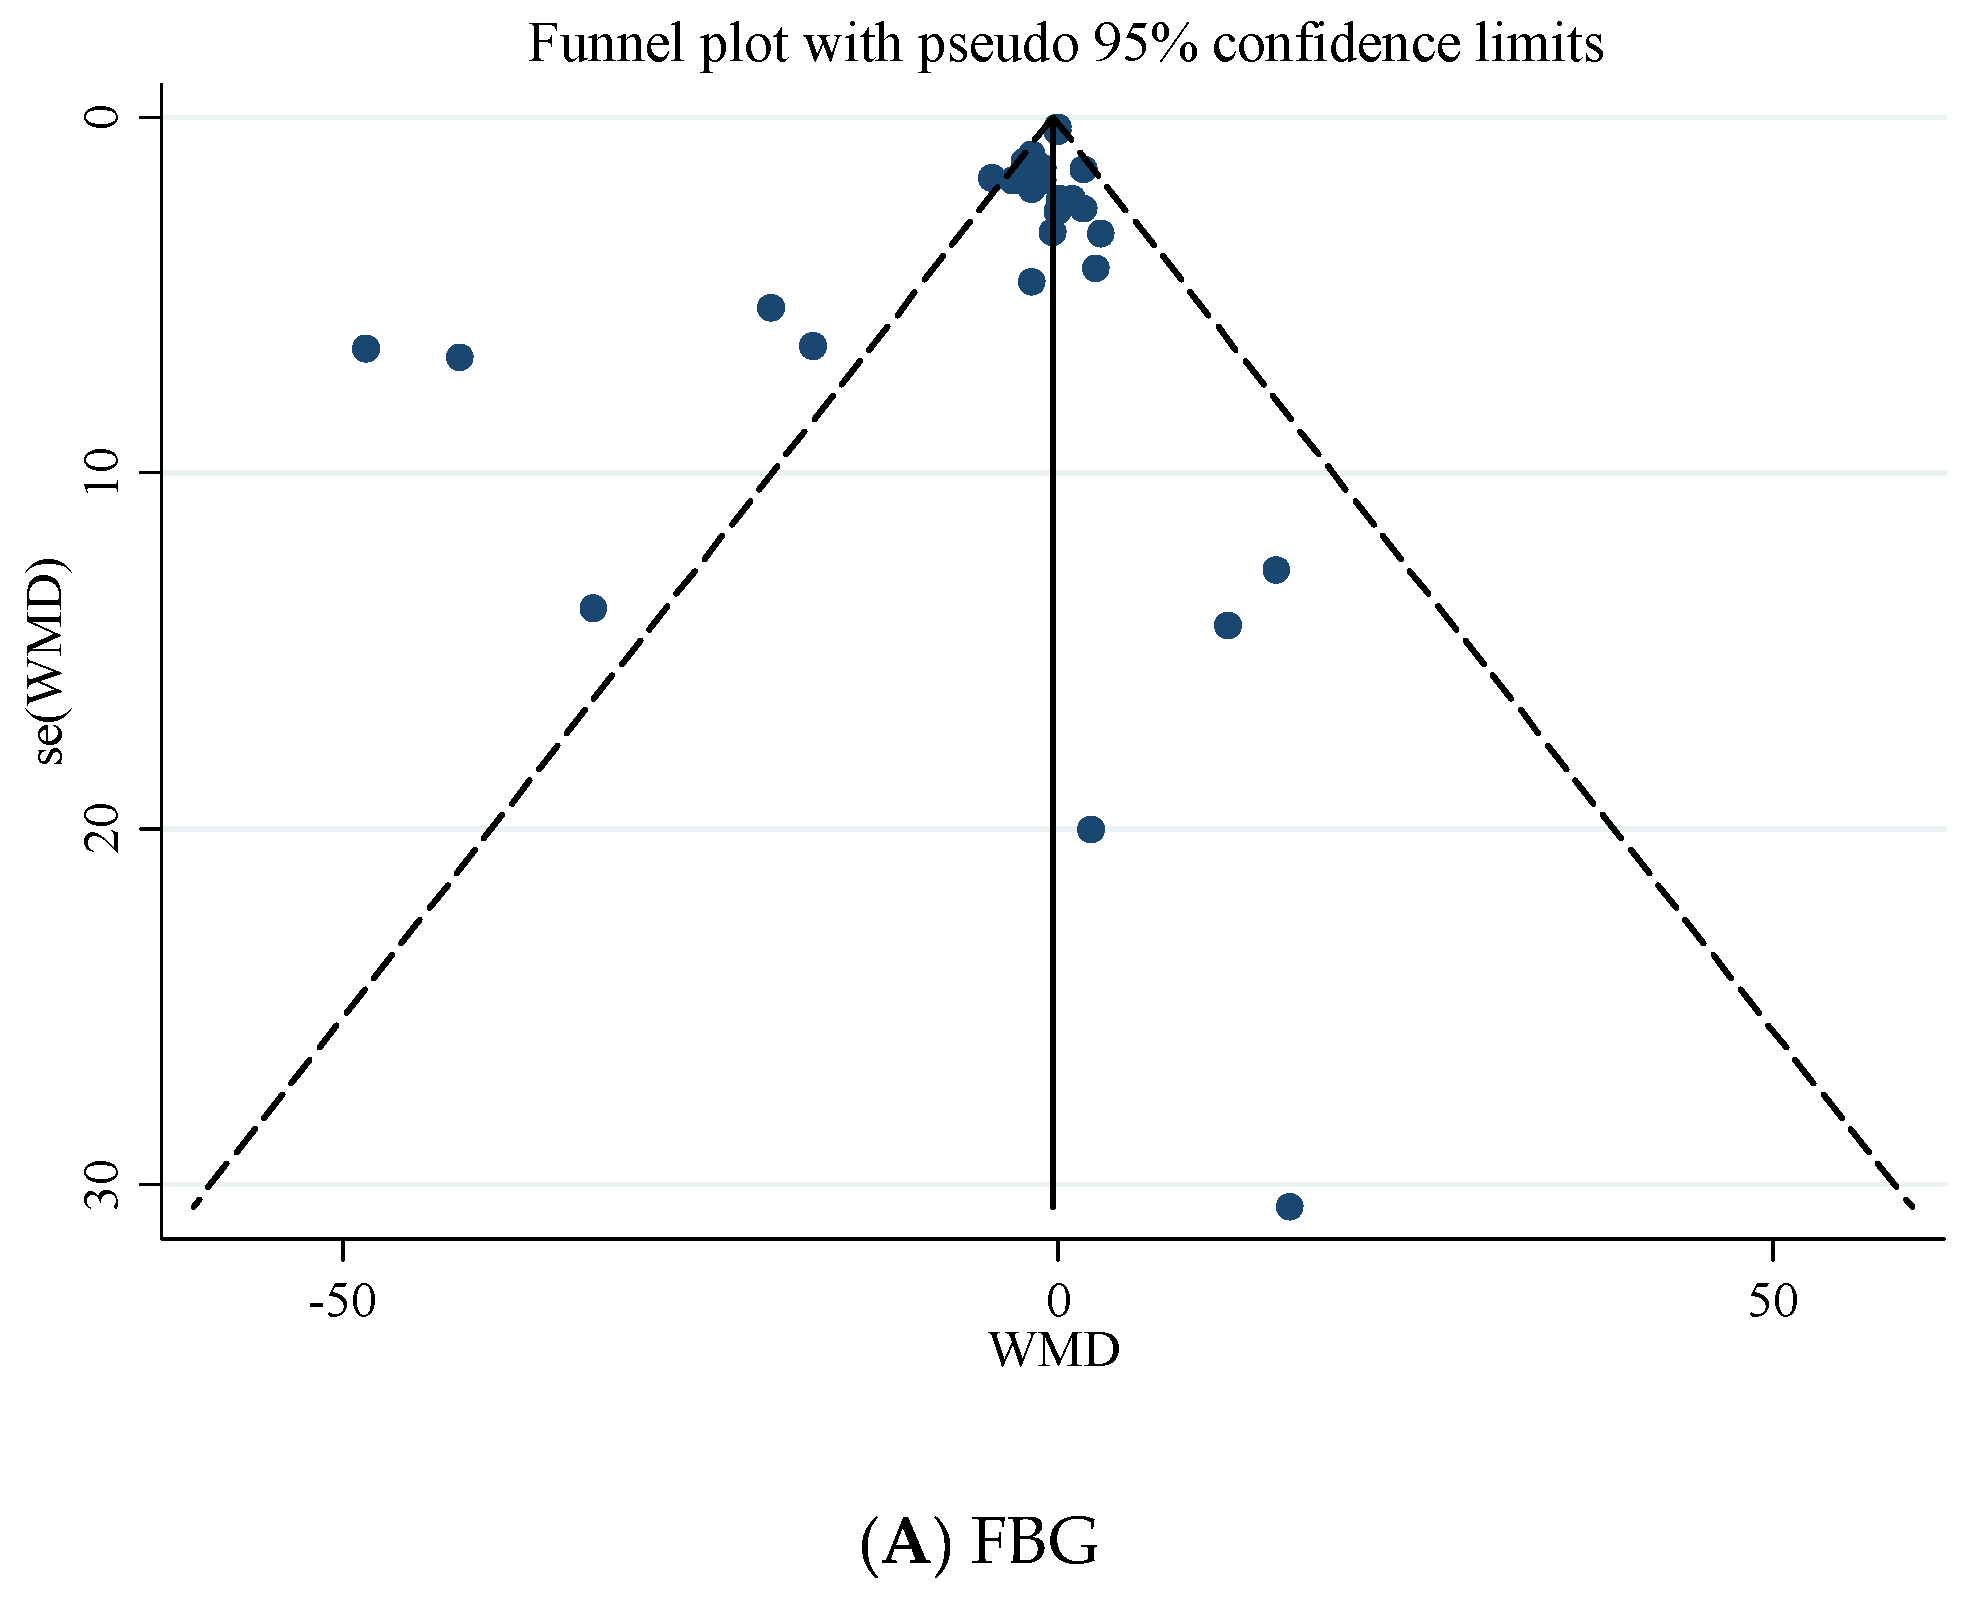
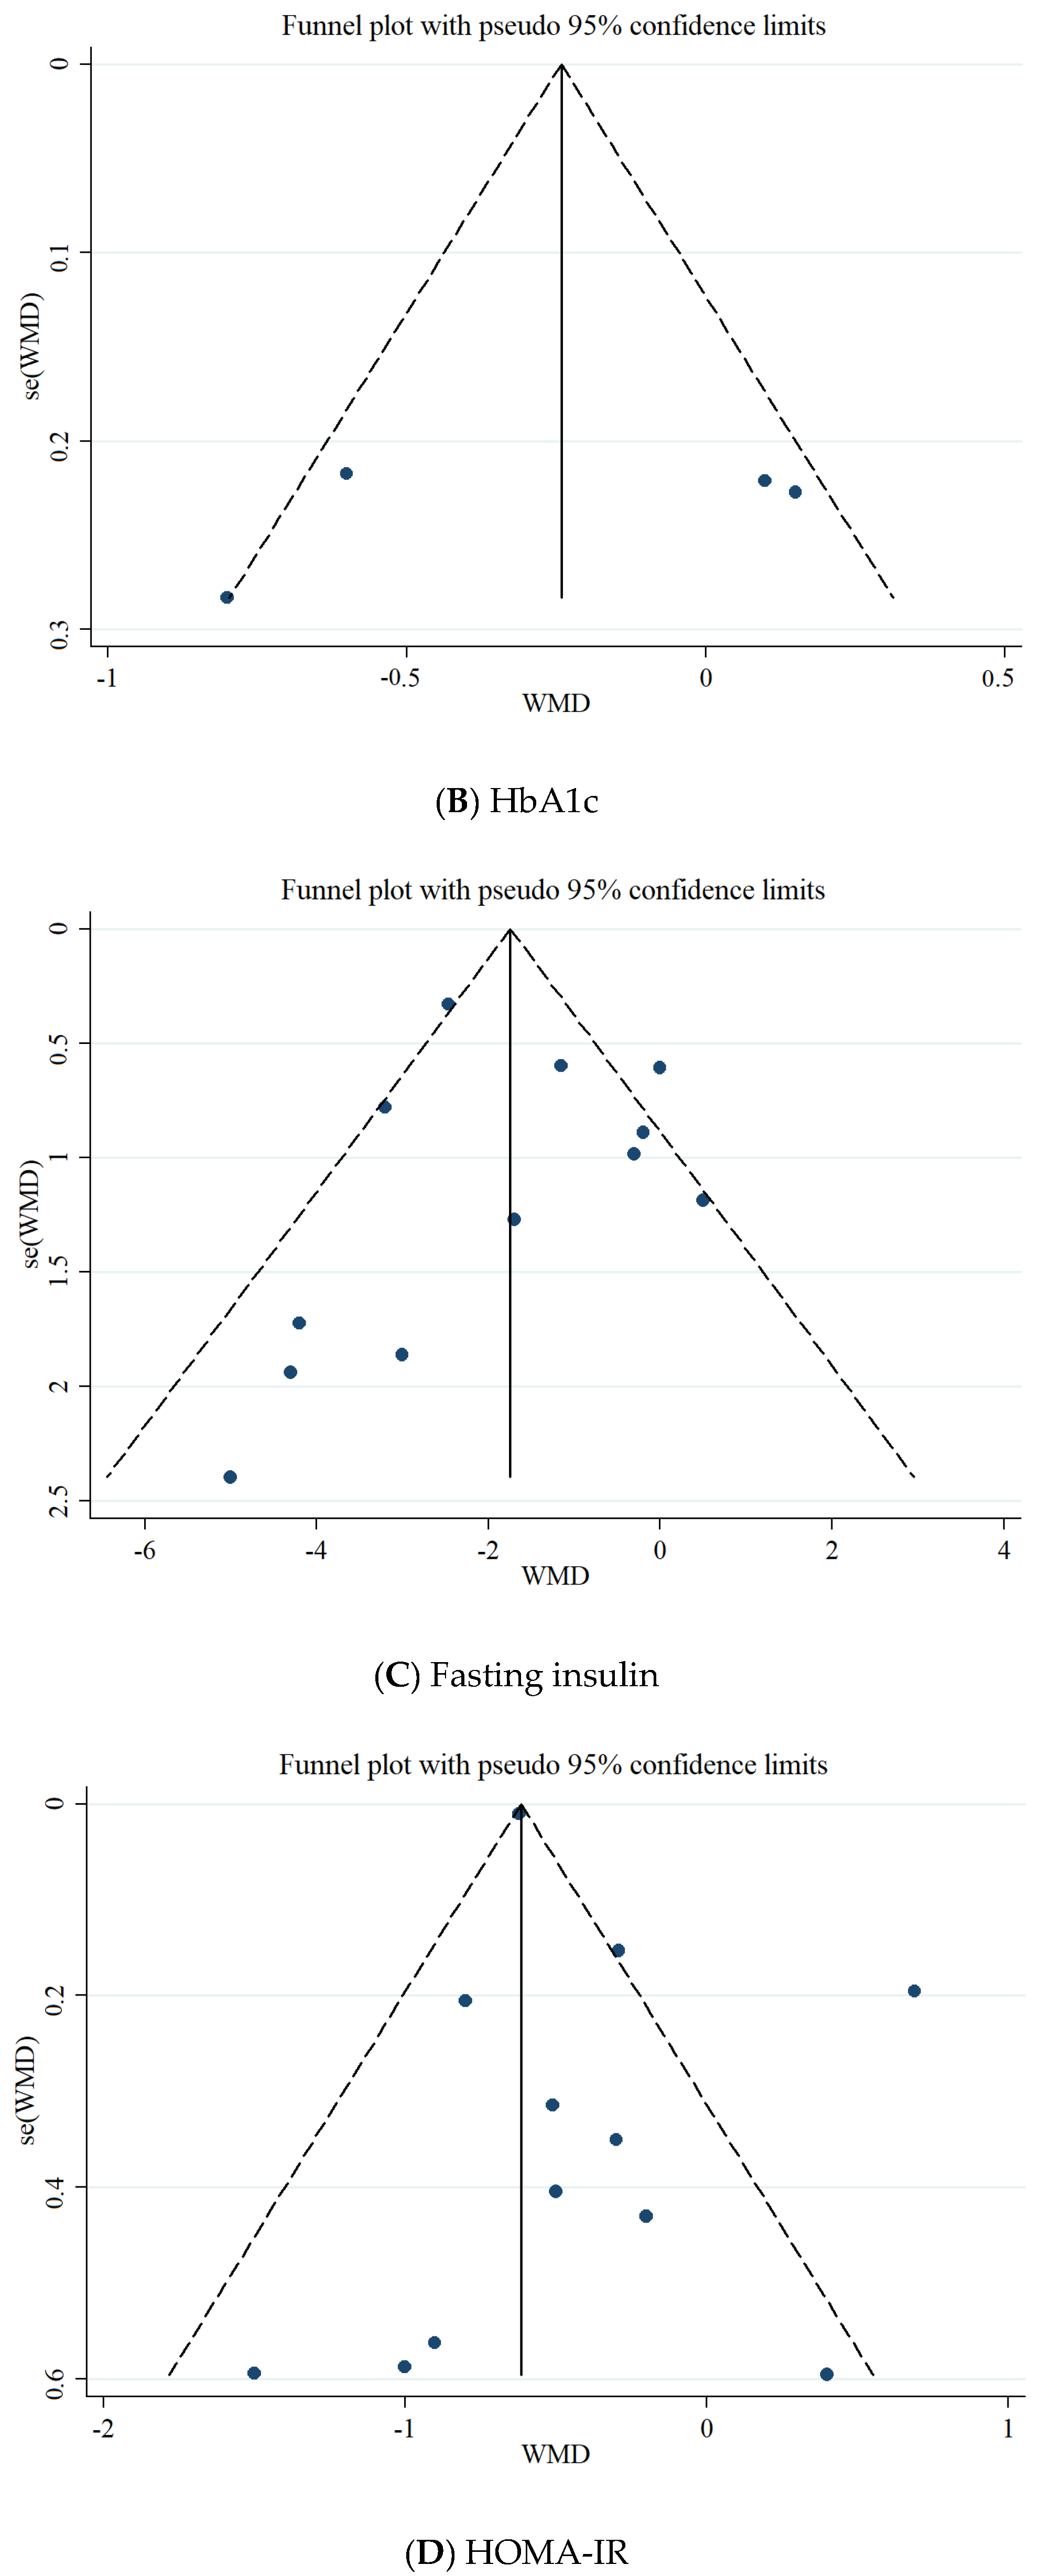
3.7. Publication Bias
3.8. Grade Assessment
3.9. Sensitivity Analysis
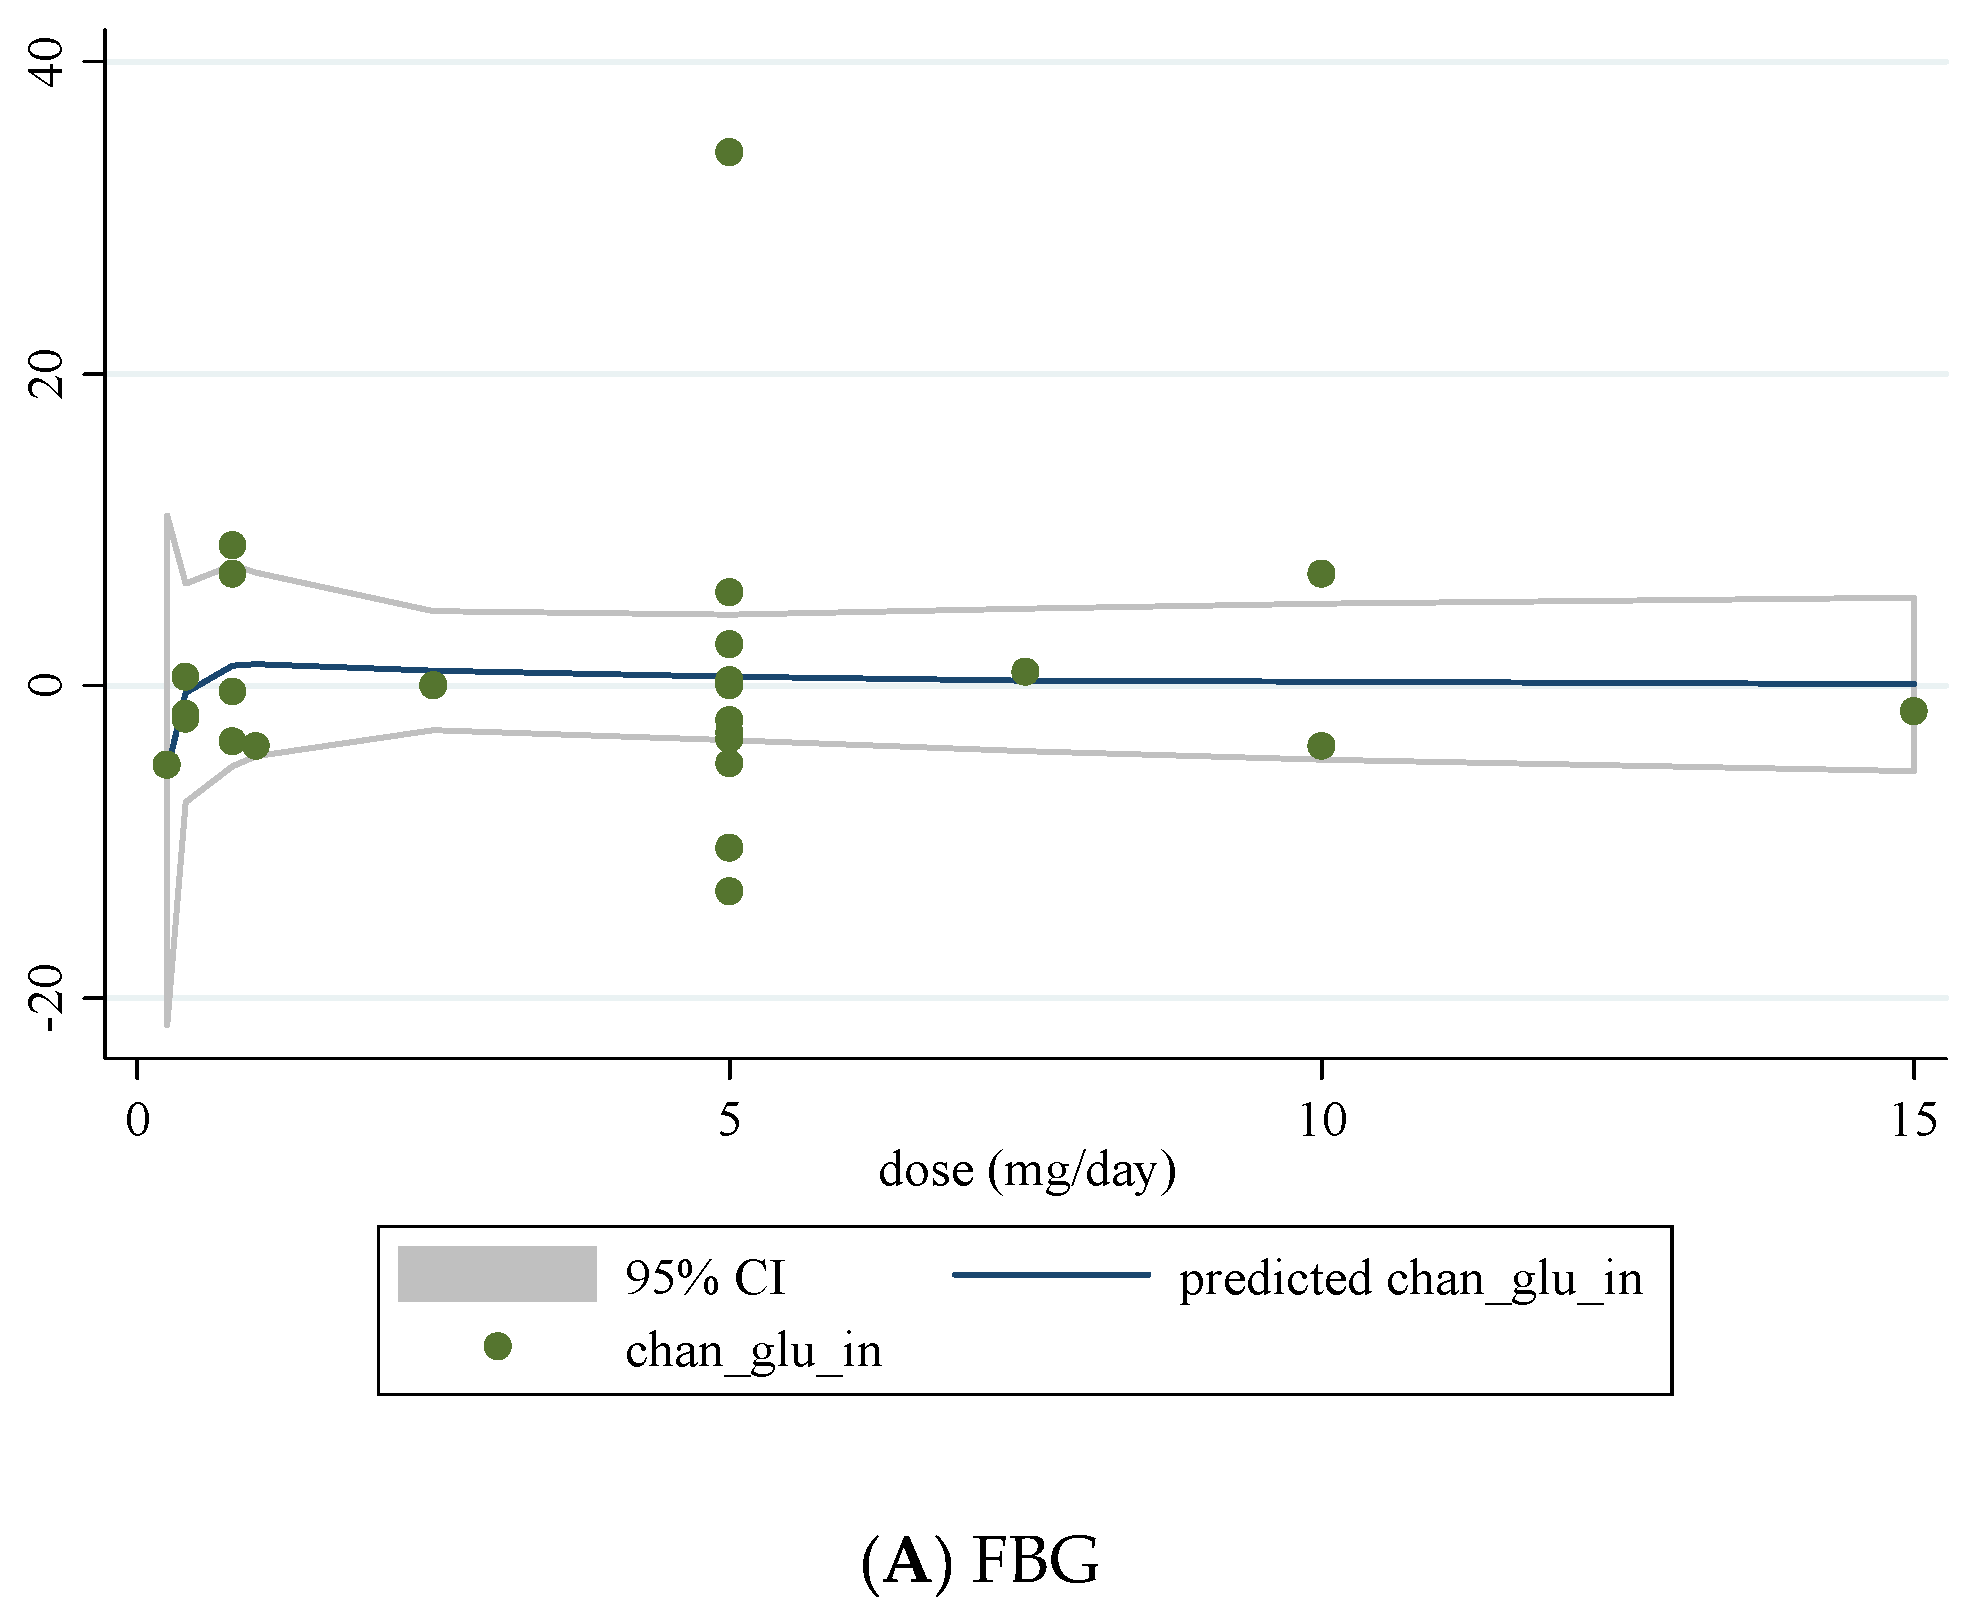
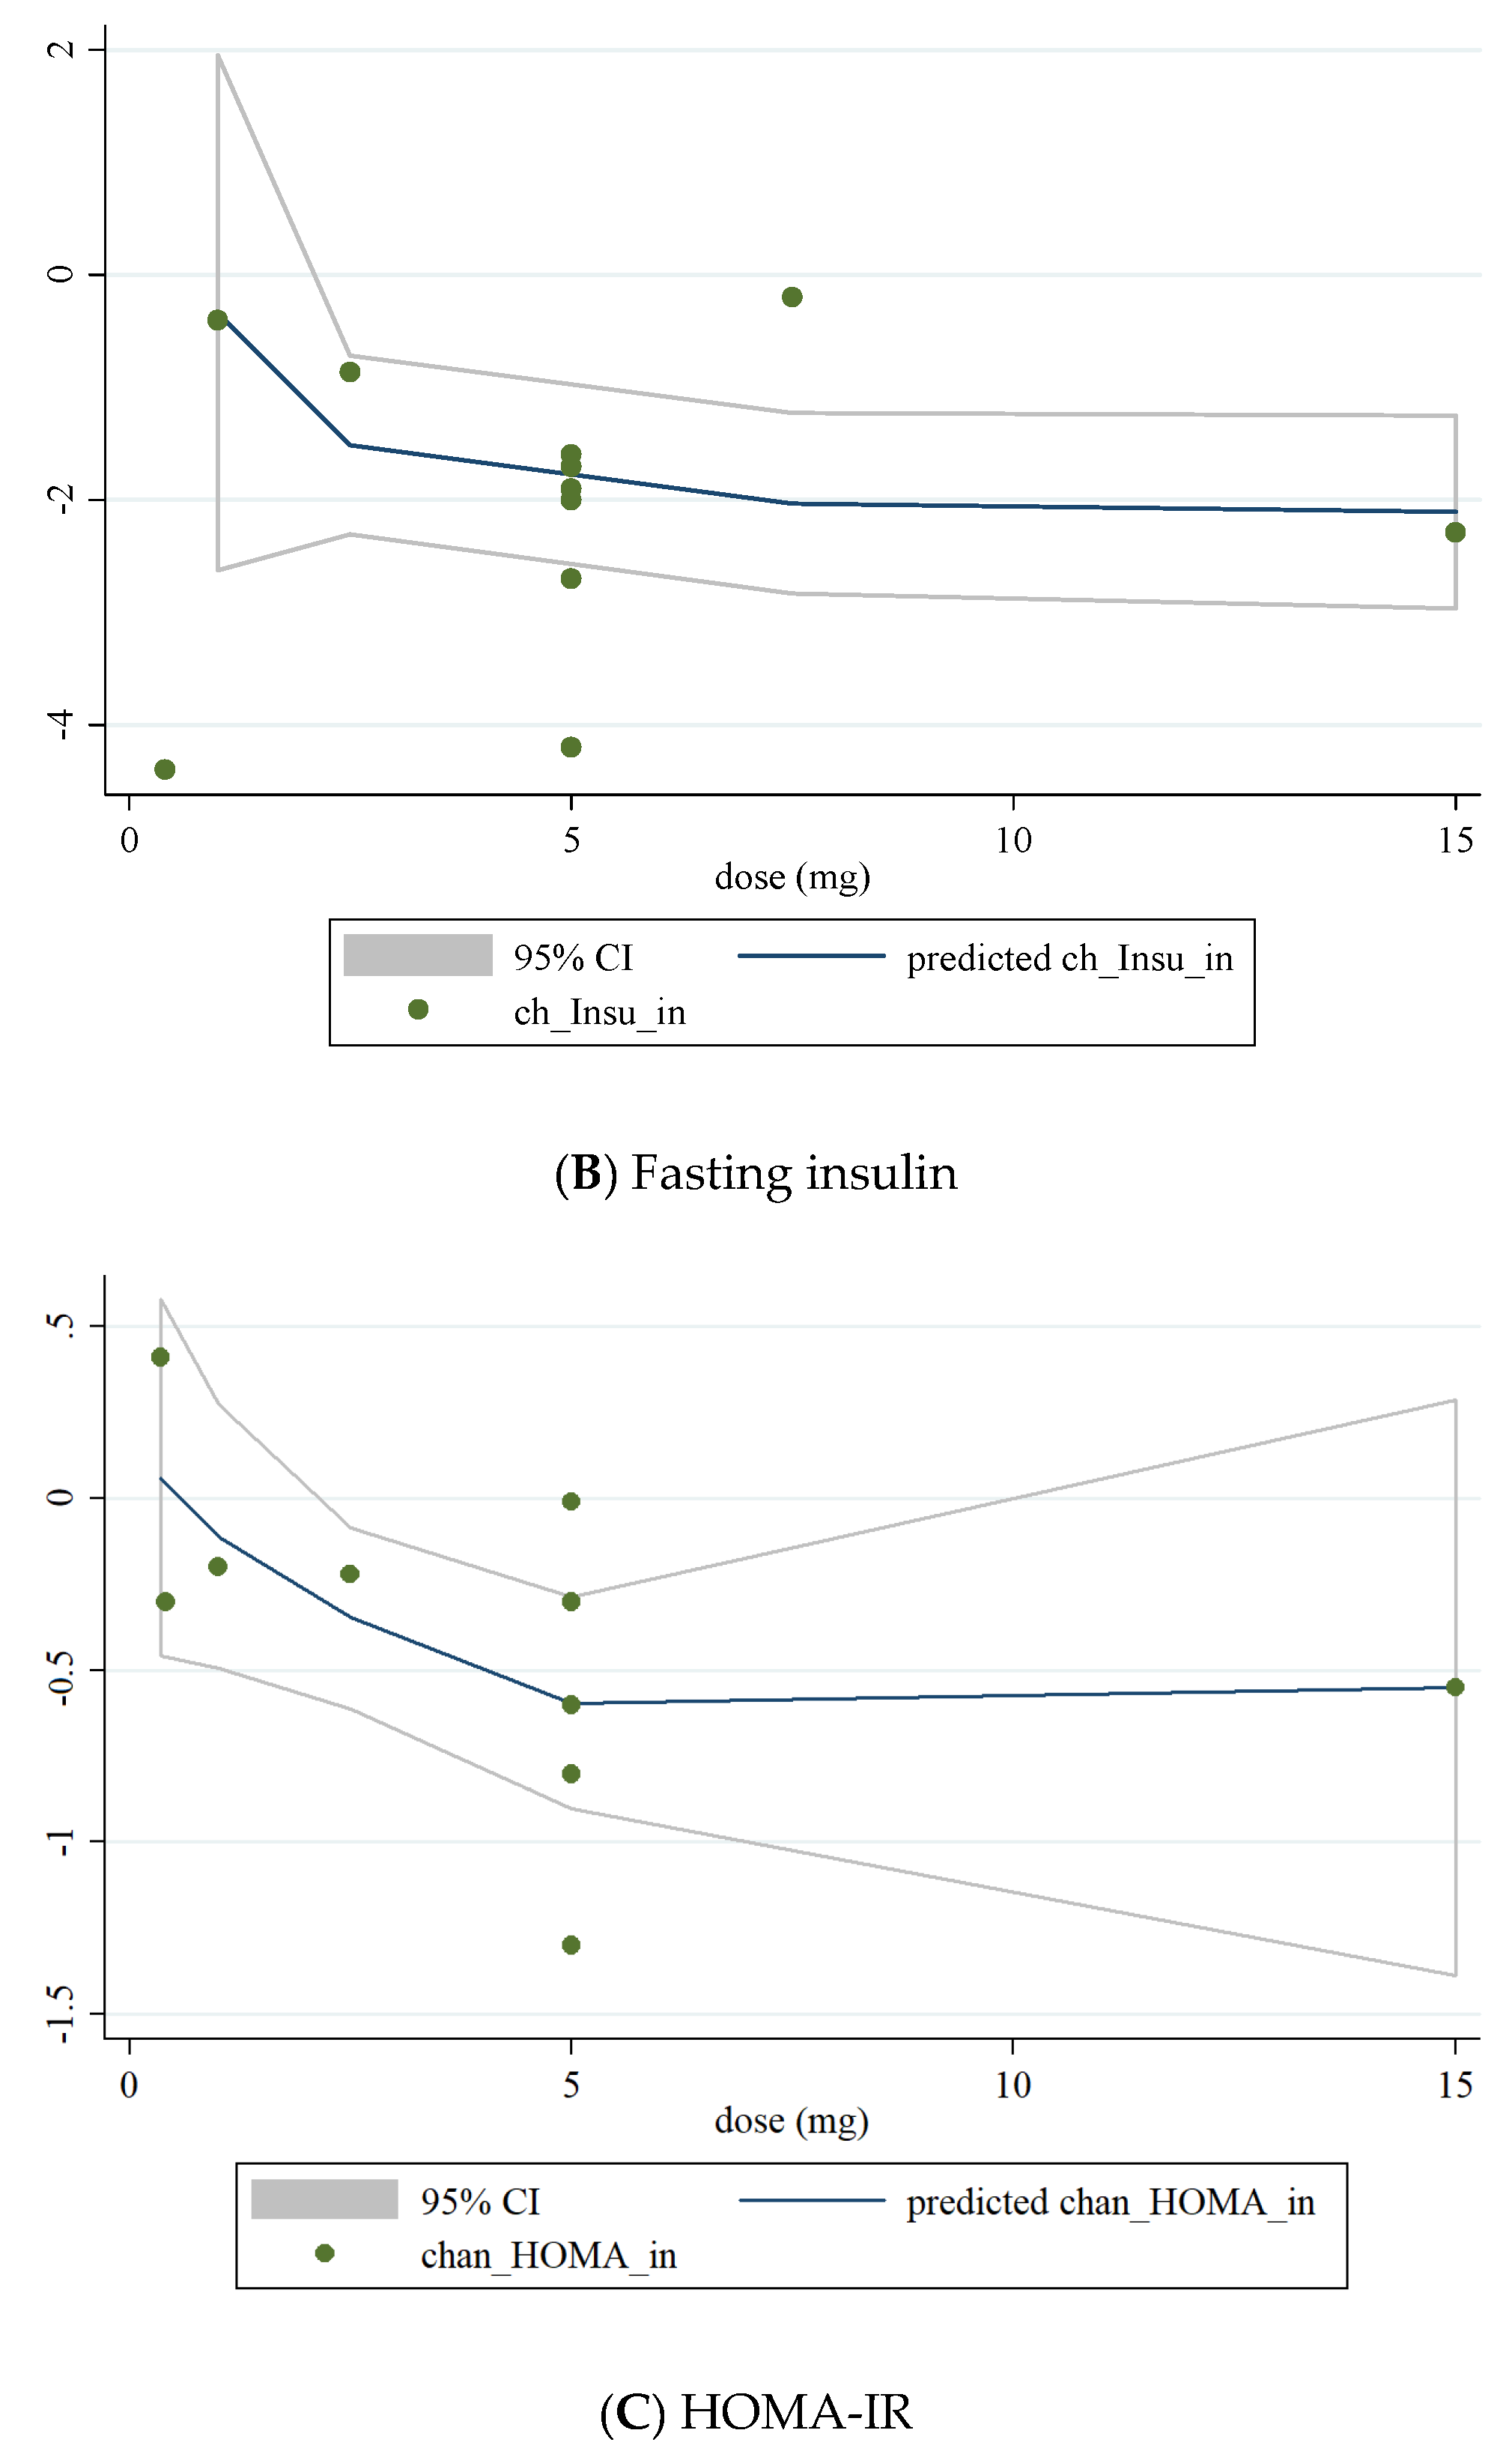
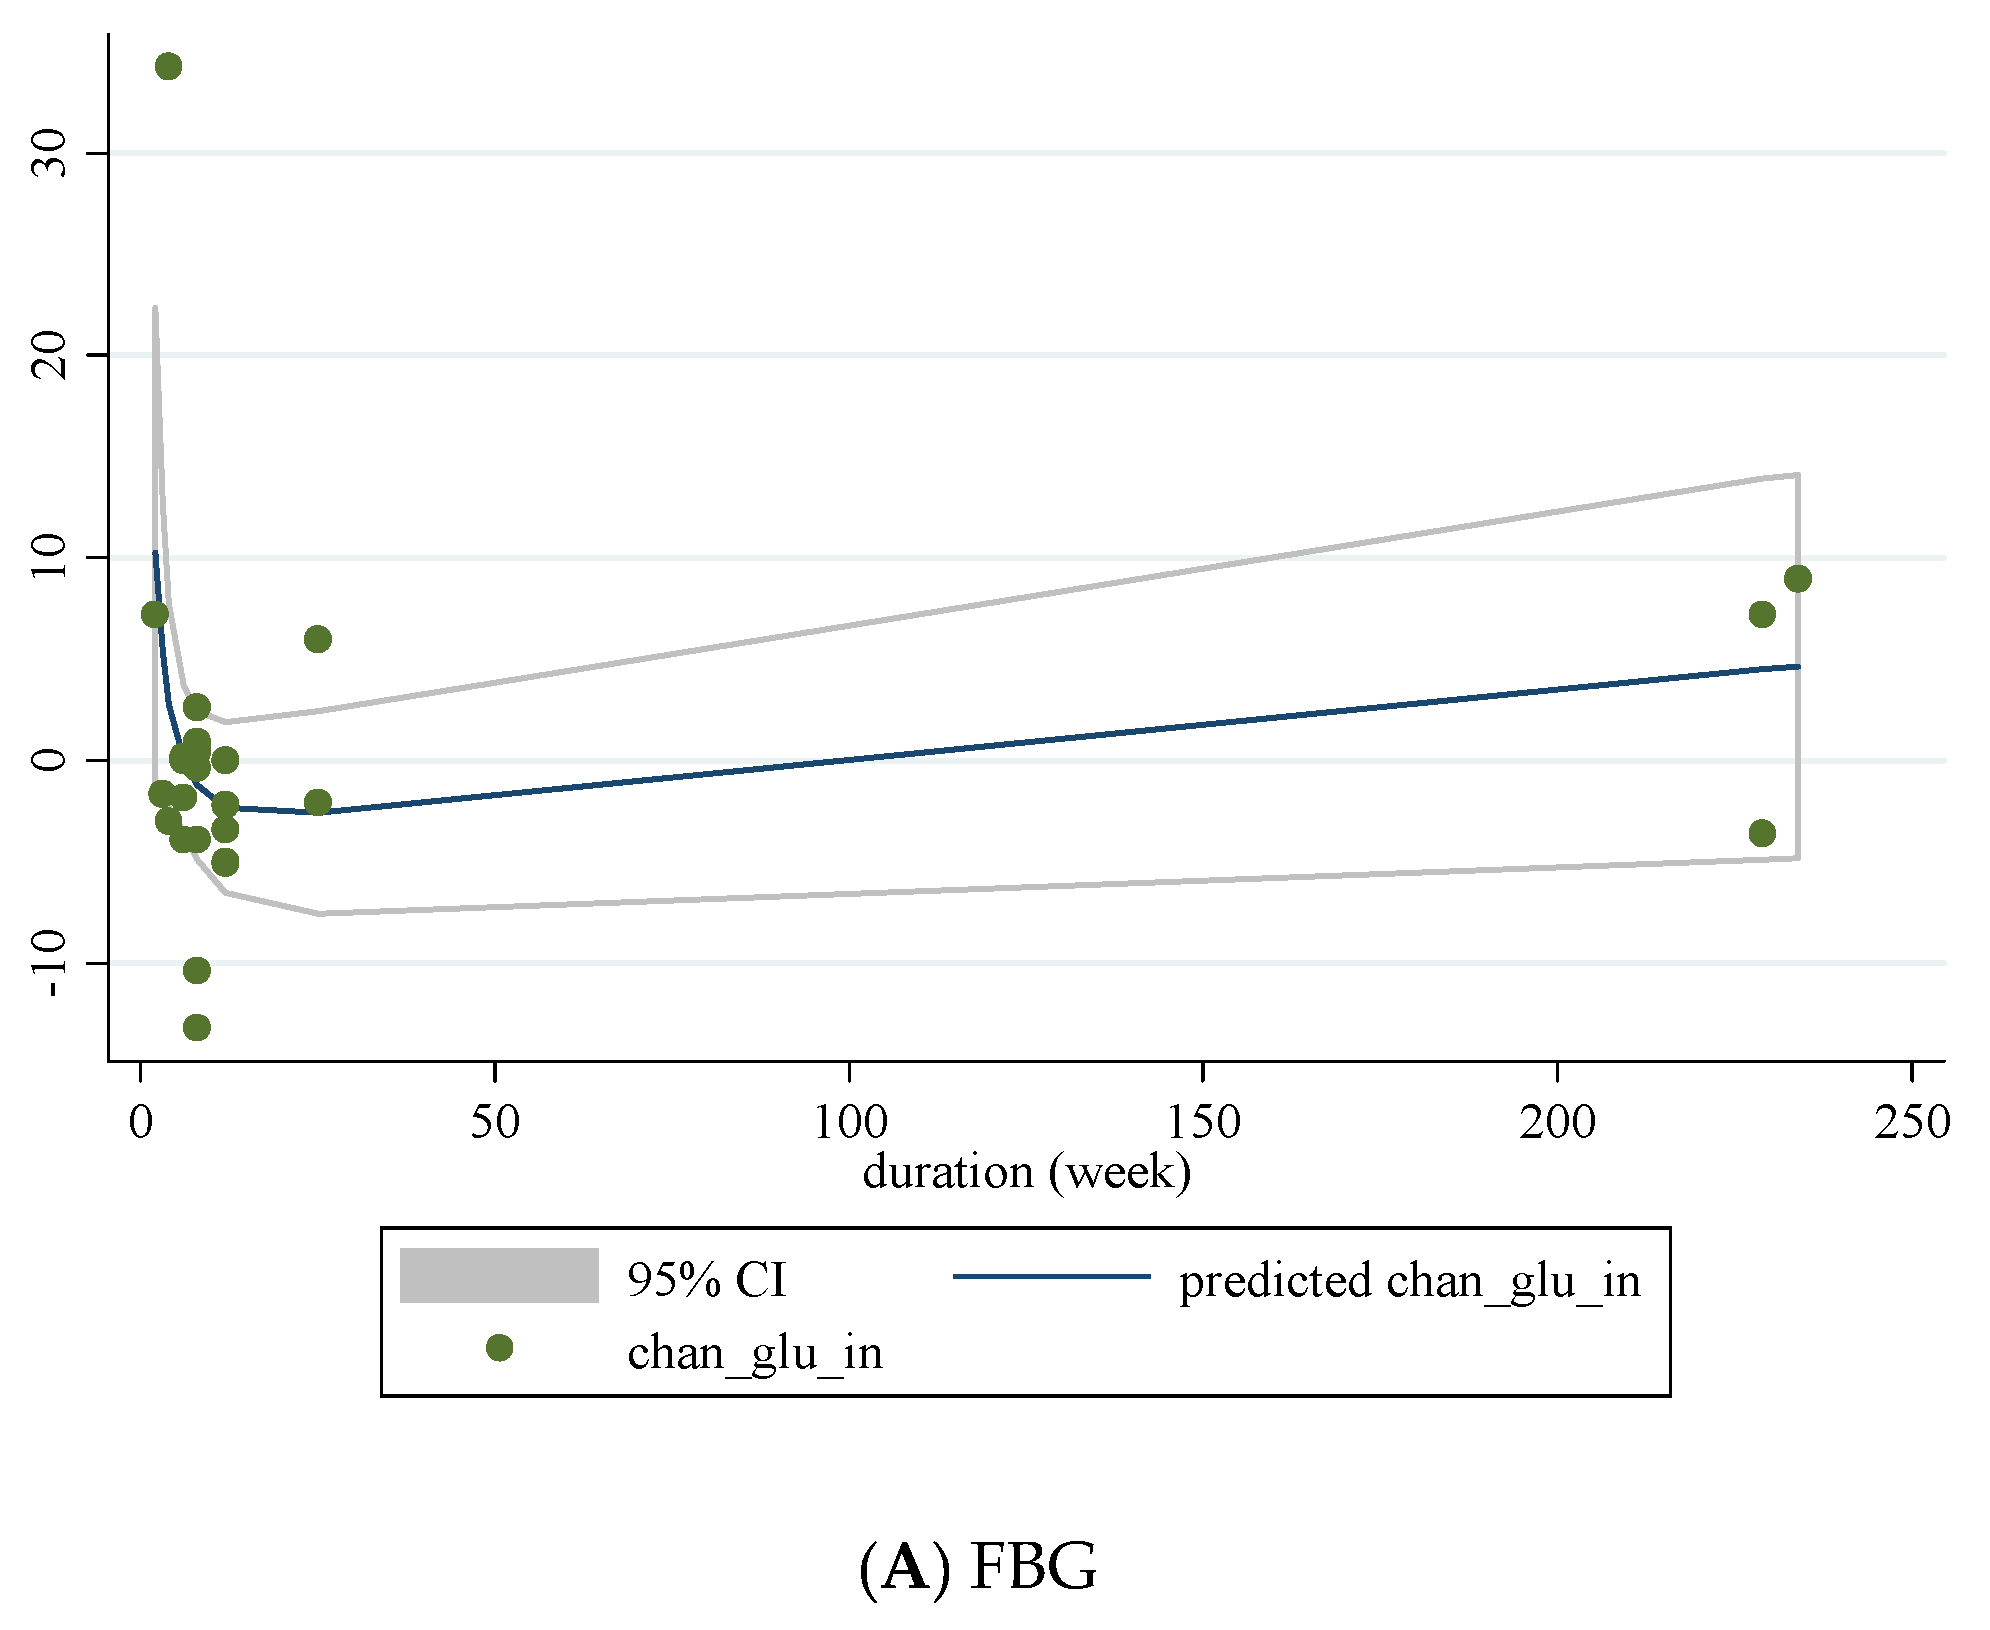
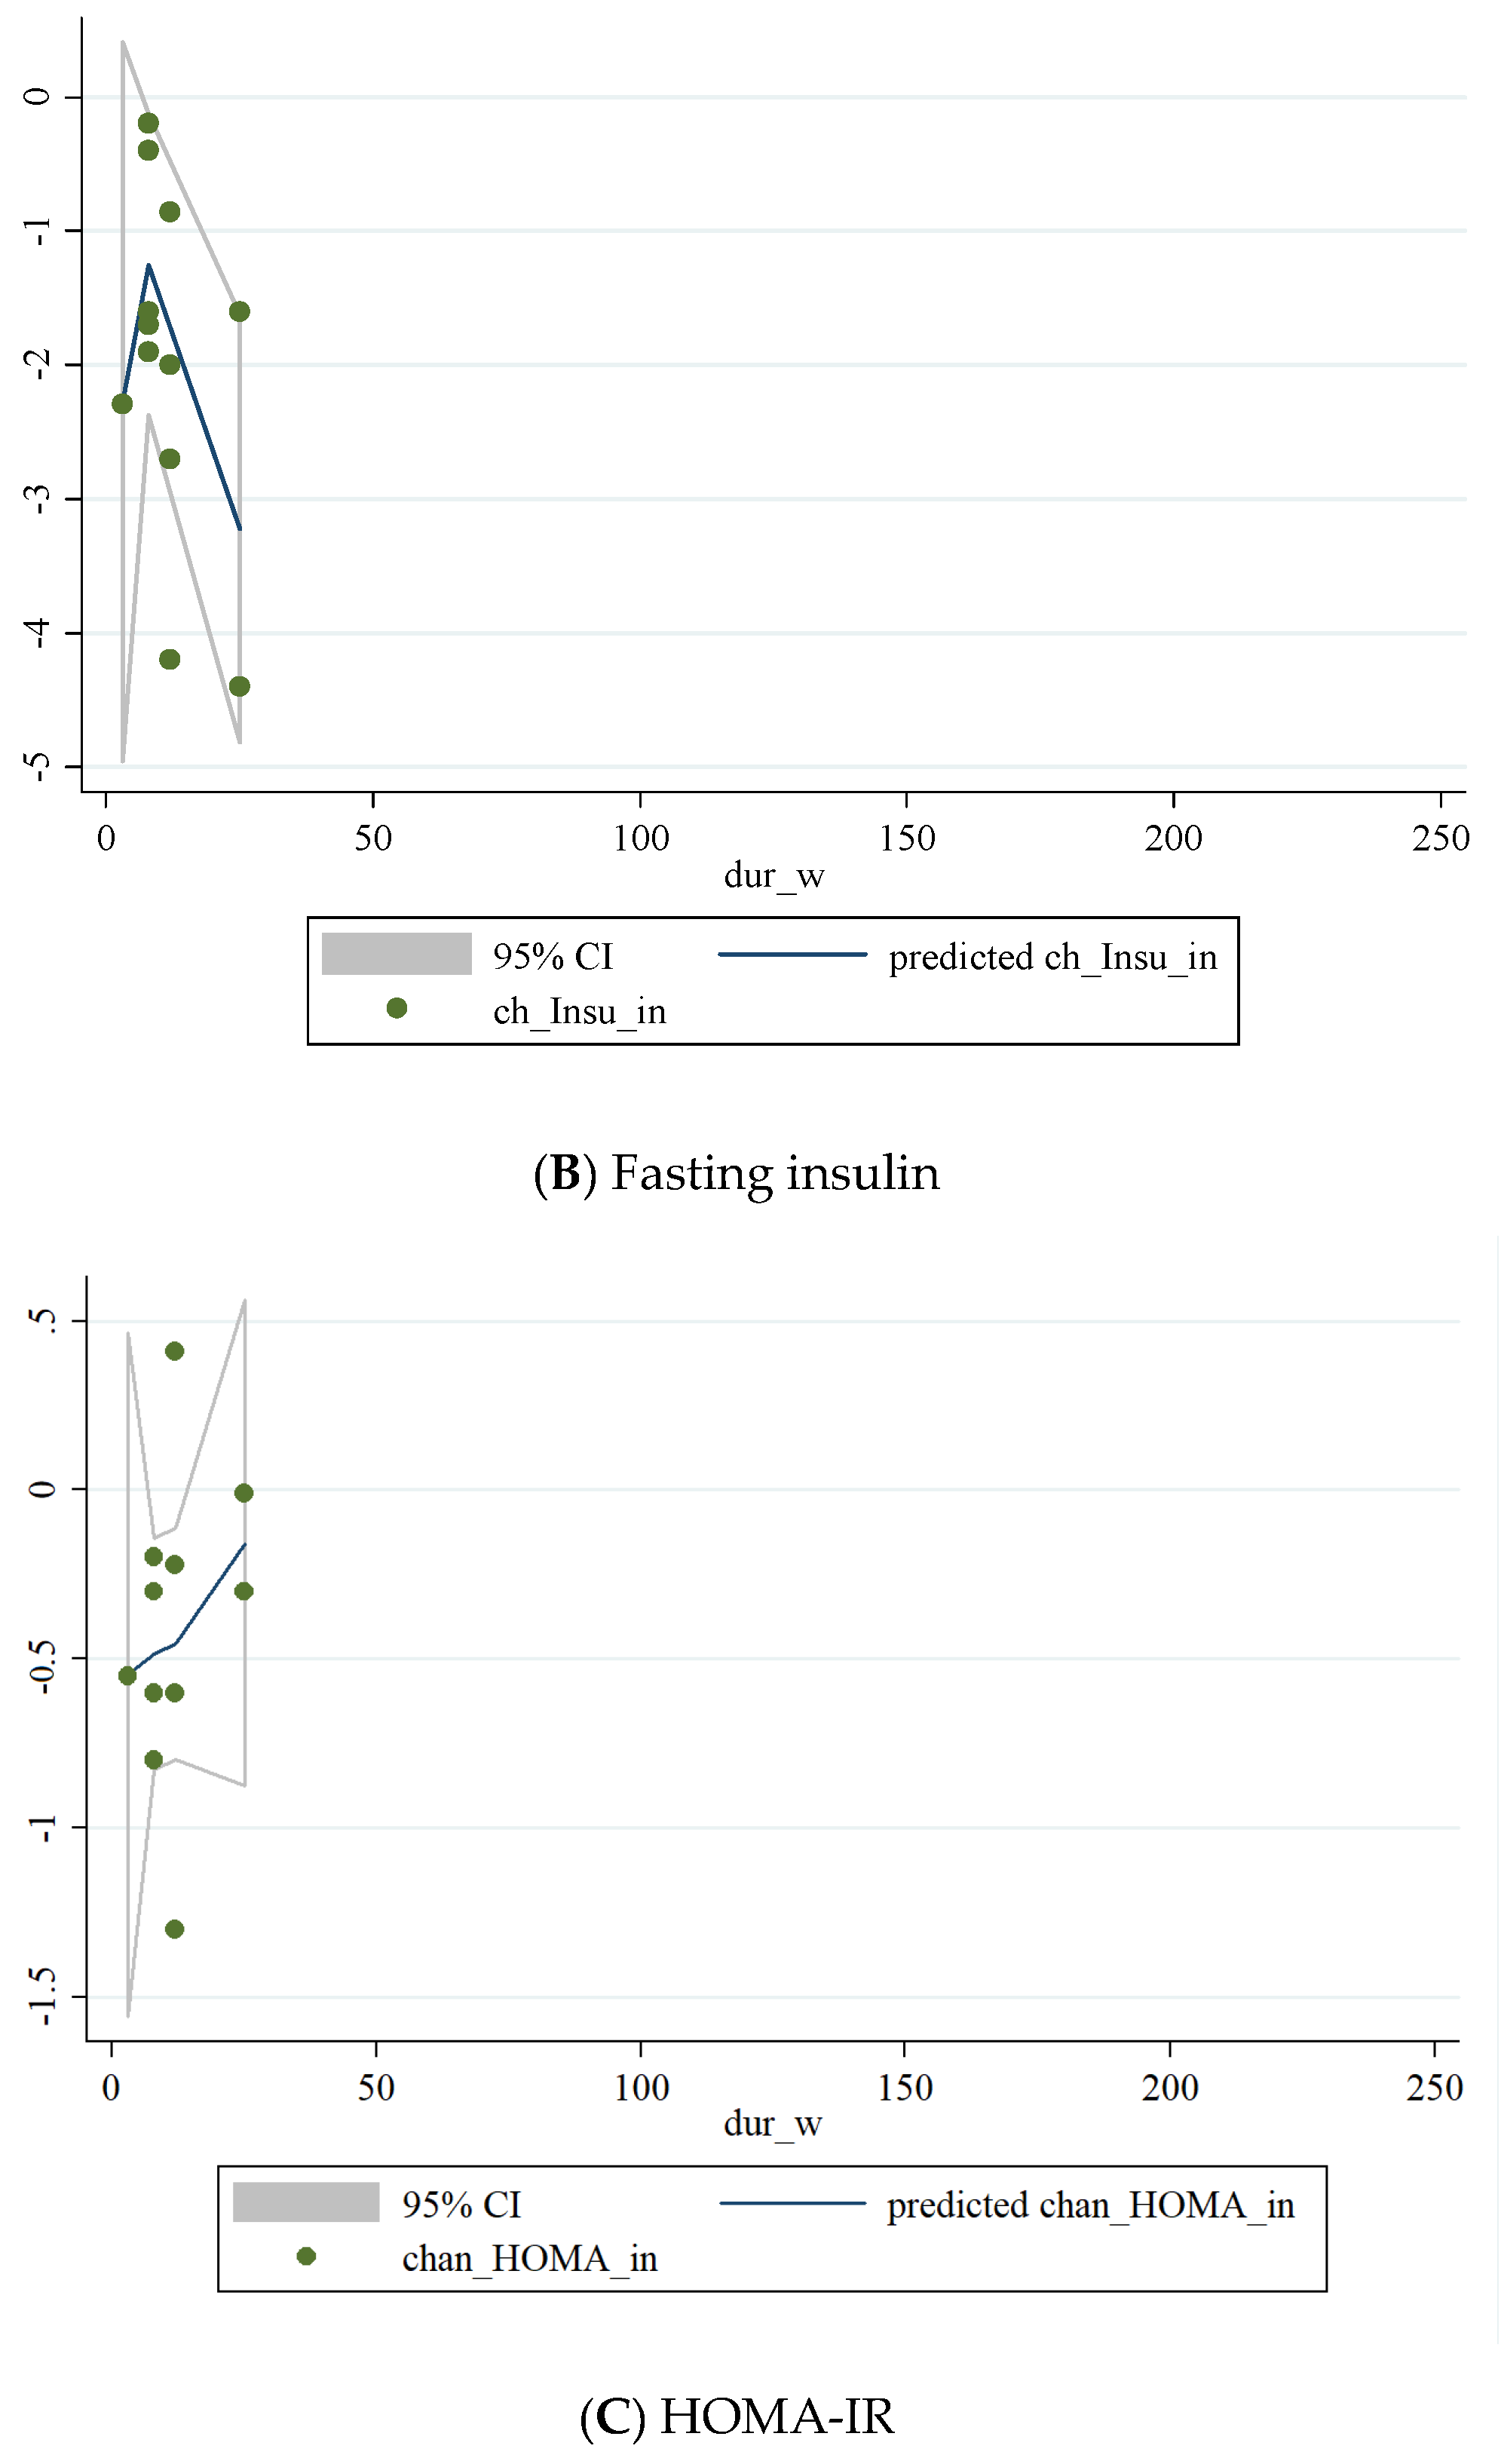
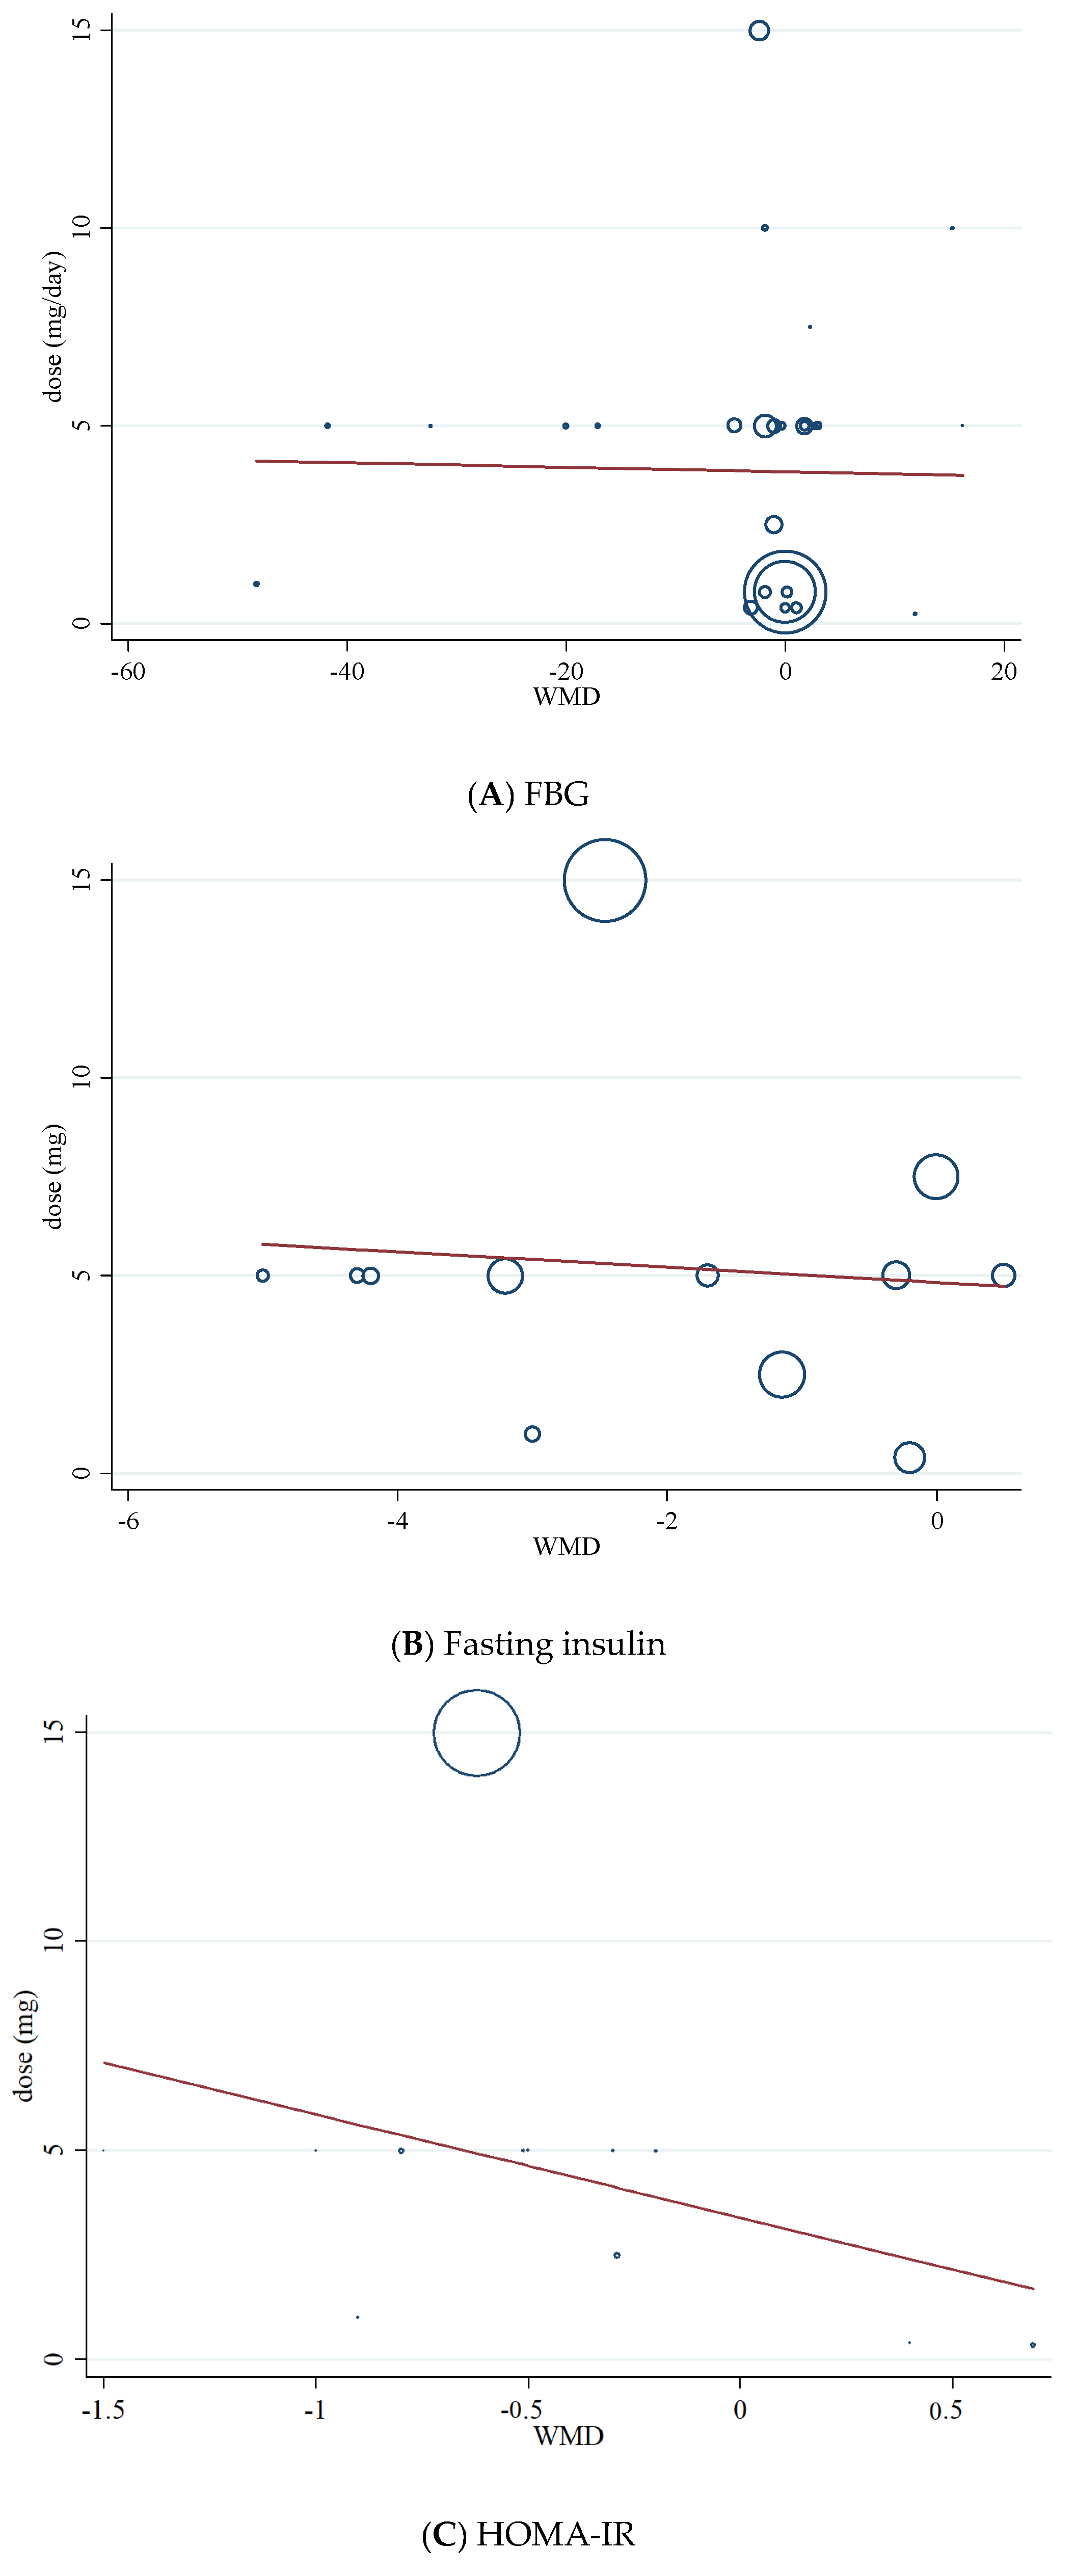
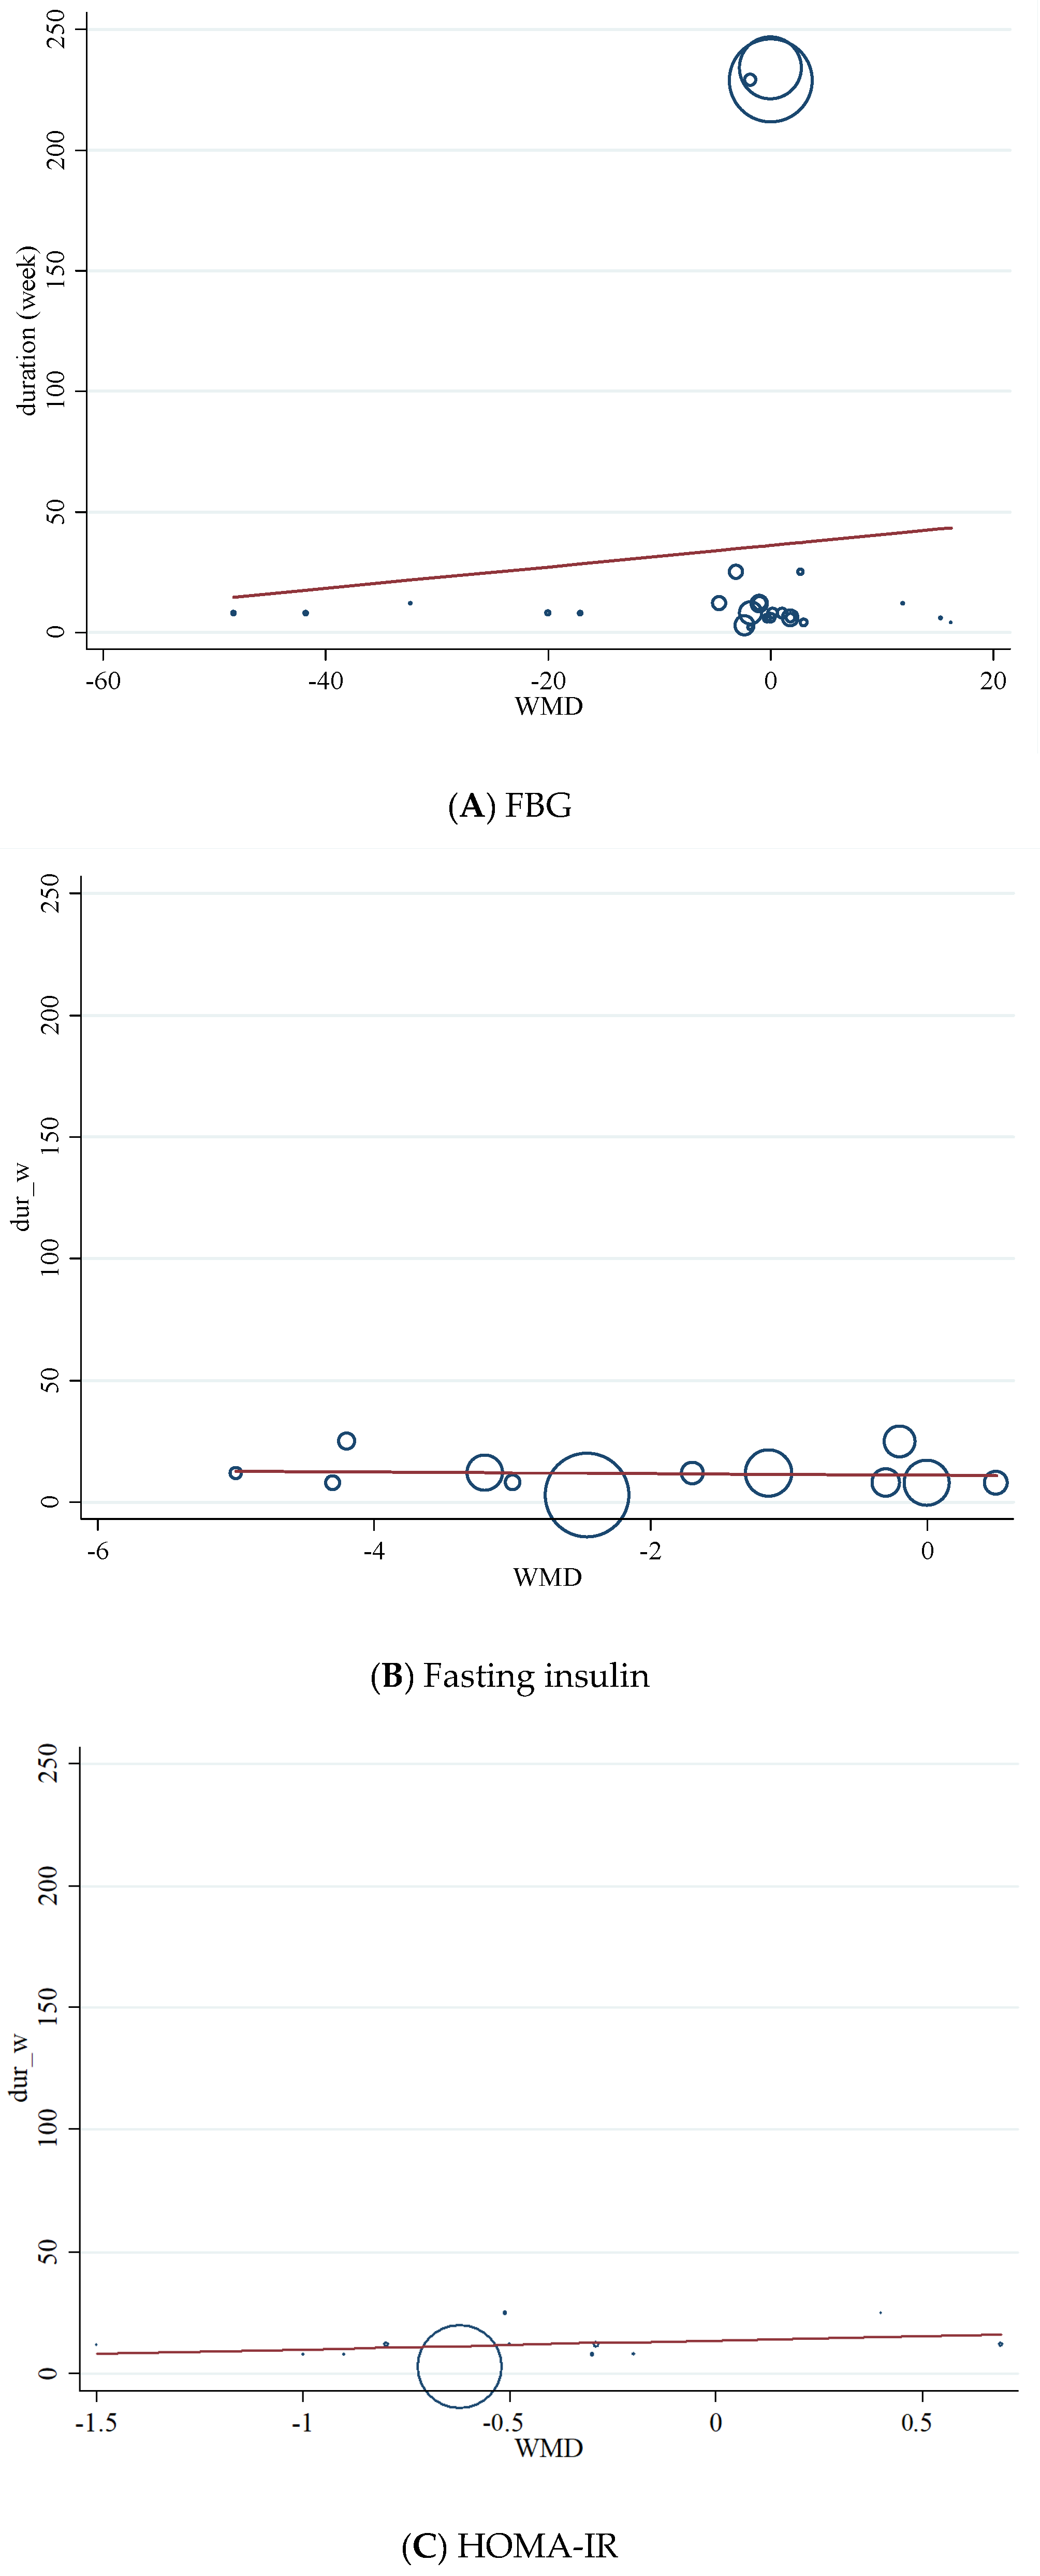
3.10. Non-Linear Dose-Response between Dose and Duration of Folic Acid Supplementation and Glycemic Control
3.11. Meta-Regression Analysis
4. Discussion
Author Contributions
Funding
Data Availability Statement
Conflicts of Interest
References
- Anioke, I.C.; Ezedigboh, A.N.; Dozie-Nwakile, O.C.; Chukwu, I.J.; Kalu, P.N. Predictors of poor glycemic control in adult with type 2 diabetes in South-Eastern Nigeria. Afr. Health Sci. 2019, 19, 2819–2828. [Google Scholar] [CrossRef]
- Razmpoosh, E.; Javadi, A.; Ejtahed, H.S.; Mirmiran, P.; Javadi, M.; Yousefinejad, A. The effect of probiotic supplementation on glycemic control and lipid profile in patients with type 2 diabetes: A randomized placebo controlled trial. Diabetes Metab. Syndr. Clin. Res. Rev. 2019, 13, 175–182. [Google Scholar] [CrossRef]
- Jalali, M.T.; Mohammadtaghvaei, N.; Larky, D.A.J.B. Investigating the effects of Capparis spinosa on hepatic gluconeogenesis and lipid content in streptozotocin-induced diabetic rats. Biomed. Pharmacother. 2016, 84, 1243–1248. [Google Scholar] [CrossRef] [PubMed]
- Afrisham, R.; Paknejad, M.; Soliemanifar, O.; Sadegh-Nejadi, S.; Meshkani, R.; Ashtary-Larky, D. The influence of psychological stress on the initiation and progression of diabetes and cancer. Int. J. Endocrinol. Metab. 2019, 17, e67400. [Google Scholar] [CrossRef] [Green Version]
- Kooti, W.; Farokhipour, M.; Asadzadeh, Z.; Ashtary-Larky, D.; Asadi-Samani, M.J. The role of medicinal plants in the treatment of diabetes: A systematic review. Electron. Physician 2016, 8, 1832. [Google Scholar] [CrossRef] [Green Version]
- Abdi, A.; Mehrabani, J.; Nordvall, M.; Wong, A.; Fallah, A.; Bagheri, R. Effects of concurrent training on irisin and fibronectin type-III domain containing 5 (FNDC5) expression in visceral adipose tissue in type-2 diabetic rats. Arch. Physiol. Biochem. 2020, 1–6. [Google Scholar] [CrossRef]
- Asbaghi, O.; Ashtary-Larky, D.; Bagheri, R.; Nazarian, B.; Pourmirzaei Olyaei, H.; Rezaei Kelishadi, M.; Nordvall, M.; Wong, A.; Dutheil, F.; Amirmansour Alavi, N. Beneficial effects of folic acid supplementation on lipid markers in adults: A GRADE-assessed systematic review and dose-response meta-analysis of data from 21,787 participants in 34 randomized controlled trials. Crit. Rev. Food Sci. Nutr. 2021, 1–19. [Google Scholar] [CrossRef]
- Asbaghi, O.; Fatemeh, N.; Mahnaz, R.K.; Ehsan, G.; Elham, E.; Behzad, N.; Damoon, N.L.; Amirmansour, A.N. Effects of chromium supplementation on glycemic control in patients with type 2 diabetes: A systematic review and meta-analysis of randomized controlled trials. Pharmacol. Res. 2020, 161, 105098. [Google Scholar] [CrossRef]
- Asbaghi, O.; Naeini, F.; Ashtary-Larky, D.; Moradi, S.; Zakeri, N.; Eslampour, E.; Kelishadim, M.R.; Naeini, A.A. Effects of chromium supplementation on lipid profile in patients with type 2 diabetes: A systematic review and dose-response meta-analysis of randomized controlled trials. J. Trace Elem. Med. Biol. 2021, 66, 126741. [Google Scholar] [CrossRef]
- Asbaghi, O.; Ghanavati, M.; Ashtary-Larky, D.; Bagheri, R.; Rezaei Kelishadi, M.; Nazarian, B.; Nordvall, M.; Wong, A.; Dutheil, F.; Suzuki, K.; et al. Effects of folic acid supplementation on oxidative stress markers: A systematic review and meta-analysis of randomized controlled trials. Antioxidants 2021, 10, 871. [Google Scholar] [CrossRef]
- Welch, A.D. Folic acid: Discovery and the exciting first decade. Perspect. Biol. Med. 1983, 27, 64–75. [Google Scholar] [CrossRef] [PubMed]
- Liew, S.-C. Folic acid and diseases-supplement it or not? Rev. Assoc. Médica Bras. 2016, 62, 90–100. [Google Scholar] [CrossRef] [Green Version]
- Chen, H.; Liu, S.; Ji, L.; Wu, T.; Ji, Y.; Zhou, Y.; Zheng, M.; Zhang, M.; Xu, W.; Huang, G. Folic acid supplementation mitigates Alzheimer’s disease by reducing inflammation: A randomized controlled trial. Mediat. Inflamm. 2016, 2016, 5912146. [Google Scholar] [CrossRef] [Green Version]
- Bahmani, F.; Karamali, M.; Shakeri, H.; Asemi, Z. The effects of folate supplementation on inflammatory factors and biomarkers of oxidative stress in overweight and obese women with polycystic ovary syndrome: A randomized, double-blind, placebo-controlled clinical trial. Clin. Endocrinol. 2014, 81, 582–587. [Google Scholar] [CrossRef] [PubMed]
- Gargari, B.P.; Aghamohammadi, V.; Aliasgharzadeh, A. Effect of folic acid supplementation on biochemical indices in overweight and obese men with type 2 diabetes. Diabetes Res. Clin. Pract. 2011, 94, 33–38. [Google Scholar] [CrossRef]
- Setola, E.; Monti, L.D.; Galluccio, E.; Palloshi, A.; Fragasso, G.; Paroni, R.; Magni, F.; Sandoli, E.P.; Lucotti, P.; Costa, S. Insulin resistance and endothelial function are improved after folate and vitamin B12 therapy in patients with metabolic syndrome: Relationship between homocysteine levels and hyperinsulinemia. Eur. J. Endocrinol. 2004, 151, 483–490. [Google Scholar] [CrossRef]
- Cagnacci, A.; Cannoletta, M.; Xholli, A.; Piacenti, I.; Palma, F.; Palmieri, B. Folate administration decreases oxidative status and blood pressure in postmenopausal women. Eur. J. Nutr. 2015, 54, 429–435. [Google Scholar] [CrossRef]
- Kurt, R.; Yilmaz, Y.; Ermis, F.; Besisik, S.K.; Polat, N.; Elitok, A.; Oflaz, H.; Karan, M.A. Folic acid and vitamin B12 supplementation improves coronary flow reserve in elderly subjects with vitamin B12 deficiency. Arch. Med. Res. 2010, 41, 369–372. [Google Scholar] [CrossRef]
- Chmurzynska, A.; Malinowska, A.M.; Twardowska-Rajewska, J.; Gawecki, J. Elderly women: Homocysteine reduction by short-term folic acid supplementation resulting in increased glucose concentrations and affecting lipid metabolism (C677T MTHFR polymorphism). Nutrition 2013, 29, 841–844. [Google Scholar] [CrossRef] [PubMed]
- Mangoni, A.A.; Sherwood, R.A.; Asonganyi, B.; Swift, C.G.; Thomas, S.; Jackson, S.H.D. Short-term oral folic acid supplementation enhances endothelial function in patients with type 2 diabetes. Am. J. Hypertens. 2005, 18, 220–226. [Google Scholar] [CrossRef] [PubMed]
- Moens, A.L.; Claeys, M.J.; Wuyts, F.L.; Goovaerts, I.; Van Hertbruggen, E.; Wendelen, L.C.; Van Hoof, V.O.; Vrints, C.J. Effect of folic acid on endothelial function following acute myocardial infarction. Am. J. Cardiol. 2007, 99, 476–481. [Google Scholar] [CrossRef]
- Aarsand, A.; Carlsen, S.J. Folate administration reduces circulating homocysteine levels in NIDDM patients on long-term metformin treatment. J. Intern. Med. 1998, 244, 169–174. [Google Scholar] [CrossRef]
- Akbari, M.; Tabrizi, R.; Lankarani, K.B.; Heydari, S.T.; Karamali, M.; Kashanian, M.; Keneshlou, F.; Niknam, K.; Kolahdooz, F.; Asemi, Z.J.H.; et al. The effects of folate supplementation on diabetes biomarkers among patients with metabolic diseases: A systematic review and meta-analysis of randomized controlled trials. Horm. Metab. Res. 2018, 50, 93–105. [Google Scholar] [CrossRef] [PubMed]
- Lind, M.V.; Lauritzen, L.; Kristensen, M.; Ross, A.B.; Eriksen, J.N. Effect of folate supplementation on insulin sensitivity and type 2 diabetes: A meta-analysis of randomized controlled trials. Am. J. Clin. Nutr. 2019, 109, 29–42. [Google Scholar] [CrossRef]
- Zhao, J.V.; Schooling, C.M.; Zhao, J.X. The effects of folate supplementation on glucose metabolism and risk of type 2 diabetes: A systematic review and meta-analysis of randomized controlled trials. Ann. Epidemiol. 2018, 28, 249–257. [Google Scholar] [CrossRef] [PubMed]
- Moher, D.; Liberati, A.; Tetzlaff, J.; Altman, D.G.; Group, P. Preferred reporting items for systematic reviews and meta-analyses: The PRISMA statement. PLoS Med. 2009, 6, e1000097. [Google Scholar] [CrossRef] [PubMed] [Green Version]
- Higgins, J.P.; Altman, D.G.; Gøtzsche, P.C.; Jüni, P.; Moher, D.; Oxman, A.D.; Savović, J.; Schulz, K.F.; Weeks, L.; Sterne, J.A. The Cochrane Collaboration’s tool for assessing risk of bias in randomised trials. BMJ 2011, 343, d5928. [Google Scholar] [CrossRef] [PubMed] [Green Version]
- Asbaghi, O.; Sadeghian, M.; Nasiri, M.; Khodadost, M.; Shokri, A.; Panahande, B.; Pirouzi, A.; Sadeghi, O. The effects of green coffee extract supplementation on glycemic indices and lipid profile in adults: A systematic review and dose-response meta-analysis of clinical trials. Nutr. J. 2020, 19, 1–21. [Google Scholar] [CrossRef]
- Higgins, J.P.; Thompson, S.G.; Deeks, J.J.; Altman, D.G. Measuring inconsistency in meta-analyses. BMJ 2003, 327, 557–560. [Google Scholar] [CrossRef] [Green Version]
- Tobias, A. Assessing the influence of a single study in the meta-analysis estimate. Stata Tech. Bull. 1999, 47, 15–17. [Google Scholar]
- Gordon, H.; Oxman, A.; Vist, G.; Kunz, R.; Falck-Ytter, Y.; Alonso-Coello, P.; Schünemann, H. Rating quality of evidence and strength of recommendations: GRADE: An emerging consensus on rating quality of evidence and strength of recommendations. BMJ 2008, 336, 924–926. [Google Scholar]
- Doshi, S.N.; McDowell, I.F.; Moat, S.J.; Lang, D.; Newcombe, R.G.; Kredan, M.B.; Lewis, M.J.; Goodfellow, J.J.A. Folate improves endothelial function in coronary artery disease: An effect mediated by reduction of intracellular superoxide? Arterioscler. Thromb. Vasc. Biol. 2001, 21, 1196–1202. [Google Scholar] [CrossRef] [PubMed] [Green Version]
- Doshi, S.N.; McDowell, I.F.; Moat, S.J.; Payne, N.; Durrant, H.J.; Lewis, M.J.; Goodfellow, J.J.C. Folic acid improves endothelial function in coronary artery disease via mechanisms largely independent of homocysteine lowering. Circulation 2002, 105, 22–26. [Google Scholar] [CrossRef] [PubMed] [Green Version]
- Kilicdag, E.B.; Bagis, T.; Tarim, E.; Aslan, E.; Erkanli, S.; Simsek, E.; Haydardedeoglu, B.; Kuscu, E.J.H.R. Administration of B-group vitamins reduces circulating homocysteine in polycystic ovarian syndrome patients treated with metformin: A randomized trial. Hum. Reprod. 2005, 20, 1521–1528. [Google Scholar] [CrossRef] [Green Version]
- Sheu, W.H.-H.; Chin, H.-M.L.; Lee, W.-J.; Wan, C.-J.; Su, H.-Y.; Lang, H.-F. Prospective evaluation of folic acid supplementation on plasma homocysteine concentrations during weight reduction: A randomized, double-blinded, placebo-controlled study in obese women. Life Sci. 2005, 76, 2137–2145. [Google Scholar] [CrossRef]
- Villa, P.; Perri, C.; Suriano, R.; Cucinelli, F.; Panunzi, S.; Ranieri, M.; Mele, C.; Lanzone, A. L-folic acid supplementation in healthy postmenopausal women: Effect on homocysteine and glycolipid metabolism. J. Clin. Endocrinol. Metab. 2005, 90, 4622–4629. [Google Scholar] [CrossRef] [PubMed]
- Moat, S.J.; Madhavan, A.; Taylor, S.Y.; Payne, N.; Allen, R.; Stabler, S.P.; Goodfellow, J.; McDowell, I.; Lewis, M.J.; Lang, D.J. High-but not low-dose folic acid improves endothelial function in coronary artery disease. Eur. J. Clin. Investig. 2006, 36, 850–859. [Google Scholar] [CrossRef]
- Solini, A.; Santini, E.; Ferrannini, E.J. Effect of short-term folic acid supplementation on insulin sensitivity and inflammatory markers in overweight subjects. Int. J. Obes. 2006, 30, 1197–1202. [Google Scholar] [CrossRef] [PubMed] [Green Version]
- Title, L.M.; Ur, E.; Giddens, K.; McQueen, M.J.; Nassar, B.A.J.V.M. Folic acid improves endothelial dysfunction in type 2 diabetes-an effect independent of homocysteine-lowering. Vasc. Med. 2006, 11, 101–109. [Google Scholar] [CrossRef]
- Mao, G.; Hong, X.; Xing, H.; Liu, P.; Liu, H.; Yu, Y.; Zhang, S.; Jiang, S.; Wang, X.; Xu, X.J.N. Efficacy of folic acid and enalapril combined therapy on reduction of blood pressure and plasma glucose: A multicenter, randomized, double-blind, parallel-controlled, clinical trial. Nutrition 2008, 24, 1088–1096. [Google Scholar] [CrossRef]
- Palomba, S.; Falbo, A.; Giallauria, F.; Russo, T.; Tolino, A.; Zullo, F.; Colao, A.; Orio, F.J.D. Effects of metformin with or without supplementation with folate on homocysteine levels and vascular endothelium of women with polycystic ovary syndrome. Diabetes Care 2010, 33, 246–251. [Google Scholar] [CrossRef] [Green Version]
- Aghamohammadi Khiavi, V.; Pourghassem Gargari, B.; Aliasgharzadeh, A. Effect of Folic Acid Supplementation on Indices of Glycemic Control, Insulin Resistance and Lipid Profile in Patients with Type 2 Diabetes Mellitus. IJEM 2011, 13, 354–360. [Google Scholar]
- Grigoletti, S.S.; Guindani, G.; Moraes, R.S.; Ribeiro, J.P.; Sprinz, E.J.N. Short-term folinic acid supplementation improves vascular reactivity in HIV-infected individuals: A randomized trial. Nutrition 2013, 29, 886–891. [Google Scholar] [CrossRef] [PubMed]
- Asemi, Z.; Karamali, M.; Esmaillzadeh, A. Metabolic response to folate supplementation in overweight women with polycystic ovary syndrome: A randomized double-blind placebo-controlled clinical trial. Mol. Nutr. Food Res. 2014, 58, 1465–1473. [Google Scholar] [CrossRef] [PubMed]
- Asemi, Z.; Vahedpoor, Z.; Jamilian, M.; Bahmani, F.; Esmaillzadeh, A. Effects of long-term folate supplementation on metabolic status and regression of cervical intraepithelial neoplasia: A randomized, double-blind, placebo-controlled trial. Nutrition 2016, 32, 681–686. [Google Scholar] [CrossRef]
- Hashemi, M.; Heshmat-Ghahdarijani, K.; Zarean, E.; Baktash, F.; Mortazavi, Z.S. Evaluation of the effect of high-dose folic acid on endothelial dysfunction in pre-eclamptic patients: A randomized clinical trial. J. Res. Med. Sci. 2016, 21, 114. [Google Scholar] [PubMed]
- Qin, X.; Li, J.; Zhang, Y.; Chen, D.; Wang, B.; He, M.; Fu, J.; Tang, G.; Cai, Y.; Shi, X. Effect of folic acid supplementation on risk of new-onset diabetes in adults with hypertension in China: Findings from the China Stroke Primary Prevention Trial (CSPPT). J. Diabetes 2016, 8, 286–294. [Google Scholar] [CrossRef] [PubMed]
- Talari, H.R.; Rafiee, M.; Farrokhian, A.; Raygan, F.; Bahmani, F.; Mofrad, M.D.; Hamidian, Y.; Tamtaji, O.R.; Karamali, F.; Asemi, Z. The Effects of Folate Supplementation on Carotid Intima-Media Thickness and Metabolic Status in Patients with Metabolic Syndrome. Ann. Nutr. Metab. 2016, 69, 41–50. [Google Scholar] [CrossRef]
- Li, Y.; Liang, M.; Wang, G.; Wang, B.; He, M.; Tang, G.; Yin, D.; Xu, X.; Huo, Y.; Cui, Y. Effects of folic acid therapy on the new-onset proteinuria in Chinese hypertensive patients: A post hoc analysis of the renal substudy of CSPPT (China Stroke Primary Prevention Trial). Hypertension 2017, 70, 300–306. [Google Scholar] [CrossRef] [Green Version]
- Bahmani, F.; Galougahi, F.R.; Vahedpoor, Z.; Jamilian, M.; Mahmoodi, S.; Baghban, R.; Bagherian, T.; Mehrizi, M.Z.; Asemi, Z. The effects of folic acid supplementation on recurrence and metabolic status in endometrial hyperplasia: A randomized, double-blind, placebo-controlled trial. Arch. Iran. Med. 2018, 21, 452–459. [Google Scholar]
- Li, Z.; Gueant-Rodriguez, R.-M.; Quilliot, D.; Sirveaux, M.-A.; Meyre, D.; Gueant, J.-L.; Brunaud, L. Folate and vitamin B12 status is associated with insulin resistance and metabolic syndrome in morbid obesity. Clin. Nutr. 2018, 37, 1700–1706. [Google Scholar] [CrossRef] [PubMed]
- Li, J.; Goh, C.E.; Demmer, R.T.; Whitcomb, B.W.; Du, P.; Liu, Z. Association between serum folate and insulin resistance among US nondiabetic adults. Sci. Rep. 2017, 7, 1–7. [Google Scholar]
- Kahleová, R.; Palyzová, D.; Zvára, K.; Zvárová, J.; Hrach, K.; Nováková, I.; Hyánek, J.; Bendlová, B.; Kožich, V. Essential hypertension in adolescents: Association with insulin resistance and with metabolism of homocysteine and vitamins. Am. J. Hypertens. 2002, 15, 857–864. [Google Scholar] [CrossRef] [Green Version]
- Robinson, K.; Arheart, K.; Refsum, H.; Brattström, L.; Boers, G.; Ueland, P.; Rubba, P.; Palma-Reis, R.; Meleady, R.; Daly, L.J.C. Low circulating folate and vitamin B6 concentrations: Risk factors for stroke, peripheral vascular disease, and coronary artery disease. Circulation 1998, 97, 437–443. [Google Scholar] [CrossRef] [PubMed] [Green Version]
- Winkels, R.M.; Brouwer, I.A.; Verhoef, P.; Van Oort, F.V.; Durga, J.; Katan, M. Gender and body size affect the response of erythrocyte folate to folic acid treatment. J. Nutr. 2008, 138, 1456–1461. [Google Scholar] [CrossRef] [PubMed] [Green Version]
- Cafolla, A.; Dragoni, F.; Girelli, G.; Tosti, M.E.; Costante, A.; Pastorelli, D.; Bedogni, G.; Scott, S.J.H. Folate status in Italian blood donors: Relation to gender and smoking. Haematologica 2000, 85, 694–698. [Google Scholar]
- Bauer, T.; Göhlmann, S.; Sinning, M.J.H.E. Gender differences in smoking behavior. Health Econ. 2007, 16, 895–909. [Google Scholar] [CrossRef] [PubMed] [Green Version]
- Wilsnack, R.W.; Wilsnack, S.C.; Kristjanson, A.F.; Vogeltanz-Holm, N.D.; Gmel, G.J.A. Gender and alcohol consumption: Patterns from the multinational GENACIS project. Addiction 2009, 104, 1487–1500. [Google Scholar] [CrossRef]
- Ericson, U.; Borgquist, S.; Ivarsson, M.I.; Sonestedt, E.; Gullberg, B.; Carlson, J.; Olsson, H.; Jirström, K.; Wirfält, E. Plasma folate concentrations are positively associated with risk of estrogen receptor β negative breast cancer in a Swedish nested case control study. J. Nutr. 2010, 140, 1661–1668. [Google Scholar] [CrossRef]
- Sütterlin, M.W.; Bussen, S.S.; Rieger, L.; Dietl, J.; Steck, T. Serum folate and Vitamin B12 levels in women using modern oral contraceptives (OC) containing 20 μg ethinyl estradiol. Eur. J. Obstet. Gynecol. Reprod. Biol. 2003, 107, 57–61. [Google Scholar] [CrossRef]
- Geer, E.B.; Shen, W. Gender differences in insulin resistance, body composition, and energy balance. Gend. Med. 2009, 6, 60–75. [Google Scholar] [CrossRef] [PubMed] [Green Version]
- Cohen, R.M.; Franco, R.S.; Khera, P.K.; Smith, E.P.; Lindsell, C.J.; Ciraolo, P.J.; Palascak, M.B.; Joiner, C. Red cell life span heterogeneity in hematologically normal people is sufficient to alter HbA1c. J. Am. Soc. Hematol. 2008, 112, 4284–4291. [Google Scholar] [CrossRef] [PubMed] [Green Version]
- Beltran del Rio, M.; Tiwari, M.; Amodu, L.I.; Cagliani, J.; Rodriguez Rilo, H.L.R. Glycated hemoglobin, plasma glucose, and erythrocyte aging. J. Diabetes Sci. Technol. 2016, 10, 1303–1307. [Google Scholar] [CrossRef] [Green Version]
- Franco, R.S. Measurement of red cell lifespan and aging. Transfus. Med. Hemotherapy 2012, 39, 302–307. [Google Scholar] [CrossRef] [PubMed] [Green Version]
- Rogers, L.M.; Cordero, A.M.; Pfeiffer, C.M.; Hausman, D.B.; Tsang, B.L.; De-Regil, L.M.; Rosenthal, J.; Razzaghi, H.; Wong, E.C.; Weakland, A. Global folate status in women of reproductive age: A systematic review with emphasis on methodological issues. Ann. N. Y. Acad. Sci. 2018, 1431, 35. [Google Scholar] [CrossRef]
- Eshak, E.S.; Iso, H.; Muraki, I.; Tamakoshi, A. Among the water-soluble vitamins, dietary intakes of vitamins C, B-2 and folate are associated with the reduced risk of diabetes in Japanese women but not men. Br. J. Nutr. 2019, 121, 1357–1364. [Google Scholar] [CrossRef]
- World Health Organization. Serum and Red Blood Cell Folate Concentrations for Assessing Folate Status in Populations; World Health Organization: Geneva, Switzerland, 2015. [Google Scholar]
- Meyers, L.D.; Hellwig, J.P.; Otten, J.J. Dietary Reference Intakes: The Essential Guide to Nutrient Requirements; National Academies Press: Washington, DC, USA, 2006. [Google Scholar]
- Babel, R.A.; Dandekar, M. A Review on Cellular and Molecular Mechanisms Linked to the Development of Diabetes Complications. Curr. Diabetes Rev. 2020, 17, 457–473. [Google Scholar] [CrossRef] [PubMed]
- Rains, J.L.; Jain, S.K. Oxidative stress, insulin signaling, and diabetes. Free. Radic. Biol. Med. 2011, 50, 567–575. [Google Scholar] [CrossRef] [Green Version]
- Joshi, R.; Adhikari, S.; Patro, B.; Chattopadhyay, S.; Mukherjee, T.J. Free radical scavenging behavior of folic acid: Evidence for possible antioxidant activity. Free. Radic. Biol. Med. 2001, 30, 1390–1399. [Google Scholar] [CrossRef]
- Cianciulli, A.; Salvatore, R.; Porro, C.; Trotta, T.; Panaro, M. Folic acid is able to polarize the inflammatory response in LPS activated microglia by regulating multiple signaling pathways. Mediat. Inflamm. 2016, 2016, 1–10. [Google Scholar] [CrossRef] [Green Version]
- Jiang, M.; Fan, J.; Qu, X.; Li, S.; Nilsson, S.K.; Sun, Y.B.Y.; Chen, Y.; Yu, D.; Liu, D.; Liu, B.-C. Combined blockade of Smad3 and JNK pathways ameliorates progressive fibrosis in folic acid nephropathy. Front. Pharmacol. 2019, 10, 880. [Google Scholar] [CrossRef] [Green Version]
- Samblas, M.; Martínez, J.A.; Milagro, F. Folic acid improves the inflammatory response in LPS-activated THP-1 macrophages. Mediat. Inflamm. 2018, 2018, 1–8. [Google Scholar] [CrossRef] [Green Version]
- Shah, A.; Mehta, N.; Reilly, M. Adipose inflammation, insulin resistance, and cardiovascular disease. J. Parenter. Enter. Nutr. 2008, 32, 638–644. [Google Scholar] [CrossRef] [PubMed] [Green Version]
- Ferroni, P.; Basili, S.; Falco, A.; Davì, G. Inflammation, insulin resistance, and obesity. Curr. Atheroscler. Rep. 2004, 6, 424–431. [Google Scholar] [CrossRef] [PubMed]
- Bagherieh, M.; Kheirollahi, A.; Zamani-Garmsiri, F.; Emamgholipour, S.; Meshkani, R. Folic acid ameliorates palmitate-induced inflammation through decreasing homocysteine and inhibiting NF-κB pathway in HepG2 cells. Arch. Physiol. Biochem. 2021, 1–8. [Google Scholar] [CrossRef] [PubMed]
- Kumar, D.; Singla, S.K.; Puri, V.; Puri, S. The restrained expression of NF-kB in renal tissue ameliorates folic acid induced acute kidney injury in mice. PLoS ONE 2015, 10, e115947. [Google Scholar]
- Mursleen, M.T.; Riaz, S. Implication of homocysteine in diabetes and impact of folate and vitamin B12 in diabetic population. Diabetes Metab. Syndr. Clin. Res. Rev. 2017, 11, S141–S146. [Google Scholar] [CrossRef]
- Cho, N.H.; Lim, S.; Jang, H.C.; Park, H.K.; Metzger, B. Elevated homocysteine as a risk factor for the development of diabetes in women with a previous history of gestational diabetes mellitus: A 4-year prospective study. Diabetes Care 2005, 28, 2750–2755. [Google Scholar] [CrossRef] [Green Version]
- Mutavdzin, S.S.; Djuric, D.M. Homocysteine and Related B Vitamins in Pre-diabetes and Diabetes Mellitus. In Biochemistry of Cardiovascular Dysfunction in Obesity; Springer: Berlin/Heidelberg, Germany, 2020; pp. 329–351. [Google Scholar]


| Studies | Country | Study Design | Participant | Sample Size and Sex | Sample Size | Trial Duration (Week) | Means Age | Means BMI | Intervention | ||||
|---|---|---|---|---|---|---|---|---|---|---|---|---|---|
| IG | CG | IG | CG | IG | CG | Folic Acid Dose (mg/d) | Control Group | ||||||
| Aarsand et al., 1998 | Norway | RA/DB/PC (parallel) | type 2 diabetes | 28: 21M, 7F | 14 | 14 | 12 | 56.7 ± 10.47 | 61.6 ± 9.35 | 29.2 ± 5.23 | 28.3 ± 4.11 | 0.25 | PC |
| Doshi et al., 2001 | United Kingdom | RA/PC (parallel) | Coronary artery disease | 50: 44M, 6F | 50 | 50 | 6 | 57 ± 8 | 57 ± 8 | 28.5 ± 4.4 | 28.5 ± 4.4 | 5 | PC |
| Doshi et al., 2002 | United Kingdom | RA/PC (crossover) | Coronary artery disease | 33: 30M 3F | 16 | 17 | 6 | 55 ± 7 | 56 ± 7 | NR | NR | 5 | PC |
| Kilicdag et al., 2005 | Turkey | RA (parallel) | Polycystic ovarian syndrome patients | 31: 31F | 17 | 14 | 12 | 24.94 ± 6.67 | 24.14 ± 6.92 | 28.58 ± 5.43 | 26.02 ± 5.98 | 0.348 | No intervention |
| Mangoni et al., 2005 | Australia | RA/DB/PC (parallel) | Type 2 diabetes | 26: 14M,12F | 13 | 13 | 4 | 55.3 ± 4.32 | 57.6 ± 4.68 | 30.5 ± 3.96 | 32.3 ± 4.68 | 5 | PC |
| Sheu et al., 2005 | Taiwan | RA/DB/PC (parallel) | Obese women | 74: 74F | 36 | 38 | 12 | 43 ± 12 | 40 ± 12.32 | 29.6 ± 3.6 | 29.3 ± 4.93 | 5 | PC |
| Villa et al., 2005 | Italy | RA/PC (parallel) | Postmenopausal | 20: 20F | 10 | 10 | 8 | 55.4 ± 6.95 | 53.1 ± 7.27 | 29.7 ± 4.74 | 26.91 ± 5.88 | 7.5 | PC |
| Moat et al., 2006 (A) | USA | RA/DB/PC (parallel) | Coronary artery disease | 59: 52M, 7F | 30 | 15 | 6 | 61 ± 7 | 61 ± 7 | 28.5 ± 4.4 | 29.6 ± 4.1 | 0.4 | PC |
| Moat et al., 2006 (B) | USA | RA/DB/PC (parallel) | Coronary artery disease | 54: 46M, 8F | 25 | 14 | 6 | 60 ± 7 | 61 ± 7 | 29.9 ± 4.4 | 29.6 ± 4.1 | 5 | PC |
| Solini et al., 2006 | Italy | RA/PC (parallel) | Overweight subjects | 60: 19M, 41F | 30 | 30 | 12 | 50 ± 7 | 49 ± 8 | 27.5 ± 0.6 | 27.4 ± 0.6 | 2.5 | PC |
| Title et al., 2006 | Canada | RA/DB/PC (crossover) | Type 2 diabetes | 19: 9M,10F | 19 | 19 | 2 | 54.5 ± 5.9 | 54.5 ± 5.9 | NR | NR | 10 | PC |
| Moens et al., 2007 | Belgium | RA/DB/PC (crossover) | Acute myocardial infarction | 40: 35M, 5F | 20 | 20 | 6 | 57 ± 11 | 56 ± 14 | NR | NR | 10 | PC |
| Mao et al., 2008 (A) | China | RA/DB (parallel) | Mild to moderate primary hypertension | 295: 120M, 175F | 146 | 75 | 8 | 57.4 ± 10 | 57.3 ± 10 | 25.5 ± 3.3 | 25.7 ± 3.2 | 0.4 | No intervention |
| Mao et al., 2008 (B) | China | RA/DB (parallel) | Mild to moderate primary hypertension | 297: 126M, 171F | 148 | 74 | 8 | 56.6 ± 9.6 | 57.3 ± 10 | 25.8 ± 3.6 | 25.7 ± 3.2 | 0.8 | No intervention |
| Palomba et al., 2010 | Italy | DB/PC (parallel) | Polycystic ovary syndrome | 47: 47F | 23 | 24 | 25 | 26.9 ± 3.1 | 26.4 ± 2.8 | 27.9 ± 2.6 | 28.1 ± 3.1 | 0.4 | PC |
| Aghamohammadi khiavi et al., 2011 | Iran | RA/DB/PC (parallel) | Type 2 diabetes mellitus | 68: 68M | 34 | 34 | 8 | 58.7 ± 7.2 | 55.6 ± 9.3 | 27.4 ± 3.2 | 27.8 ± 4 | 5 | PC |
| Gargari et al., 2011 | Iran | RA/DB/PC (parallel) | Overweight and obese men with type 2 diabetes | 48: 48M | 24 | 24 | 8 | 59.4 ± 7.6 | 57 ± 10.1 | 28.8 ± 2.7 | 28.5 ± 3.3 | 5 | PC |
| Grigoletti et al., 2013 | Brazil | RA/DB/PC (parallel) | HIV-infected individuals | 30: 14M, 16F | 15 | 15 | 4 | 45 ± 7.74 | 45 ± 7.74 | 23.9 ± 4.96 | 23.9 ± 3.11 | 5 | PC |
| Asemi et al., 2014 (A) | Iran | RA/DB/PC (parallel) | Overweight women with polycystic ovary syndrome | 81: 81F | 27 | 14 | 8 | 24.3 ± 5.0 | 24.7 ± 5.0 | 27.2 ± 5.0 | 27.9 ± 4.7 | 1 | PC |
| Asemi et al., 2014 (B) | Iran | RA/DB/PC (parallel) | Overweight women with polycystic ovary syndrome | 81: 81F | 27 | 13 | 8 | 25.1 ± 4.5 | 24.7 ± 5.0 | 29.3 ± 4.6 | 27.9 ± 4.7 | 5 | PC |
| Cagnacci et al., 2009 | Italy | RA/DB/PC (parallel) | Postmenopausal | 30: 30F | 15 | 15 | 3 | 55.8 ± 4.26 | 54.5 ± 4.64 | 26.3 ± 5.03 | 27.5 ± 5.03 | 15 | PC |
| Asemi et al., 2016 | Iran | RA/DB/PC (parallel) | Cervical intraepithelial neoplasia grade 1 | 58: 58F | 29 | 29 | 25 | 36.8 ± 8.8 | 39.1 ± 9.1 | 28.2 ± 3.5 | 29.8 ± 6.4 | 5 | PC |
| Hashemi et al., 2016 | Iran | RA/TB/PC (parallel) | Pre-eclamptic patients | 85: 85F | 43 | 42 | 8 | 30.82 ± 4.08 | 31.2 ± 4.3 | 25.19 ± 2.53 | 24.63 ± 2.64 | 5 | PC |
| Qin et al., 2016 | China | RA/DB (parallel) | Hypertension | 20,030: 8295M, 11,735F | 10,014 | 10,016 | 234 | 59.9 ± 7.6 | 60 ± 7.5 | 24.9 ± 3.7 | 24.9 ± 3.7 | 0.8 | No intervention |
| Talari et al., 2016 | Iran | RA/DB/PC (parallel) | Metabolic syndrome | 60: 26M, 34F | 30 | 30 | 12 | 62.1 ± 9.6 | 65.4 ± 11.5 | 29.8 ± 3.8 | 29.8 ± 4.4 | 5 | PC |
| Li et al., 2017 (A) | China | RA/DB (parallel) | Diabetics | 1636: 585M, 1051F | 800 | 836 | 229 | 60.1 ± 7.2 | 59.9 ± 7.3 | 26.3 ± 3.7 | 26.4 ± 3.5 | 0.8 | No intervention |
| Li et al., 2017 (B) | China | RA/DB (parallel) | Nondiabetics | 11,435: 4444M, 6991F | 5711 | 5724 | 229 | 59.4 ± 7.5 | 59.4 ± 7.6 | 25.5 ± 3.5 | 25.5 ± 3.5 | 0.8 | No intervention |
| Bahmani et al., 2018 | Iran | RA/DB/PC (parallel) | Endometrial hyperplasia | 60: 60F | 30 | 30 | 12 | 44.4 ± 6.5 | 44.7 ± 3.1 | 30.7 ± 4.6 | 30.5 ± 3.8 | 5 | PC |
| Studies | Random Sequence Generation | Allocation Concealment | Selective Reporting | Other Sources of Bias | Blinding (Participants and Personnel) | Blinding (Outcome Assessment) | Incomplete Outcome Data | Overall |
|---|---|---|---|---|---|---|---|---|
| Aarsand et al., 1998 | L | H | H | H | L | H | H | Fair |
| Doshi et al., 2001 | L | H | H | H | H | H | L | Fair |
| Doshi et al., 2002 | L | H | H | H | H | H | L | Fair |
| Kilicdag Doshi et al., 2005 | L | H | H | H | H | H | L | Fair |
| Mangoni et al., 2005 | L | H | H | H | L | H | H | Fair |
| Sheu et al., 2005 | L | H | H | H | L | H | L | Good |
| Villa et al., 2005 | L | H | H | H | H | H | L | Fair |
| Moat et al., 2006 | L | H | H | H | L | H | L | Good |
| Solini et al., 2006 | L | H | H | H | H | H | L | Fair |
| Title et al., 2006 | L | H | H | H | L | H | L | Good |
| Moens et al., 2007 | L | H | H | H | L | H | L | Good |
| Mao et al., 2008 | L | H | H | H | L | H | L | Good |
| Cagnacci et al., 2009 | L | H | H | H | L | H | L | Good |
| Palomba et al., 2010 | L | H | H | H | L | H | L | Good |
| Gargari et al., 2011 | L | H | L | H | L | H | L | Good |
| khiavi et al., 2011 | L | H | L | H | L | H | L | Good |
| Grigoletti et al., 2013 | L | H | H | H | L | H | L | Good |
| Asemi et al., 2014 | L | H | H | H | L | H | L | Good |
| Asemi et al., 2016 | L | H | H | H | L | H | L | Good |
| Hashemi et al., 2016 | L | L | H | H | L | L | L | Good |
| Qin et al., 2016 | L | H | H | H | L | H | L | Good |
| Talari et al., 2016 | L | H | H | H | L | H | L | Good |
| Bahmani et al., 2018 | L | H | H | H | L | H | L | Good |
| NO | Sample Size (Intervention/Control) | WMD (95%CI) | p-Value | Heterogeneity | ||||
|---|---|---|---|---|---|---|---|---|
| P Heterogeneity | I2 | P between Sub-Groups | Tau-Squared | |||||
| Subgroup analyses of folic acid supplementation on FBG | ||||||||
| Overall effect | 27 | 17,379/17,235 | −2.17 (−3.69, −0.65) | 0.005 | <0.001 | 81.5% | 7.4032 | |
| Baseline FBG (mg/dL) | ||||||||
| <100 | 16 | 6365/6182 | −2.14 (−4.36, −0.06) | 0.057 | <0.001 | 85.7% | 0.824 | 13.20 |
| ≥100 | 11 | 11,014/11,053 | −4.06 (−7.83, −0.29) | 0.043 | <0.001 | 71.9% | 17.26 | |
| Trial duration (week) | ||||||||
| <12 | 17 | 662/464 | −5.32 (−9.11, −1.53) | 0.006 | <0.001 | 86.5% | 0.026 | 41.15 |
| ≥12 | 10 | 16,717/16,771 | −0.79 (−1.81, 0.22) | 0.126 | 0.041 | 48.6% | 0.74 | |
| Intervention dose (mg/d) | ||||||||
| <5 | 10 | 16,943/16,822 | −1.40 (−3.23, 0.43) | 0.135 | <0.001 | 84.9% | 0.006 | 4.53 |
| ≥5 | 17 | 436/413 | −3.58 (−6.62, −0.54) | 0.021 | <0.001 | 78.3% | 21.89 | |
| Diabetes status | ||||||||
| non-T2DM | 20 | 10,764/10,571 | −2.34 (−4.46, −0.22) | 0.030 | <0.001 | 83.7% | 0.243 | 14.16 |
| T2DM | 7 | 6615/6664 | −4.87 (−10.15, 0.39) | 0.070 | 0.001 | 73.6% | 24.12 | |
| Sex | ||||||||
| Both sexes | 16 | 17,081/16,962 | 0.11 (−0.55, 0.77) | 0.905 | 0.653 | 0.0% | <0.001 | 0.00 |
| Female | 9 | 240/215 | −9.53 (−14.71, −4.35) | 0.001 | <0.001 | 90.8% | 39.33 | |
| Male | 2 | 58/58 | −18.81 (−26.87, −10.74) | <0.001 | 0.729 | 0.0% | 0.00 | |
| Overall analyses of folic acid supplementation on HbA1c | ||||||||
| Overall effect | 4 | 85/85 | −0.27 (−0.73, 0.18) | 0.246 | 0.007 | 74.9% | 0.16 | |
| Subgroup analyses of folic acid supplementation on fasting insulin | ||||||||
| Overall effect | 12 | 315/291 | −1.63 (−2.53, −0.73) | <0.001 | 0.001 | 65.8% | 1.3281 | |
| Trial duration (week) | ||||||||
| <12 | 6 | 137/110 | −1.28 (−2.73, 0.16) | 0.082 | 0.001 | 76.0% | 0.939 | 2.08 |
| ≥12 | 6 | 178/181 | −2.03 (−3.31, −0.75) | 0.002 | 0.045 | 55.8% | 1.27 | |
| Intervention dose (mg/d) | ||||||||
| <5 | 3 | 80/68 | −0.99 (−1.94, −0.04) | 0.040 | 0.365 | 0.9% | 0.082 | 0.00 |
| ≥5 | 9 | 235/223 | −1.86 (−3.00, −0.71) | 0.001 | 0.001 | 70.5% | 1.76 | |
| Diabetes status | ||||||||
| non-T2DM | 10 | 257/233 | −1.96 (−2.92, −1.00) | <0.001 | 0.002 | 65.3% | 0.015 | 1.22 |
| T2DM | 2 | 58/58 | 0.02 (−1.45, 1.51) | 0.972 | 0.604 | 0.0% | 0.00 | |
| Sex | ||||||||
| Both sexes | 2 | 60/60 | −2.37 (−5.89, 1.13) | 0.185 | 0.119 | 58.8% | 0.032 | 4.36 |
| Female | 8 | 197/173 | −2.01 (−3.144, −0.88) | <0.001 | 0.002 | 69.0% | 1.50 | |
| Male | 2 | 58/58 | 0.02 (−1.45, 1.51) | 0.972 | 0.604 | 0.0% | 0.00 | |
| Subgroup analyses of folic acid supplementation on HOMA-IR | ||||||||
| Overall effect | 12 | 322/295 | −0.40 (−0.70, −0.09) | 0.011 | <0.001 | 80.9% | 0.17 | |
| Trial duration (week) | ||||||||
| <12 | 5 | 127/100 | −0.62 (−0.64, −0.59) | <0.001 | 0.654 | 0.0% | <0.001 | 0.00 |
| ≥12 | 7 | 195/195 | −0.31 (−0.83, 0.19) | 0.224 | <0.001 | 83.7% | 0.35 | |
| Intervention dose (mg/d) | ||||||||
| <5 | 4 | 97/82 | 0.02 (−0.68, 0.73) | 0.949 | <0.001 | 84.0% | <0.001 | 0.38 |
| ≥5 | 8 | 225/213 | −0.62 (−0.64, −0.60) | <0.001 | 0.615 | 0.0% | 0.00 | |
| Diabetes status | ||||||||
| non-T2DM | 10 | 264/237 | −0.43 (−0.77, −0.08) | 0.016 | <0.001 | 83.9% | 0.192 | 0.19 |
| T2DM | 2 | 58/58 | −0.26 (−0.79, 0.27) | 0.339 | 0.857 | 0.0% | 0.00 | |
| Sex | ||||||||
| Both sexes | 2 | 58/58 | −0.75 (−1.91, 0.39) | 0.198 | 0.049 | 74.3% | 0.103 | 0.54 |
| Female | 8 | 204/177 | −0.38 (−0.82, 0.06) | 0.092 | <0.001 | 85.8% | 0.28 | |
| Male | 2 | 60/60 | −0.26 (−0.79, 0.27) | 0.339 | 0.857 | 0.0% | 0.00 | |
| Quality Assessment | Summary of Findings | Quality of Evidence | ||||||
|---|---|---|---|---|---|---|---|---|
| Outcomes | Risk of Bias | Inconsistency | Indirectness | Imprecision | Publication Bias | Number of Intervention/Control | WMD (95%CI) | |
| FBG | No serious limitations | Very serious limitations a | Serious limitations e | No serious limitations | Serious limitations g | 17,379/17,235 | −2.17 (−3.69, −0.65) | ⊕◯◯◯ Very low |
| HbA1c | No serious limitations | Serious limitations b | Serious limitations e | Serious limitations f | No serious limitations | 85/85 | −0.27 (−0.73, 0.18) | ⊕◯◯◯ Very low |
| Fasting insulin | No serious limitations | Serious limitations c | Serious limitations e | No serious limitations | No serious limitations | 315/291 | −1.63 (−2.53, −0.73) | ⊕⊕◯◯ Low |
| HOMA-IR | No serious limitations | Very serious limitations d | Serious limitations e | No serious limitations | No serious limitations | 322/295 | −0.40 (−0.70, −0.09) | ⊕⊕◯◯ Low |
Publisher’s Note: MDPI stays neutral with regard to jurisdictional claims in published maps and institutional affiliations. |
© 2021 by the authors. Licensee MDPI, Basel, Switzerland. This article is an open access article distributed under the terms and conditions of the Creative Commons Attribution (CC BY) license (https://creativecommons.org/licenses/by/4.0/).
Share and Cite
Asbaghi, O.; Ashtary-Larky, D.; Bagheri, R.; Moosavian, S.P.; Olyaei, H.P.; Nazarian, B.; Rezaei Kelishadi, M.; Wong, A.; Candow, D.G.; Dutheil, F.; et al. Folic Acid Supplementation Improves Glycemic Control for Diabetes Prevention and Management: A Systematic Review and Dose-Response Meta-Analysis of Randomized Controlled Trials. Nutrients 2021, 13, 2355. https://0-doi-org.brum.beds.ac.uk/10.3390/nu13072355
Asbaghi O, Ashtary-Larky D, Bagheri R, Moosavian SP, Olyaei HP, Nazarian B, Rezaei Kelishadi M, Wong A, Candow DG, Dutheil F, et al. Folic Acid Supplementation Improves Glycemic Control for Diabetes Prevention and Management: A Systematic Review and Dose-Response Meta-Analysis of Randomized Controlled Trials. Nutrients. 2021; 13(7):2355. https://0-doi-org.brum.beds.ac.uk/10.3390/nu13072355
Chicago/Turabian StyleAsbaghi, Omid, Damoon Ashtary-Larky, Reza Bagheri, Seyedeh Parisa Moosavian, Hadi Pourmirzaei Olyaei, Behzad Nazarian, Mahnaz Rezaei Kelishadi, Alexei Wong, Darren G. Candow, Frédéric Dutheil, and et al. 2021. "Folic Acid Supplementation Improves Glycemic Control for Diabetes Prevention and Management: A Systematic Review and Dose-Response Meta-Analysis of Randomized Controlled Trials" Nutrients 13, no. 7: 2355. https://0-doi-org.brum.beds.ac.uk/10.3390/nu13072355