
Insulin/IGF-1 Signaling Is Downregulated in Barrett’s Esophagus Patients Undergoing a Moderate Calorie and Protein Restriction Program: A Randomized 2-Year Trial

 , , , , ,
Abstract
:1. Introduction
2. Materials and Methods
2.1. Trial Design
2.2. Study Population: Inclusion and Exclusion Criteria
- Histological confirmation of Barrett’s esophagus without dysplasia or cancer;
- Aged ≥ 18 years;
- BMI ≥ 25.0 kg/m2;
- Willingness and ability to perform supervised Nordic walking sessions twice a month and self-planned physical activity at least three times a week;
- Signed informed consent.
- No histological confirmation of Barrett’s esophagus;
- Cancer diagnosis within one year prior to the trial’s commencement;
- Presence of insulin-dependent diabetes;
- Refusal to sign the informed consent.
2.3. Sample Size
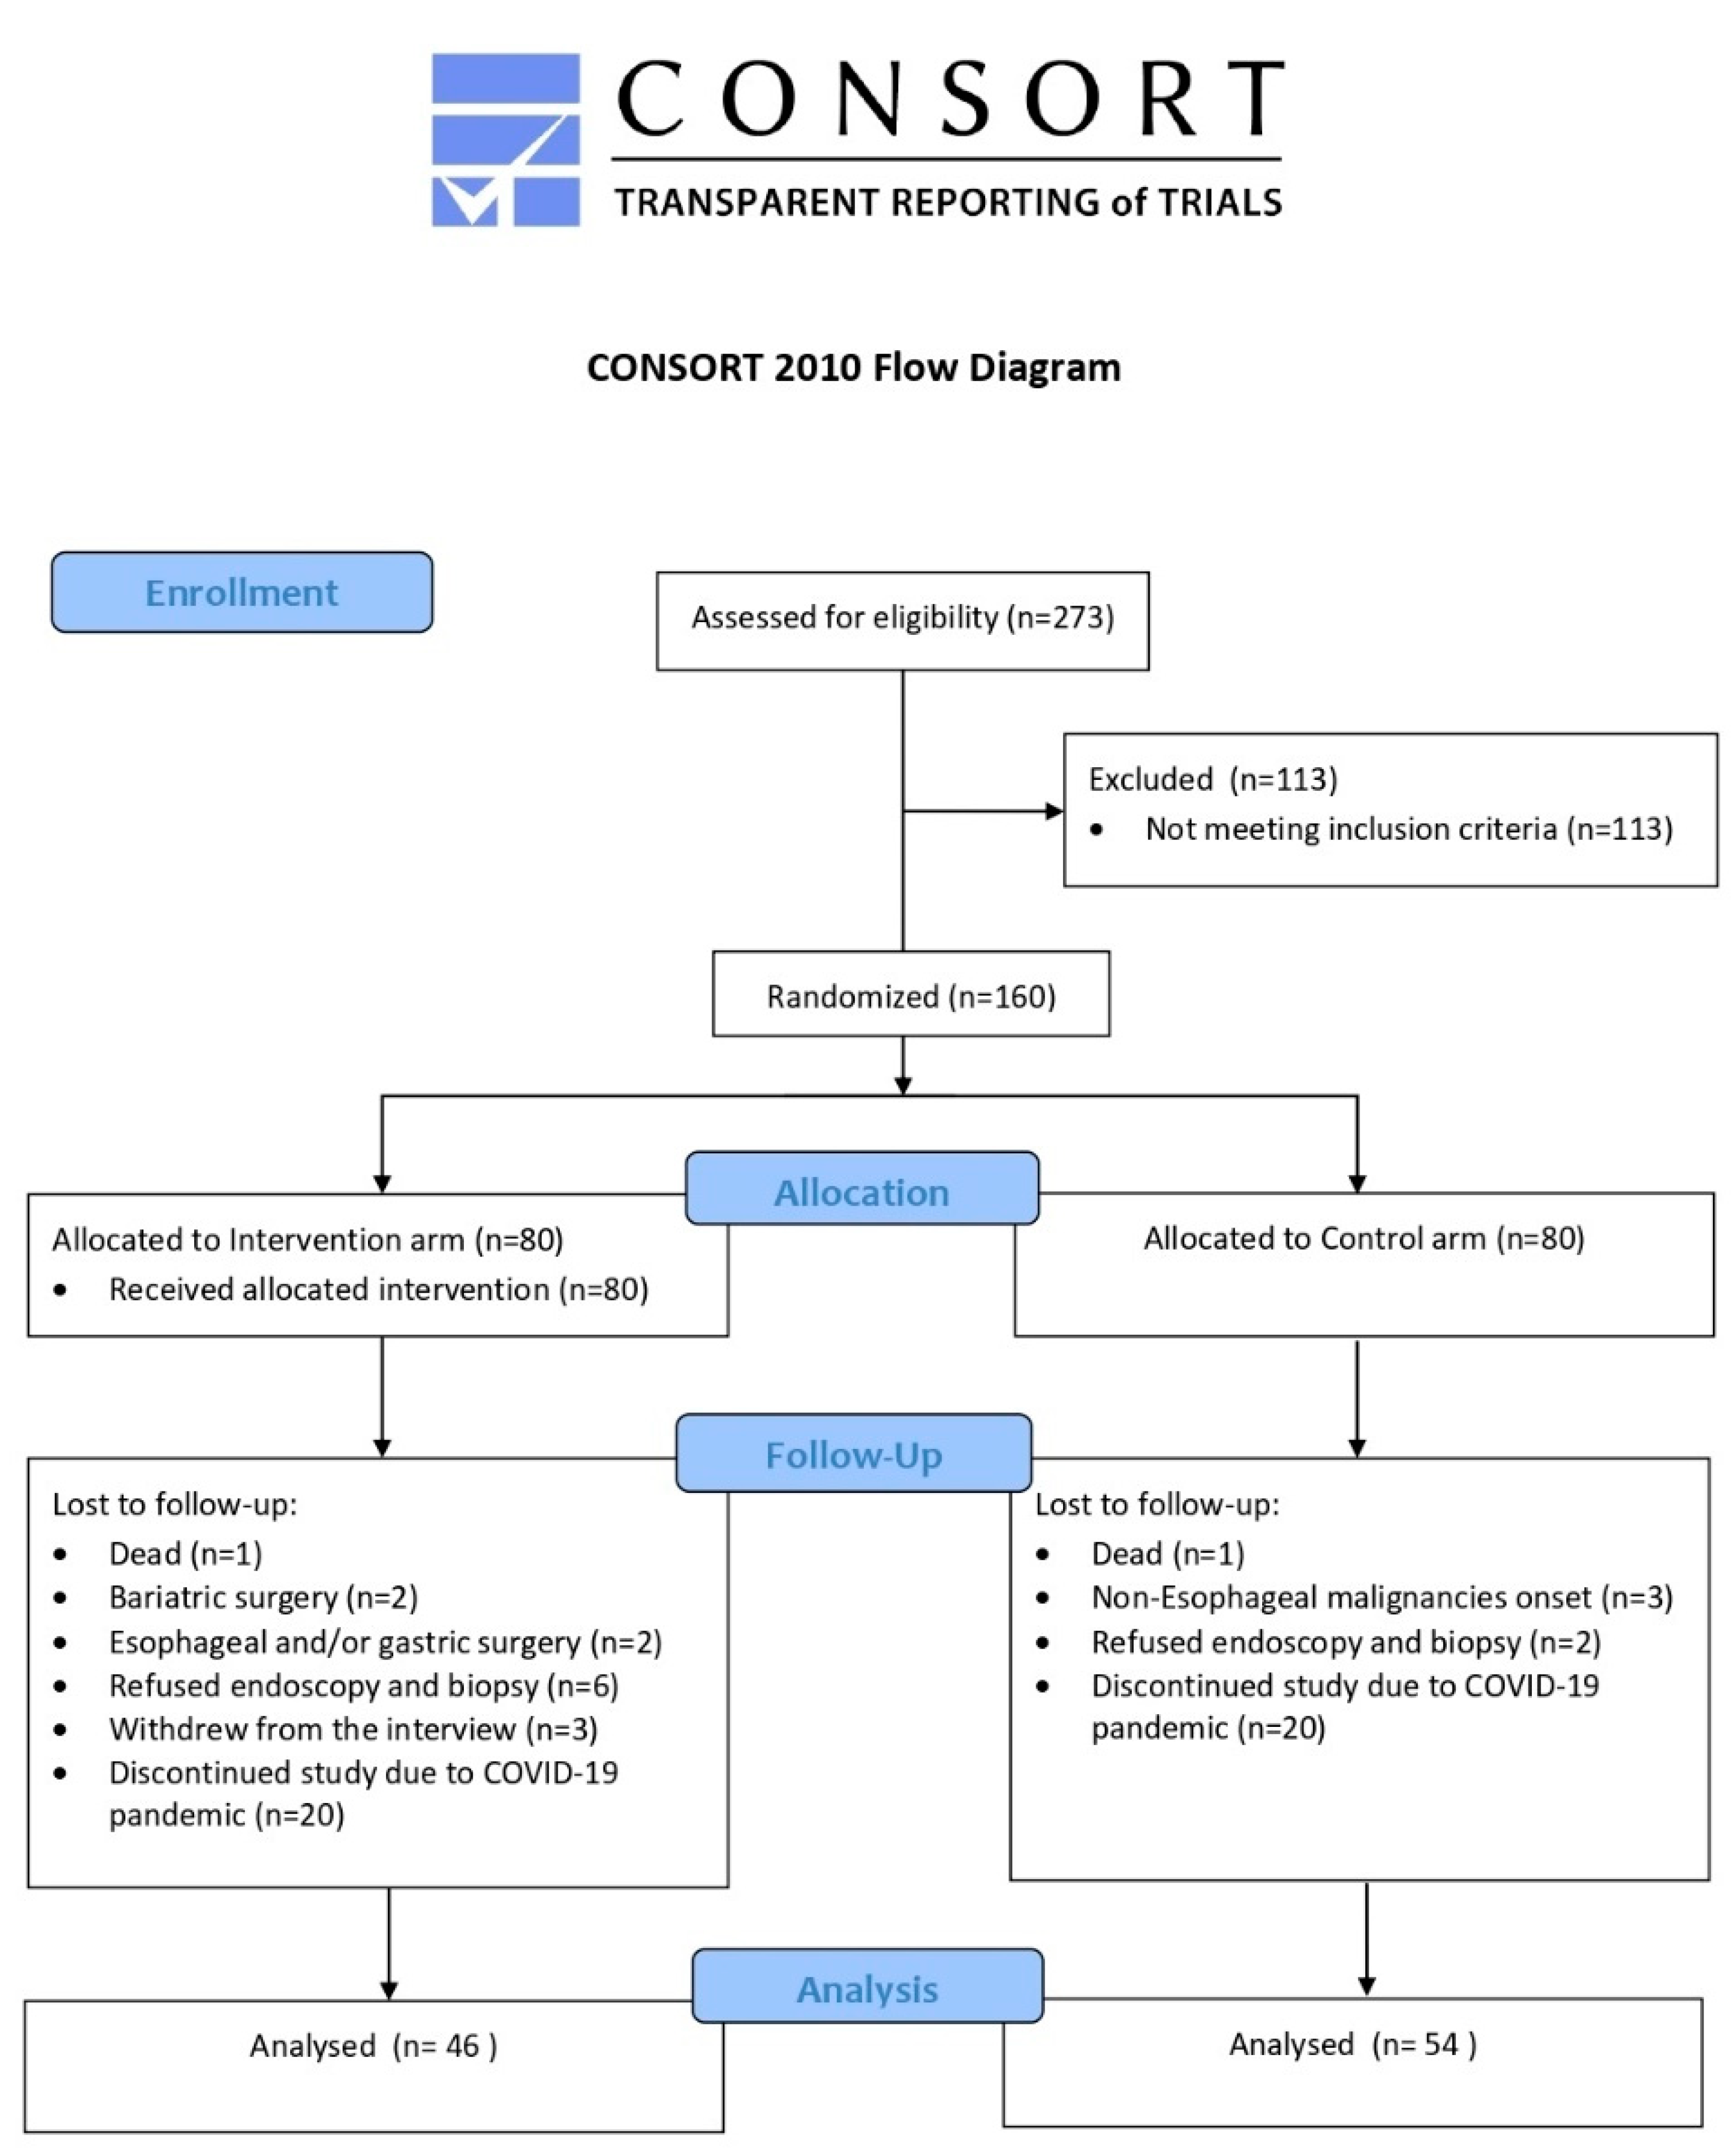
2.4. Randomization
2.5. Blood and Biopsy Sample Collection
2.6. Serum Analysis
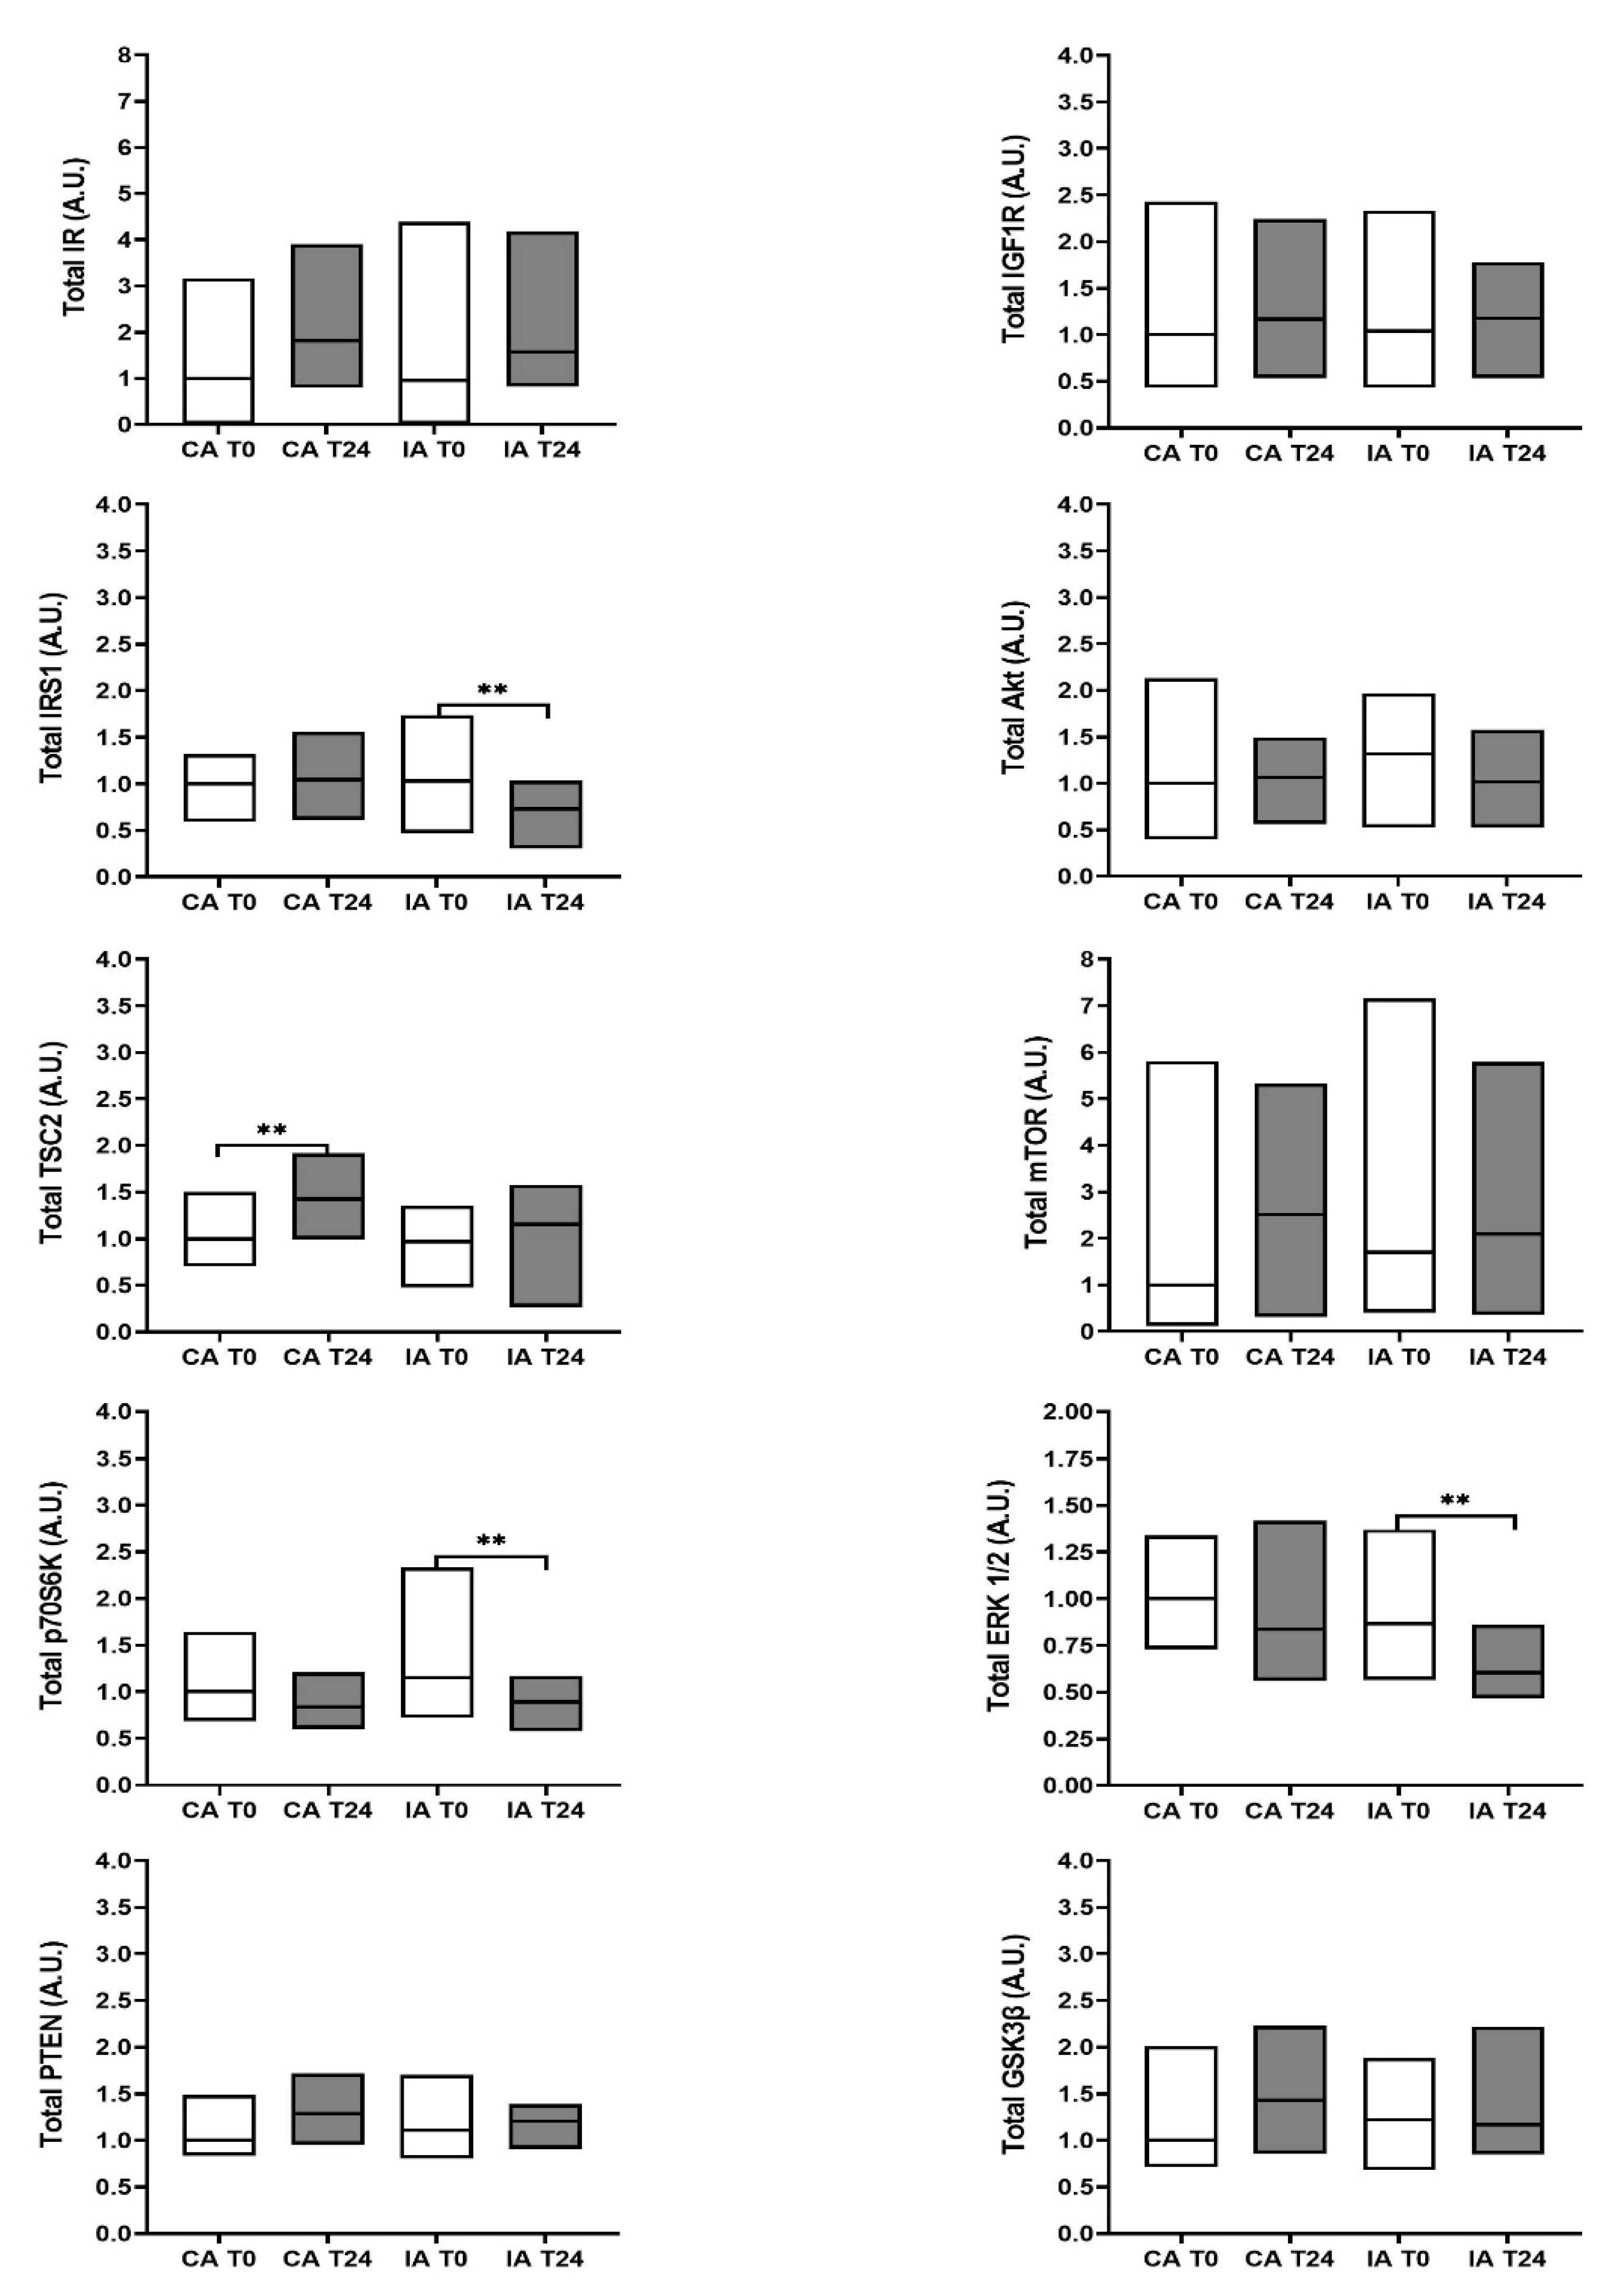
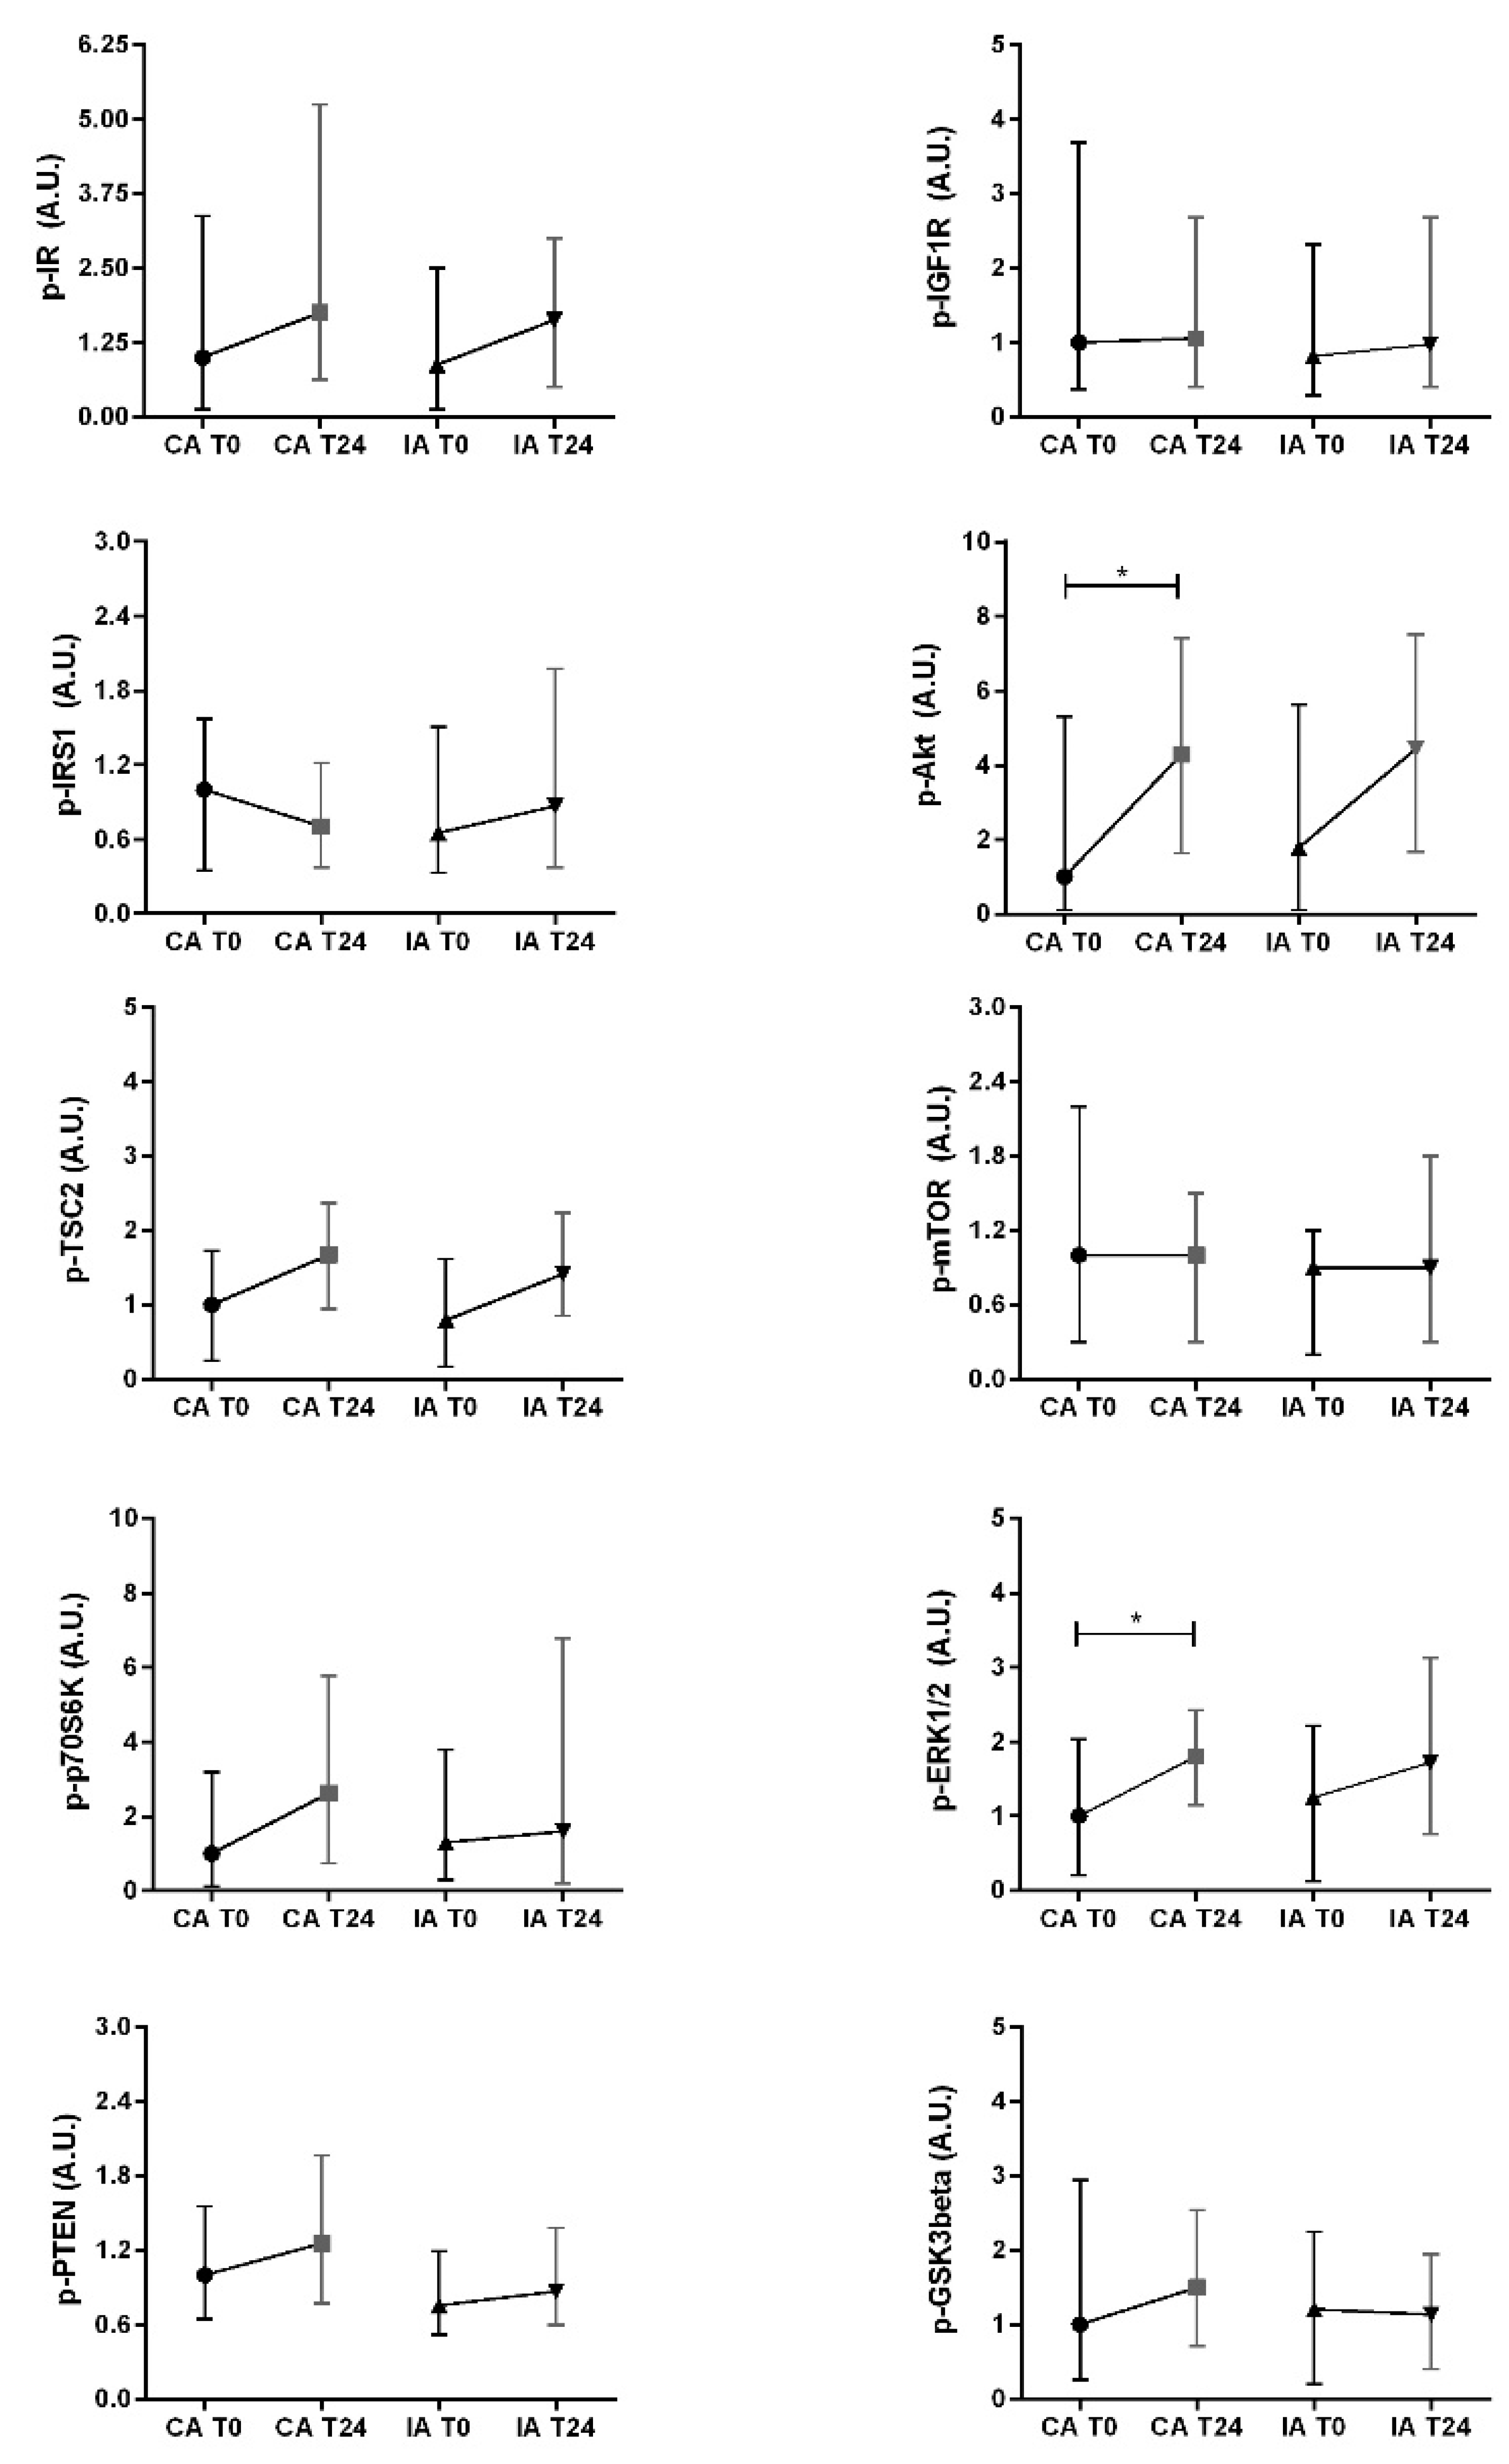
2.7. Esophageal Biopsy Analysis: Insulin/IGF-1 Signal Transduction
2.8. Statistical Analysis
3. Results
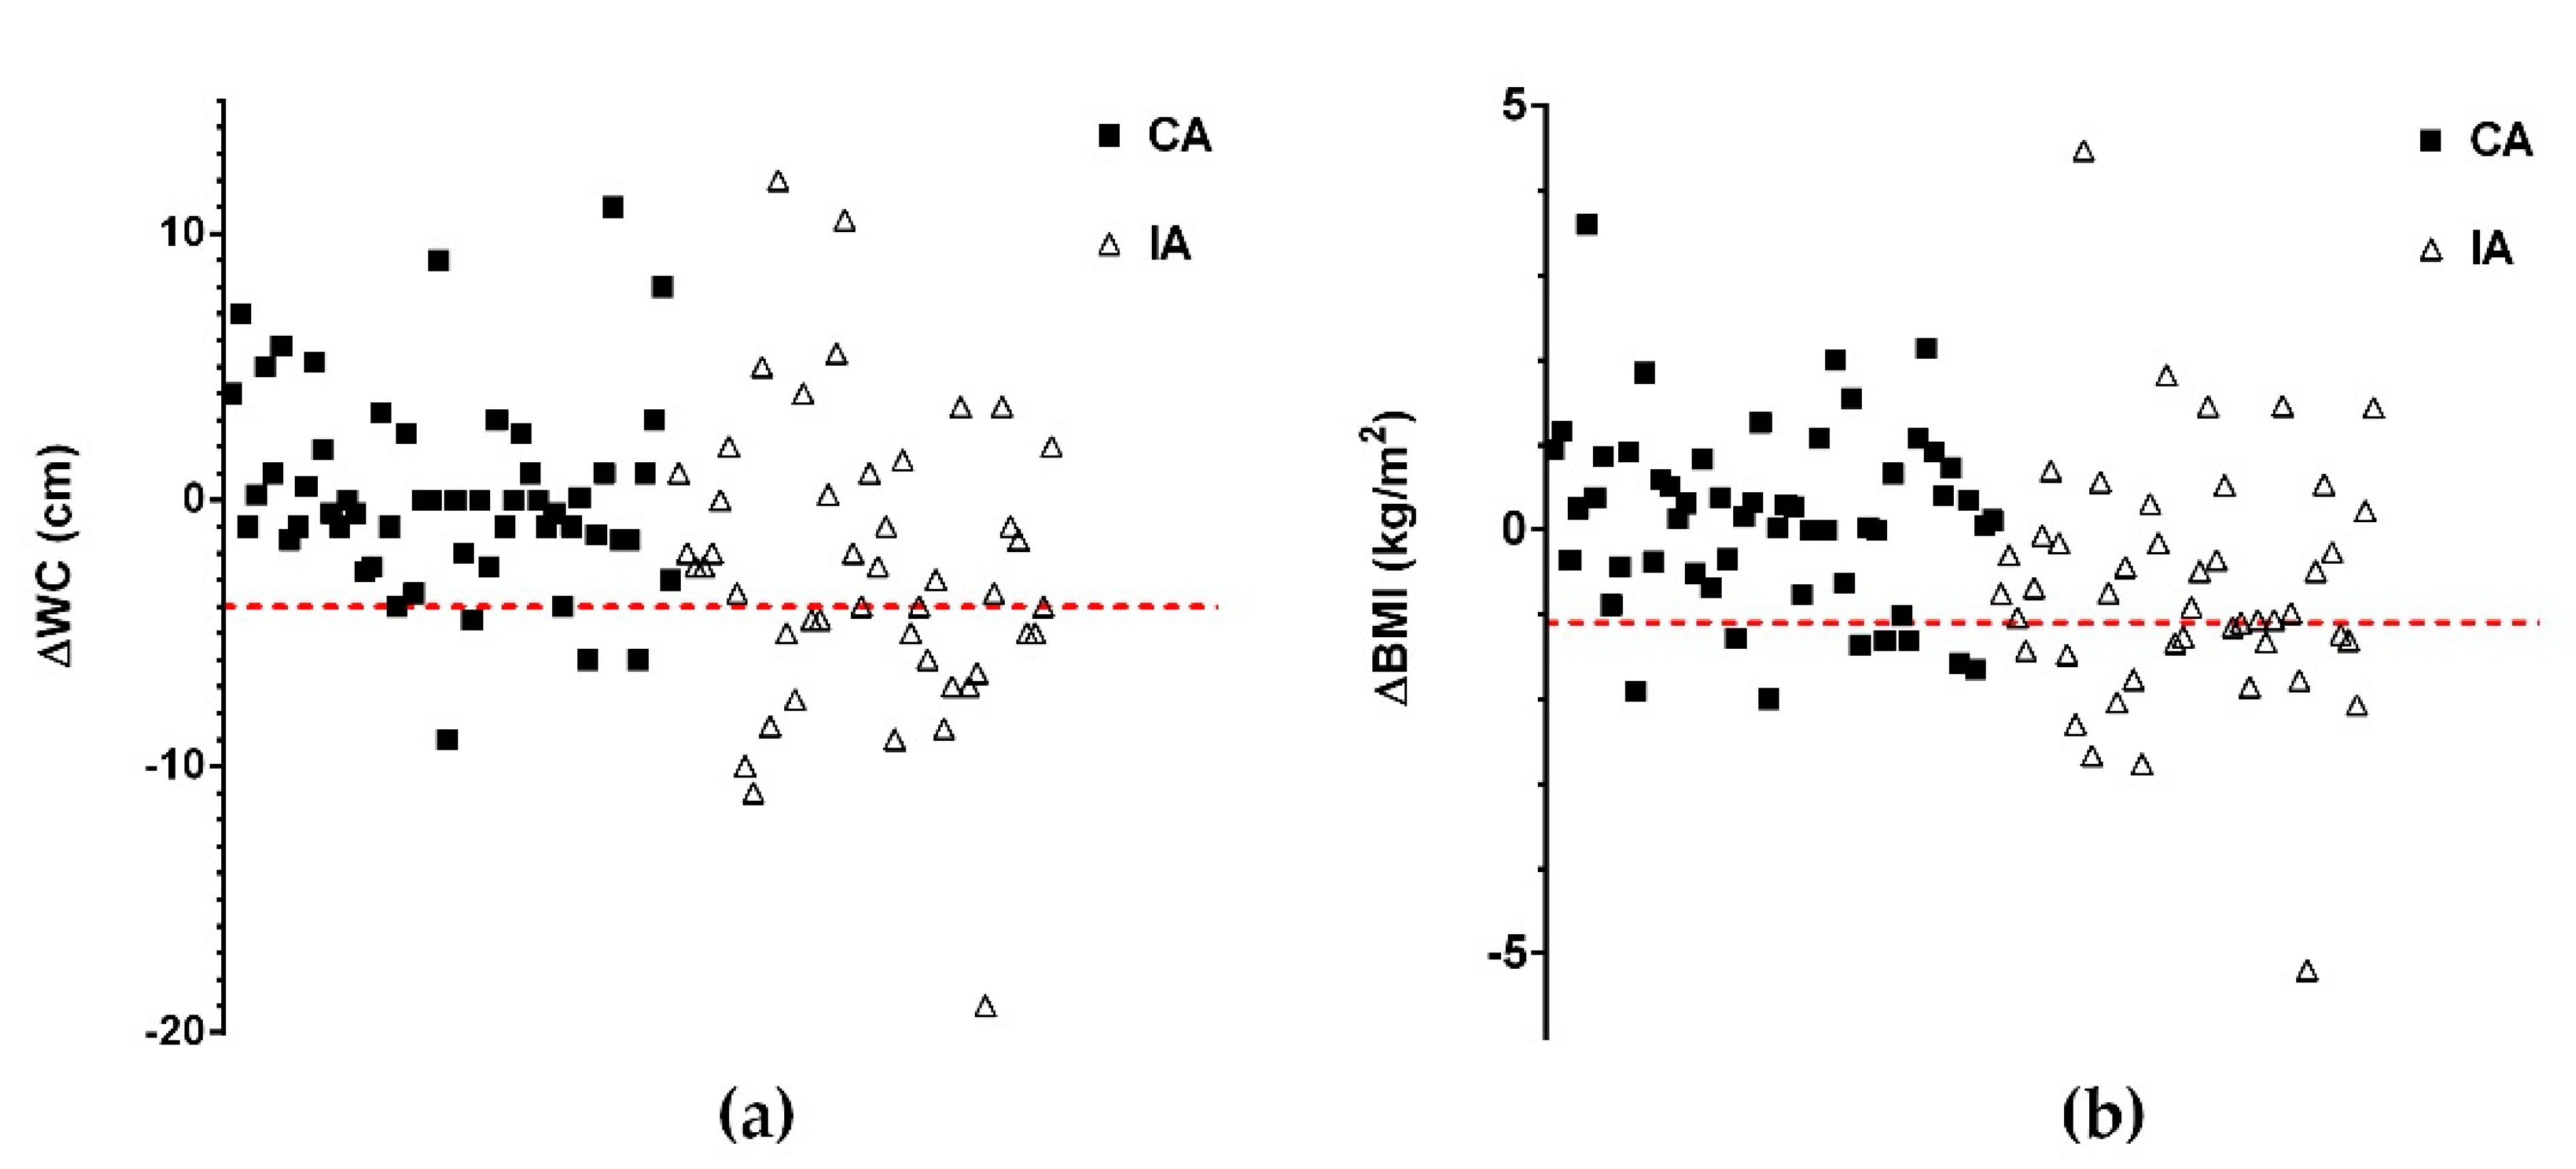
3.1. Effect of the Intervention Program on Anthropometric Measurements
3.2. Effect of the Intervention Program on Serum Parameters
3.3. Effect of the Intervention Program on the Insulin/IGF-1 Signal in Esophageal Biopsy Specimens
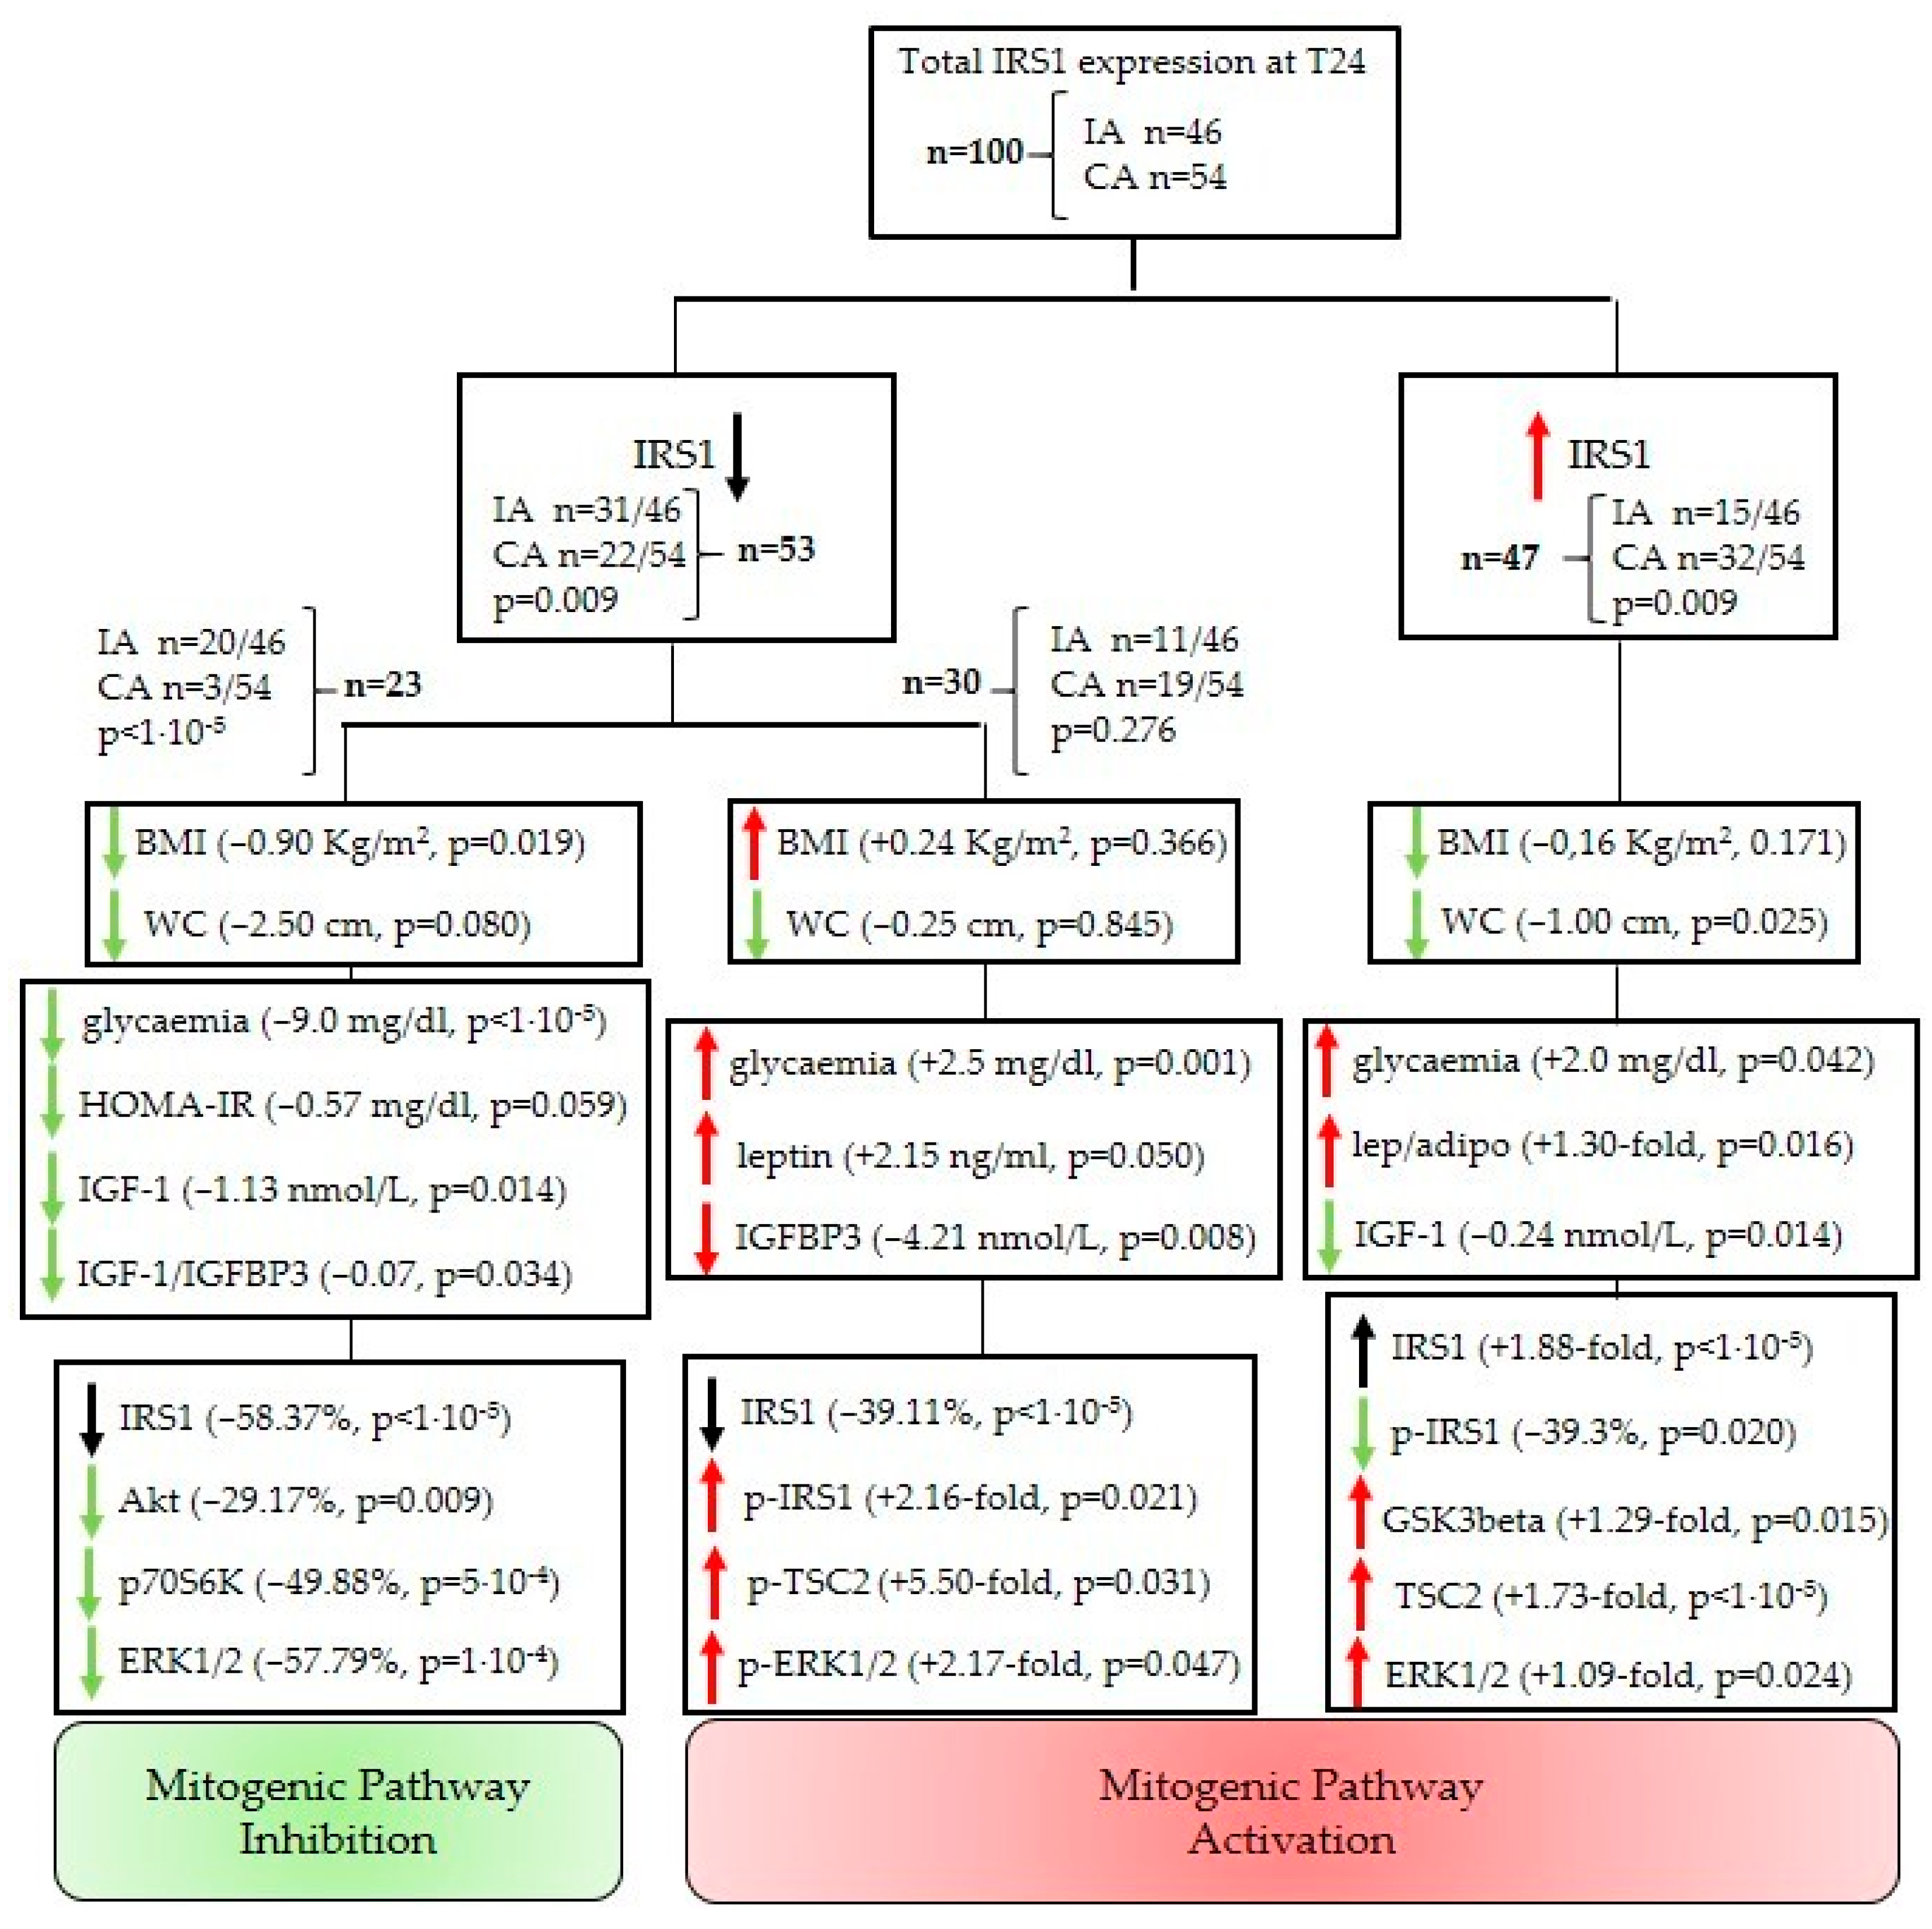
3.4. Overall Effect of the Intervention Program: Identification of Different Patient Subpopulations
4. Discussion
5. Conclusions
Supplementary Materials
Author Contributions
Funding
Institutional Review Board Statement
Informed Consent Statement
Acknowledgments
Conflicts of Interest
References
- PwC. Chronic Diseases and Conditions Are on the Rise. Available online: https://www.pwc.com/gx/en/industries/healthcare/emerging-trends-pwc-healthcare/chronic-diseases.html (accessed on 11 October 2021).
- De Pergola, G.; Silvestris, F. Obesity as a Major Risk Factor for Cancer. J. Obes. 2013, 2013, 2915. [Google Scholar] [CrossRef] [Green Version]
- Teng, J.A.; Wu, S.G.; Chen, J.X.; Li, Q.; Peng, F.; Zhu, Z.; Qin, J.; He, Z.Y. The Activation of ERK1/2 and JNK MAPK Signaling by Insulin/IGF-1 Is Responsible for the Development of Colon Cancer with Type 2 Diabetes Mellitus. PLoS ONE 2016, 11, e0149822. [Google Scholar] [CrossRef]
- Zhu, N.; Zhang, Y.; Gong, Y.I.; He, J.; Chen, X. Metformin and Lung Cancer Risk of Patients with Type 2 Diabetes Mellitus: A Meta-Analysis. Biomed. Rep. 2015, 3, 235–241. [Google Scholar] [CrossRef] [Green Version]
- Arcidiacono, D.; Antonello, A.; Fassan, M.; Nucci, D.; Morbin, T.; Agostini, M.; Nitti, D.; Rugge, M.; Alberti, A.; Battaglia, G.; et al. Insulin Promotes HER2 Signaling Activation during Barrett’s Esophagus Carcinogenesis. Dig. Liver Dis. 2017, 49, 630–638. [Google Scholar] [CrossRef]
- Elliott, J.; Reynolds, J. Visceral Obesity, Metabolic Syndrome, and Esophageal Adenocarcinoma. Front. Oncol. 2021, 11, 627270. [Google Scholar] [CrossRef] [PubMed]
- Long, E.; Beales, I.L.P. The Role of Obesity in Oesophageal Cancer Development. Therap. Adv. Gastroenterol. 2014, 7, 247–268. [Google Scholar] [CrossRef] [PubMed] [Green Version]
- Shaheen, N.J.; Richter, J.E. Barrett’s Oesophagus. Lancet 2009, 373, 850–861. [Google Scholar] [CrossRef]
- Siegel, R.; Naishadham, D.; Jemal, A. Cancer Statistics, 2013. CA Cancer J. Clin. 2013, 63, 11–30. [Google Scholar] [CrossRef] [Green Version]
- Howlader, N.; Noone, A.; Krapcho, M.; Miller, D.; Brest, A.; Yu, M.; Ruhl, J.; Tatalovich, Z.; Mariotto, A.; Lewis, D.; et al. Cancer Statistics Review 1975–2018—SEER Statistics. Available online: https://seer.cancer.gov/csr/1975_2018/ (accessed on 17 August 2021).
- Gordon, L.G.; Mayne, G.C.; Hirst, N.G.; Bright, T.; Whiteman, D.C.; Australian Cancer Study Clinical Follow-Up; Watson, D.I. Cost-Effectiveness of Endoscopic Surveillance of Non-Dysplastic Barrett’s Esophagus. Gastrointest. Endosc. 2014, 79, 242–256.e6. [Google Scholar] [CrossRef] [PubMed] [Green Version]
- Spechler, S.J. Barrett Esophagus and Risk of Esophageal Cancer: A Clinical Review. JAMA 2013, 310, 627–636. [Google Scholar] [CrossRef] [PubMed]
- Shaheen, N.J. Risk of Cancer in Patients With Barrett Esophagus. Gastroenterol. Hepatol. 2019, 15, 688. [Google Scholar]
- World Cancer Research Fund and American Institute for Cancer Research. Food, Nutrition, Physical Activity and the Prevention of Cancer: A Global Perspective; World Cancer Research Fund and American Institute for Cancer Research: Washington, DC, USA, 2007. [Google Scholar]
- Romaguera, D.; Vergnaud, A.C.; Peeters, P.H.; Van Gils, C.H.; Chan, D.S.M.; Ferrari, P.; Romieu, I.; Jenab, M.; Slimani, N.; Clavel-Chapelon, F.; et al. Is Concordance with World Cancer Research Fund/American Institute for Cancer Research Guidelines for Cancer Prevention Related to Subsequent Risk of Cancer? Results from the EPIC Study. Am. J. Clin. Nutr. 2012, 96, 150–163. [Google Scholar] [CrossRef] [PubMed]
- Gallagher, E.; LeRoith, D. Minireview: IGF, Insulin, and Cancer. Endocrinology 2011, 152, 2546–2551. [Google Scholar] [CrossRef] [Green Version]
- Baker, J.; Liu, J.P.; Robertson, E.J.; Efstratiadis, A. Role of Insulin-like Growth Factors in Embryonic and Postnatal Growth. Cell 1993, 75, 73–82. [Google Scholar] [CrossRef]
- Clemmons, D. Metabolic Actions of Insulin-like Growth Factor-I in Normal Physiology and Diabetes. Endocrinol. Metab. Clin. North Am. 2012, 41, 425–443. [Google Scholar] [CrossRef] [PubMed] [Green Version]
- LeRoith, D.; Werner, H.; Beitner-Johnson, D.; Roberts, C. Molecular and Cellular Aspects of the Insulin-like Growth Factor I Receptor. Endocr. Rev. 1995, 16, 143–163. [Google Scholar] [CrossRef]
- Baserga, R.; Peruzzi, F.; Reiss, K. The IGF-1 Receptor in Cancer Biology. Int. J. Cancer 2003, 107, 873–877. [Google Scholar] [CrossRef] [PubMed]
- Guerard, M.; Robin, T.; Perron, P.; Hatat, A.; David-Boudet, L.; Vanwonterghem, L.; Busser, B.; Coll, J.; Lantuejoul, S.; Eymin, B.; et al. Nuclear Translocation of IGF1R by Intracellular Amphiregulin Contributes to the Resistance of Lung Tumour Cells to EGFR-TKI. Cancer Lett. 2018, 420, 146–155. [Google Scholar] [CrossRef]
- Arcidiacono, D.; Dedja, A.; Giacometti, C.; Fassan, M.; Nucci, D.; Francia, S.; Fabris, F.; Zaramella, A.; Gallagher, E.; Cassaro, M.; et al. Hyperinsulinemia Promotes Esophageal Cancer Development in a Surgically-Induced Duodeno-Esophageal Reflux Murine Model. Int. J. Mol. Sci. 2018, 19, 1198. [Google Scholar] [CrossRef] [Green Version]
- Fontana, L.; Adelaiye, R.M.; Rastelli, A.L.; Miles, K.M.; Ciamporcero, E.; Longo, V.D.; Nguyen, H.; Vessella, R.; Pili, R. Dietary Protein Restriction Inhibits Tumor Growth in Human Xenograft Models. Oncotarget 2013, 4, 2451–2461. [Google Scholar] [CrossRef]
- Speakman, J.R.; Mitchell, S.E. Caloric Restriction. Mol. Asp. Med. 2011, 32, 159–221. [Google Scholar] [CrossRef] [PubMed]
- Weusten, B.; Bisschops, R.; Coron, E.; Dinis-Ribeiro, M.; Dumonceau, J.-M.; Esteban, J.-M.; Hassan, C.; Pech, O.; Repici, A.; Bergman, J.; et al. Endoscopic Management of Barrett’s Esophagus: European Society of Gastrointestinal Endoscopy (ESGE) Position Statement. Endoscopy 2017, 49, 191–198. [Google Scholar] [CrossRef] [PubMed] [Green Version]
- Roza, A.M.; Shizgal, H.M. The Harris Benedict Equation Reevaluated: Resting Energy Requirements and the Body Cell Mass. Am. J. Clin. Nutr. 1984, 40, 168–182. [Google Scholar] [CrossRef] [PubMed]
- Harvard School of Public Health. Now Being Served, Better Nutrition Advice. Our Healthy Eating Plate Alternative to the Government’s MyPlate—PubMed. Harv. Health Lett 2011, 37, 4–5. [Google Scholar]
- Diabetes Prevention Program Research Group. 10-Year Follow-up of Diabetes Incidence and Weight Loss in the Diabetes Prevention Program Outcomes Study. Lancet 2009, 374, 1677–1686. [Google Scholar] [CrossRef] [Green Version]
- Anderson, A.S.; Craigie, A.M.; Caswell, S.; Treweek, S.; Stead, M.; Macleod, M.; Daly, F.; Belch, J.; Rodger, J.; Kirk, A.; et al. The Impact of a Bodyweight and Physical Activity Intervention (BeWEL) Initiated through a National Colorectal Cancer Screening Programme: Randomised Controlled Trial. BMJ 2014, 348, g1823. [Google Scholar] [CrossRef] [Green Version]
- Matthews, D.R.; Hosker, J.P.; Rudenski, A.S.; Naylor, B.A.; Treacher, D.F.; Turner, R.C. Homeostasis Model Assessment: Insulin Resistance and β-Cell Function from Fasting Plasma Glucose and Insulin Concentrations in Man. Diabetologia 1985, 28, 412–419. [Google Scholar] [CrossRef] [PubMed] [Green Version]
- Capasso, I.; Esposito, E.; Pentimalli, F.; Montella, M.; Crispo, A.; Maurea, N.; D’Aiuto, M.; Fucito, A.; Grimaldi, M.; Cavalcanti, E.; et al. Homeostasis Model Assessment to Detect Insulin Resistance and Identify Patients at High Risk of Breast Cancer Development: National Cancer Institute of Naples Experience. J. Exp. Clin. Cancer Res. 2013, 32, 14. [Google Scholar] [CrossRef] [Green Version]
- International Diabetes Federation (IDF). Global Guideline for Type 2 Diabetes. Available online: https://www.idf.org/e-library/guidelines/79-global-guideline-for-type-2-diabetes (accessed on 2 July 2021).
- Kawai, T.; Autieri, M.V.; Scalia, R. Adipose Tissue Inflammation and Metabolic Dysfunction in Obesity. Am. J. Physiol. Cell Physiol. 2021, 320, C375–C391. [Google Scholar] [CrossRef]
- Donohoe, C.L.; Ofarrell, N.J.; Doyle, S.L.; Reynolds, J.V. The Role of Obesity in Gastrointestinal Cancer: Evidence and Opinion. Therap. Adv. Gastroenterol. 2014, 7, 38–50. [Google Scholar] [CrossRef] [Green Version]
- Marco-Benedí, V.; Pérez-Calahorra, S.; Bea, A.M.; Lamiquiz-Moneo, I.; Baila-Rueda, L.; Cenarro, A.; Civeira, F.; Mateo-Gallego, R. High-Protein Energy-Restricted Diets Induce Greater Improvement in Glucose Homeostasis but Not in Adipokines Comparing to Standard-Protein Diets in Early-Onset Diabetic Adults with Overweight or Obesity. Clin. Nutr. 2020, 39, 1354–1363. [Google Scholar] [CrossRef] [PubMed]
- Gautier-Stein, A.; Rajas, F.; Mithieux, G. Intestinal Gluconeogenesis and Protein Diet: Future Directions. Proc. Nutr. Soc. 2021, 80, 118–125. [Google Scholar] [CrossRef] [PubMed]
- Tian, S.; Xu, Q.; Jiang, R.; Han, T.; Sun, C.; Na, L. Dietary Protein Consumption and the Risk of Type 2 Diabetes: A Systematic Review and Meta-Analysis of Cohort Studies. Nutrients 2017, 9, 982. [Google Scholar] [CrossRef] [Green Version]
- Fontana, L.; Weiss, E.P.; Villareal, D.T.; Klein, S.; Holloszy, J.O. Long-Term Effects of Calorie or Protein Restriction on Serum IGF-1 and IGFBP-3 Concentration in Humans. Aging Cell 2008, 7, 681. [Google Scholar] [CrossRef] [PubMed] [Green Version]
- Zick, Y. Ser/Thr Phosphorylation of IRS Proteins: A Molecular Basis for Insulin Resistance. Sci. STKE 2005, 2005, pe4. [Google Scholar] [CrossRef]
- Bouskila, M.; Hunter, R.W.; Ibrahim, A.F.M.; Delattre, L.; Peggie, M.; Van Diepen, J.A.; Voshol, P.J.; Jensen, J.; Sakamoto, K. Allosteric Regulation of Glycogen Synthase Controls Glycogen Synthesis in Muscle. Cell Metab. 2010, 12, 456–466. [Google Scholar] [CrossRef] [PubMed] [Green Version]
- Huang, J.; Manning, B.D. The TSC1–TSC2 Complex: A Molecular Switchboard Controlling Cell Growth. Biochem. J. 2008, 412, 179. [Google Scholar] [CrossRef] [Green Version]
- Ma, L.; Chen, Z.; Erdjument-Bromage, H.; Tempst, P.; Pandolfi, P.P. Phosphorylation and Functional Inactivation of TSC2 by Erk: Implications for Tuberous Sclerosisand Cancer Pathogenesis. Cell 2005, 121, 179–193. [Google Scholar] [CrossRef] [PubMed] [Green Version]
- Um, S.H.; D’Alessio, D.; Thomas, G. Nutrient Overload, Insulin Resistance, and Ribosomal Protein S6 Kinase 1, S6K1. Cell Metab. 2006, 3, 393–402. [Google Scholar] [CrossRef] [Green Version]
- Cai, Q.; Dozmorov, M.; Oh, Y. IGFBP-3/IGFBP-3 Receptor System as an Anti-Tumor and Anti-Metastatic Signaling in Cancer. Cells 2020, 9, 1261. [Google Scholar] [CrossRef]


| CA | IA | |
|---|---|---|
| n (female) | 54 (5) | 46 (8) |
| Age, mean (±SD) | 59.1 (±10.6) | 58.7 (±10.1) |
| PPI/anti-acid n (%) | 54 (100) | 46 (100) |
| NSAID n (%) | 24 (44.4) | 18 (39.1) |
| Thyroid hormone replacement therapy n (%) | 4 (7.4) | 6 (13.0) |
| Anti-hypertensive therapy n (%) | 25 (46.3) | 16 (34.8) |
| CA n = 54 | IA n = 46 | ||||||
|---|---|---|---|---|---|---|---|
| T0 | Δ(T24−T0) | Paired | M–W | T0 | Δ(T24−T0) | paired | |
| Weight (kg) | 84.30 (77.93; 94.80) | +0.35 (−1.58; +2.00) | z = +0.71 p = 0.477 | 0.767 | 84.95 (78.50; 92.75) | −2.55 (−4.08; −0.28) | z = −3.31 p = 0.001 |
| BMI (kg/m2) | 28.08 (26.55; 30.65) | +0.20 (−0.50; +0.81) | z = +1.01 p = 0.312 | 0.772 | 28.04 (26.25; 29.56) | −0.84 (−1.34; −0.09) | z = −3.21 p = 0.002 |
| WC (cm) | 103.75 (97.63; 109.75) | +0.00 (−1.50; +1.68) | z = −0.25 p = 0.799 | 0.070 | 101.00 (94.63; 106.95) | −2.75 (−5.00; +0.80) | z = −3.13 p = 0.001 |
| CA | IA | ||||||
|---|---|---|---|---|---|---|---|
| T0 | Δ(T24−T0) | Paired | M–W | T0 | Δ(T24−T0) | Paired | |
| Glucose (mg/dL) | 85.5 (77.0; 96.7) | +2.0 (−2.7; +4.7) | z = +2.16 p = 0.031 | 0.936 | 89.0 (77.0; 99.0) | −2.5 (−10.5; +3.5) | z = −1.01 p = 0.314 |
| Insulin (pg/mL) | 413.4 (282.6; 576.0) | +26.0 (−117.1; +131.2) | z = +0.60 p = 0.547 | 0.638 | 318.2 (207.2; 531.7) | −37.9 (−103.6; +66.8) | z = −1.16 p = 0.245 |
| C-peptide (pg/mL) | 1300.5 (840.2; 1650.8) | +4.1 (−215.4; +317.9) | z = +0.73 p = 0.464 | 0.254 | 1064.8 (772.1; 1448.5) | −55.7 (−205.9; +155.5) | z = −0.63 p = 0.530 |
| HOMA-IR | 2.20 (1.47; 3.37) | +0.23 (−0.45; +0.96) | z = +1.47 p = 0.142 | 0.110 | 1.75 (0.97; 3.26) | −0.29 (−0.74; +0.40) | z = −1.28 p = 0.199 |
| IGF-1 (nmol/L) | 8.33 (6.61; 10.85) | −0.11 (−1.89; +1.10) | z = −1.67 p = 0.095 | 0.219 | 9.65 (7.80; 11.56) | −0.91 (−3.15; +0.17) | z = −3.15 p = 0.002 |
| IGFBP3 (nmol/L) | 24.74 (19.57; 27.77) | −1.00 (−4.33; +1.10) | z = −2.17 p = 0.029 | 0.254 | 25.99 (22.60; 29.23) | +0.52 (−4.21; +2.21) | z = −0.55 p = 0.585 |
| IGF-1/IGFBP3 molar ratio | 0.37 (0.27; 0.44) | +0.01 (−0.61; +0.10) | z = +0.97 p = 0.333 | 0.834 | 0.35 (0.28; 0.44) | −0.03 (−0.13; +0.07) | z = −1.67 p = 0.096 |
| Leptin (ng/mL) | 6.08 (3.37; 10.75) | +0.97 (−0.89; +2.09) | z = +2.18 p = 0.029 | 0.153 | 5.17 (2.61; 8.15) | +0.02 (−1.72; +1.19) | z = +0.20 p = 0.844 |
| Adiponectin (µg/mL) | 14.50 (10.02; 25.56) | −1.08 (−7.81; +1.71) | z = −1.71 p = 0.087 | 0.529 | 18.92 (10.65; 25.45) | +0.41 (−3.02; +6.22) | z = +0.46 p = 0.642 |
| Leptin/ Adiponectin | 0.37 (0.23; 0.88) | +0.10 (−0.04; +0.39) | z = +3.10 p = 0.002 | 0.230 | 0.30 (0.12; 0.66) | −0.01 (−0.12; +0.12) | z = +0.02 p = 0.987 |
| Total Protein | Phosphorylated Residue | Phosphorylation Function |
|---|---|---|
| IR | Tyr1162/Tyr1163 | activating |
| IGF1R | Tyr1135/Tyr1136 | activating |
| IRS1 | Ser636 | inhibitory |
| Akt | Ser473 | activating |
| mTOR | Ser2448 | activating |
| p70S6K | Thr412 | activating |
| PTEN | Ser380 | inhibitory |
| ERK1/2 | Thr185/Tyr187 | activating |
| GSK3-beta | Ser9 | inhibitory |
| TSC2 | Ser939 | inhibitory |
Publisher’s Note: MDPI stays neutral with regard to jurisdictional claims in published maps and institutional affiliations. |
© 2021 by the authors. Licensee MDPI, Basel, Switzerland. This article is an open access article distributed under the terms and conditions of the Creative Commons Attribution (CC BY) license (https://creativecommons.org/licenses/by/4.0/).
Share and Cite
Arcidiacono, D.; Zaramella, A.; Fabris, F.; Sánchez-Rodríguez, R.; Nucci, D.; Fassan, M.; Nardi, M.; Benna, C.; Cristofori, C.; Morbin, T.; et al. Insulin/IGF-1 Signaling Is Downregulated in Barrett’s Esophagus Patients Undergoing a Moderate Calorie and Protein Restriction Program: A Randomized 2-Year Trial. Nutrients 2021, 13, 3638. https://0-doi-org.brum.beds.ac.uk/10.3390/nu13103638
Arcidiacono D, Zaramella A, Fabris F, Sánchez-Rodríguez R, Nucci D, Fassan M, Nardi M, Benna C, Cristofori C, Morbin T, et al. Insulin/IGF-1 Signaling Is Downregulated in Barrett’s Esophagus Patients Undergoing a Moderate Calorie and Protein Restriction Program: A Randomized 2-Year Trial. Nutrients. 2021; 13(10):3638. https://0-doi-org.brum.beds.ac.uk/10.3390/nu13103638
Chicago/Turabian StyleArcidiacono, Diletta, Alice Zaramella, Federico Fabris, Ricardo Sánchez-Rodríguez, Daniele Nucci, Matteo Fassan, Mariateresa Nardi, Clara Benna, Chiara Cristofori, Tiziana Morbin, and et al. 2021. "Insulin/IGF-1 Signaling Is Downregulated in Barrett’s Esophagus Patients Undergoing a Moderate Calorie and Protein Restriction Program: A Randomized 2-Year Trial" Nutrients 13, no. 10: 3638. https://0-doi-org.brum.beds.ac.uk/10.3390/nu13103638