Effects of Two Dietary Fibers as Part of Ready-to-Eat Cereal (RTEC) Breakfasts on Perceived Appetite and Gut Hormones in Overweight Women

Abstract
:1. Introduction
2. Materials and Methods
2.1. Subjects
2.1.1. Diets
2.1.2. RTEC, Flaked

| RTE Cereals | LF | LF-iso | HF-AXOS | HF-FLAX | |
|---|---|---|---|---|---|
| Flaked Cereal (g) | 100 | 70 | 100 | 100 | |
| Water (g) | 220 | 260 | 200 | 200 | |
| 2% Milk (g) | 180 | 170 | 200 | 200 | |
| Mass (g) | 500 | 500 | 500 | 500 | |
| Total Carbohydrate (g) | 95 | 69 | 82 | 82 | |
| Fiber (g) | 4 | 3 | 19 | 19 | |
| Protein (g) | 13 | 11 | 12 | 12 | |
| Lipid (g) | 5 | 4 | 5 | 5 | |
| Calories (kcal) | 461 | 345 | 345 | 347 |
2.1.3. Cereal Flake Texture and Sensory Measurements
2.2. Trial Design
2.3. Ad Libitum Lunch
2.4. Appetite Measurements
2.5. Hormonal Analyses
2.6. Gastrointestinal Tolerability
2.7. Statistics
2.7.1. VAS Appetite Scores
2.7.2. Hormones and Glucose
2.7.3. Sample Size
3. Results
3.1. Cereal Flake Texture and Sensory Characteristics
| Attribute Title | LF | HF-AXOS | HF-FLAX |
|---|---|---|---|
| First Chew (Dry Cereal) | |||
| Hardness, Molars | 5.0 | 5.5 | 5.0 |
| Fracturability | 4.5 | 5.0 | 4.0 |
| Chew Down (Dry Cereal) | |||
| Moisture Absorption | 11.0 | 7.5 | 10.0 |
| Cohesiveness of Mass | 8.5 | 7.5 | 8.0 |
| Gritty/Particles | 4.0 | 3.0 | 2.0 |
| 3 Min in Milk | |||
| Fracturability | 0.0 | 0.0 | 0.0 |
| Cohesiveness of Mass | 5.5 | 4.5 | 4.0 |
3.2. Subjects
| Parameter | Trial 1 | Trial 2 |
|---|---|---|
| Female | 30 | 36 |
| Race/ethnicity | ||
| Non-Hispanic White | 20 | 23 |
| Black/African American | 8 | 8 |
| Asian or Pacific Islander | 1 | 2 |
| Multiracial | 1 | 3 |
| Smoking Status | ||
| Non-Smoker | 24 | 27 |
| Current Smoker | 2 | 5 |
| Past Smoker | 4 | 4 |
| Age (years) | 22.5 (0.6) a | 24.3 (0.5) |
| Weight (kg) | 72.9 (1.2) | 74.3 (1.2) |
| Body Mass Index (kg/m2) | 27.0 (0.3) | 27.4 (0.3) |
| Systolic Blood Pressure (mm Hg) | 109 (2) | 113 (2) |
| Diastolic Blood Pressure (mm Hg) | 66 (1) | 71 (2) |
| Heart Rate (bpm) | 73 (2) | 77 (2) |
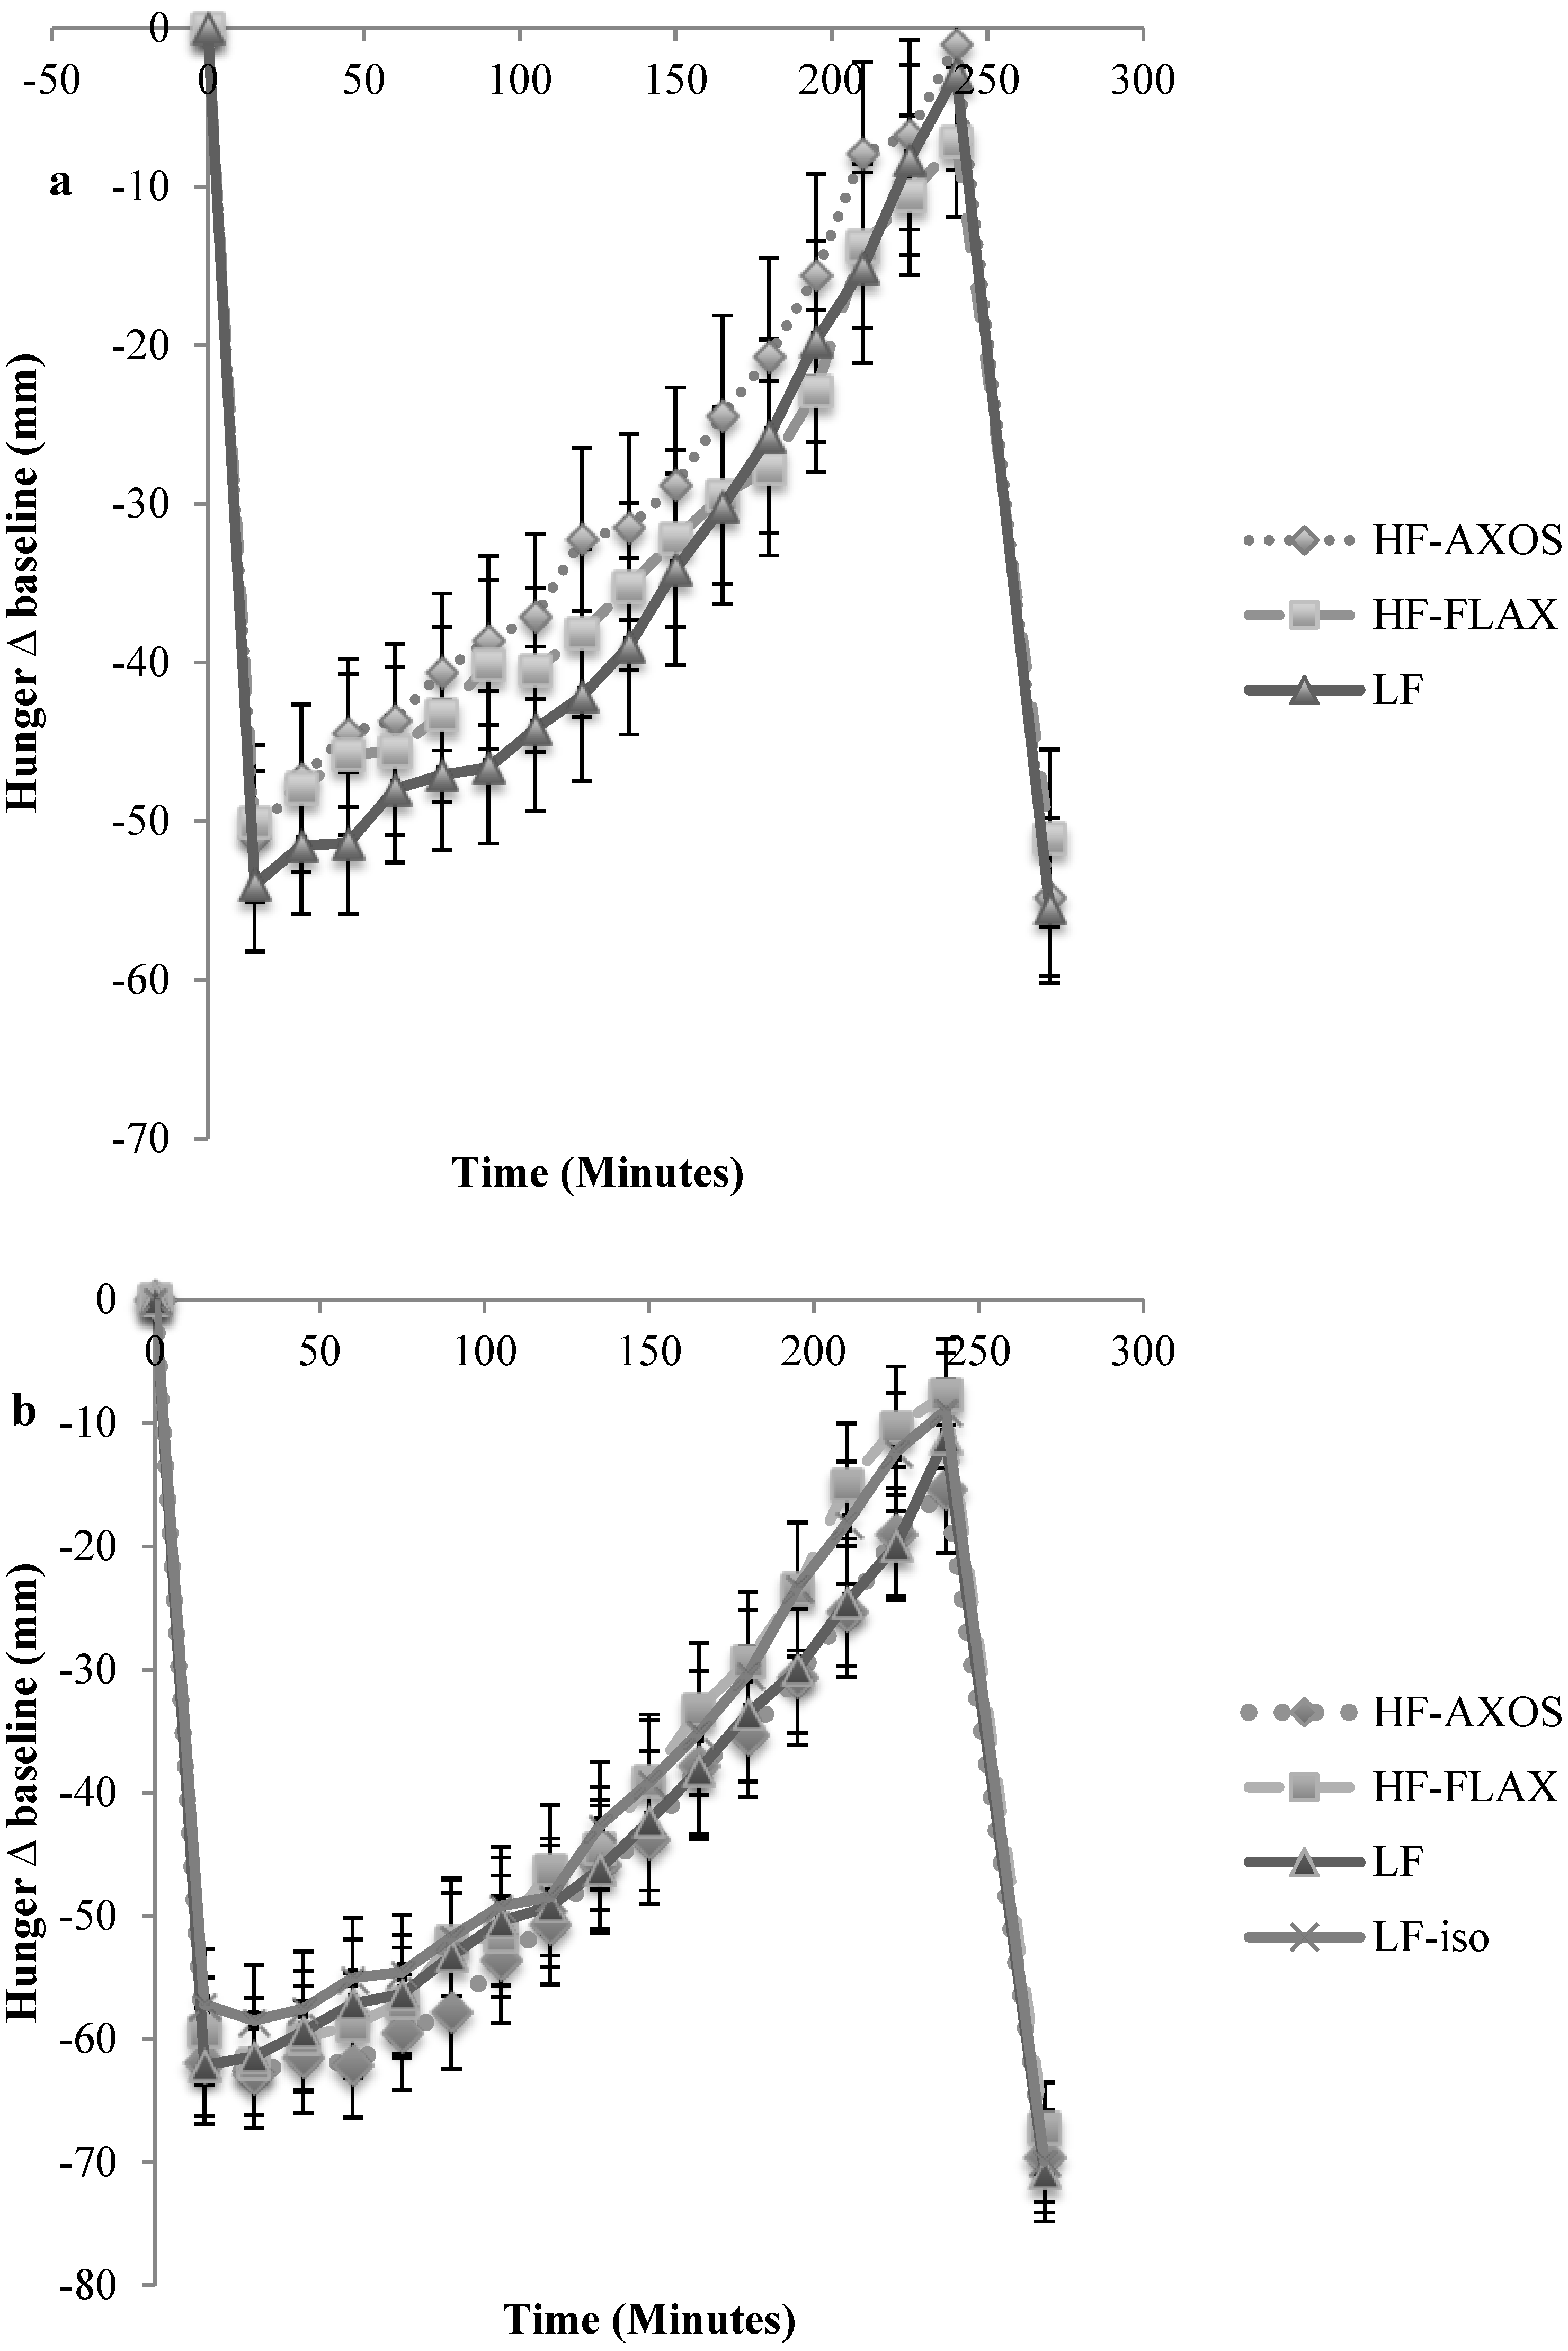
3.3. Trial 1
3.4. Trial 2

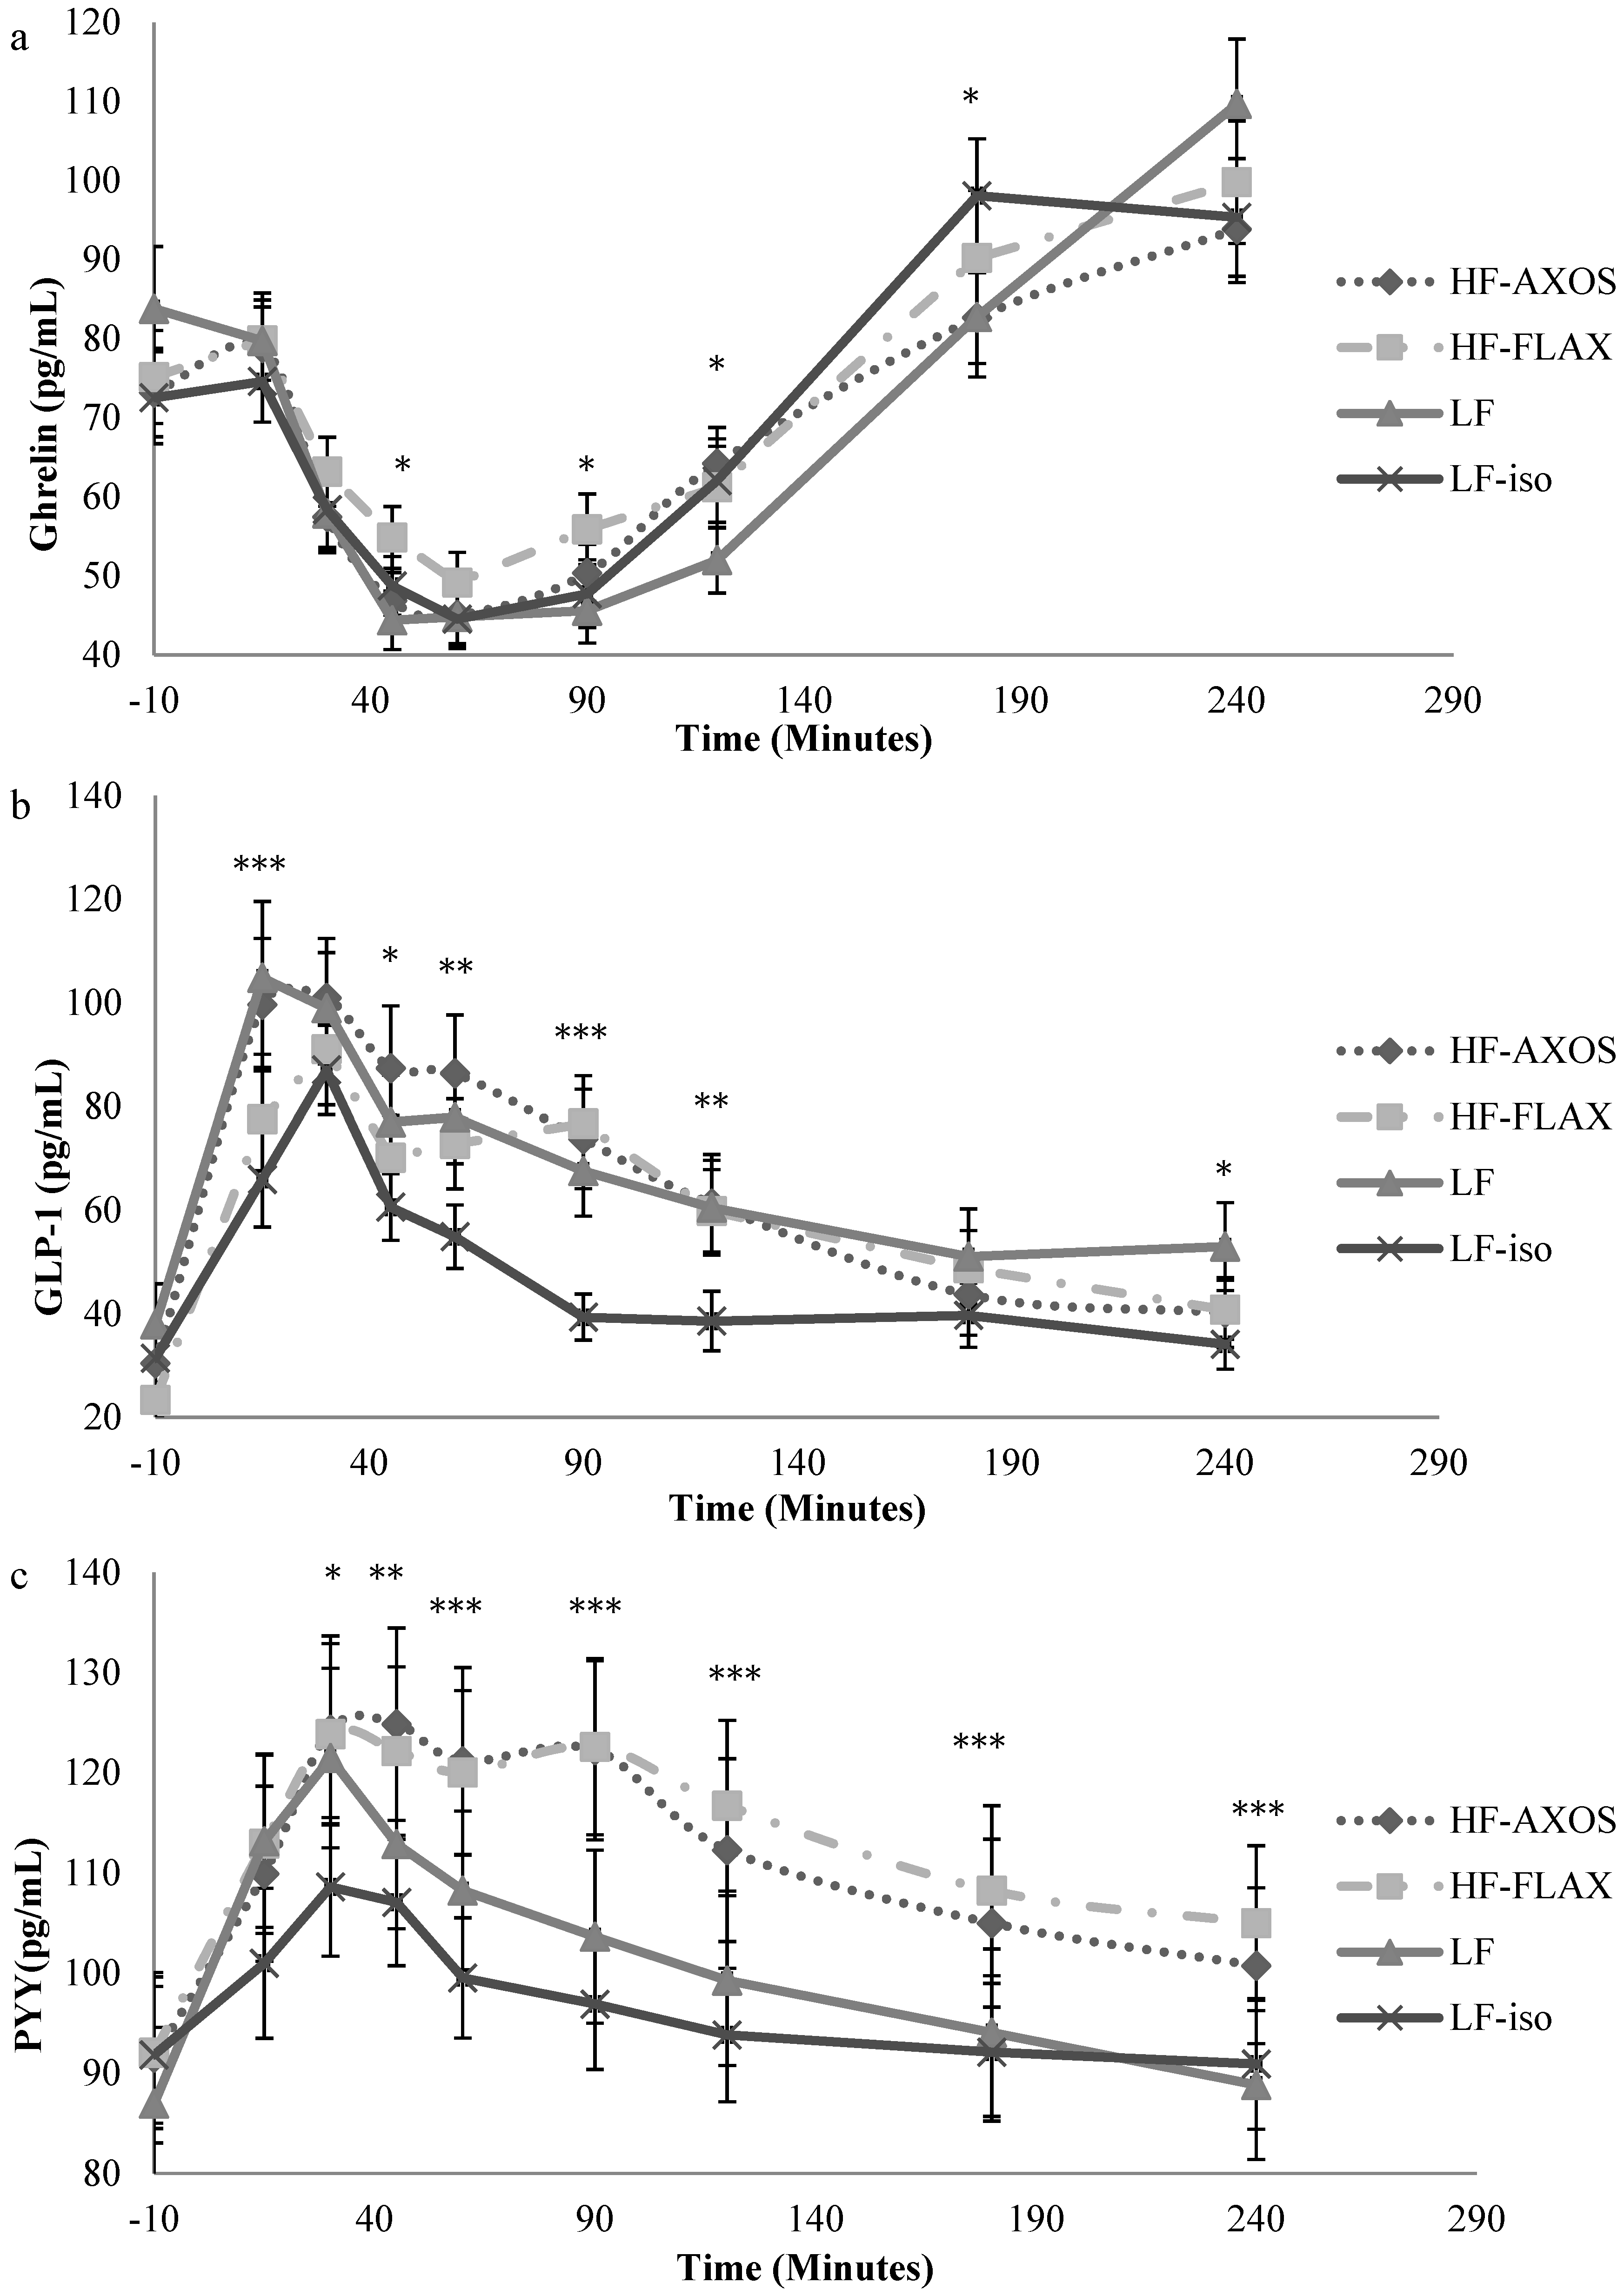
3.5. Hormones and Glucose
3.5.1. Ghrelin

| Blood Parameter a (mean × 103) | LF | LF-iso | HF-AXOS | HF-FLAX | p-Value |
|---|---|---|---|---|---|
| (a) | |||||
| Ghrelin (pg/mL × min) b | 6.45 (.51) A | 6.77 (.51) A | 6.67 (.51) A | 7.19 (.51) A | 0.33 |
| GLP-1 (pg/mL × min) | 8.81 (1.11) A | 6.27 (1.11) B | 9.25 (1.11) A | 8.35 (1.11) A | <0.01 |
| Total PYY(pg/mL × min) | 12.76 (1.02) AB | 11.87 (1.01) B | 13.93 (1.02) A | 13.93 (1.01) A | <0.01 |
| Glucose (mg/dL × min) | 11.59 (.32) A | 11.80 (.32) A | 11.29 (.32) A | 11.18 (.32) A | 0.052 |
| Insulin (pg/mL × min) | 327.90 (32.62) A | 299.80 (32.52) AB | 282.80 (32.62) B | 269.00(32.52) B | <0.01 |
| (b) | |||||
| Ghrelin (pg/mL × min) | 11.32 (.88) A | 12.06 (.88) A | 11.40 (.89) A | 12.25 (.88) A | 0.33 |
| GLP-1 (pg/mL × min) | 12.06 (1.56) A | 8.27 (1.56) B | 11.96 (1.56) A | 11.27 (1.55) A | <0.01 |
| Total PYY(pg/mL × min) | 18.41 (1.49) BC | 17.40 (1.49) C | 20.19 (1.49) AB | 20.44 (1.49) A | <0.01 |
| Glucose (mg/dL × min) | 16.16 (.37) A | 16.41 (.36) A | 16.01 (.37) A | 15.75 (.36) A | 0.12 |
| Insulin (pg/mL × min) | 436.00 (42.19) A | 382.30 (42.08) B | 360.30 (42.19) B | 348.70 (42.08) B | <0.01 |
3.5.2. GLP-1
3.5.3. PYY
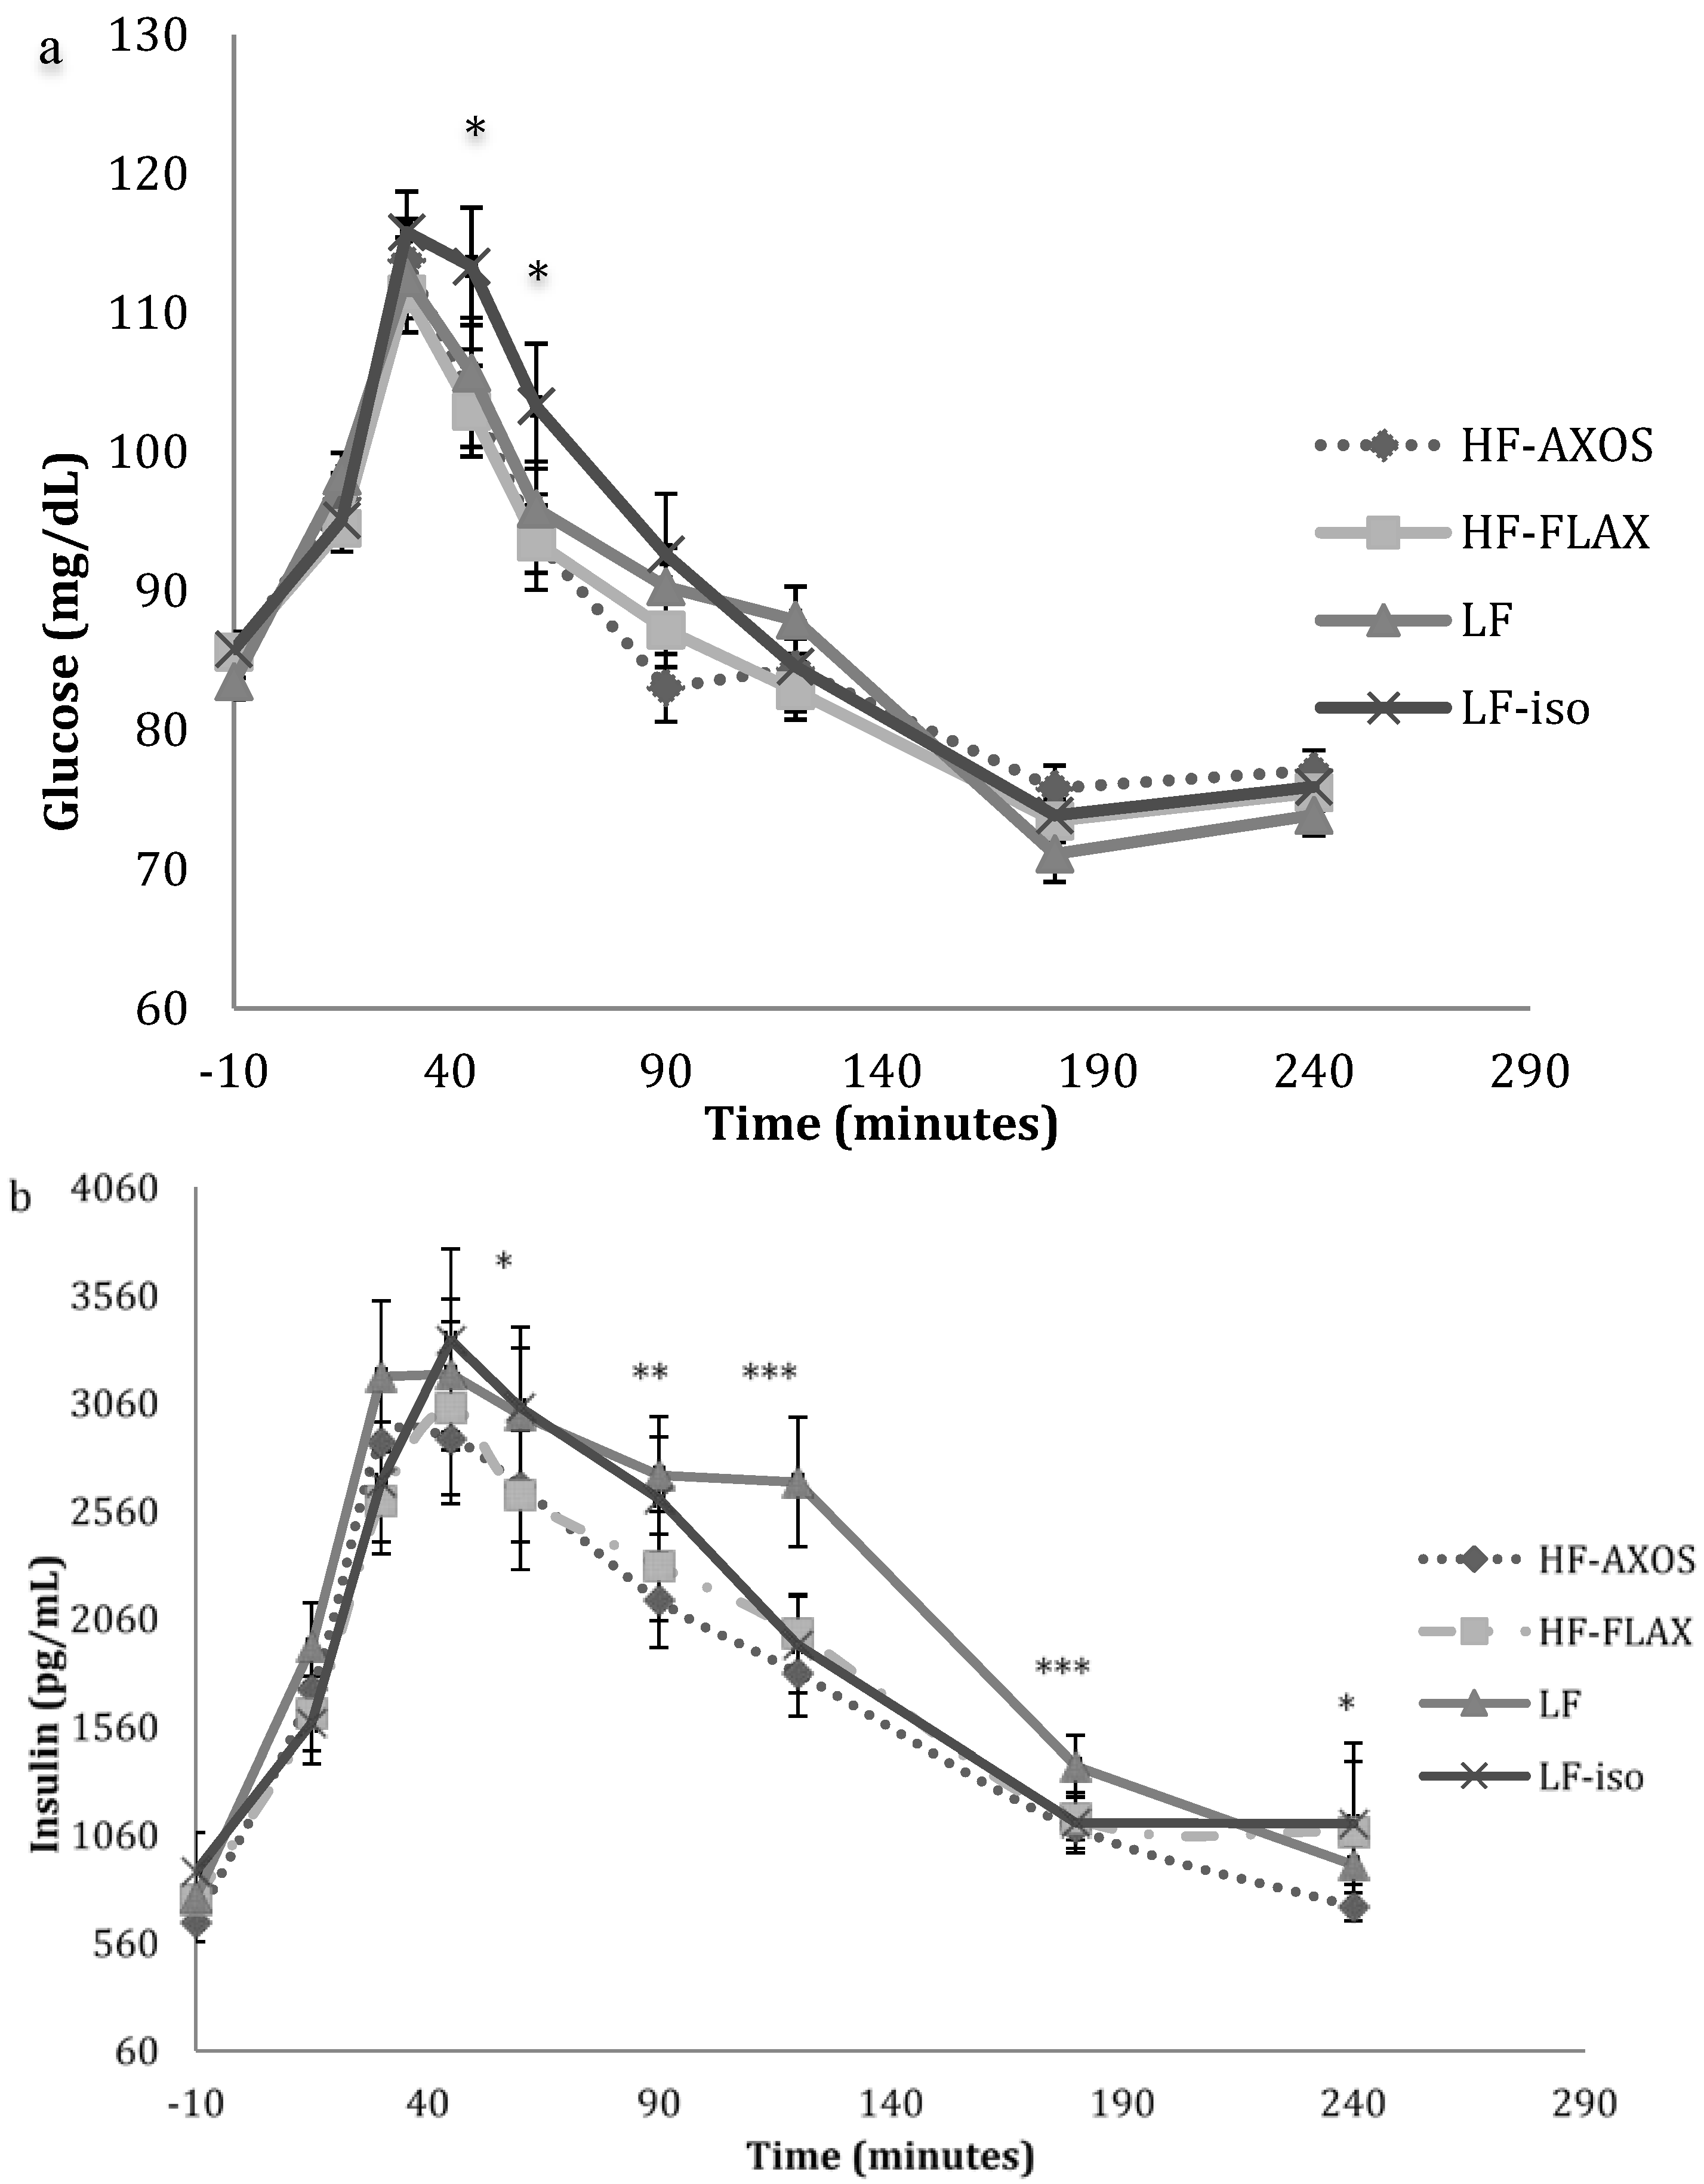
3.5.4. Glucose and Insulin

4. Discussion
4.1. Perceived Appetite
4.2. Lunch Meal Energy Intake
4.3. GLP-1 and PYY
4.4. Plasma Ghrelin, Glucose, and Insulin
5. Conclusions
Acknowledgments
Author Contributions
Conflicts of Interest
References
- Blundell, J.; Burley, V. Satiation, satiety and the action of fiber on food intake. Int. J. Obes. 1987, 11, 9–25. [Google Scholar] [PubMed]
- Howarth, N.C.; Saltz, E.; Roberts, S.B. Dietary fiber and weight regulation. Nutr. Rev. 2001, 59, 129–139. [Google Scholar] [CrossRef] [PubMed]
- Pereira, M.A.; Ludwig, D.S. Dietary Fiber and Body Weight Regulation Observations and Mechanisms. Pediatr. Clin. North Am. 2001, 48, 969–980. [Google Scholar] [CrossRef] [PubMed]
- US Department of Agriculture Agricultural Research Service. What We Eat in America NHANES 2007–2008; US Department of Agriculture Agricultural Research Service: Beltsville, MD, USA, 2010. [Google Scholar]
- Institute of Medicine of the National Academies. Dietary Reference Intakes for Energy, Carbohydrates, Fiber, Fat, Fatty Acids, Cholesterol, Protein, and Amino Acids; The National Academies Press: Washington, DC, USA, 2005. [Google Scholar]
- Oriz, D.E.; Lafond, D.W. Physicochemical properties of wheat bran and related application challenges. In Dietary Fiber and Health; Cho, S.S., Almeida, N., Eds.; CRC Press: Boca Raton, FL, USA, 2012; pp. 369–384. [Google Scholar]
- Liu, W.; Xie, Z.; Zhang, B.; Wang, Q.; Yao, W.; Gao, X.; Yu, L. Effects of hydroxypropylation on the functional properties of psyllium. J. Agric. Food Chem. 2010, 58, 1615–1621. [Google Scholar] [CrossRef] [PubMed]
- Swennen, K.; Courtin, C.; Lindemans, G.; Delcour, J. Large-scale production and characterization of wheat bran arabinoxylooligosaccharides. J. Sci. Food Agric. 2006, 86, 1722–1731. [Google Scholar] [CrossRef]
- Slavin, J.; Green, H. Fiber and Satiety. Br. Nutr. Found. Nutr. Bull. 2007, 32, 32–42. [Google Scholar] [CrossRef]
- Hiza, H.; Fungwe, T.; Bente, L. USDA Center for Nutrition Policy and Promotion, 2007; CNPP Publications. Available online: http://www.cnpp.usda.gov/Publications/FoodSupply/FiberFactSheet.pdf (accessed on 2 February 2014).
- Wanders, A.J.; Van den Borne, J.J.; de Graaf, C.; Hulshof, T.; Jonathan, M.C.; Kristensen, M.; Mars, M.; Schols, H.A.; Feskens, E.J.M. Effects of dietary fiber on subjective appetite, energy intake and body weight: A systematic review of randomized controlled trials. Obes. Rev. 2011, 12, 724–739. [Google Scholar] [PubMed]
- Both-Orthman, B.R.; Rubinow, D.R.; Hoban, M.C.; Malley, J.; Grover, G.N. Menstrual cycle phase-related changes in appetite in patients with premenstrual syndrome and in control subjects. Am. J. Psychiatry 1988, 145, 628–631. [Google Scholar] [CrossRef] [PubMed]
- Davidsen, L.; Vistisen, B.; Astrup, A. Impact of the menstrual cycle on determinants of energy balance: A putative role in weight loss attempts. Int. J. Obes. 2007, 31, 1777–1785. [Google Scholar] [CrossRef]
- Khan, K.; Shewry, P.R. Wheat Chemistry and Technology, 4th ed.; AACC International Inc.: St. Paul, MN, USA, 2009. [Google Scholar]
- Lafond, D.W.; Jin, Y.; Cho, K.; Romsos, D.R. Processing affects the physicochemical properties of arabinoxylans in ready-to-eat (RTE) flaked cereal. Cereal Chem. 2015. submitted for publication. [Google Scholar]
- Meilgaard, M.; Civille, G.V.; Carr, B.T. Sensory Evaluation Techniques; CRC Press LLC.: Boca Raton, FL, USA, 1999. [Google Scholar]
- Flint, A.; Raben, A.; Blundell, J.; Astrup, A. Reproducibility, power, and validity of visual analogue scales in assessment of appetite sensations in single test meal studies. Int. J. Obes. Relat. Metab. Disord. 2000, 24, 38–48. [Google Scholar] [CrossRef] [PubMed]
- Buemann, B.; Toubro, S.; Astrup, A. Human Gastrointestinal Tolerance to d-Tagatose. Regul. Toxicol. Pharmacol. 1999, 29, S71–S77. [Google Scholar] [CrossRef] [PubMed]
- Shapiro, S.S.; Wilk, M.B. An analysis of variance test for normality. Biometrika 1965, 52, 591–611. [Google Scholar] [CrossRef]
- Brouns, F.; Bjorck, I.; Frayn, K.N.; Gibbs, A.L.; Lang, V.; Slama, G.; Wolever, T.M.S. Glycemic index methodology. Nutr. Res. Rev. 2005, 18, 145–171. [Google Scholar] [CrossRef] [PubMed]
- Sidak, Z. On probabilities of rectangles in multivariate student distributions: Their dependence on correlations. Ann. Math. Stat. 1971, 42, 169–175. [Google Scholar] [CrossRef]
- Freeland, K.R.; Anderson, G.H.; Wolever, T.M.S. Acute effects of dietary fiber and glycemic carbohydrate on appetite and food intake in healthy males. Appetite 2009, 52, 58–64. [Google Scholar] [CrossRef] [PubMed]
- Samra, R.A.; Anderson, G.H. Insoluble cereal fiber reduces appetite and short-term food intake and glycemic response to food consumed 75 min later by healthy men. Am. J. Clin. Nutr. 2007, 86, 972–979. [Google Scholar] [PubMed]
- Hamedani, A.; Akhavan, T.; Samra, R.A.; Anderson, G.H. Reduced energy intake at breakfast is not compensated for at lunch if a high insoluble fiber cereal replaces a low fiber cereal. Am. J. Clin. Nutr. 2009, 89, 1343–1349. [Google Scholar] [CrossRef] [PubMed]
- Delargy, H.J.; Burley, V.J.; O’Sullivan, K.R.; Fletcher, R.J.; Blundell, J.E. Effects of different soluble: Insoluble fiber ratios at breakfast on 24 h pattern of dietary intake and satiety. Eur. J. Clin. Nutr. 1995, 49, 754–766. [Google Scholar] [PubMed]
- Hlebowicz, J.; Wickenberg, J.; Fahlstro, R.B.O.; Almer, L.-O.; Darwiche, G. Effect of commercial breakfast fibre cereals compared with corn flakes on postprandial blood glucose, gastric emptying, and satiety in healthy subjects: A randomized blinded crossover trial. Nutr. J. 2007, 6, 22. [Google Scholar] [CrossRef] [PubMed]
- Delargy, H.J.; O’Sullivan, K.R.; Fletcher, R.J.; Blundell, J.E. Effects of amount and type of dietary fiber (soluble and insoluble) on short-term control of appetite. Int. J. Food Sci. Nutr. 1997, 48, 67–77. [Google Scholar] [CrossRef] [PubMed]
- Solah, V.A.; Kerr, D.A.; Adikara, C.D.; Meng, X.; Binns, C.W.; Zhu, K.; Devine, A.; Prince, R.L. Differences in satiety effects of alginate and whey protein based foods. Appetite 2010, 54, 485–491. [Google Scholar] [CrossRef] [PubMed]
- Hoad, C.L.; Rayment, P.; Spiller, R.C.; Marciani, L.; Alonso, B.; Traynor, C.; Mela, D.J.; Peters, H.P.F. In vivo imaging of intragastric gelation and its effect on satiety in humans. J. Nutr. 2004, 134, 2293–2300. [Google Scholar] [PubMed]
- Rigaud, D.; Paycha, F.; Meulemans, A.; Merrouche, M.; Mignon, M. Effect of psyllium on gastric emptying, hunger feeling and food intake in nomal volunteers: A double blind study. Eur. J. Clin. Nutr. 1998, 52, 239–245. [Google Scholar] [CrossRef] [PubMed]
- Mattes, R.D.; Rothacker, D. Beverage viscosity is inversely related to postprandial hunger in humans. Physiol. Behav. 2001, 74, 551–557. [Google Scholar] [CrossRef] [PubMed]
- Kristensen, M.; Jensen, M.G. Dietary fibers in the regulation of appetite and food intake, importance of viscosity. Appetite 2010, 56, 65–70. [Google Scholar] [CrossRef] [PubMed]
- Adam, T.C.M.; Westerterp-Plantenga, M.S. Glucagon-like peptide-1 release and statiety after a nutrient challenge in normal weight and obese subjects. Br. J. Nutr. 2005, 93, 845–851. [Google Scholar] [CrossRef] [PubMed]
- Levine, A.S.; Tallman, J.R.; Grace, M.K.; Parker, S.A.; Billington, C.J.; Levitt, M.D. Effect of breakfast cereals on short-term food intake. Am. J. Clin. Nutr. 1989, 50, 1303–1307. [Google Scholar] [PubMed]
- Sorensen, L.B.; Moller, P.; Flint, A.; Martens, M.; Raben, A. Effect of sensory perceptions of foods on appetite and food intake: A review of studies on humans. Int. J. Obes. Relat. Metab. Disord. 2003, 10, 1152–1166. [Google Scholar] [CrossRef]
- Habib, A.M.; Richards, P.; Rogers, G.J.; Reimann, F.; Gribble, F.M. Co-localisation and secretion of gluagon-like peptide 1 and peptide YY from primary cultured human L cells. Diabetologia 2013, 56, 1413–1416. [Google Scholar] [CrossRef] [PubMed]
- Gribble, F.M.; Williams, L.; Simpson, A.K.; Reiman, F. A novel glucose sensing mechanism contributing to glucagon-like peptide-1 secretion from the GLUTag cell line. Diabetes 2003, 52, 1147–1154. [Google Scholar] [CrossRef] [PubMed]
- Little, T.J.; Doran, S.; Meyer, J.H.; Smout, A.J.P.M.; O’Donovan, D.G.; Wu, K.-L.; Jones, K.L.; Wishart, J.; Rayner, C.K.; Horowitz, M.; Feinle-Bisset, C. The release of GLP-1 and ghrelin, but not GIP and CCK, by glucose is dependent upon the length of small intestine exposed. Am. J. Physiol. Endocrinol. Metab. 2006, 291, E647–E655. [Google Scholar] [CrossRef] [PubMed]
- Van der Klaauw, A.A.; Keogh, J.M.; Henning, E.; Trowse, V.M.; Dhillo, W.S.; Ghatei, M.A.; Farooqi, I.S. High protein intake stimulates postprandial GLP-1 and PYY release. Obesity 2013, 21, 1602–1607. [Google Scholar] [CrossRef] [PubMed]
- Lomenick, J.P.; Melguizo, M.S.; Mitchell, S.L.; Summar, M.L.; Anderson, J.W. Effects of meals high in carbohydrate, protein, and fat on ghrelin and peptide YY secretion in prepubertal children. J. Clin. Endocrinol. Metab. 2009, 94, 4463–4471. [Google Scholar] [CrossRef] [PubMed]
- Batterham, R.L.; Heffron, H.; Kapoor, S.; Chivers, J.E.; Chandarana, K.; Herzog, H.; Le Roux, C.W.; Thomas, E.L.; Bell, J.D.; Withers, D.J. Critical role for peptide YY in protein mediated satiation and body weight regulation. Cell Metab. 2006, 4, 223–233. [Google Scholar] [CrossRef] [PubMed]
- Ou, S.; Kwok, K.; Li, Y.; Fu, L. In vitro study of possible role of dietary fiber in lowering postprandial serum glucose. J. Agric. Food Chem. 2001, 49, 1026–1029. [Google Scholar] [CrossRef] [PubMed]
- Tolhurst, G.; Heffron, H.; Lam, Y.S.; Parker, H.E.; Habib, A.M.; Diakogiannaki, E.; Cameron, J.; Grosse, J.; Reimann, F.; Gribble, F.M. Short-chain fatty acids stimulate glucagon-like peptide-1 secretion via the G-protein-coupled receptor FFAR2. Diabetes 2012, 61, 364–371. [Google Scholar] [CrossRef] [PubMed]
- Cani, P.D.; Lecourt, E.; Dewulf, E.M.; Sohet, F.M.; Pachikian, B.D.; Naslain, D.; De Backer, F.; Neyrinck, A.M.; Delzenne, N.M. Gut microbiota fermentation of prebiotics increases satietogenic and incretin gut peptide production with consequences for appetite sensation and glucose response after a meal. Am. J. Clin. Nutr. 2009, 90, 1236–1243. [Google Scholar] [CrossRef] [PubMed]
- Francois, I.E.J.A.; Lescroat, O.; Veraverbeke, W.S.; Marzorati, M.; Possemiers, S.; Evenepoel, P.; Hamer, H.; Houben, E.; Windey, K.; Welling, G.W.; et al. Effects on wheat bran extract containing arabinoxylan oligosaccharides on gastrointestinal health parameters in healthy adult human volunteers; a double-blind, randomized, placebo-controlled, cross-over trial. Br. J. Nutr. 2012, 108, 2229–2242. [Google Scholar] [CrossRef] [PubMed]
- Neyrinck, A.M.; Van Hee, V.F.; De Backer, F.; Toussaint, O.; Cani, P.D.; Delzenne, N.M. Wheat derived arabinoxylan oligosaccharides with prebiotic effect increase satietogenic gut peptides and reduce metabolic endotoxemia in diet induced obese mice. Nutr. Diabetes 2012, 2, 1–9. [Google Scholar] [CrossRef]
- Slavin, J. Fiber and prebiotics: Mechanisms and health benefits. Nutrients 2013, 5, 1417–1435. [Google Scholar] [CrossRef] [PubMed]
- Delzenne, N.; Blundell, J.; Brouns, F.; Cunningham, K.; De Graaf, K.; Erkner, A.; Lluch, A.; Mars, M.; Peters, H.P.F.; Westerterp-Plantenga, M. Gastrointestinal targets of appetite regulation in humans. Obes. Rev. 2010, 11, 234–250. [Google Scholar] [CrossRef] [PubMed]
- Blom, W.A.M.; Stafleu, A.; de Graaf, C.; Kok, F.J.; Schaafsma, G.; Hendriks, H.F.J. Ghrelin response to carbohydrate-enriched breakfast is related to insulin. Am. J. Clin. Nutr. 2005, 81, 367–375. [Google Scholar] [PubMed]
- Regand, A.; Tosh, S.M.; Wolever, T.M.S.; Wood, P.J. Physicochemical properties of β-glucan in differently processed oat foods influence glycemic response. J. Agric. Food Chem. 2009, 57, 8831–8838. [Google Scholar] [CrossRef] [PubMed]
- Dikeman, C.L.; Fahey, G.C. Viscosity as related to dietary fiber: A review. Crit. Rev. Food Sci. Nutr. 2006, 46, 649–663. [Google Scholar] [CrossRef] [PubMed]
© 2015 by the authors; licensee MDPI, Basel, Switzerland. This article is an open access article distributed under the terms and conditions of the Creative Commons Attribution license (http://creativecommons.org/licenses/by/4.0/).
Share and Cite
Lafond, D.W.; Greaves, K.A.; Maki, K.C.; Leidy, H.J.; Romsos, D.R. Effects of Two Dietary Fibers as Part of Ready-to-Eat Cereal (RTEC) Breakfasts on Perceived Appetite and Gut Hormones in Overweight Women. Nutrients 2015, 7, 1245-1266. https://0-doi-org.brum.beds.ac.uk/10.3390/nu7021245
Lafond DW, Greaves KA, Maki KC, Leidy HJ, Romsos DR. Effects of Two Dietary Fibers as Part of Ready-to-Eat Cereal (RTEC) Breakfasts on Perceived Appetite and Gut Hormones in Overweight Women. Nutrients. 2015; 7(2):1245-1266. https://0-doi-org.brum.beds.ac.uk/10.3390/nu7021245
Chicago/Turabian StyleLafond, David W., Kathryn A. Greaves, Kevin C. Maki, Heather J. Leidy, and Dale R. Romsos. 2015. "Effects of Two Dietary Fibers as Part of Ready-to-Eat Cereal (RTEC) Breakfasts on Perceived Appetite and Gut Hormones in Overweight Women" Nutrients 7, no. 2: 1245-1266. https://0-doi-org.brum.beds.ac.uk/10.3390/nu7021245