Article

Dietary Intake of High-Protein Foods and Other Major Foods in Meat-Eaters, Poultry-Eaters, Fish-Eaters, Vegetarians, and Vegans in UK Biobank

Cancer Epidemiology Unit, Nuffield Department of Population Health, Old Road Campus, Roosevelt Drive, University of Oxford, Oxford OX3 7LF, UK
*
Author to whom correspondence should be addressed.
Submission received: 29 September 2017 / Revised: 17 November 2017 / Accepted: 28 November 2017 / Published: 2 December 2017
(This article belongs to the Special Issue The Science of Vegetarian Nutrition and Health)

Abstract

:
Vegetarian diets are defined by the absence of meat and fish, but differences in the intake of other foods between meat-eaters and low or non-meat eaters are also important to document. We examined intakes of high-protein foods (meat, poultry, fish, legumes, nuts, vegetarian protein alternatives, dairy products, and eggs) and other major food groups (fruit, vegetables, bread, pasta, rice, snack foods, and beverages) in regular meat-eaters, low meat-eaters, poultry-eaters, fish-eaters, vegetarians, and vegans of white ethnicity participating in UK Biobank who had completed at least one web-based 24-h dietary assessment (n = 199,944). In regular meat-eaters, around 25% of total energy came from meat, fish, dairy and plant milk, cheese, yogurt, and eggs. In vegetarians, around 20% of energy came from dairy and plant milk, cheese, yoghurt, eggs, legumes, nuts, and vegetarian protein alternatives, and in vegans around 15% came from plant milk, legumes, vegetarian alternatives, and nuts. Low and non-meat eaters had higher intakes of fruit and vegetables and lower intakes of roast or fried potatoes compared to regular meat-eaters. The differences in the intakes of meat, plant-based high-protein foods, and other foods between meat-eaters and low and non-meat eaters in UK Biobank may contribute to differences in health outcomes.

1. Introduction

Vegetarian diets are defined by the absence of meat and fish; similarly, vegan diets are defined by the absence of all animal foods—meat, fish, dairy products, and eggs. Previous studies have observed lower rates of ischaemic heart disease [1] and some cancers [2,3] in vegetarians. Comparisons of nutrient intakes between meat-eaters and vegetarians and vegans have been previously documented [4,5,6,7,8]. Two large studies [8,9] and some smaller studies have described differences in the intakes of many foods between meat-eaters and low and non-meat eating diet groups [10,11,12]; here we report the first comprehensive data on food intakes among people of different diet groups from a large (n = 199,944) cohort in the UK.
Nutritional epidemiological studies have modeled the effects of replacing red and processed meat with substitutes such as chicken, fish, low-fat dairy products, nuts, vegetables and potatoes on health outcomes including coronary heart disease [13,14,15], stroke [16], cancer [17], and mortality [18,19], in cohorts where the vast majority of participants eat red meat. However, there is a paucity of information on the actual food intakes of low- and non-meat eaters and this information is needed to inform realistic substitution analyses of meat alternatives.
The UK Biobank is a large contemporary prospective cohort where participants were invited up to five times to complete a web-based 24-h dietary assessment that assesses actual intake of foods and drinks consumed in the previous 24-h. The objective of this paper is to compare intakes of major protein food sources includingred and processed meat, poultry, fish, legumes and pulses, vegetarian protein alternatives (soy burgers/sausages; tofu; Quorn (a mycoprotein-based food); other vegetarian alternatives), nuts, cheese, yogurt, dairy milk, plant milk, and eggs, and other main food groups including fruit, vegetables, pasta, rice, bread, snack foods, and beverages, in white adult men and women of a range of diet groups—regular meat-eaters, low meat-eaters, poultry-eaters, fish-eaters, vegetarians, and vegans—who participated in UK Biobank and completed at least one web-based 24-hour dietary assessment.

2. Materials and Methods

2.1. Study Participants

UK Biobank is a prospective cohort study of half a million men and women aged 40–69 years recruited from across the UK between 2006 and 2010 [20]. The UK Biobank protocol is available online [21]. Participants were identified from National Health Service patient registers and invited to attend a local assessment center to participate in UK Biobank. Permission for access to patient records for recruitment was approved by the National Information Governance Board for Health and Social Care in England and Wales, and the Community Health Index Advisory Group in Scotland. At the assessment center participants completed a touchscreen questionnaire, which collected information on sociodemographic characteristics and diet, lifestyle, reproductive, and environmental factors. The touchscreen questionnaire is available on the UK Biobank website [22] UK Biobank has ethical approval from the North West Multi-centre Research Ethics Committee. All participants gave informed consent to participate in UK Biobank and be followed up, using a signature capture device. In April 2009, an enhancement was added to the UK Biobank protocol, whereby a web-based 24-h dietary assessment tool was added to the recruitment visit [23]. The last 70,000 participants who were recruited into UK Biobank completed this 24-h dietary assessment. In addition, the web-based 24-h dietary assessment was emailed out once every 3–4 months for a total of four times from between February 2011 and June 2012, to participants who provided UK Biobank with an email address [24]. A large sub-sample of participants (n = 175,402) completed at least one online 24-h dietary assessment during this period. The web-based 24-h dietary assessment asks about the consumption of up to 206 types of foods and 32 types of drinks during the previous 24 h. Compared to an interviewer-administered 24-h recall completed on the same day, Spearman’s correlation coefficients for estimates of the majority of nutrients ranged between 0.5–0.9 (mean of 0.6) for the two methods [25]. Participants who identified as of white ethnicity in the touchscreen questionnaire were eligible for inclusion in this study (94% of participants). For most other ethnic groups, the numbers of non-meat eaters were small. The exception was British Indians, among whom there were 1409 meat-eaters and 432 vegetarians who participated in UK Biobank and completed at least one web-based 24-h dietary assessment. However, we were not confident that the dietary assessment tool would capture all the relevant food items likely to be consumed by these groups, and therefore we did not include them in this study.

2.2. Diet Group Classification

Participants were classified as regular meat-eaters, low meat-eaters, poultry-eaters, fish-eaters, vegetarians, or vegans on the basis of their responses to the dietary questions in the touchscreen questionnaire completed at recruitment. The dietary questions in the touchscreen questionnaire generally asked about frequency of consumption of major food groups. Relevant questions used to classify participants into diet group were the questions on the frequency of consumption of beef, lamb, pork, processed meat, chicken or poultry, oily fish, other fish, and the question on avoidance of foods including eggs or foods containing eggs, and dairy products. Participants were classified as regular meat eaters if they reported consuming red meat (the sum of beef, lamb, and pork) more than three times a week, low meat-eaters were those that reported consuming red meat, but three or fewer times a week. Poultry-eaters were those that did not report consuming red or processed meat, but did report consuming poultry, and fish-eaters were those that did not report consuming red or processed meat, or poultry, but did report eating at least one of oily fish or other fish. Vegetarians were those that did not report eating red or processed meat, or poultry, or oily or other fish; vegans additionally reported never eating eggs or foods containing eggs, ordairy products. Participants of unknown diet group were excluded from this analysis (participants who we were not able to classify into a diet group because they answered “Do not know” or “Prefer not to answer” to one of the necessary questions used to define diet groups).

2.3. Mean Intake of Food Groups

To estimate the mean intakes of foods and food groups from the 24-h dietary assessments, we used the steering file for the web-based 24-h dietary assessment that lists the portion size of each food item, and, where appropriate, we grouped together food items that constitute a food group. For example, to get the mean intakes of non-oily fish in the touchscreen questionnaire, we calculated the sum (in grams) of the following items from the 24-h dietary assessment: white fish, battered fish, breaded fish, and tinned tuna. For each participant who completed a 24-h dietary assessment, the serving size in grams for each relevant food item was multiplied by the frequency reported in the 24-h dietary assessment. To calculate the percentage energy from foods that are major protein sources we used the steering file, which lists the foodcodes that correspond to each food item, to calculate mean energy in kJ from each relevant food item. Generally, we assigned one whole food item in the 24-h dietary assessment tool to a food group, e.g., the food item ‘apple’ was assigned to the fruit food group. However, the food item ‘eggs in sandwiches’ was disaggregated into ‘egg’ and ‘mayonnaise’ based on standard recipes, and the egg component was assigned to the egg food group. Details of the food items from the web-based dietary assessment tool that were assigned to each food group are given in Supplementary Tables S1 and S2.

2.4. Statistical Analysis

We excluded 24-h dietary assessment records where the energy intake was greater than our pre-specified sex-specific acceptable limit (20,000 kJ for men and 18,000 kJ for women). Participant characteristics were described by diet group. Participants who completed more than one web-based 24-h dietary assessment had their records averaged. Mean intakes of foods that are major sources of protein, and other major food groups, from the web-based 24-h dietary assessments were generated by diet group, adjusted for age (continuous). We also repeated the analysis standardising the diets to a 2000 kcal (8368 kJ) per day diet. To do this, for each participant we took the intake of each food item from each 24-h assessment and divided it by their energy intake (in kJ) from that 24-h assessment, and multiplied it by 2000 kcal (8368 kJ). Analysis of covariance was used to test for heterogeneity between the diet groups, with age at recruitment included as a covariate. If there was significant heterogeneity, post hoc pairwise comparisons were used to test for differences between the diet groups, with Bonferroni correction for multiple comparisons. Results reported in the text as differences between two groups are significant pairwise comparisons after correction for multiple comparisons. We also calculated relative mean consumption of broader food groups for each of the low- and non-meat eating groups compared to regular meat-eaters. To do this, for each broad food group we took the ratio of the mean (g) intake for each low- and non-meat eating group to the mean intake (g) of the regular meat-eating group, after adjustment for age. Results for men and women are presented separately. Stata version 14.1 (Stata Corp LP, College Station, TX, USA) was used for all analyses. All p-values were two-sided and p < 0.05 was considered significant. Statistical code is available on request by emailing the corresponding author.

3. Results

Of the 200,541 participants who identified as of white ethnicity, and completed at least one web-based 24-h dietary assessment tool with an energy intake below the sex-specific acceptable limit, 199,944 could be assigned to a diet group based on their answers to the dietary questions in the touchscreen questionnaire. In total, there were 90,742 regular meat-eaters, 97,124 low meat-eaters, 2259 poultry-eaters, 5701 fish-eaters, 3870 vegetarians, and 248 vegans.
Participant characteristics are shown in Table 1 (men) and Table 2 (women). Non-meat eaters (fish-eaters, vegetarians, and vegans) were younger than meat-eaters. Regular and low meat-eaters were less likely to have a college or university degree, and had a higher Body Mass Index (BMI) and body fat percentage on average. Poultry-eaters and non-meat eaters were more likely to have a high level of physical activity compared to regular meat-eaters.
Intakes of foods (in grams and as a percent of energy) that are major sources of protein are shown in Table 3 (men) and Table 4 (women). For regular meat-eaters, meat and fish supplied 12.6% of the total energy intake. Dairy and plant milks supplied approximately another 5%, and cheese, yoghurt, and eggs supplied around 6% of total energy intake. In vegetarians, dairy and plant milks supplied approximately 3–5% of total energy, cheese, yoghurt and eggs supplied 8–9%, and legumes, vegetarian protein alternatives, and nuts supplied 6–7%. In vegans, plant milk supplied 2–3% of total energy, and legumes, vegetarian protein alternatives, and nuts supplied approximately 10%.
Intakes of other major food groups (in grams) are shown in Table 5 (men) and Table 6 (women). There were significant differences in the intakes of most food groups across the diet groups. Low meat-eaters, poultry-eaters, fish-eaters, vegetarians and vegans had higher fruit and vegetable intakes, and lower roast or fried potato intakes compared to regular meat-eaters. Fish-eaters, vegetarians and vegans had higher intakes of wholemeal pasta and brown rice and lower intakes of white bread compared to regular meat-eaters. Among men, fish-eaters, vegetarians and vegans had significantly higher intakes of wholemeal bread, and among women, fish-eaters and vegetarians had higher intakes of wholemeal bread compared to regular meat-eaters. Vegetarians also had significantly higher intakes of white pasta, breakfast cereal and pure fruit/juice and significantly lower intakes or sugar-sweetened beverages compared to regular meat-eaters. Among men, fish-eaters and vegans had significantly lower intakes of coffee, and among women, fish-eaters and vegetarians had lower intakes of coffee, compared to regular meat-eaters. For both men and women, fish-eaters and vegetarians had significantly lower intakes of alcoholic drinks, and in men vegans also had lower intake of alcoholic drinks compared to regular meat-eaters.
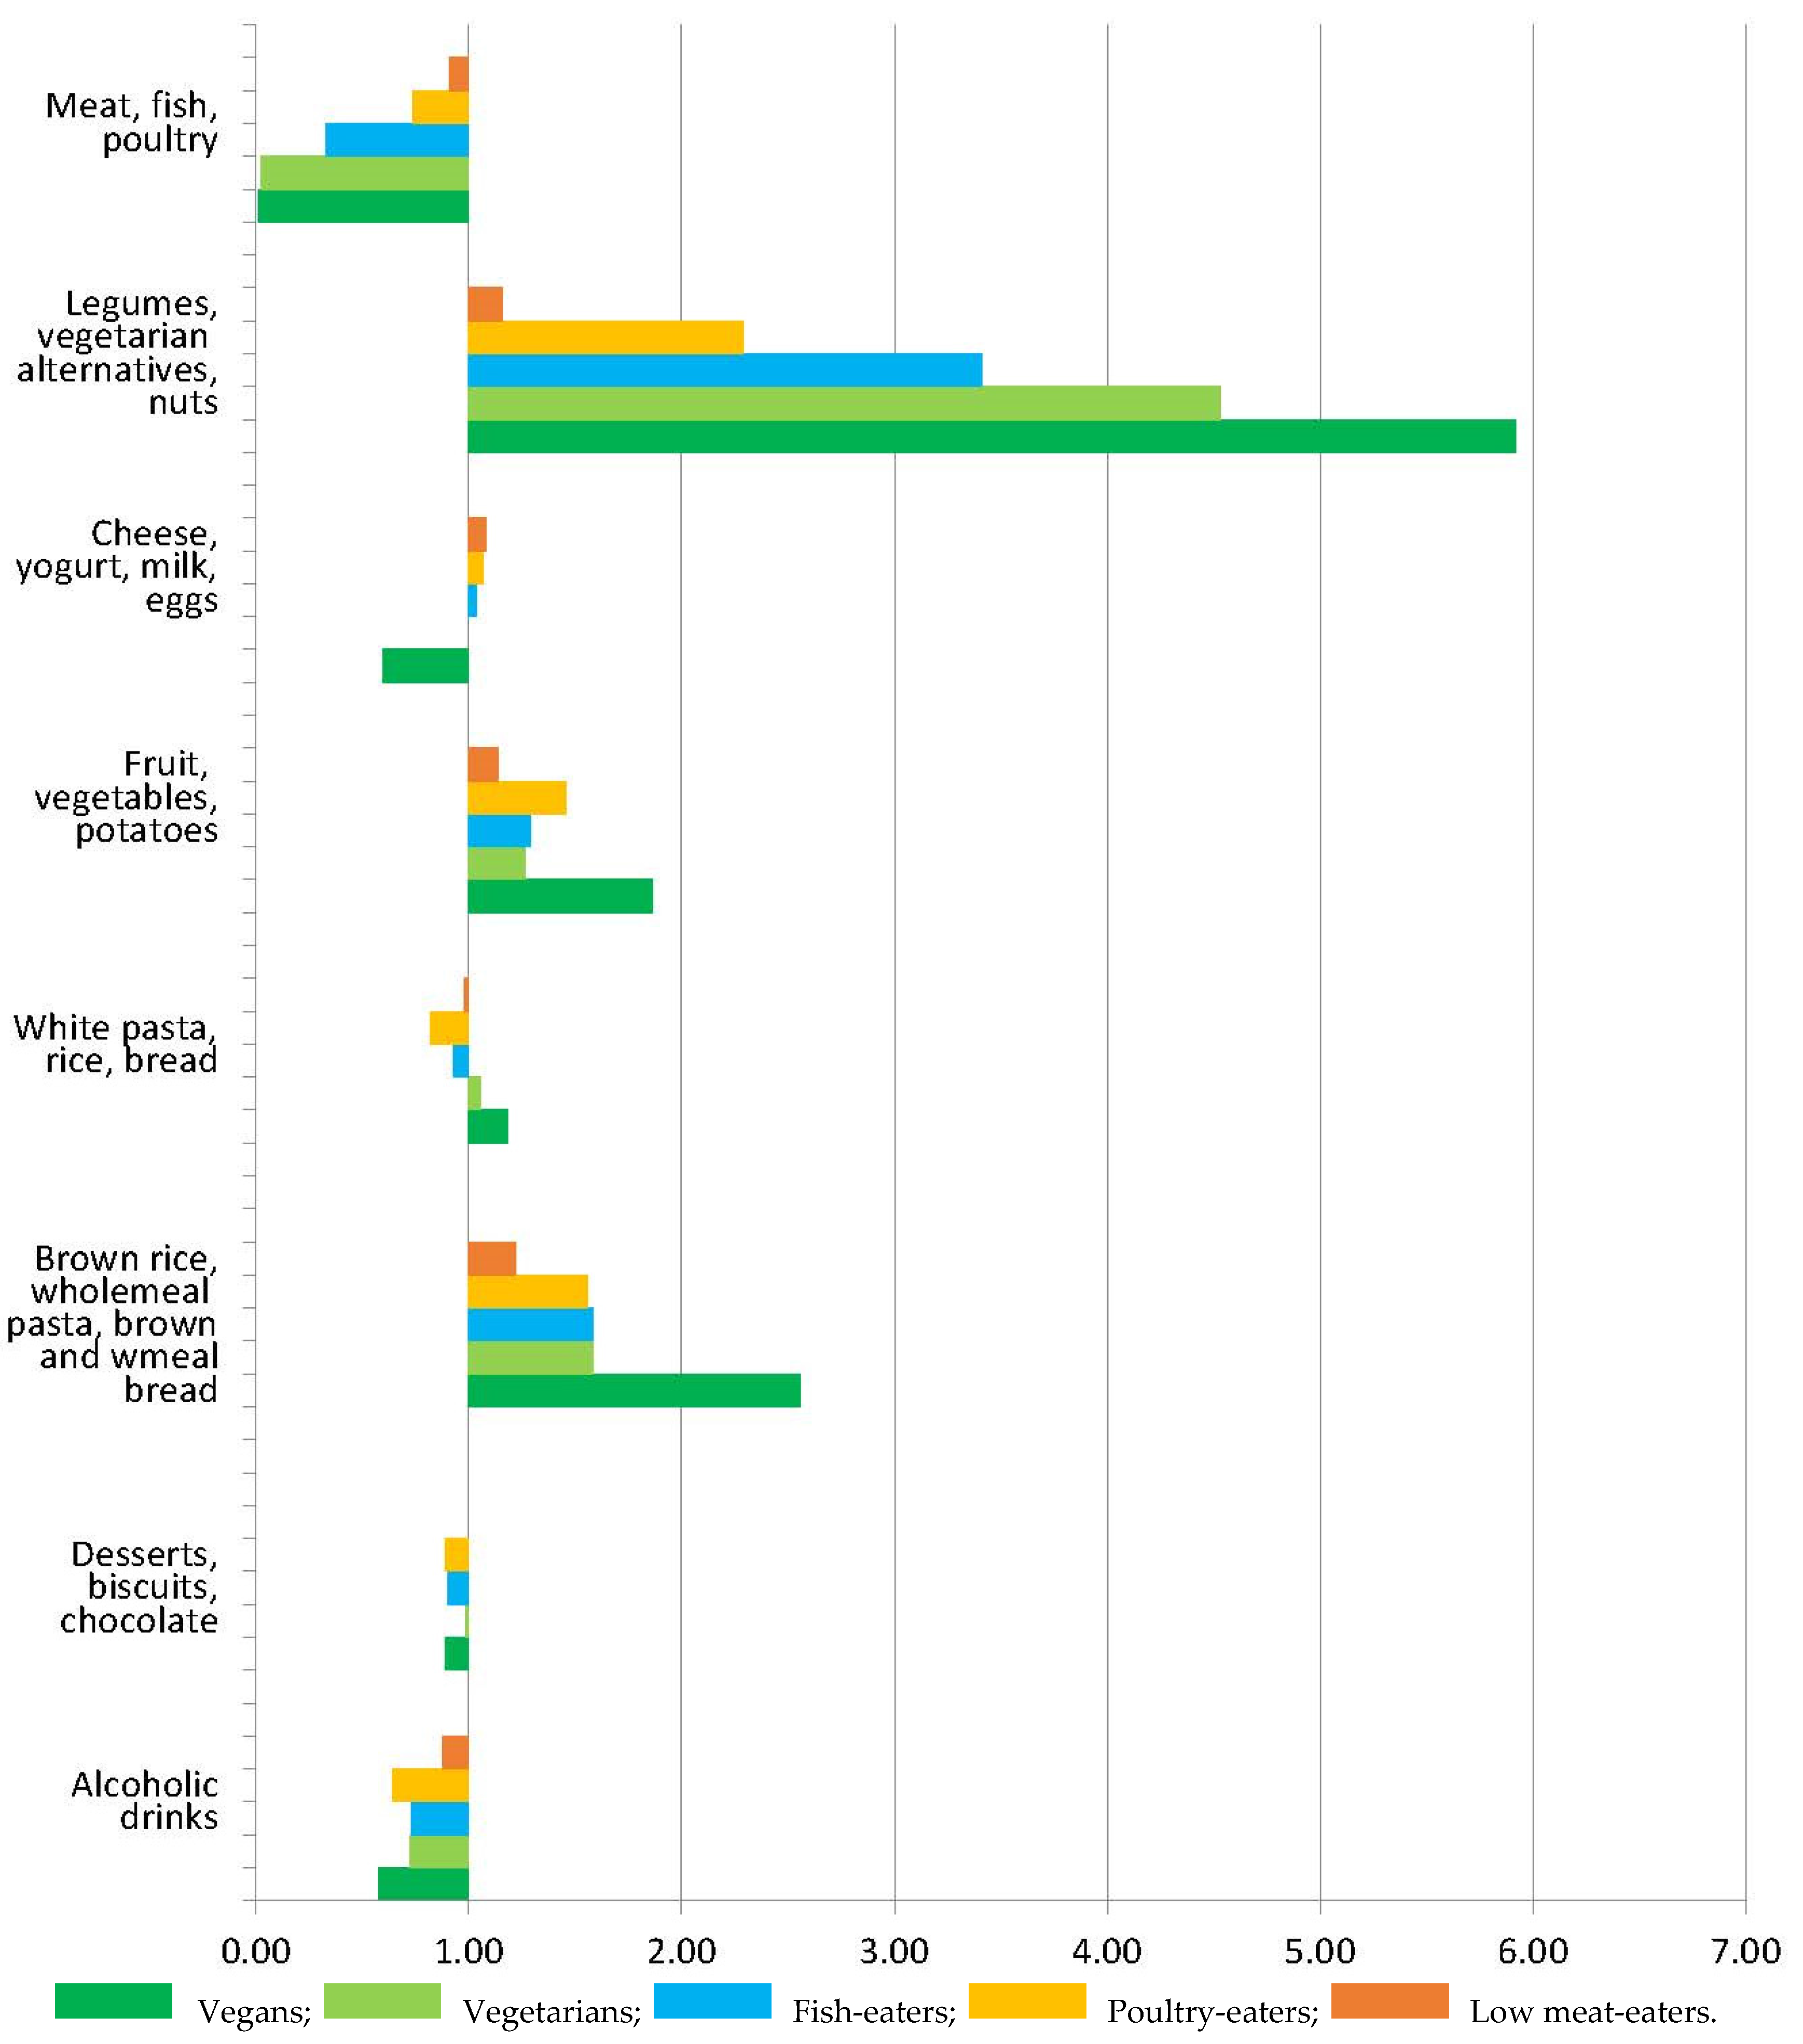
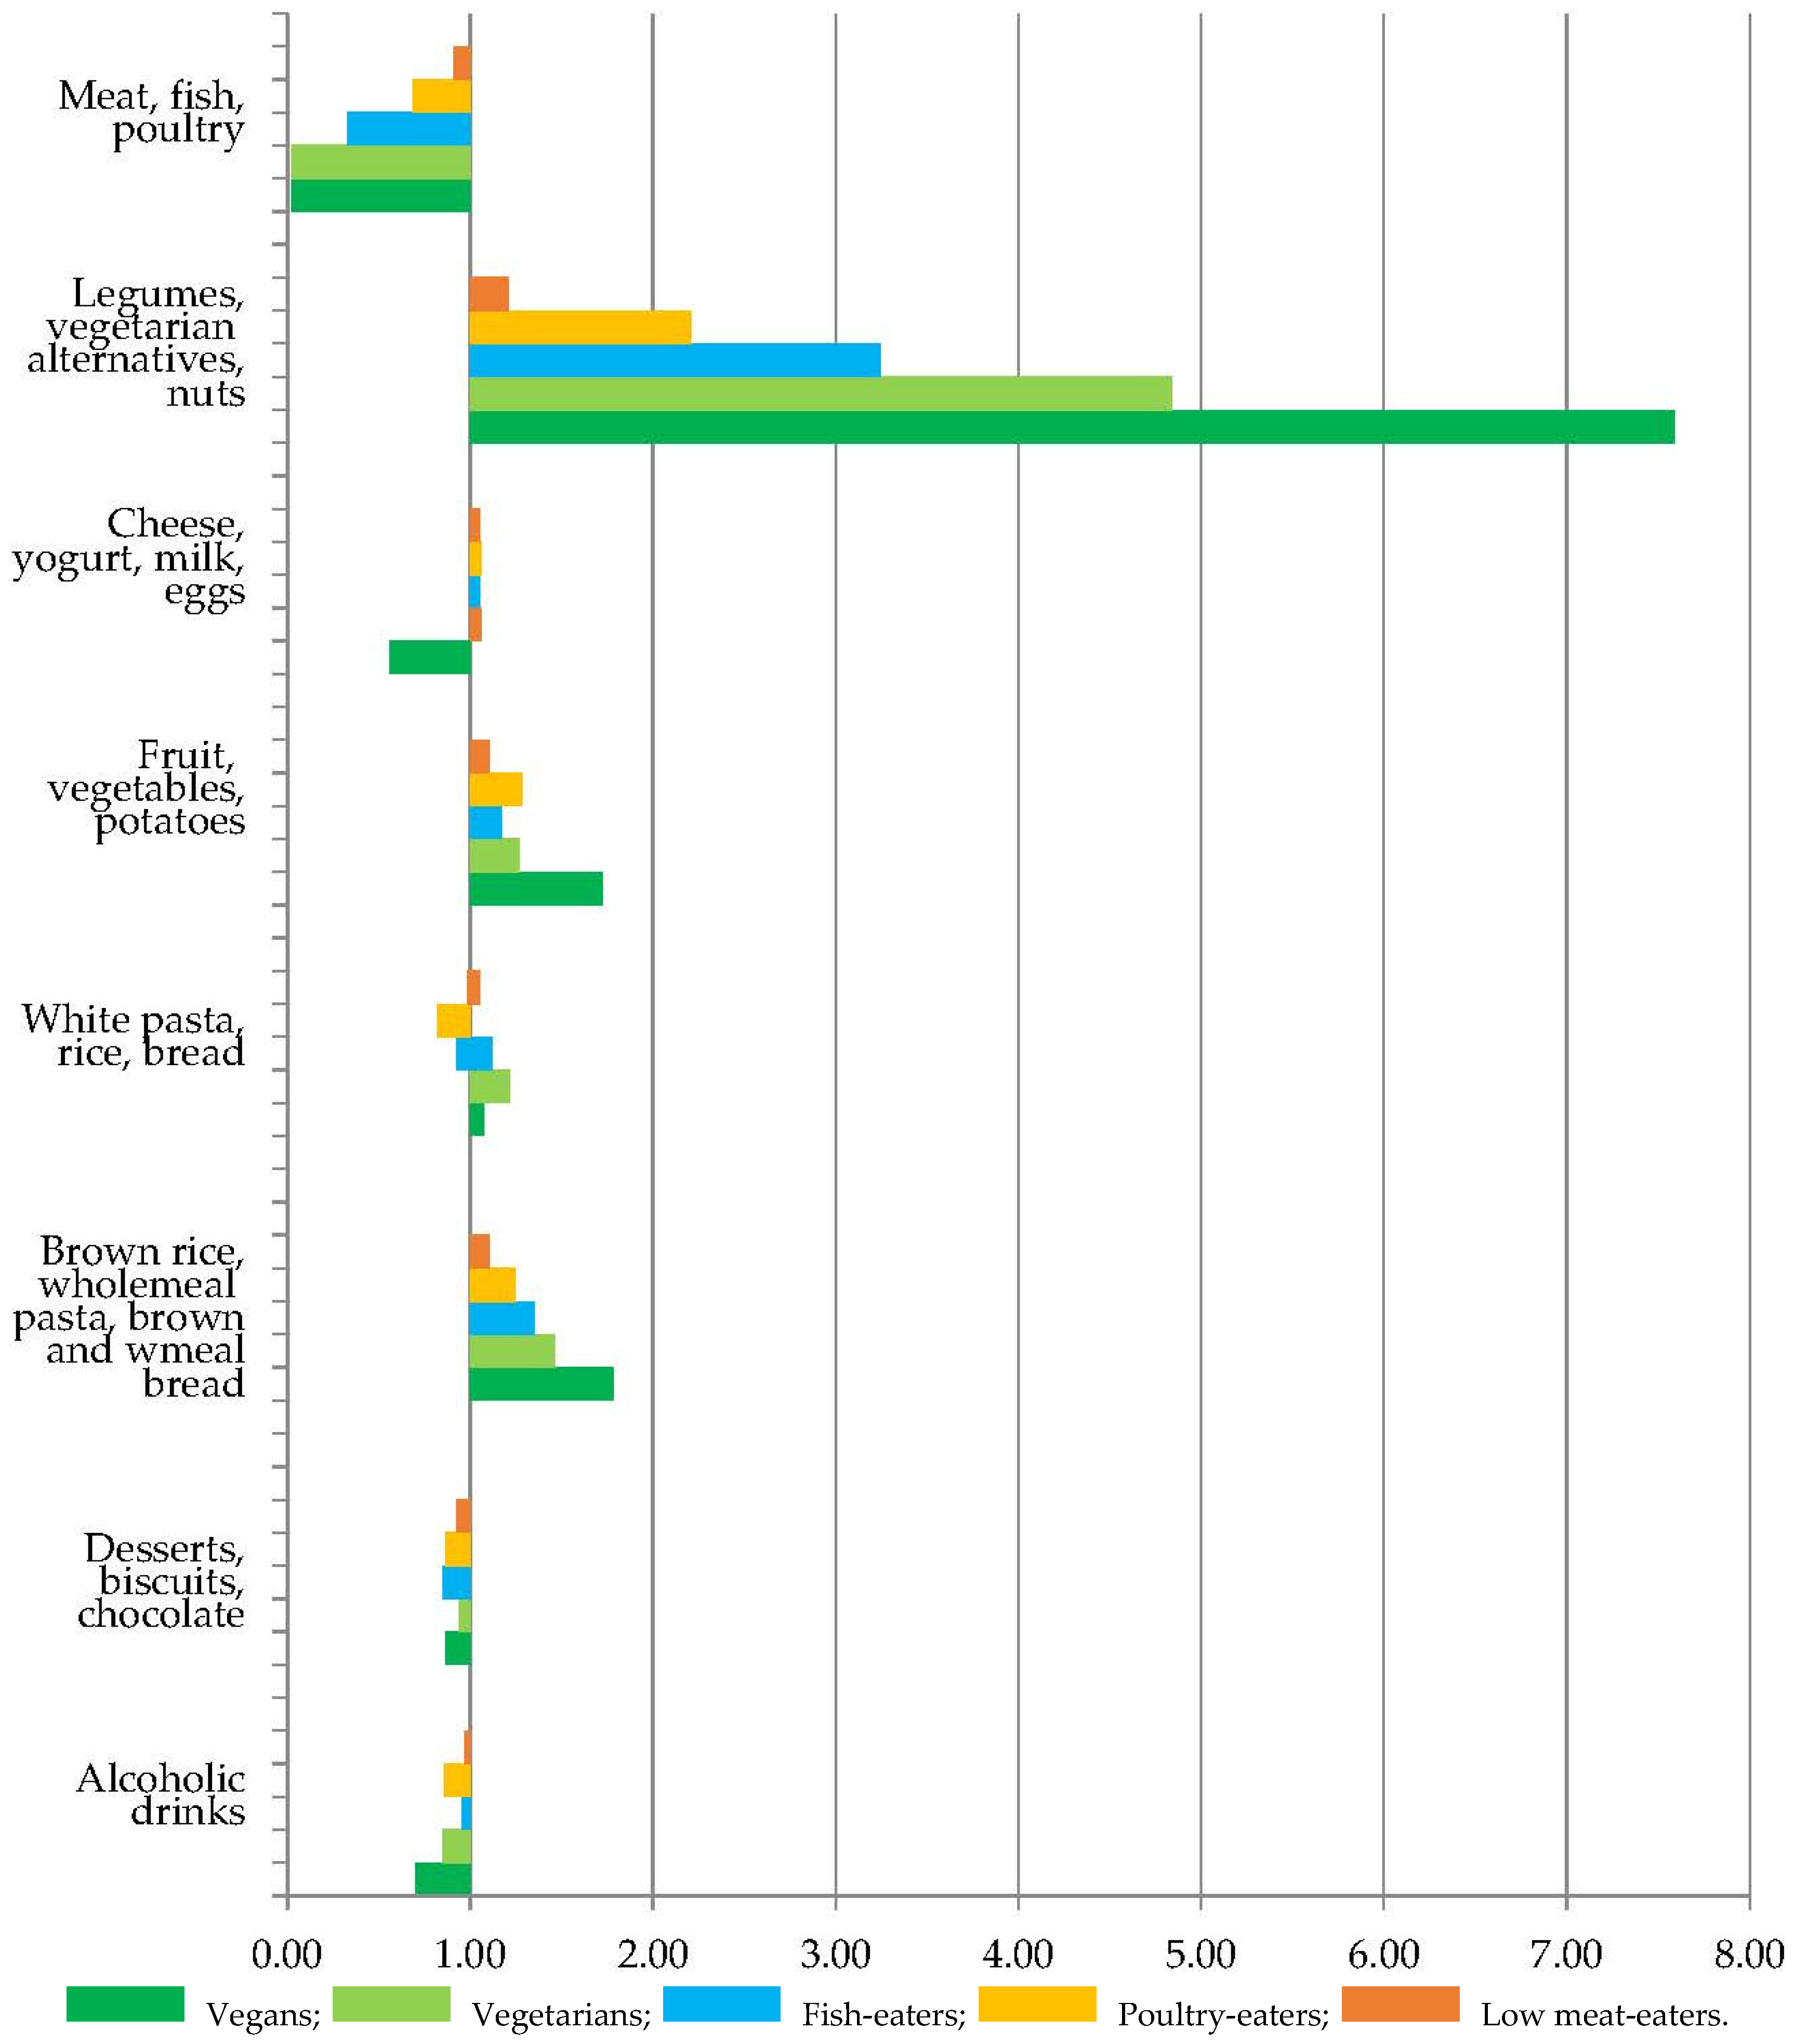
Figure 1 (men) and Figure 2 (women) show the relative mean consumption of broad food groups in the low- and non-meat eating groups, compared to the regular meat-eaters. Mean intakes (g) of the sum of legumes, vegetarian protein alternatives, and nuts were over 3-fold higher in fish-eaters, vegetarians, and vegans compared to regular meat-eaters. Mean intakes (g) of the sum of brown and wholemeal bread, wholemeal pasta, and brown rice were over 1.5 times higher in fish-eaters, vegetarians and vegans compared to regular meat-eaters.

4. Discussion

In this paper, we describe mean intakes of major food groups in six diet groups within UK Biobank. We found that regular meat-eaters consumed about a quarter of their total energy intake from high-protein source foods (meat, fish, milk, cheese, yoghurt, eggs, legumes, nuts, and vegetarian alternatives). In contrast vegetarians consumed about 20% and vegans around 15% of total energy from these high-protein source foods. We also found that vegetarians and vegans consumed more fruit, vegetables, wholemeal pasta and brown rice, and less fried or roast potatoes, than regular meat-eaters. Additionally, vegetarians consumed significantly more breakfast cereals, and pure fruit/vegetable juice and less sugar-sweetened beverages compared to regular meat-eaters.
The Adventist Health Study-2 is a cohort of Seventh-day Adventist men and women from the North America with large numbers of low and non-meat eating participants. Similar to our study, the Adventist Health Study-2 documented higher intakes of legumes, meat analogues, soyabeans and tofu, tree nuts, and soya milk and lower intakes of soda, fried potatoes, coffee and alcoholic beverages in the low and non-meat eating groups [9]. The Adventist Health Study-2 observed lower intakes of tea in their vegan, vegetarian and semi-vegetarian groups [9], whereas in UK Biobank there were no significant differences in tea intake between vegetarian and vegans and meat-eaters. This difference could be explained by the primary motivation underlying the choice to reduce or avoid meat in the low- and non-meat eating groups in the two cohorts; low- and non- meat eaters in the Adventist Health Study-2 are likely to be motivated by religious beliefs to avoid or reduce meat, alcohol, and caffeine containing drinks (including tea) [26]. We do not have information in UK Biobank on the religion of participants or on the underlying reasons and motivations for choosing a vegetarian or other low- or non-meat eating diet, however it is likely that there are a number of contributing motivators, including animal welfare, environmental concerns and taste preferences [27]. Nevertheless, in general we found dietary patterns in the non- and low meat-eaters participating in UK Biobank similar to those in the Adventist Health Study-2. Also in agreement with our results EPIC-Oxford a British cohort with large numbers of non-meat eaters, observed higher intakes of cheese, vegetables and fruit and lower intakes of dairy milk in vegetarians (n = 16,081) compared to non-vegetarians (n = 31,173), but did not examine intake of other food groups [28]. The NutriNet-Santé study in France has also compared food intakes between their meat-eaters (n = 90,664), vegetarian (n = 2370), and vegan (n = 789) participants. Similar to our findings, they found higher intakes of fruit, vegetables, legumes, and nuts, vegetarian patties, and textured soy protein products, and lower intakes of alcoholic beverages in the vegetarians and vegans; in addition, vegans had lower intakes of sugary drinks [8]. Another American study with a small number of vegetarians found higher intakes of legumes, fruit and vegetables, cereals, pasta, and wine in vegetarians (n = 120) compared to meat-eaters (n = 12,543) [12]. A study of different diet groups in Belgium reported higher fruit intakes in vegetarians (n = 573) and vegans (n = 104), and higher intakes of whole grains in vegetarians compared to meat-eaters (n = 155) [10]. A very small study of Finnish vegans (n = 22) and non-vegetarians (n = 15) similarly found higher intakes of legumes, and tofu and soy flour in vegans compared to non-vegetarians [11].
Strengths of this study include the large total sample size and the detailed collection of information on the actual food and beverages consumed by the participants. The web-based 24-h dietary assessment questionnaire allowed participants to select from over 200 food items and over 30 beverages to record dietary intake during the previous 24 h. Plant-based meat alternatives are represented in the questionnaire, including ‘soy burgers/sausages’, ‘tofu’, ‘Quorn’ (a mycoprotein-based food), and ‘other vegetarian alternative’. However, it is possible that the dietary assessment tool may not have captured all the plant based food items that non-meat eaters consume. A limitation is that for each item in the 24-h dietary assessments, participants were asked to select how many portions they consumed, for example the specified portion for apples was one apple. However, for some items such as pasta and rice, participants were asked how many ‘servings’ they consumed. It is possible that some low and non-meat eaters consume larger portions of foods such as pasta and rice than meat-eaters, and if so, we would not have captured this unless they selected multiple servings to reflect their larger portion. In addition, we classified participants into diet groups based on their answers to the dietary questions on the touchscreen questionnaire administered at recruitment. It is possible that some participants changed diet group by the time they completed one or more of the web-based 24-h dietary assessments. While some degree of misclassification is unavoidable, the very low mean intakes of red and processed meat reported in the 24-h dietary assessments by our non-meat eating groups suggest the diet groups stayed largely stable over the time period of the study. We averaged intakes of major food groups within each diet group, but it is possible that there are distinct dietary patterns within diet groups. However, it was beyond the scope of this report to explore different dietary patterns within a diet group. Finally, although the dietary assessment was recent—2010 to 2012—the range and availability of vegetarian and vegan food products is evolving and the food choices of low and non-meat eaters are likely to be changing.
There is a lot of interest in the impact of meat on health, for example in relation to colorectal cancer [29]. A vegetarian diet is defined by the absence of meat and fish, and previous studies have modeled the replacement of red meat with poultry and fish [13,15,16,17,18,19], dairy products [13,16,19], eggs [16], nuts [13,16,19], legumes [13,16,19], vegetables and potatoes [14], and wholegrains [19] in relation to disease outcomes. Our results can be used to inform realistic modeling scenarios. We found that that in this population, rather than eating an equivalent amount of energy from any other single high-protein food group, low and non-meat eaters are likely to consume more of a wide variety of different foods, including fruit and vegetables, brown rice, wholemeal bread, breakfast cereals, and pure fruit and vegetable juice. There were many differences in food intake between regular meat-eaters and low and non-meat eaters, regardless of whether we expressed daily food intake as percentage of total energy, absolute grams, or grams standardized to a 2000 kcal diet.
In addition to health implications, food choices also have environmental implications. The production of plant-based foods is generally associated with lower greenhouse gas emissions than the production of animal food products [30] and we have previously shown in EPIC-Oxford that the estimated greenhouse gas emissions from the production of foods consumed by fish-eaters, vegetarians, and vegans are lower than from the production of foods consumed by meat-eaters [31].

5. Conclusions

In conclusion, we examined the intakes of main protein source foods and other major food groups in a large contemporary cohort of white British people of different diet groups: regular meat-eaters, low meat-eaters, poultry-eaters, fish-eaters, vegetarians and vegans. Our results suggest that low- and non-meat eaters only partially replace red and processed meat with other high-protein source foods, and that they eat more of a variety of plant-based foods. These findings can be used to inform realistic dietary substitution analyses. As well as the absence or reduction of meat, the other differences in food choices between low- and non-meat eating diets may contribute to differences in health outcomes between diet groups.

Supplementary Materials

The following are available online at https://0-www-mdpi-com.brum.beds.ac.uk/2072-6643/9/12/1317/s1, Table S1: Food items within each major protein source food group, Table S2: Food items within each food group.

Acknowledgments

This research has been conducted using the UK Biobank Resource under Application Number 3037. This work was supported by the Girdlers’ New Zealand Health Research Council Fellowship (KEB), the UK Medical Research Council (TJK and TYNT; MR/M012190/1) and the Wellcome Trust (TJK, Our Planet Our Health, project: Livestock, Environment and People (LEAP)). The cost to publish in open access was covered by the Wellcome Trust block grant to the University of Oxford open access fund.

Author Contributions

K.E.B., T.Y.N.T., T.J.K. designed the study, K.E.B. and T.Y.N.T. analysed the data, K.E.B., T.Y.N.T., T.J.K. interpreted the results, wrote and revised the paper.

Conflicts of Interest

T.J.K. is a member of the Vegan Society. K.E.B. and T.Y.N.T. have no conflict of interest. The funders had no role in the design of the study; in the collection, analyses, or interpretation of data; in the writing of the manuscript, or in the decision to publish the results.

References

  1. Crowe, F.L.; Appleby, P.N.; Travis, R.C.; Key, T.J. Risk of hospitalization or death from ischemic heart disease among British vegetarians and nonvegetarians: Results from the EPIC-Oxford cohort study. Am. J. Clin. Nutr. 2013, 97, 597–603. [Google Scholar] [CrossRef] [PubMed]
  2. Key, T.J.; Appleby, P.N.; Crowe, F.L.; Bradbury, K.E.; Schmidt, J.A.; Travis, R.C. Cancer in British vegetarians: Updated analyses of 4998 incident cancers in a cohort of 32,491 meat eaters, 8612 fish eaters, 18,298 vegetarians, and 2246 vegans. Am. J. Clin. Nutr. 2014, 100 (Suppl. 1), 378S–385S. [Google Scholar] [CrossRef] [PubMed]
  3. Orlich, M.J.; Singh, P.N.; Sabate, J.; Fan, J.; Sveen, L.; Bennett, H.; Knutsen, S.F.; Beeson, W.L.; Jaceldo-Siegl, K.; Butler, T.L.; et al. Vegetarian dietary patterns and the risk of colorectal cancers. JAMA Intern. Med. 2015, 175, 767–776. [Google Scholar] [CrossRef] [PubMed]
  4. Davey, G.K.; Spencer, E.A.; Appleby, P.N.; Allen, N.E.; Knox, K.H.; Key, T.J. EPIC-Oxford: Lifestyle characteristics and nutrient intakes in a cohort of 33 883 meat-eaters and 31 546 non meat-eaters in the UK. Public Health Nutr. 2003, 6, 259–269. [Google Scholar] [CrossRef] [PubMed]
  5. Rizzo, N.S.; Jaceldo-Siegl, K.; Sabate, J.; Fraser, G.E. Nutrient profiles of vegetarian and nonvegetarian dietary patterns. J. Acad. Nutr. Diet. 2013, 113, 1610–1619. [Google Scholar] [CrossRef] [PubMed]
  6. Schupbach, R.; Wegmuller, R.; Berguerand, C.; Bui, M.; Herter-Aeberli, I. Micronutrient status and intake in omnivores, vegetarians and vegans in Switzerland. Eur. J. Nutr. 2017, 56, 283–293. [Google Scholar] [CrossRef] [PubMed]
  7. Sobiecki, J.G.; Appleby, P.N.; Bradbury, K.E.; Key, T.J. High compliance with dietary recommendations in a cohort of meat eaters, fish eaters, vegetarians, and vegans: Results from the European Prospective Investigation into Cancer and Nutrition-Oxford study. Nutr. Res. 2016, 36, 464–477. [Google Scholar] [CrossRef] [PubMed]
  8. Alles, B.; Baudry, J.; Mejean, C.; Touvier, M.; Peneau, S.; Hercberg, S.; Kesse-Guyot, E. Comparison of sociodemographic and nutritional characteristics between self-reported vegetarians, vegans, and meat-eaters from the Nutrinet-Sante study. Nutrients 2017, 9, 1023. [Google Scholar] [CrossRef] [PubMed]
  9. Orlich, M.J.; Jaceldo-Siegl, K.; Sabate, J.; Fan, J.; Singh, P.N.; Fraser, G.E. Patterns of food consumption among vegetarians and non-vegetarians. Br. J. Nutr. 2014, 112, 1644–1653. [Google Scholar] [CrossRef] [PubMed]
  10. Clarys, P.; Deliens, T.; Huybrechts, I.; Deriemaeker, P.; Vanaelst, B.; De Keyzer, W.; Hebbelinck, M.; Mullie, P. Comparison of nutritional quality of the vegan, vegetarian, semi-vegetarian, pesco-vegetarian and omnivorous diet. Nutrients 2014, 6, 1318–1332. [Google Scholar] [CrossRef] [PubMed] [Green Version]
  11. Elorinne, A.L.; Alfthan, G.; Erlund, I.; Kivimaki, H.; Paju, A.; Salminen, I.; Turpeinen, U.; Voutilainen, S.; Laakso, J. Food and nutrient intake and nutritional status of Finnish vegans and non-vegetarians. PLoS ONE 2016, 11, e0148235. [Google Scholar] [CrossRef] [PubMed]
  12. Haddad, E.H.; Tanzman, J.S. What do vegetarians in the United States eat? Am. J. Clin. Nutr. 2003, 78, 626S–632S. [Google Scholar] [PubMed]
  13. Bernstein, A.M.; Sun, Q.; Hu, F.B.; Stampfer, M.J.; Manson, J.E.; Willett, W.C. Major dietary protein sources and risk of coronary heart disease in women. Circulation 2010, 122, 876–883. [Google Scholar] [CrossRef] [PubMed]
  14. Wurtz, A.M.; Hansen, M.D.; Tjonneland, A.; Rimm, E.B.; Schmidt, E.B.; Overvad, K.; Jakobsen, M.U. Substitution of meat and fish with vegetables or potatoes and risk of myocardial infarction. Br. J. Nutr. 2016, 116, 1602–1610. [Google Scholar] [CrossRef] [PubMed]
  15. Wurtz, A.M.; Hansen, M.D.; Tjonneland, A.; Rimm, E.B.; Schmidt, E.B.; Overvad, K.; Jakobsen, M.U. Substitutions of red meat, poultry and fish and risk of myocardial infarction. Br. J. Nutr. 2016, 115, 1571–1578. [Google Scholar] [CrossRef] [PubMed]
  16. Bernstein, A.M.; Pan, A.; Rexrode, K.M.; Stampfer, M.; Hu, F.B.; Mozaffarian, D.; Willett, W.C. Dietary protein sources and the risk of stroke in men and women. Stroke 2012, 43, 637–644. [Google Scholar] [CrossRef] [PubMed]
  17. Daniel, C.R.; Cross, A.J.; Graubard, B.I.; Hollenbeck, A.R.; Park, Y.; Sinha, R. Prospective investigation of poultry and fish intake in relation to cancer risk. Cancer Prev. Res. (Phila) 2011, 4, 1903–1911. [Google Scholar] [CrossRef] [PubMed]
  18. Etemadi, A.; Sinha, R.; Ward, M.H.; Graubard, B.I.; Inoue-Choi, M.; Dawsey, S.M.; Abnet, C.C. Mortality from different causes associated with meat, heme iron, nitrates, and nitrites in the NIH-AARP diet and health study: Population based cohort study. BMJ 2017, 357, j1957. [Google Scholar] [CrossRef] [PubMed]
  19. Pan, A.; Sun, Q.; Bernstein, A.M.; Schulze, M.B.; Manson, J.E.; Stampfer, M.J.; Willett, W.C.; Hu, F.B. Red meat consumption and mortality: Results from 2 prospective cohort studies. Arch. Intern. Med. 2012, 172, 555–563. [Google Scholar] [PubMed]
  20. Collins, R. What makes UK Biobank special? Lancet 2012, 379, 1173–1174. [Google Scholar] [CrossRef]
  21. UK Biobank Coordinating Centre. UK Biobank: Protocol for a large-scale prospective epidemiological resource. Protocol No: UKBB-PROT-09-06 (Main Phase). UK Biobank Coordinating Centre: Stockport, UK, 2007. Available online: http://www.ukbiobank.ac.uk/wp-content/uploads/2011/11/UK-Biobank-Protocol.pdf (accessed on 30 November 2017).
  22. UK Biobank Coordinating Centre. UK Biobank touchscreen questionnaire. UK Biobank Coordinating Centre: Stockport, UK. Available online: http://www.ukbiobank.ac.uk/wp-content/uploads/2011/06/Touch_screen_questionnaire.pdf?phpMyAdmin=trmKQlYdjjnQIgJ%2CfAzikMhEnx6 (accessed on 30 November 2017).
  23. UK Biobank Coordinating Centre. Addendum to Main Study Protocol: Category 1 Enhanced Phenotyping at Baseline Assessment Visit in Last 200,000 Participants and Subsequent Invitation to Complete Web-Based Diet Questionnaire; UK Biobank Coordinating Centre: Stockport, UK, 2009. [Google Scholar]
  24. Galante, J.; Adamska, L.; Young, A.; Young, H.; Littlejohns, T.J.; Gallacher, J.; Allen, N. The acceptability of repeat internet-based hybrid diet assessment of previous 24-h dietary intake: Administration of the Oxford WebQ in UK Biobank. Br. J. Nutr. 2016, 115, 681–686. [Google Scholar] [CrossRef] [PubMed]
  25. Liu, B.; Young, H.; Crowe, F.L.; Benson, V.S.; Spencer, E.A.; Key, T.J.; Appleby, P.N.; Beral, V. Development and evaluation of the Oxford WebQ, a low-cost, web-based method for assessment of previous 24 h dietary intakes in large-scale prospective studies. Public Health Nutr. 2011, 14, 1998–2005. [Google Scholar] [CrossRef] [PubMed]
  26. Butler, T.L.; Fraser, G.E.; Beeson, W.L.; Knutsen, S.F.; Herring, R.P.; Chan, J.; Sabate, J.; Montgomery, S.; Haddad, E.; Preston-Martin, S.; et al. Cohort profile: The Adventist Health Study-2 (AHS-2). Int. J. Epidemiol. 2008, 37, 260–265. [Google Scholar] [CrossRef] [PubMed]
  27. Povey, R.; Wellens, B.; Conner, M. Attitudes towards following meat, vegetarian and vegan diets: An examination of the role of ambivalence. Appetite 2001, 37, 15–26. [Google Scholar] [CrossRef] [PubMed]
  28. Key, T.J.; Appleby, P.N.; Spencer, E.A.; Travis, R.C.; Roddam, A.W.; Allen, N.E. Mortality in British vegetarians: Results from the European Prospective Investigation into Cancer and Nutrition (EPIC-Oxford). Am. J. Clin. Nutr. 2009, 89, 1613S–1619S. [Google Scholar] [CrossRef] [PubMed]
  29. Bouvard, V.; Loomis, D.; Guyton, K.Z.; Grosse, Y.; Ghissassi, F.E.; Benbrahim-Tallaa, L.; Guha, N.; Mattock, H.; Straif, K.; International Agency for Research on Cancer Monograph Working Group. Carcinogenicity of consumption of red and processed meat. Lancet Oncol. 2015, 16, 1599–1600. [Google Scholar] [CrossRef]
  30. Gonzalez, A.D.; Frostell, B.; Carlsson-Kanyama, A. Protein efficiency per unit energy and per unit greenhouse gas emissions: Potential contribution of diet choices to climate change mitigation. Food Policy 2011, 36, 562–570. [Google Scholar] [CrossRef]
  31. Scarborough, P.; Appleby, P.N.; Mizdrak, A.; Briggs, A.D.; Travis, R.C.; Bradbury, K.E.; Key, T.J. Dietary greenhouse gas emissions of meat-eaters, fish-eaters, vegetarians and vegans in the UK. Clim. Chang. 2014, 125, 179–192. [Google Scholar] [CrossRef] [PubMed]
Figure 1. Relative consumption of food groups (g) in low meat-eaters, poultry-eaters, fish-eaters, vegetarian, and vegan men compared to regular meat-eaters. The mean consumption relative to regular meat-eaters (1.00) is shown for each food group after adjustment for age.
Nutrients 09 01317 g001
Figure 2. Relative consumption of food groups (g) in low meat-eaters, poultry-eaters, fish-eaters, vegetarian, and vegan women compared to regular meat-eaters. The mean consumption relative to regular meat-eaters (1.00) is shown for each food group after adjustment for age.
Nutrients 09 01317 g002
Table 1. Characteristics of men in UK Biobank by diet group.
Diet Group 1
Regular Meat-EatersLow Meat-EatersPoultry-EatersFish-EatersVegetarianVegan
Characteristicn = 51,144n = 35,235n = 508n = 1560n = 1243n = 102
Age (years)56.8 (8.0)57.2 (7.9)57.0 (8.1)54.1 (7.8)52.6 (7.7)53.1 (7.5)
College or University degree 242.2 (21,557)44.7 (15,764)51.4 (261)64.6 (1007)63.9 (794)47.1 (48)
Current smokers 210.2 (5238)7.5 (2648)5.7 (29)7.2 (112)8.3 (103)8.8 (9)
Height (cm)176.6 (6.7)176.5 (6.6)176.8 (7.0)177.3 (6.7)177.2 (6.5)177.5 (7.3)
BMI (kg/m2)27.8 (4.2)27.1 (3.9)25.7 (3.9)25.5 (3.5)25.7 (3.8)24.7 (3.3)
Body fat (%)25.2 (5.7)24.3 (5.6)22.1 (6.1)21.8 (5.8)22.3 (5.7)21.0 (5.7)
High level of physical activity 2,318.0 (9213)18.7 (6572)24.8 (126)20.7 (323)19.3 (240)22.6 (23)
Values are mean (SD) unless otherwise stated. 1 High meat-eaters are those that reported eating the total of red and processed meat three or more times a week, low meat-eaters reported eating the total of red and processed meat fewer than three times a week, poultry-eaters reported eating poultry but no red or processed meat, fish-eaters reported eating fish but no red or processed meat or poultry, vegetarians did not report eating red or processed meat, poultry or fish, and vegans additionally reported never eating eggs or foods containing eggs or dairy products; 2 Values are percent (number); 3 Defined as 50 or more excess metabolic equivalent hours per week.
Table 2. Characteristics of women in UK Biobank by diet group.
Diet Group 1
Regular Meat-EatersLow Meat-EatersPoultry-EatersFish-EatersVegetarianVegan
Characteristicn = 39,598n = 61,889n = 1751n = 4141n = 2627n = 146
Age (years)55.9 (7.9)56.0 (7.7)56.0 (7.9)53.9 (7.8)52.5 (7.8)53.5 (8.2)
College or University degree 237.9 (14,992)40.7 (25,190)47.2 (826)59.0 (2444)58.4 (1533)58.9 (86)
Current smokers 27.0 (2758)6.6 (4057)5.5 (96)5.9 (243)5.8 (151)7.5 (11)
Height (cm)163.3 (6.1)163.4 (6.2)163.3 (6.2)164.2 (6.2)163.9 (6.0)163.4 (6.1)
BMI (kg/m2)27.2 (5.2)26.3 (4.8)24.8 (4.5)24.8 (4.4)25.0 (4.8)24.1 (4.9)
Body fat (%)36.8 (6.8)35.6 (6.8)33.0 (7.2)33.0 (7.0)33.3 (7.4)31.1 (7.8)
High level of physical activity 2,314.6 (5775)15.8 (9792)20.7 (362)19.0 (787)18.5 (485)21.2 (31)
Values are mean (SD) unless otherwise stated. 1 High meat-eaters are those that reported eating the total of red and processed meat three or more times a week, low meat-eaters reported eating the total of red and processed meat fewer than three times a week, poultry-eaters reported eating poultry but no red or processed meat, fish-eaters reported eating fish but no red or processed meat or poultry, vegetarians did not report eating red or processed meat, poultry or fish, and vegans additionally reported never eating eggs or foods containing eggs or dairy products; 2 Values are percent (number); 3 Defined as 50 or more excess metabolic equivalent hours per week.
Table 3. Intakes of major protein source foods in men in UK Biobank by diet group.
Total Energy IntakeDiet Group 1p for Difference
Regular Meat-EatersLow Meat-EatersPoultry-EatersFish-EatersVegetarianVegan
n = 51,144n = 35,235n = 508n = 1560n = 1243n = 102
231021682164224622592037<0.0001
Major protein source food
Red meat
 g/day50.436.64.50.80.80.1<0.0001
 g/2000 kcal/day 245.034.94.11.11.00.2<0.0001
 % of energy4.73.60.40.10.10.0<0.0001
Processed meat
 g/day25.215.73.20.4--<0.0001
 g/2000 kcal/day 222.114.62.80.6--<0.0001
 % of energy2.51.60.30.1--<0.0001
Poultry
 g/day36.035.937.9---<0.0001
 g/2000 kcal/day 232.534.436.0---<0.0001
 % of energy3.23.33.4---<0.0001
Oily fish
 g/day9.612.525.719.11.20.6<0.0001
 g/2000 kcal/day 28.611.924.018.01.30.6<0.0001
 % of energy1.01.32.72.10.10.1<0.0001
Non-oily fish
 g/day16.116.623.521.80.60.4<0.0001
 g/2000 kcal/day 214.716.223.721.10.90.8<0.0001
 % of energy1.21.21.71.5--<0.0001
Legumes/pulses
 g/day15.515.320.72733.152.1<0.0001
 g/2000 kcal/day 213.814.520.224.93251.2<0.0001
 % of energy0.60.71.01.31.62.7<0.0001
Vegetarian protein alternatives
 g/day1.22.816.738.454.156.3<0.0001
 g/2000 kcal/day 21.12.616.333.648.252.8<0.0001
 % of energy0.10.21.12.63.44.0<0.0001
Nuts
 g/day5.56.29.18.79.014.5<0.0001
 g/2000 kcal/day 24.45.27.77.37.310.3<0.0001
 % of energy1.11.31.91.91.92.7<0.0001
Cheese 3
 g/day17.717.118.025.930.76.1<0.0001
 g/2000 kcal/day 215.415.716.423.227.66.1<0.0001
 % of calories2.82.92.84.25.01.1<0.0001
Yogurt 3
 g/day33.039.347.540.436.430.5<0.0001
 g/2000 kcal/day 230.438.547.538.834.733.2<0.0001
 % of energy1.21.51.81.61.41.3<0.0001
Dairy milk
 g/day22121918918116514<0.0001
 g/2000 kcal/day 220221418317215533<0.0001
 % of energy4.74.84.03.92.50.7<0.0001
Plant milk
 g/day4722263386<0.0001
 g/2000 kcal/day 24723253286<0.0001
 % of energy0.10.10.40.50.61.8<0.0001
Eggs
 g/day22.119.821.225.323.52.9<0.0001
 g/2000 kcal/day 219.318.019.522.420.74.4<0.0001
 % of energy1.71.61.721.80.4<0.0001
Total % of calories from
 Meat and fish12.611.08.53.80.20.1
 Dairy and plant milk4.84.94.44.43.12.5
 Cheese, yogurt 3 and eggs5.76.06.37.88.22.8
 Legumes, nuts and vegetarian alternatives1.82.24.05.86.99.4
 Total major protein source foods24.924.123.221.818.414.8
All values are adjusted for age. 1 High meat-eaters are those that reported eating the total of red and processed meat three or more times a week, low meat-eaters reported eating the total of red and processed meat fewer than three times a week, poultry-eaters reported eating poultry but no red or processed meat, fish-eaters reported eating fish but no red or processed meat or poultry, vegetarians did not report eating red or processed meat, or poultry or fish, and vegans additionally reported never eating eggs or foods containing eggs and dairy products; 2 Intakes are standardised to 2000 kcal/day (8368 kJ/day); 3 The questionnaire did not specify whether cheese or yogurt was dairy or plant-based (i.e., soy). Vegans who selected cheese or yogurt are likely to have consumed plant-based products.
Table 4. Intakes of major protein source foods in women in UK Biobank by diet group.
Total Energy IntakeDiet Group 1p for Difference
Regular Meat-EatersLow Meat-EatersPoultry-EatersFish-EatersVegetarianVegan
n = 39,598n = 61,889n = 1751n = 4141n = 2627n = 146
199718891842191319011842<0.0001
Major protein source food
Red meat
 g/day44.431.14.31.40.61.3<0.0001
 g/2000 kcal/day 246.333.84.91.50.70.9<0.0001
 % of energy4.73.40.50.20.10.1<0.0001
Processed meat
 g/day18.712.72.90.6-0.1<0.0001
 g/2000 kcal/day 219.313.83.30.7-0.0<0.0001
 % of energy2.11.50.30.1--<0.0001
Poultry
 g/day35.635.333.80.9-0.2<0.0001
 g/2000 kcal/day 237.139.2391.1-1.0<0.0001
 % of energy3.53.73.60.1-0.1<0.0001
Oily fish
 g/day10.112.218.118.01.00.8<0.0001
 g/2000 kcal/day 210.413.320.319.31.10.8<0.0001
 % of energy1.11.52.32.20.10.1<0.0001
Non-oily fish
 g/day14.815.518.418.70.80.5<0.0001
 g/2000 kcal/day 215.717.621.720.70.90.5<0.0001
 % of energy1.21.31.51.40.1-<0.0001
Legumes/pulses
 g/day11.912.717.520.928.744.8<0.0001
 g/2000 kcal/day 212.41419.322.831.551.9<0.0001
 % of energy0.60.71.01.21.62.8<0.0001
Vegetarian protein alternatives
 g/day1.42.612.826.743.864.7<0.0001
 g/2000 kcal/day 21.42.813.728.347.471.9<0.0001
 % of energy0.10.20.12.03.15.0<0.0001
Nuts
 g/day4.44.96.77.27.712.4<0.0001
 g/2000 kcal/day 24.14.86.66.97.712.0<0.0001
 % of energy1.01.21.61.71.92.9<0.0001
Cheese 3
 g/day16.416.518.424.228.77.2<0.0001
 g/2000 kcal/day 216.6617.620.125.730.88.2<0.0001
 % of energy2.93.03.34.35.11.4<0.0001
Yogurt 3
 g/day45.952.459.954.954.124.5<0.0001
 g/2000 kcal/day 249.459.370.561.161.427.3<0.0001
 % of energy1.92.32.72.42.41.0<0.0001
Dairy milk
 g/day21420217117916522<0.0001
 g/2000 kcal/day 222622619519618526<0.0001
 % of energy5.05.04.34.44.10.6<0.0001
Plant milk
 g/day7.512.328.226.737.296.8<0.0001
 g/2000 kcal/day 28.113.831.629.642.1118<0.0001
 % of energy0.20.30.60.60.82.4<0.0001
Eggs
 g/day20.419.423.122.520.11.1<0.0001
 g/2000 kcal/day 220.720.624.123.621.41.3<0.0001
 % of energy1.91.92.22.21.90.1<0.0001
Total % of calories from
 Meat and fish12.611.48.23.90.30.2
 Dairy and plant milk5.25.34.95.04.93.0
 Cheese, yogurt 3 and eggs6.77.28.28.99.42.5
 Legumes, nuts and vegetarian alternatives1.72.12.74.96.610.7
 Total major protein source foods26.226.024.022.721.216.4
All values are adjusted for age. 1 High meat-eaters are those that reported eating the total of red and processed meat three or more times a week, low meat-eaters reported eating the total of red and processed meat fewer than three times a week, poultry-eaters reported eating poultry but no red or processed meat, fish-eaters reported eating fish but no red or processed meat or poultry, vegetarians did not report eating red or processed meat, or poultry or fish, and vegans additionally reported never eating eggs or foods containing eggs and dairy products; 2 Intakes (g) are standardised to 2000 kcal/day (8368 kJ/day); 3 The questionnaire did not specify whether cheese or yogurt was dairy or plant-based (i.e., soy). Vegans who selected cheese or yogurt are likely to have consumed plant-based products.
Table 5. Intakes of other food groups in White British men in UK Biobank by diet group.
Food GroupDiet Group 1p for Difference
Regular Meat-EatersLow Meat-EatersPoultry-EatersFish-EatersVegetarianVegan
n = 51,382n = 35,235n = 508n = 1560n = 1243n = 102
Fruit
 g/day165192260217200270<0.0001
 g/2000 kcal/day 2159200275219204299<0.0001
Vegetables
 g/day170179237232237359<0.0001
 g/2000 kcal/day 2153171227217219360<0.0001
Potatoes—baked/boiled or mashed
 g/day5553575655600.0005
 g/2000 kcal/day 25051555351580.23
Potatoes—roast or fried
 g/day393019222819<0.0001
 g/2000 kcal/day 2312516182316<0.0001
White pasta
 g/day232521303130<0.0001
 g/2000 kcal/day 2212421283034<0.0001
Wholemeal pasta
 g/day461211920<0.0001
 g/2000 kcal/day 2361110819<0.0001
White rice
 g/day1515151415180.8764
 g/2000 kcal/day 21415151415230.0006
Brown rice
 g/day3367623<0.0001
 g/2000 kcal/day 22366620<0.0001
Sliced white bread
 g/day23169101410<0.0001
 g/2000 kcal/day 2201599138<0.0001
Sliced brown bread
 g/day1919162021180.0237
 g/2000 kcal/day 21718151919200.0031
Sliced wholemeal bread
 g/day212433343446<0.0001
 g/2000 kcal/day 2192332303246<0.0001
Other bread
 g/day121314181817<0.0001
 g/2000 kcal/day 2101112161618<0.0001
Porridge
 g/day263455393048<0.0001
 g/2000 kcal/day 2243457382856<0.0001
Breakfast cereals
 g/day252931373433<0.0001
 g/2000 kcal/day 2222729343132<0.0001
Ice-cream 3
 g/day15131011115<0.0001
 g/2000 kcal/day 2121299106<0.0001
Milk-based desserts
 g/day121299105<0.0001
 g/2000 kcal/day 2101098920.0005
Soya desserts
 g/day0112212<0.0001
 g/2000 kcal/day 20011213<0.0001
Other desserts
 g/day212017202215<0.0001
 g/2000 kcal/day 21818151819130.04
Chocolate
 g/day1099885<0.0001
 g/2000 kcal/day 2888776<0.0001
Biscuits/cereal bars
 g/day181615161718<0.0001
 g/2000 kcal/day 21515141415160.0062
Crisps
 g/day1086689<0.0001
 g/2000 kcal/day 2875578<0.0001
Pure fruit/vegetable juice
 g/day110116141136144139<0.0001
 g/2000 kcal/day 299110134125134144<0.0001
Cordial/squash
 g/day524851433756<0.0001
 g/2000 kcal/day 24645493935870.0004
Sugar sweetened beverages
 g/day503727243125<0.0001
 g/2000 kcal/day 2443522203052<0.0001
Tea
 g/day486481498528505532<0.0001
 g/2000 kcal/day 24654895165134976220.005
Coffee
 g/day347334287293324245<0.0001
 g/2000 kcal/day 2331358292281314-4<0.0001
White wine
 g/day363632352310<0.0001
 g/2000 kcal/day 2313329312110<0.0001
Red wine
 g/day747047706335<0.0001
 g/2000 kcal/day 2646843635532<0.0001
Beer/cider
 g/day325248178206215112<0.0001
 g/2000 kcal/day 2271220163173189169<0.0001
All values are adjusted for age. 1 High meat-eaters are those that reported eating the total of red and processed meat three or more times a week, low meat-eaters reported eating the total of red and processed meat fewer than three times a week, poultry-eaters reported eating poultry but no red or processed meat, fish-eaters reported eating fish but no red or processed meat or poultry, vegetarians did not report eating red or processed meat, or poultry or fish, and vegans additionally reported never eating eggs or foods containing eggs and dairy products; 2 Intakes are standardised to 2000 kcal/day (8368 kJ/day); 3 The questionnaire did not specify whether ice-cream was dairy or plant-based (i.e., soy). Vegans who selected ice-cream are likely to have consumed plant-based products; 4 Due to small numbers, a valid standardised mean intake could not be calculated.
Table 6. Intakes of other food groups in White British women in UK Biobank by diet group.
Food GroupDiet Group 1p for Difference
Regular Meat-EatersLow Meat-EatersPoultry-EatersFish-EatersVegetarianVegan
n = 39,940n = 61,889n = 1751n = 4141n = 2627n = 146
Fruit
 g/day186205241224221263<0.0001
 g/2000 kcal/day 2203240294265263343<0.0001
Vegetables
 g/day214224258270284369<0.0001
 g/2000 kcal/day 2224247293296314451<0.0001
Potatoes—baked/boiled or mashed
 g/day52.34946.646.951.259.7<0.0001
 g/2000 kcal/day 255.354.252.820.956.270.60.004
Potatoes—roast or fried
 g/day33.226.217.920.219.117.6<0.0001
 g/2000 kcal/day 230.124.817.318.518.317.2<0.0001
White pasta
 g/day2526232829220.0001
 g/2000 kcal/day 2262826303326<0.0001
Wholemeal pasta
 g/day3467814<0.0001
 g/2000 kcal/day 23577915<0.0001
White rice
 g/day1414131515150.0168
 g/2000 kcal/day 21515151617180.2233
Brown rice
 g/day2356612<0.0001
 g/2000 kcal/day 22467715<0.0001
Sliced white bread
 g/day1395677<0.0001
 g/2000 kcal/day 2
Sliced brown bread
 g/day141312131411<0.0001
 g/2000 kcal/day 2151413141511<0.0001
Sliced wholemeal bread
 g/day171718202120<0.0001
 g/2000 kcal/day 2171820222325<0.0001
Other bread
 g/day121314161719<0.0001
 g/2000 kcal/day 2121415171820<0.0001
Porridge
 g/day323844383840<0.0001
 g/2000 kcal/day 2354351434450<0.0001
Breakfast cereals
 g/day232424282726<0.0001
 g/2000 kcal/day 2232526292928<0.0001
Ice-cream 3
 g/day13111110115<0.0001
 g/2000 kcal/day 21211119116<0.0001
Milk-based desserts
 g/day11109892<0.0001
 g/2000 kcal/day 211109793<0.0001
Soya desserts
 g/day1121216<0.0001
 g/2000 kcal/day 21112317<0.0001
Other desserts
 g/day211916181916<0.0001
 g/2000 kcal/day 2201916181916<0.0001
Chocolate
 g/day998896<0.0001
g/2000kcal/day 29888970.0003
Biscuits/cereal bars
 g/day151413141312<0.0001
 g/2000 kcal/day 2151414141310<0.0001
Crisps
 g/day765666<0.0001
 g/2000 kcal/day 2765667<0.0001
Pure fruit/vegetable juice
 g/day969594110110127<0.0001
 g/2000 kcal/day 297102105118117132<0.0001
Cordial/squash
 g/day444034353625<0.0001
 g/2000 kcal/day 2444338383826<0.0001
Sugar sweetened beverages
 g/day35272220206<0.0001
 g/2000 kcal/day 234282321227<0.0001
Tea
 g/day535520529543534545<0.0001
 g/2000 kcal/day 2587610661673680671<0.0001
Coffee
 g/day322309285293302274<0.0001
 g/2000 kcal/day 23773893523545173240.2566
White wine
 g/day525143513828<0.0001
 g/2000 kcal/day 2313329312110<0.0001
Red wine
 g/day515346533931<0.0001
 g/2000 kcal/day 24846424742410.0028
Beer/cider
 g/day433630353839<0.0001
 g/2000 kcal/day 24137323739330.0004
All values are adjusted for age. 1 High meat-eaters are those that reported eating the total of red and processed meat three or more times a week, low meat-eaters reported eating the total of red and processed meat fewer than three times a week, poultry-eaters reported eating poultry but no red or processed meat, fish-eaters reported eating fish but no red or processed meat or poultry, vegetarians did not report eating red or processed meat, or poultry or fish, and vegans additionally reported never eating eggs or foods containing eggs and dairy products; 2 Intakes are standardised to 2000 kcal/day (8368 kJ/day); 3 The questionnaire did not specify whether ice-cream was dairy or plant-based (i.e., soy). Vegans who selected ice-cream are likely to have consumed plant-based products.

