
Millennial-Scale Environmental Variability in Late Quaternary Deep-Sea Sediments from the Demerara Rise, NE Coast of South America


Department of Earth Sciences, University of Southern California, Los Angeles, CA 90007, USA
*
Author to whom correspondence should be addressed.
Oceans 2021, 2(1), 246-265; https://0-doi-org.brum.beds.ac.uk/10.3390/oceans2010015
Submission received: 30 December 2020
/
Revised: 18 February 2021
/
Accepted: 22 February 2021
/
Published: 5 March 2021
(This article belongs to the Special Issue Current Advances and Challenges in Ocean Science—Feature Papers for the Founding of Oceans)
Abstract
:We carried out a rock magnetic study of two deep-sea gravity cores from the Demerara Rise, NE South America. Our previous studies provided radiocarbon and paleomagnetic chronologies for these cores. This study presents detailed rock magnetic measurements on these cores in order to characterize the rock magnetic mineralogy and grain size as indicators of the overall clastic fraction. We measured the magnetic susceptibility, anhysteretic remanence, and isothermal remanence and demagnetized the remanences at several alternating field demagnetization levels. The magnetic intensities estimate the magnetic material concentration (and indirectly the overall clastic fraction) in the cores. Ratios of rock magnetic parameters indicate the relative grain size of the magnetic material (and indirectly the overall clastic grain size). Rock magnetic intensity parameters and rock magnetic ratios both vary systematically and synchronously over the last 30,000 years in both cores. There is a multi-millennial-scale cyclicity, with intervals of high magnetic intensity (high magnetic and clastic content) with low magnetic ratios (coarser magnetic and clastic grain size), alternating in sequence with intervals of low magnetic intensity with high magnetic ratios (finer grain size). There is also a higher-frequency millennial-scale variability in intensity superposed on the multi-millennial-scale variability. There are nine (A–I) multi-millennial-scale intervals in the cores. Intervals A, C, E, G, and I have high magnetic and clastic content with coarser overall magnetic and clastic grain size and are likely intervals of enhanced rainfall and runoff from the NE South American margin to the coastal ocean. In contrast, intervals B, D, F, and H have lower clastic flux with finer overall grain size, probably indicating lower continental rainfall and runoff. During the Holocene, high rainfall and runoff intervals can be related to cooler times and low rainfall and runoff to warmer times. The opposite pattern existed during the Pleistocene, with higher rainfall and runoff during interstadial conditions and lower rainfall and runoff during stadial conditions. We noted a similar pattern of Pleistocene multi-millennial-scale variability in a transect of deep-sea sediment cores along the NE Brazilian margin, from the Cariaco Basin (~10 N) to the NE Brazilian margin (~1° N–4° S). However the NW part of this transect (Cariaco Basin, Demerara Rise, Amazon Fan) has an out-of-phase relationship with the SE part of the transect (NE Brazilian margin) between warm–cold and wet–dry conditions. One possible cause of the high–low rainfall and runoff patterns might be oscillation of the Intertropical Convergence Zone (ITCZ), with higher rainfall and runoff associated with a more southerly average position of the ITCZ and lower rainfall and runoff associated with a more northerly average position of the ITCZ.
1. Introduction
The circulation pattern within the western Equatorial Atlantic Ocean and the large sediment supply from the Amazon River create a complex sedimentation system off the coast of NE South America. The Amazon continental shelf accumulates about five hundred million tons of sediment annually (Kuehl et al., 1986) [1], carried by about 20% of the world’s freshwater entering into the ocean from the Amazon River (Franzinelli and Potter, 1983) [2]. Over 80% of the sediment discharged by the Amazon River plume originates from the Andes (Milliman and Meade, 1993; Meade, 1994) [3,4]. This large flux of sediment creates the Amazon Fan, the third largest modern deep-sea fan, an expanded continental shelf found off the coast of NE South America, as well as a distal sediment blanket on the adjacent Demerara Rise and Abyssal Plain. These sediments and their stratigraphic variability provide a unique record of Equatorial Atlantic ocean circulation and Amazon River runoff and their climate and environmental variability (e.g., Damuth and Fairidge, 1970; Damuth and Kumar, 1975; Damuth and Flood, 1985; Flood et al., 1995; Maslin et al., 2000; Maslin and Burns, 2000) [5,6,7,8,9,10].
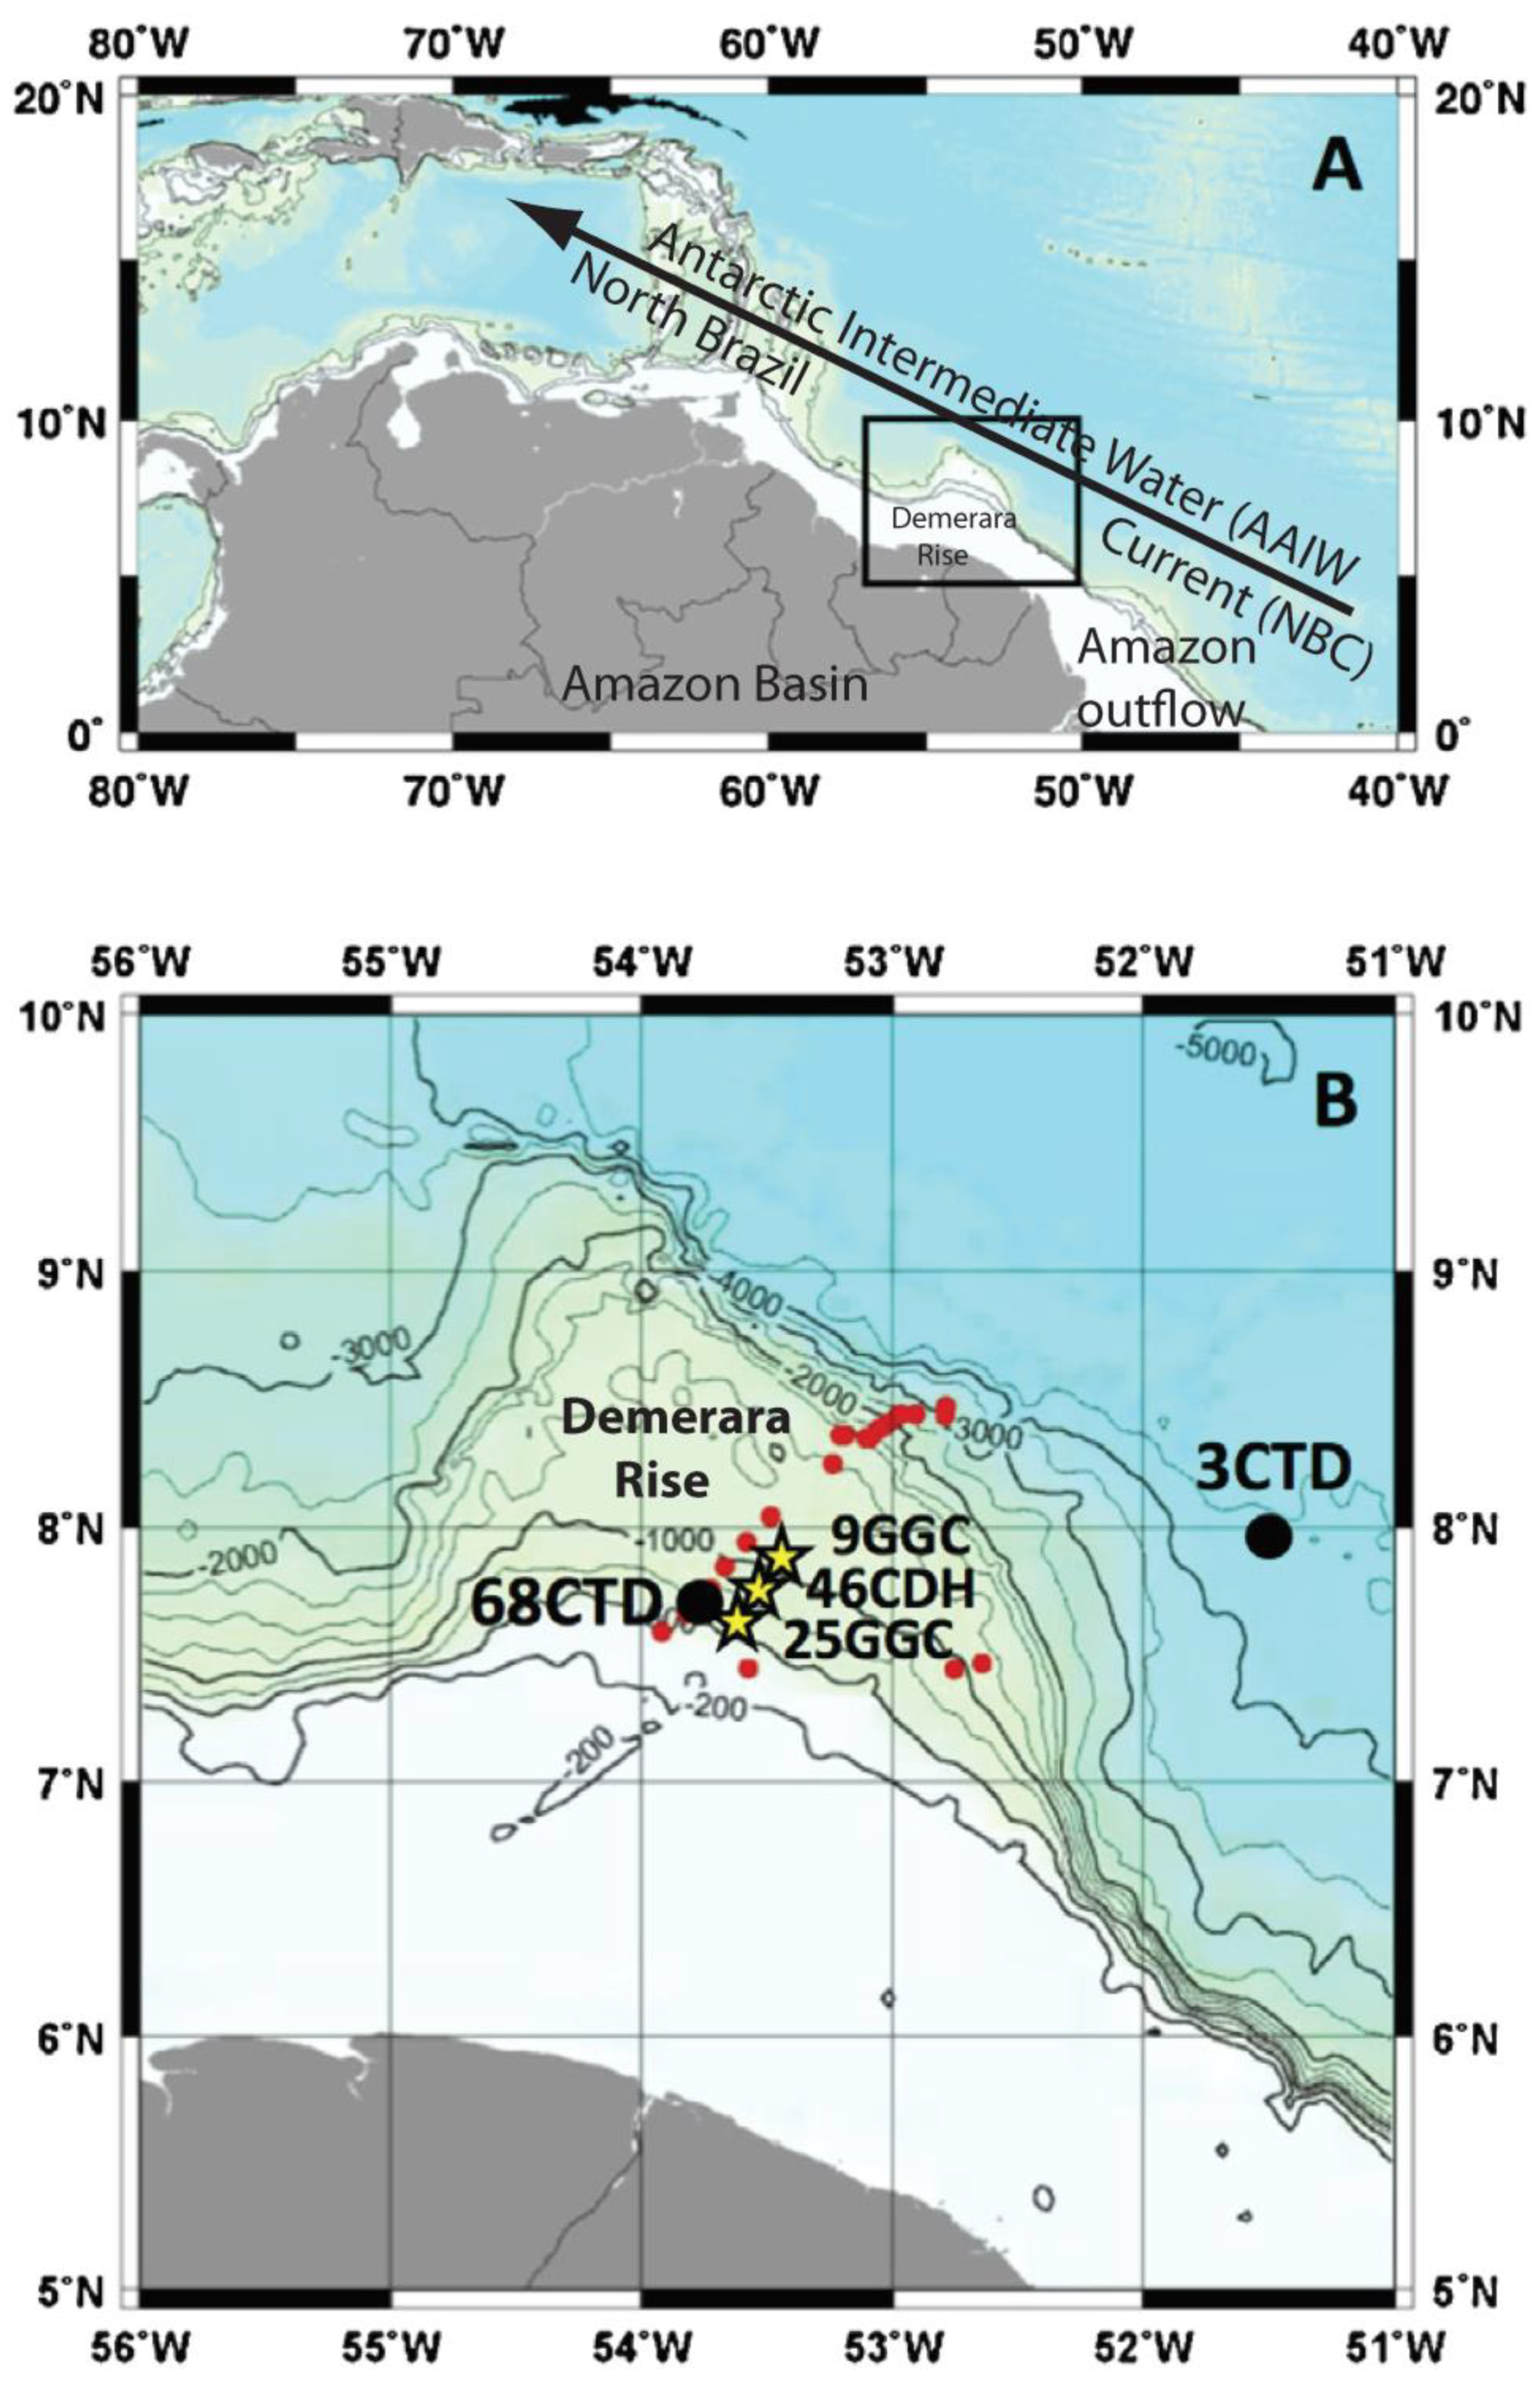
Cruise KNR197-3 (chief scientists D. Oppo and W. Curry) collected multicores, gravity cores, and long piston cores along a transect of the Demerara Rise perpendicular to the local coastline (Figure 1). The cores were collected in varying water depths from ~500 m to 3200 m. The sediment cores were taken to better understand the Late Quaternary sequestration of carbon and related physical sedimentation. This paper examines the Late Quaternary pattern of physical sedimentation in the uppermost portion of the Demerara Rise (core depths of less than 1100 m) based on rock magnetic measurements. This part of the Demerara Rise transect has the highest sediment accumulation rates throughout the Late Quaternary. We have previously published a paleomagnetic secular variation record for some of these cores (Lund et al., 2017) [11], along with radiocarbon dating (Huang et al., 2014) [12], which provide a chronostratigraphic framework for our study. We think this study of Late Quaternary physical sediment variability on the Demerara Rise can be used to estimate the environmental pattern of Amazon River plume sedimentation into the deep ocean adjacent to NE South America for the last ~30 ka.
2. Regional Ocean Circulation
The ocean circulation pattern in the western Equatorial Atlantic Ocean is dominated by the Atlantic Meridional Overturning Circulation (AMOC) (Berger and Wefer, 1996; Schmitz and McCartney, 1993) [13,14]. This system brings warm water into the North Atlantic Ocean, where it is transformed into North Atlantic Deep Water (NADW), which then migrates to the South Atlantic Ocean (Metcalf and Stalcup, 1967; Kirchner et al., 2009) [15,16]. The principal surface ocean current along the northeastern margin of South America is the North Brazil Current (NBC) (Figure 1). The NBC forms off the easternmost margin of Brazil, where the westward-flowing South Equatorial Current (SEC) bifurcates to form the northward-flowing NBC and the southward-flowing Brazil Current (Stramma et al., 1995) [17]. The NBC crosses the equator as a warm-water current, where it connects to the North Equatorial Current (NEC), Caribbean Current, and Gulf Stream (Schmitz and McCartney, 1993) [14]. The NBC plays an important role in the cross-equatorial transfer of heat to the North Atlantic Ocean (Metcalf and Stalcup, 1967) [15]. The NBC also distributes the sediment plume associated with Amazon River discharge northward along the continental shelf and Demerara Rise–Abyssal Plain (Ruhlemann et al., 2001) [18].
Three deep-ocean currents flow along the NE margin of South America below the NBC (e.g., Huang et al., 2014) [12]. Antarctic Intermediate Water (AAIW) flows northward at depths of ~500–1500 m, directly below the NBC, and is an important source of nutrients and carbon to the North Atlantic Ocean. NADW flows southward at depths of ~2000–4000 m below AAIW. The deepest parts of the Demerara Abyssal Plain may see northward flow of Antarctic Bottom Water (AABW) at depths below 4000 m.
3. Regional Deep-Sea Sedimentation
All of the currents carry varying amounts of suspended sediment, depending partly on flow velocities and partly on advection of sediment at the surface by aeolian processes or coastal runoff. The most significant source of advected sediment is the Amazon River discharge. This large flux of sediment creates the Amazon Fan, the third largest modern deep-sea fan, and an expanded continental shelf. The Amazon delta and adjacent shelf currently trap perhaps two-thirds of the discharged sediment (Figueiredo and Nittrouer, 1995; Nittrouer et al., 1995) [19,20], however the finest sediment fraction is probably dispersed beyond the shelf by the NBC. This flux of Amazon River water and sediment beyond the shelf environment brings vast amounts of nutrients to the surface waters of the western Equatorial Atlantic Ocean, causing large blooms of phytoplankton (Smith and DeMaster, 1996) [21].
The western Equatorial Atlantic has two major modes of sedimentation caused by sea-level changes. Higher sea levels associated with interglacial periods foster the deposition of most sediment from the Amazon River onto the north Brazil continental shelf (Nittrouer and DeMaster, 1986; Nittrouer et al., 1995) [20,22]. A lesser portion of the sediment is transported as a suspended load either by longshore currents toward the northwest, where it is deposited along the continental shelf as far as French Guinea, or by the NBC, where it is deposited onto the Amazon Fan and adjacent Demerara Rise–Abyssal Plain (Lund et al., 2018) [23]. Lower sea levels associated with glacial periods cause sediment to bypass the exposed continental shelf and be deposited directly into the NBC and head of the Amazon Submarine Canyon (Damuth and Fairbridge, 1970) [5] and onto the fan.
The “on–off” supply of sediment to the Amazon Fan results in distinctive sediments for glacial versus interglacial intervals. Glacial sediments on the abyssal plain of the most recent glacial period consist of mottled and dark grey hemipelagic clays, a low concentration of carbonate and foraminifera, and occasional redeposited terrigenous sand and silt layers. Above the glacial sediments, Holocene pelagic sediments consist of tan foraminiferal marls or oozes with diverse foraminifera assemblages (Damuth, 1977; Damuth and Flood, 1985) [7,24]. Holocene and interglacial sediments in the western Equatorial Atlantic are characterized by lower concentrations of magnetic material (mostly magnetite) and by finer-grained magnetic material (Meinert and Bloemendal, 1989) [25]. In contrast, the glacial sediments have higher concentrations of magnetic material (mostly magnetite) that is coarser-grained.
Climate also plays a major role in the amount and distribution of sediment deposited on the Amazon Fan, adjacent continental shelf, and more distal Demerara Rise–Abyssal Plain at shorter timescales. The seasonal migration of the Intertropical Convergence Zone (ITCZ) creates distinctive wet and dry seasons and has a large influence on environmental patterns of the coastal region (e.g., Wainer and Soares, 1997) [26]. Boreal summer placement of the ITCZ near 10° N causes dryness in the Amazon Basin and strong precipitation further to the north, including the Cariaco Basin (Haug et al., 2001) [27]. During the boreal winter, the ITCZ moves over the Amazon Basin (0°–10° S), creating a pronounced wet season (austral summer monsoon from December to February).
There is evidence at millennial timescales that the average annual placement of the ITCZ may be biased in its position. During the Early–Middle Holocene (approximately 8000–4000 years BP), there is widespread evidence that the climatic conditions in the tropical Andes were significantly drier than present (e.g., Mayle et al., 2004; Mayle and Power, 2008) [28,29]. More southerly areas experienced similar increased aridity in the Early Holocene. For example, the driest climatic conditions at Lake Junin (11° S), Lake Titicaca (14–17° S), and Sajama Mountain (18° S) were centered at ca. 10,000, 5500, and 4000 years BP, respectively [30,31,32,33] (Thompson et al. 1998; Seltzer et al., 2000; Abbott et al., 2003; Bush et al., 2005). In contrast, more northerly sites in Venezuela and Columbia (including Cariaco Basin) showed significant increases in rainfall in the Early Holocene, as the ITCZ migrated even more northerly during summer months (Haug et al., 2001) [27]. Overall, the sediments of the northern South American margin and their stratigraphic variability provide a correlative record of Amazon Basin climate and environmental variability (e.g., Maslin et al., 2000, Lund et al., 2018) [9,23].
4. Core Descriptions
Cruise KNR197-3 collected a sequence of cores at ~500 m to ~3000 m water depth in a transect outward from the South American margin (Figure 1) as part of a paleoceanographic study of Atlantic Meridional Overturning Circulation (AMOC) in the Atlantic Ocean. Typically, multicores (MC), gravity cores (GGC), and long piston cores (CDH) were collected to provide a complete, composite sedimentologic record along the transect. The focus of our rock magnetic study is 9GGC (405 cm) and 25GGC (352 cm) gravity cores with companion 10CMC (31 cm) and 25DMC (32 cm) multicores (Figure 1, Table 1). We also make use of a 46CDH piston core because it has a large number of radiocarbon dates and XRF measurements that can be transferred into the gravity cores based on magnetic susceptibility (CHI) profile correlations. The radiocarbon dates (Huang et al., 2014) [12] indicate that our paleomagnetic or rock magnetic study covers the last ~19 ka in core 25GGC and ~31 ka in core 9GGC.
5. Rock Magnetic Measurements
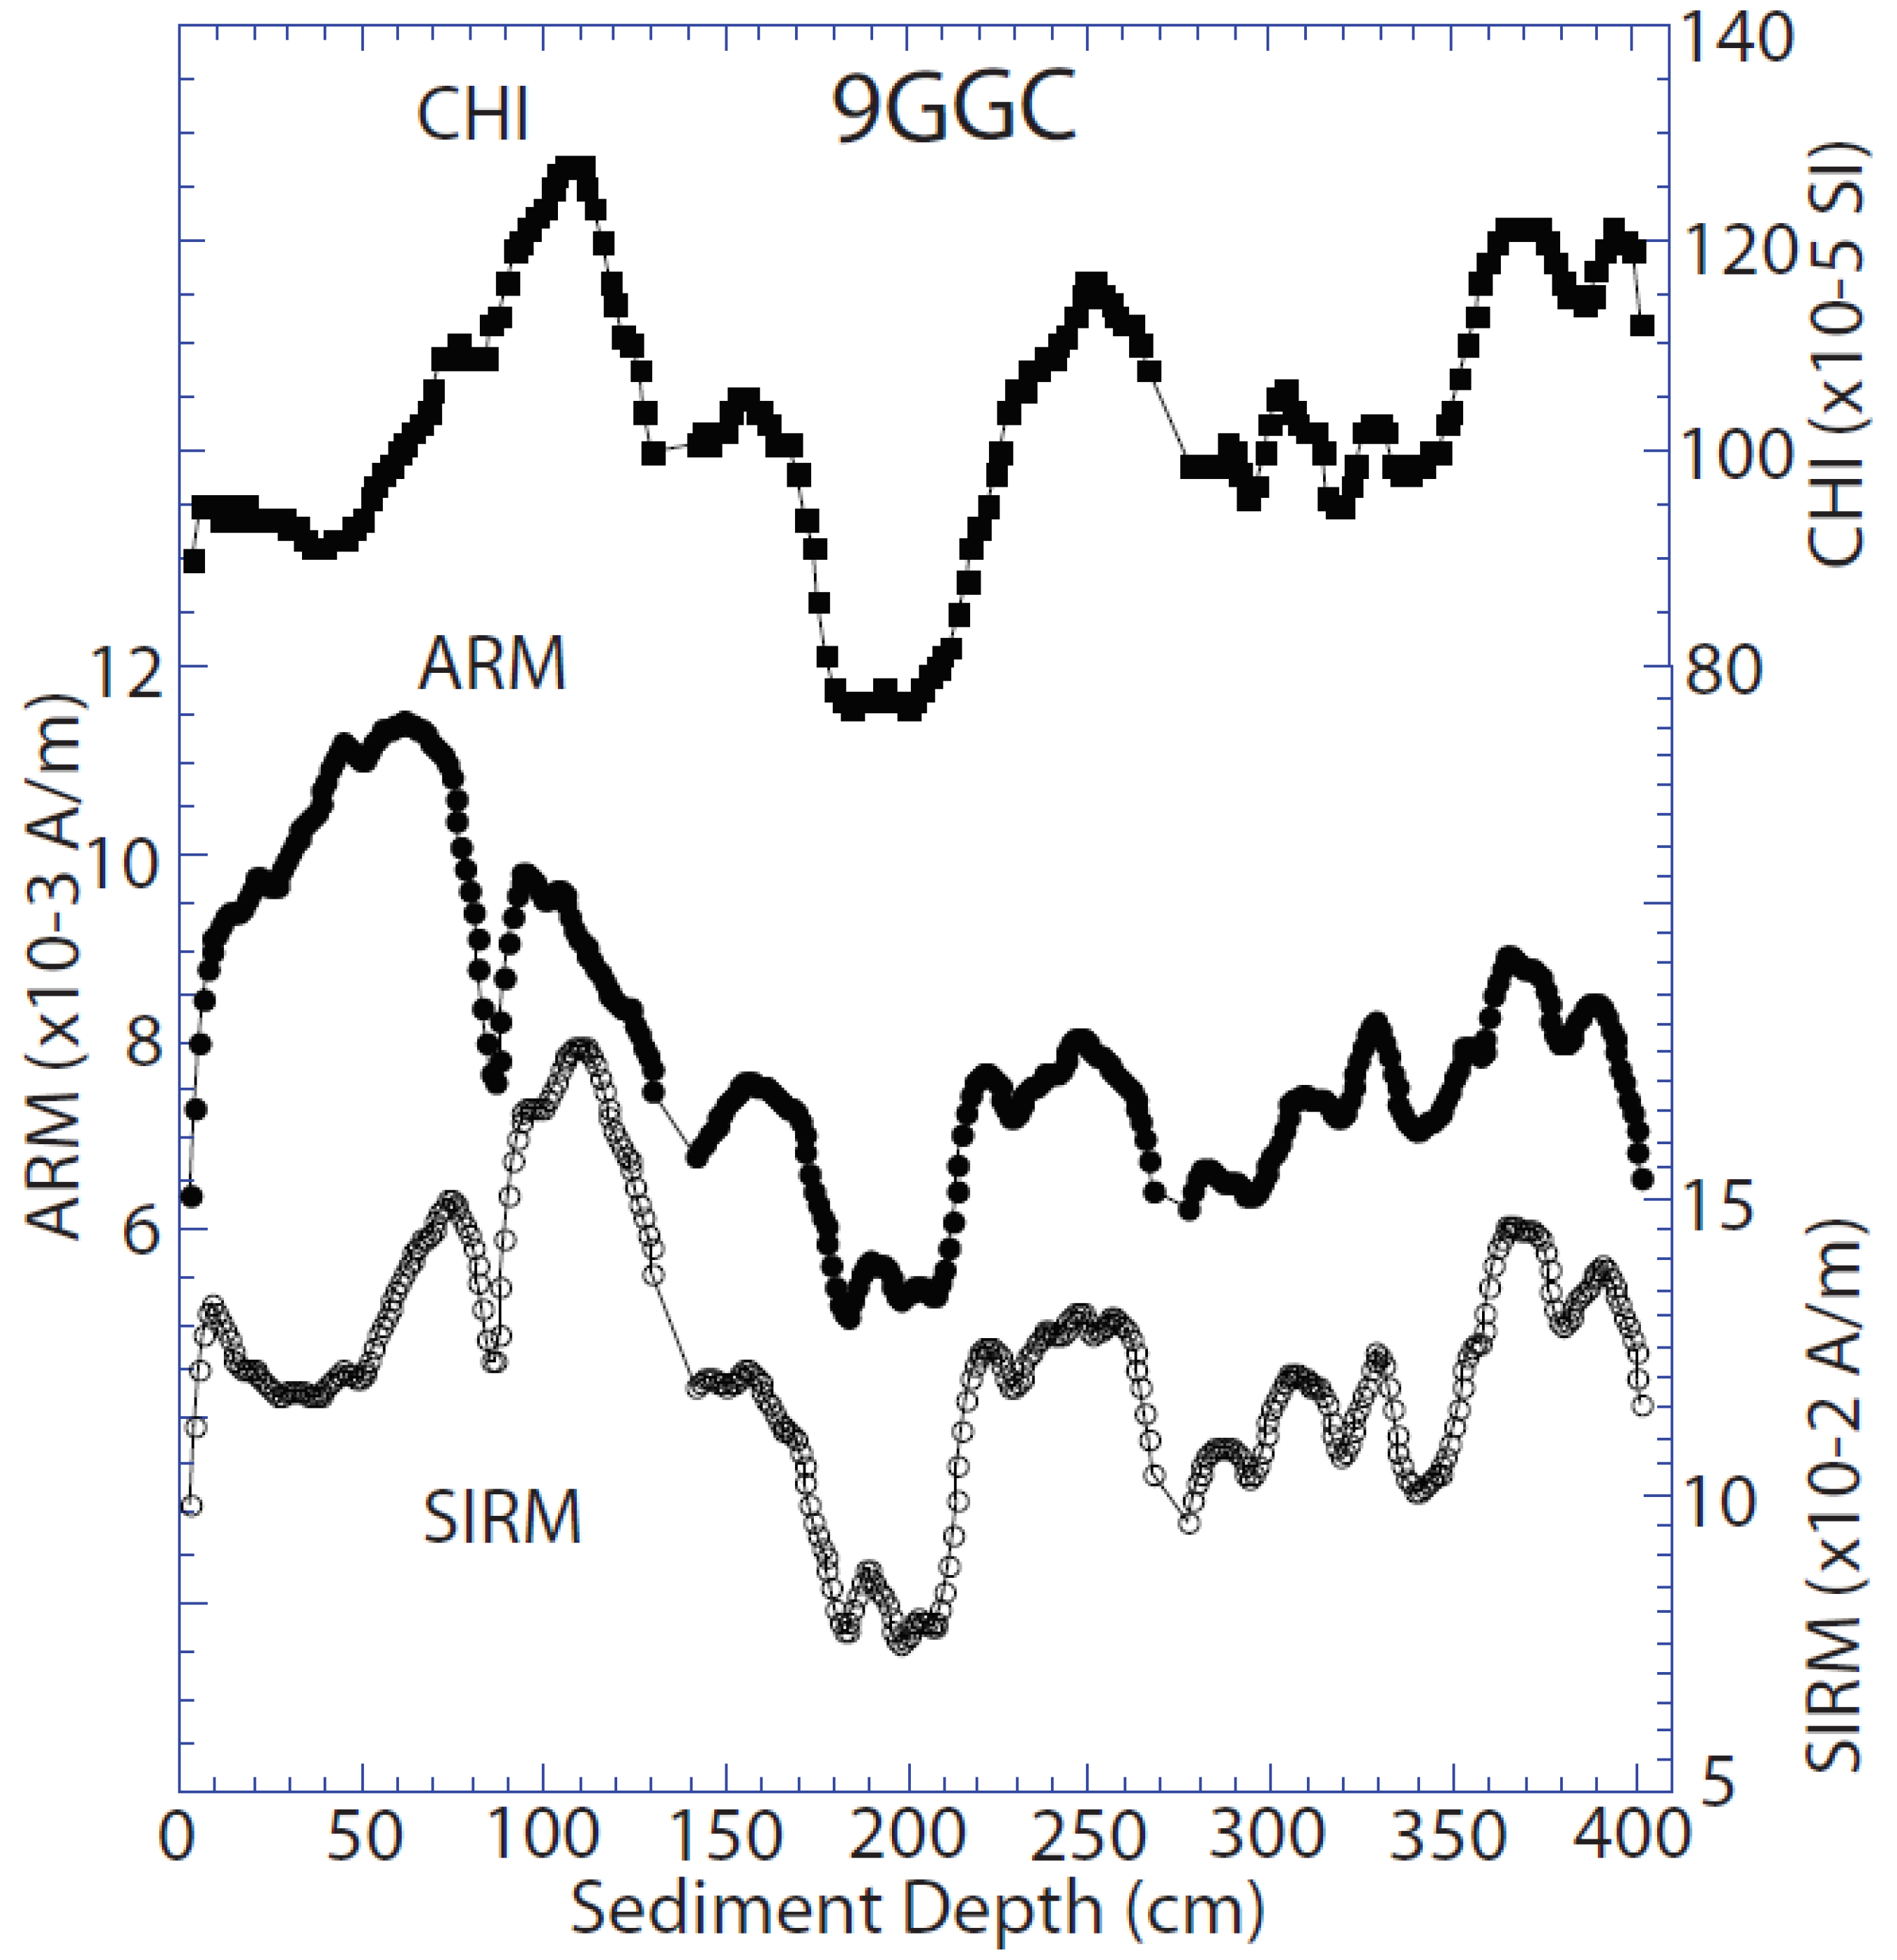
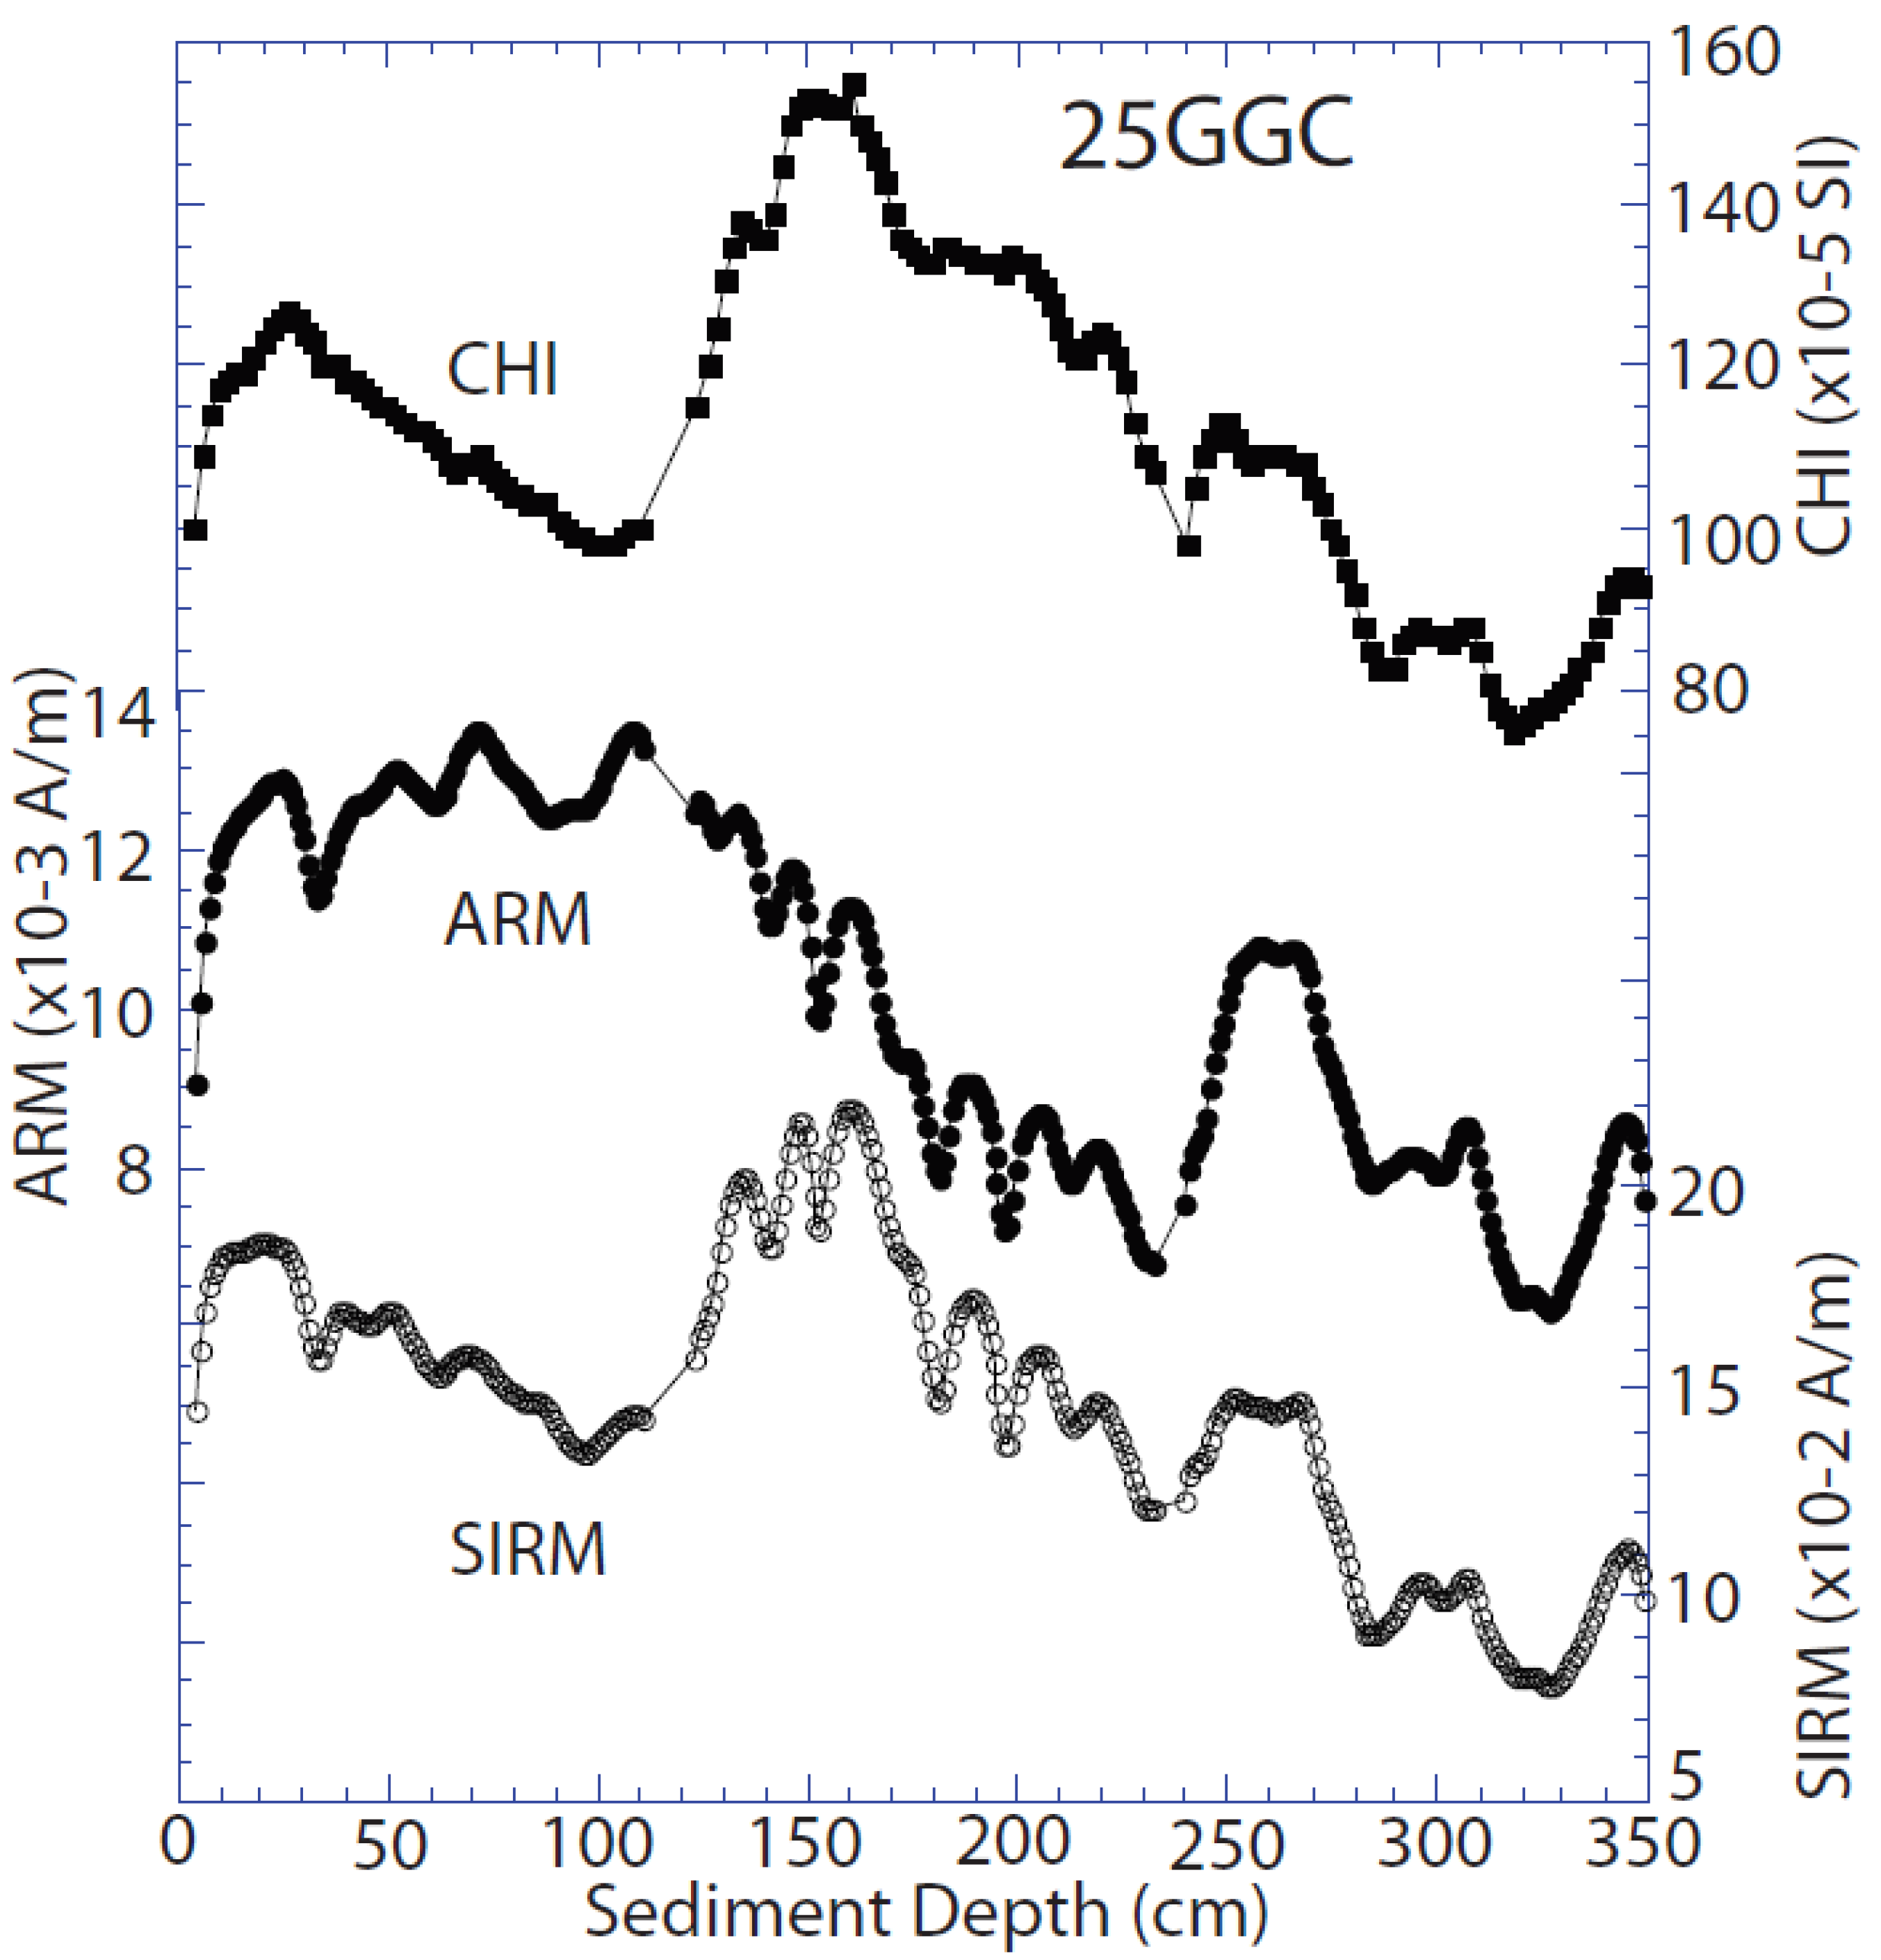
U-channel samples were collected from both gravity cores for our rock magnetic studies. The multicores were sampled discretely with contiguous 2 × 2 × 2 cm cubes because the cores were too short (<50 cm) for good-quality u-channel measurements. Paleomagnetic measurements of these cores have been previously described by Lund et al. (2017) [11]. All cores were subjected to whole-core magnetic susceptibility measurements while onboard the ship. The u-channeled sediments were given a series of rock magnetic measurements after completion of the paleomagnetic studies. All samples were given an artificial anhysteretic remanent magnetization (ARM) sequence with a bias field of 0.05 milliTesla (mT) and an alternating field of 100 mT. After sample measurement, all samples were subjected to a sequence of ARM af demagnetization and measurements at 10 mT, 20 mT, 40 mT, and 60 mT. Finally, all samples were given another artificial isothermal remanent magnetization (IRM) sequence with a pulsed 1 T field. (This 1-T artificial remanence is usually referred to as a saturation IRM (SIRM), because all magnetite and titanomagnetite grains, which hold almost all of the natural remanence (NRM), are saturated.) After sample measurement, all samples were subjected to a sequence of SIRM af demagnetization and measurements at 10 mT, 20 mT, 40 mT, and 60 mT. One u-channel from each of the gravity cores also had their ARMs and SIRMs subjected to 80 mT and 100 mT af demagnetization. Lund et al. (2017, 2018) [11,23] summarized the AF coercivity patterns of the NRM, ARM, and SIRM. Those papers also considered variations in the ARM/Chi ratio, which showed no evidence of fine-grained (bacterial) magnetite. These studies both suggest that detrital magnetite is the dominant magnetic mineral in these sediments. The resulting CHI, ARM, and SIRM intensities for both gravity cores are shown in Figure 2 and Figure 3. The magnetic intensity patterns in the two multicores and neighboring multicores (Lund et al., 2018) [2] are consistent with the pattern in the uppermost 50 cm of the gravity cores. This provides corroborating evidence that the gravity cores did not lose significant surface sediment in the coring process.
The magnetic intensity variations reflect changes in the percentage of detrital magnetic material (and presumably total clastic material) in the sediment. Magnetite is the most common magnetic mineral noted in several other studies of deep-sea sediments from the Equatorial Atlantic–Amazon Fan region (Meinert and Bloemendal, 1989; Maslin et al., 2000; Franke et al., 2007; Bendle et al., 2010) [9,25,34,35]. Our previous rock magnetic studies of deep-sea sediments from the neighboring Demerara Abyssal Plain also support this view (Lund et al., 2018) [23]. These studies also indicate that ferric oxides (mostly hematite and goethite) are present in varying small amounts in the sediments. The magnetic intensity variations may be due to varying clastic flux (presumably mostly from the Amazon drainage) or varying dilution by biogenic components due to variable upwelling and biological productivity.
Our ARM and Chi measurements and ratios of ARM or SIRM under different levels of demagnetization (SIRM20/SIRM0; SIRM40/SIRM20, ARM20/ARM0, ARM40/ARM20) estimate the grain size distribution of the magnetic mineral fraction (e.g., Stacy and Banerjee, 1974; Bloemendal et al., 1988) [36,37]. For all rock magnetic ratios, higher (lower) values indicate a finer-grained (coarser-grained) set of magnetic grains. Variations in magnetic grain size may be due simply to a finer-grained or coarser-grained source of overall clastic material; they might also reflect changes in the distribution of magnetic minerals if more than one is significant in concentration.
Selected samples from gravity core 9GGC were also given an extra series of magnetic hysteresis measurements. The samples were cycled through a MicroMag up to 1 Tesla (T). Values of remanent magnetization (Mr), saturation magnetization (Ms), coercivity field (Hc), coercivity of remanence field (Hcr), and field intensity (H) were calculated to estimate the grain size distribution and percentage of ferric magnetic minerals (goethite, hematite) versus titanomagnetite minerals (primarily magnetite). H represents the amount of magnetic material that acquires a remanence between 0.3 and 1 T (ferric magnetic minerals, primarily hematite). The primary purpose of these measurements was to assess the percentage of ferric magnetic minerals that primarily develop in Amazon Basin soils and reflect the relative importance of erosion from the Andes (primarily magnetite and titanomagnetite) versus the Amazon Basin itself (a more significant portion of goethite and hematite) on total Amazon drainage to the coastal ocean.
6. Development of a Revised Magnetic Chronostratigraphy Technique
Lund et al. (2017) [11] developed chronostratigraphies for cores 9GGC and 25GGC by first correlating the two cores based on environmental magnetic and paleomagnetic variability and then using that correlation to assess the radiocarbon dates in cores 9GGC and 25GGC. (Selected radiocarbon dates from 46CDH were also tied into the two gravity cores using magnetic susceptibility correlations.) The final chronostratigraphies for 9GGC and 25GGC were then derived from a selection of radiocarbon dates tied to each core individually and connected with linear interpolation. We then identified 52 paleomagnetic and rock magnetic features that both cores have in common. We estimated the ages of each feature based on the chronologies outlined by Lund et al. (2017) [11]. We found age differences between the same correlatable features in both cores of as much as 1000 years because of differences in linear interpolation between radiocarbon dates in the two cores.
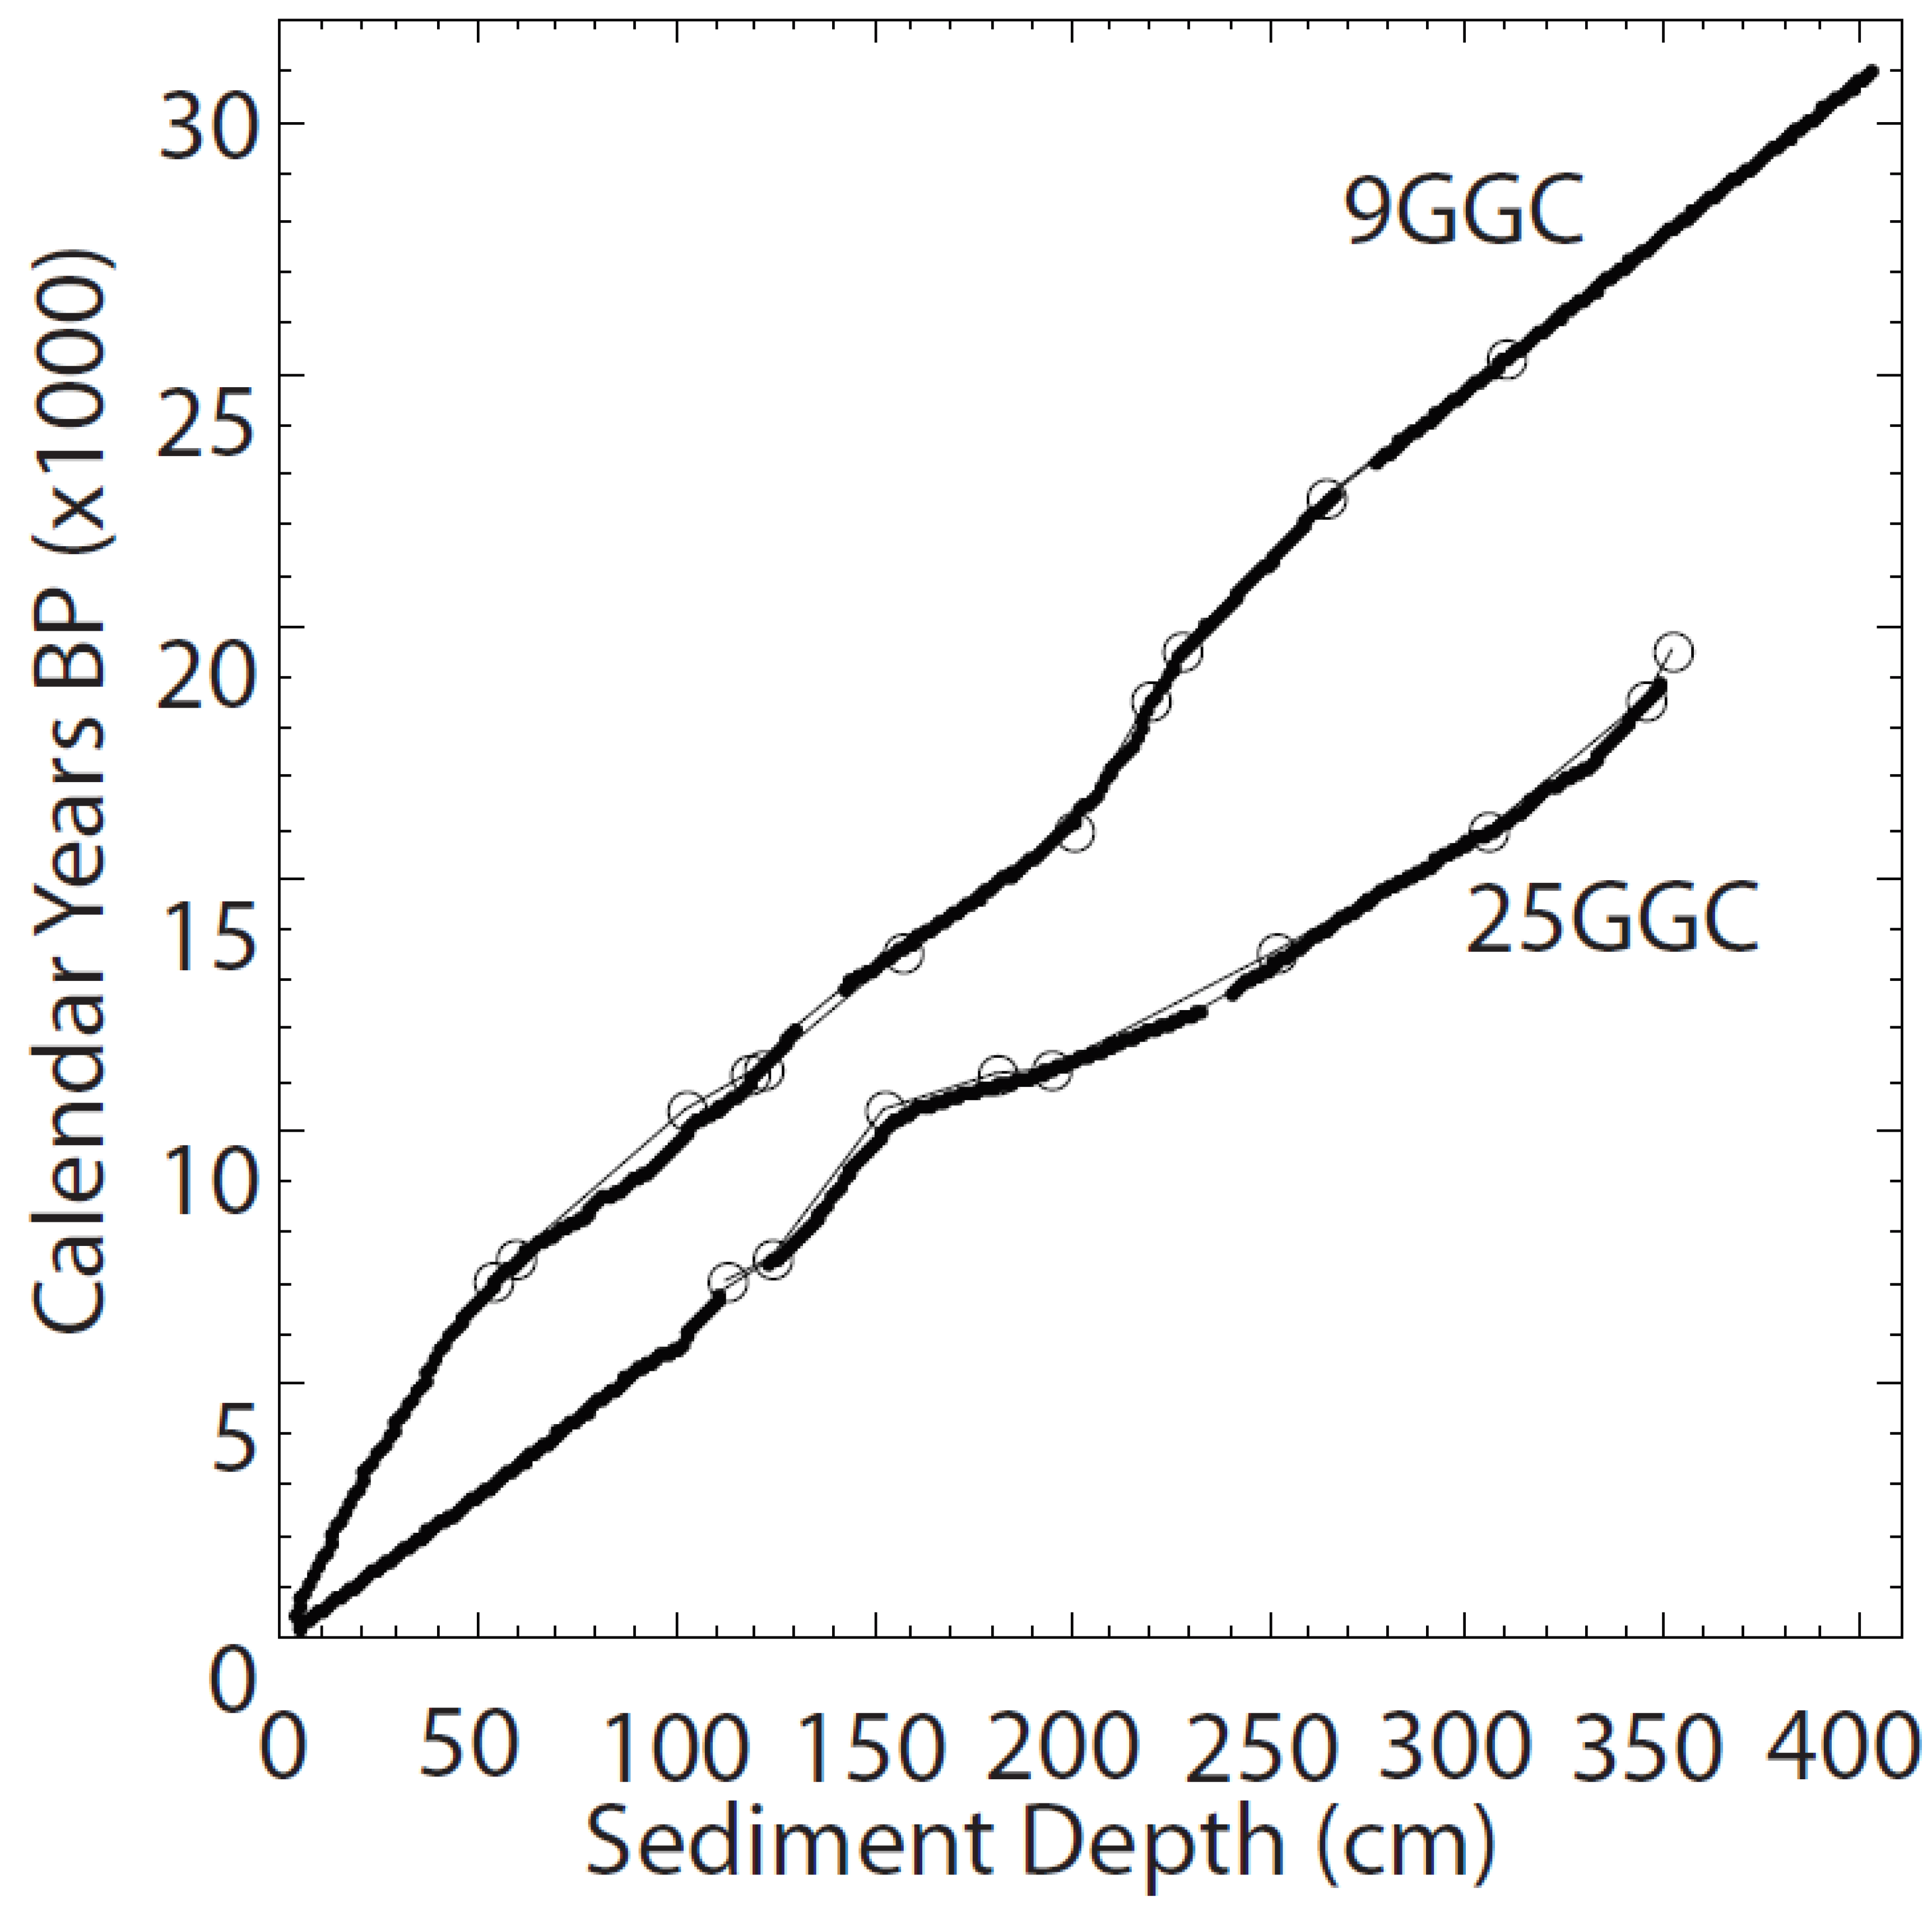
We developed a revised magnetic chronostratigraphy technique for these two cores that provides more consistent ages for environmental and paleomagnetic features. The starting point was to date the 52 environmental magnetic or paleomagnetic correlation features in the two cores (summarized in Supplementary Table S1) based on the original chronostratigraphies developed by Lund et al. (2017) [11]. The 52 feature ages in 9GGC and 25GGC were then averaged. Those feature ages were then used to rebuild chronologies for both cores. The results are shown in Figure 4. Figure 4 shows the original Lund et al. (2017) [11] chronologies based on calibrated radiocarbon dates (large open circles in Figure 4), with linear interpolation and the revised chronology based on the 52 feature ages summarized in Supplementary Table S1. This procedure makes PSV and environmental variability more synchronous between the two cores. It does not, however, improve the overall chronology of the sediments. It simply makes the two records chronologically consistent. There are two underlying assumptions in this procedure that we think are warranted. First, we presume that the sediment remanence acquisition process is comparable in both cores. Second, we presume that the sedimentation process near our study cores is not time transgressive. Both assumptions seem reasonable based on the strong (±2 cm) correlation between both PSV and rock magnetic variability among the two cores over their entire lengths.
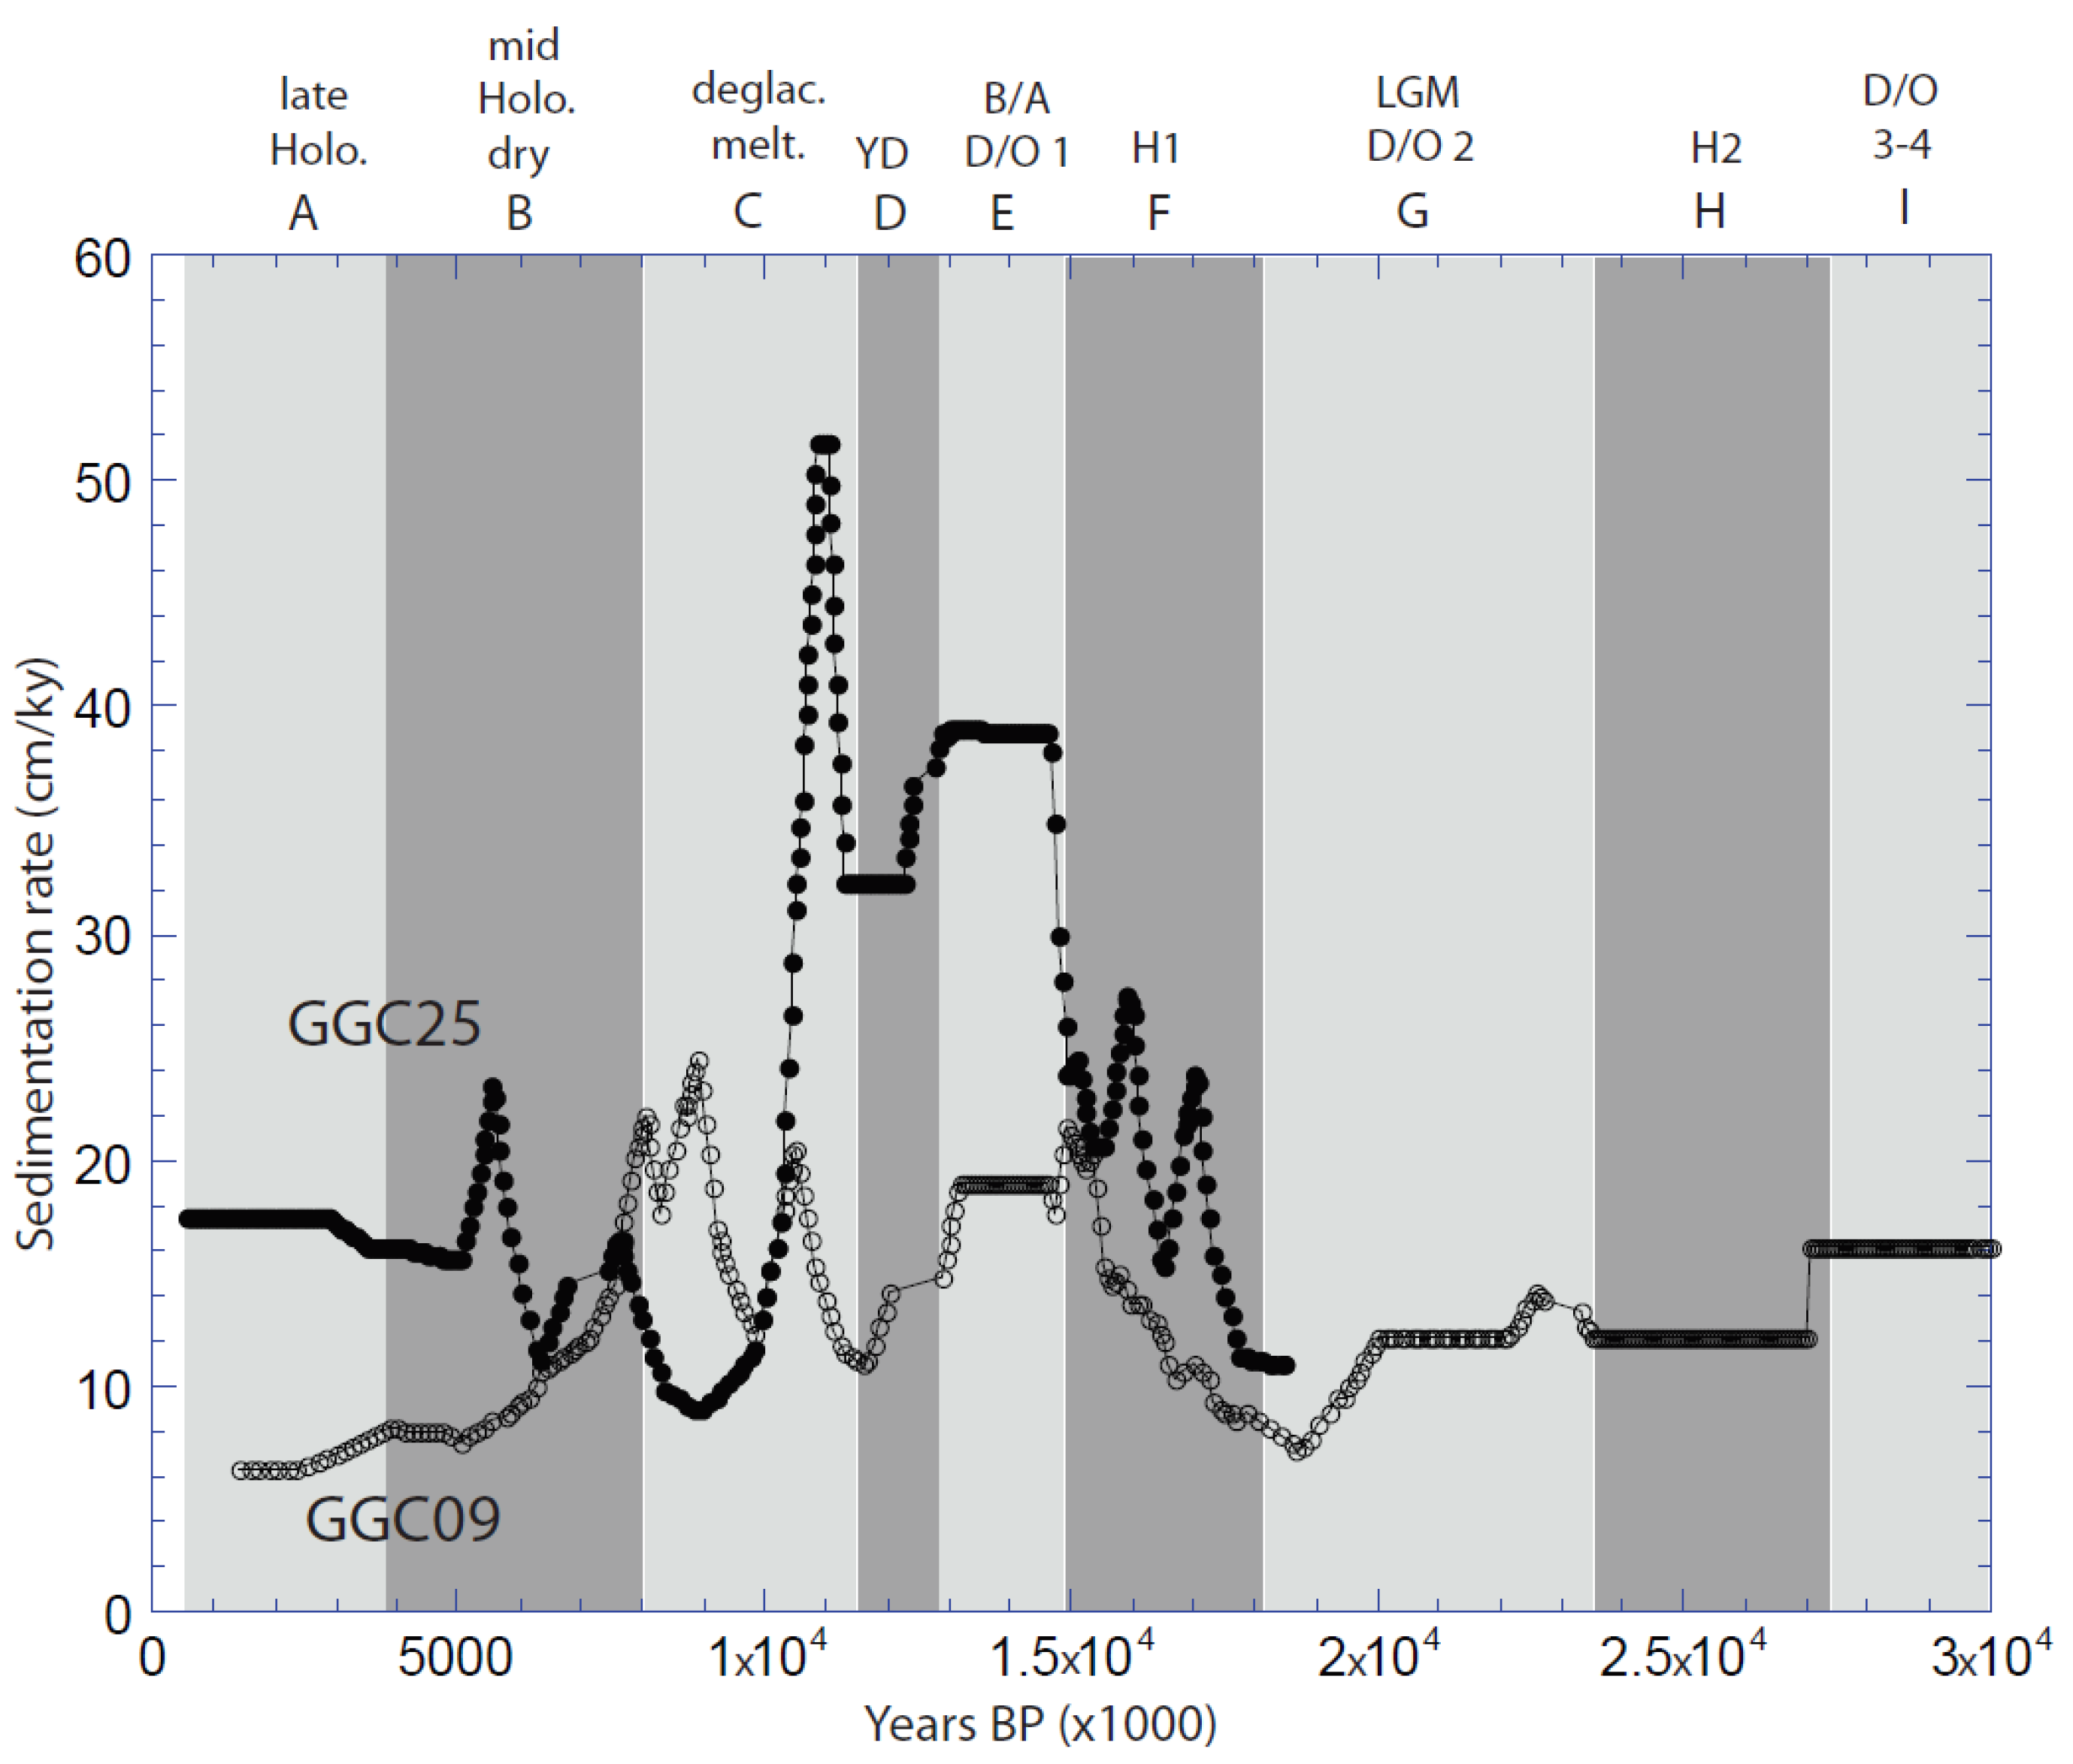
The revised chronostratigraphies were used to estimate sedimentation rate variability in both cores. The results are shown in Figure 5. There is a notable overall pulse of high sedimentation around the Pleistocene–Holocene transition (~10–16 ka). Superposed on this are multi-millennial variations in sedimentation rates that we can tie to our rock magnetic variability described below. In particular, note that colder intervals of the Late Pleistocene (Younger Dryas (YD) and Heinrich events H1 and H2) have lower sedimentation rates than the neighboring warmer intervals (Bolling–Allerod (B/A) and Dansgard–Oeschger (D/O) interstadial events 2–4).
7. Environmental Variability
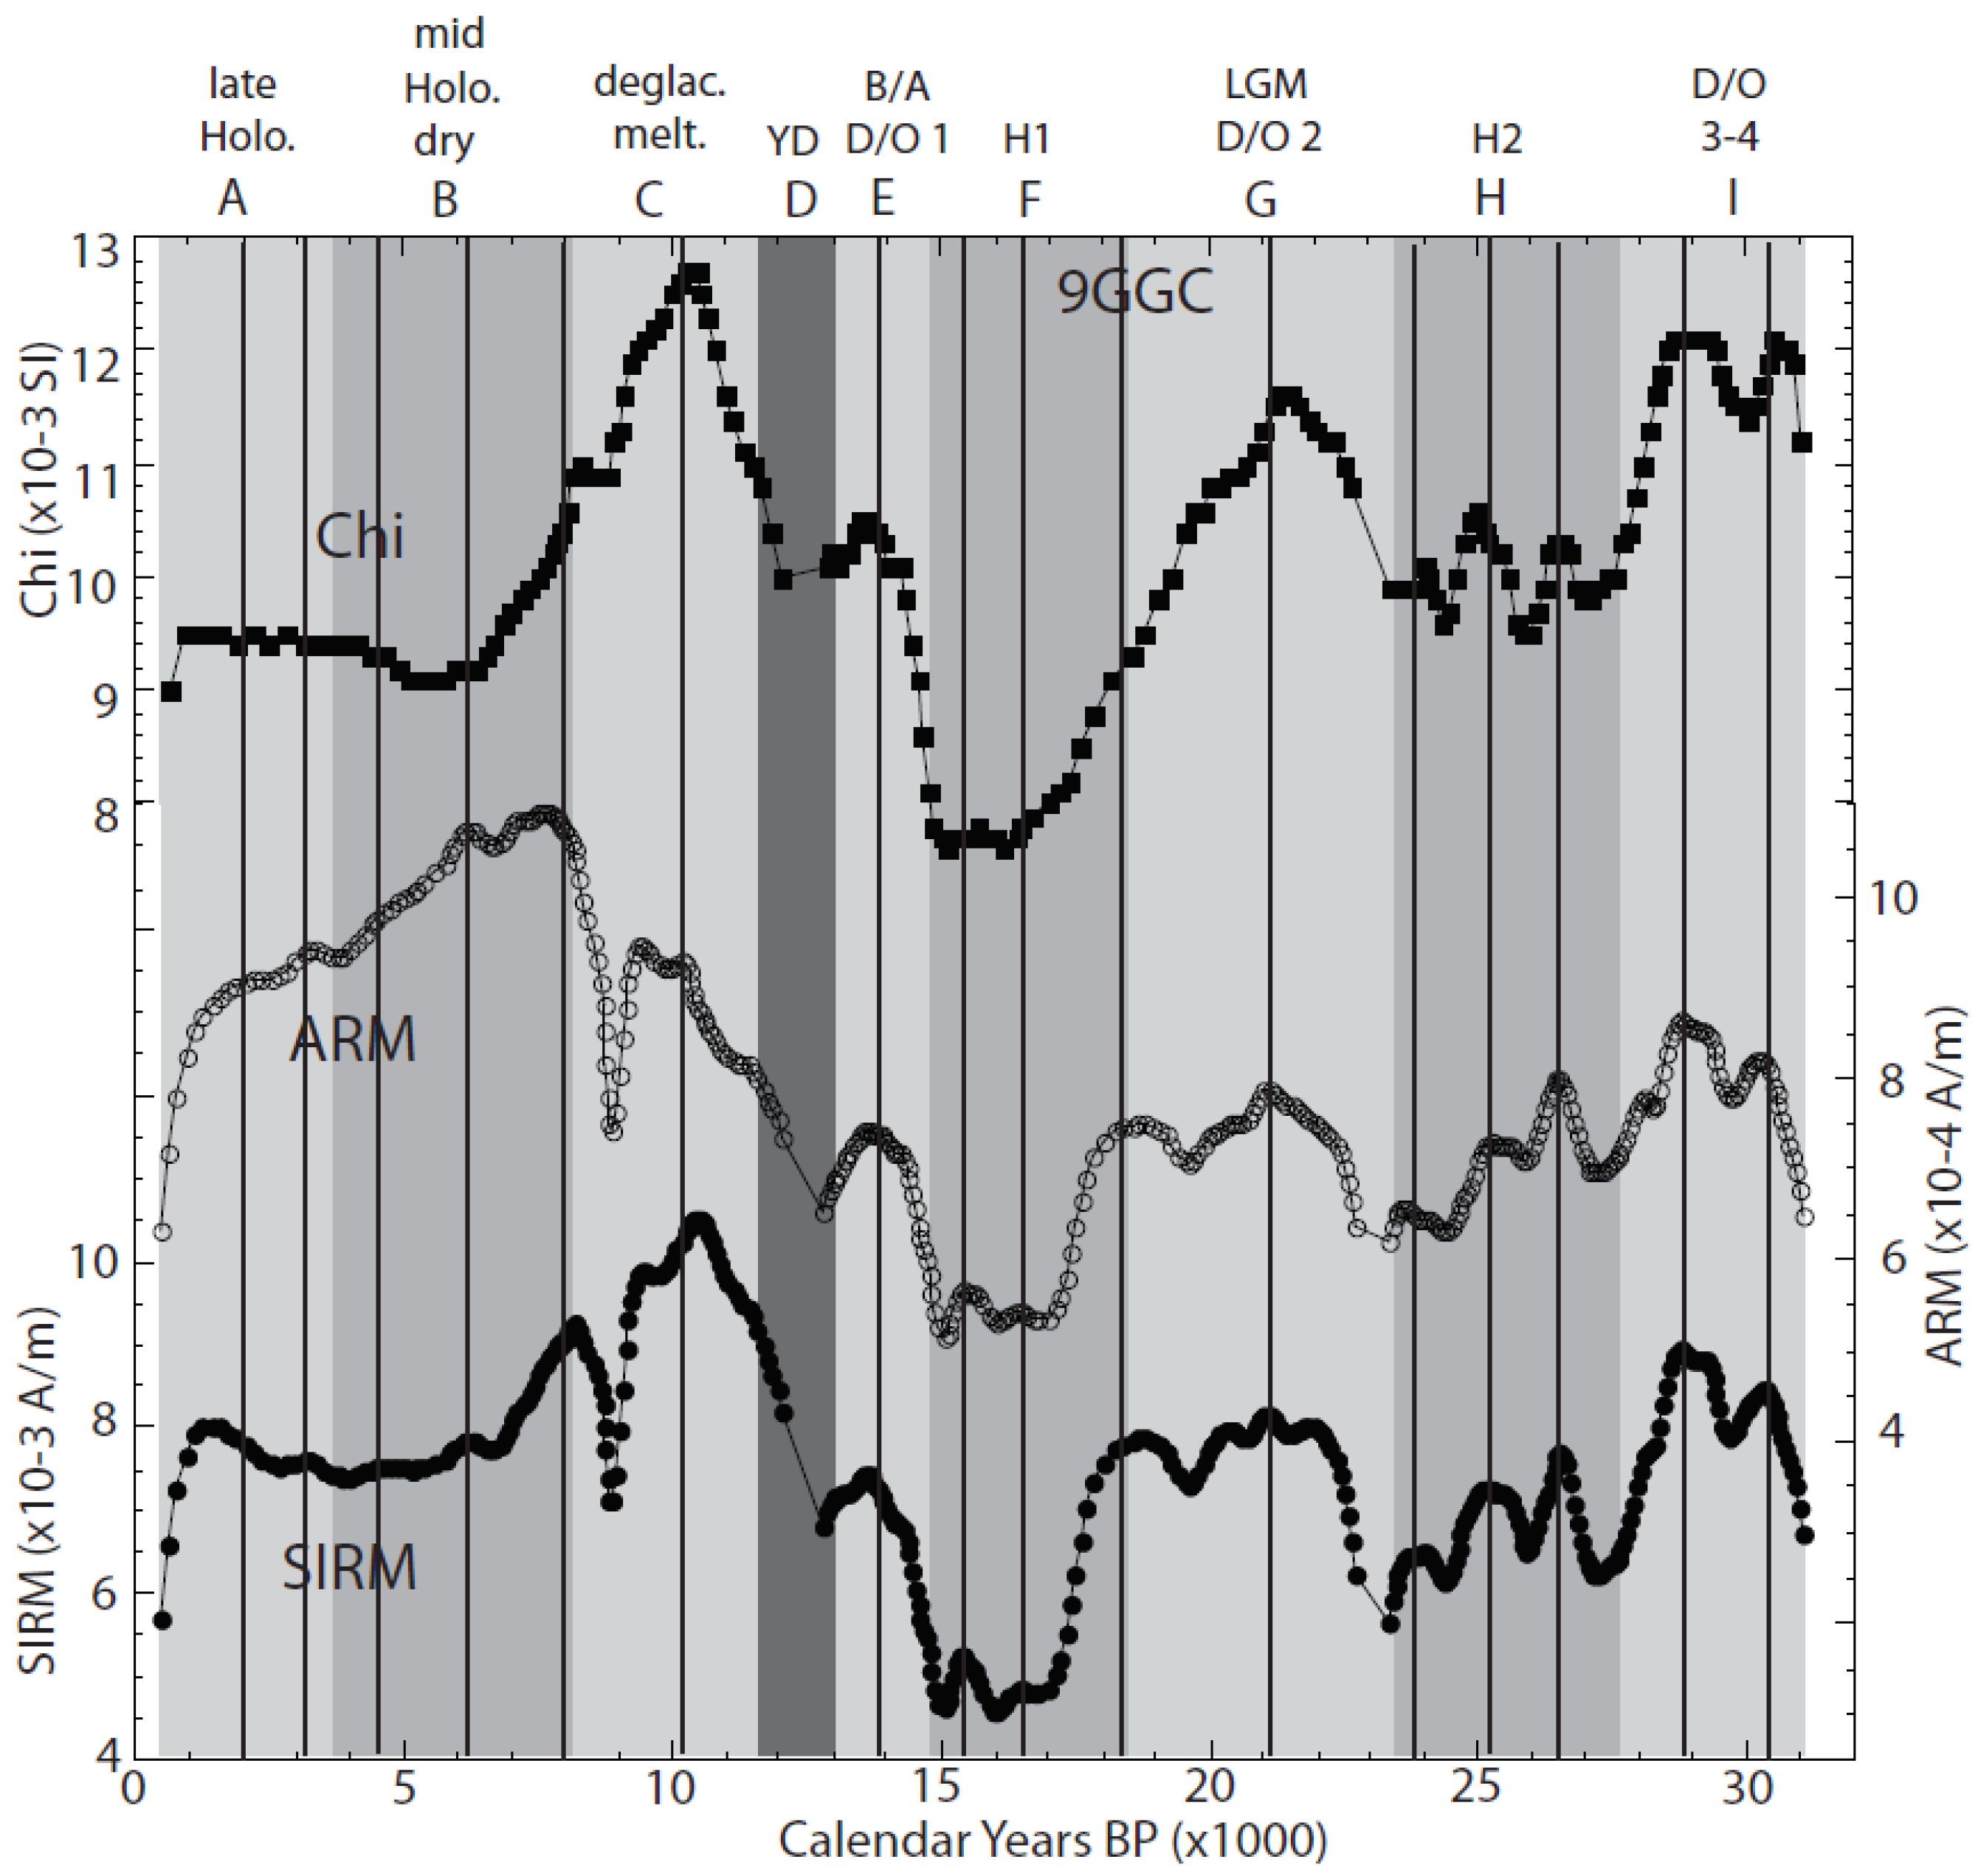
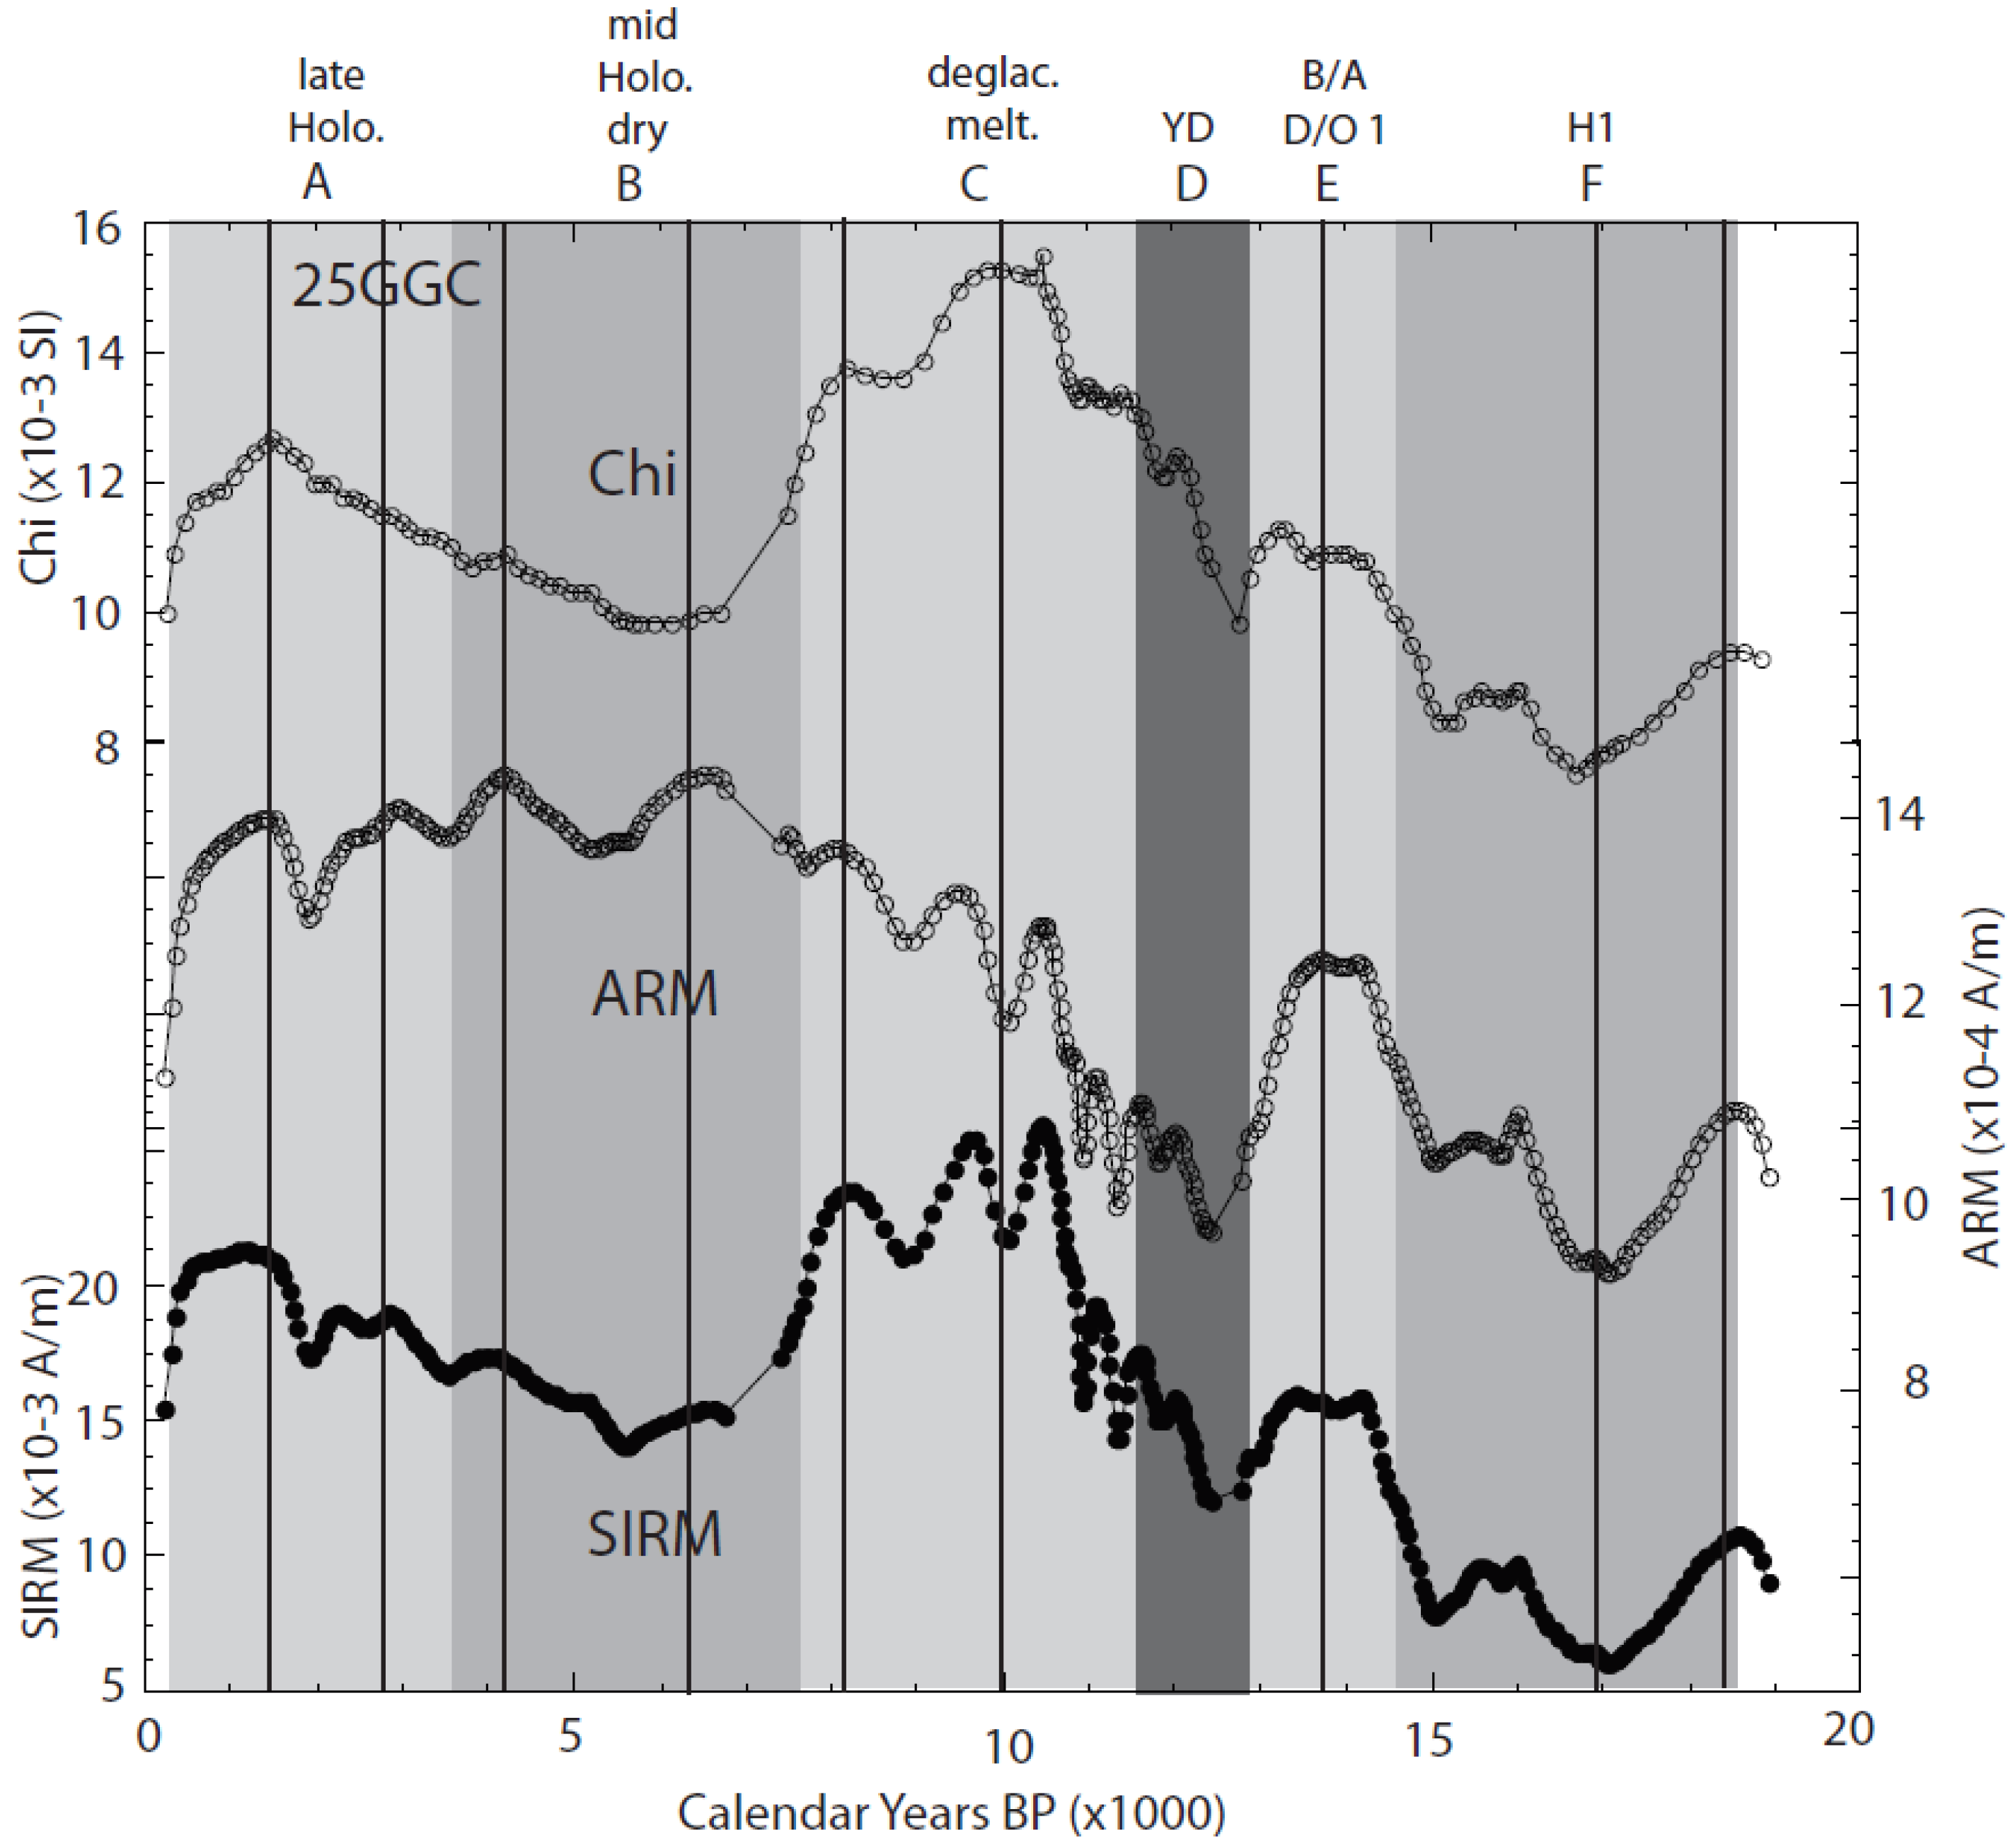
Figure 6 (9GGC) and Figure 7 (25GGC) display the pattern of magnetic intensity variation as a function of time over the last 30 ka. The two gravity cores have the same pattern of intensity variation, with six multi-millennial-scale intervals in common (A–F in Figure 6 and Figure 7). Core 25GGC also displays three more intervals (G-I) that are older than the data in 9GGC. Each of these intervals lasts ~1500–4000 years. The intervals oscillate between high and low intensity. The intensity variations could be associated with variations in the rate of clastic flux to the coastal ocean or with variations in biological productivity causing biogenic carbonate or silica dilution.
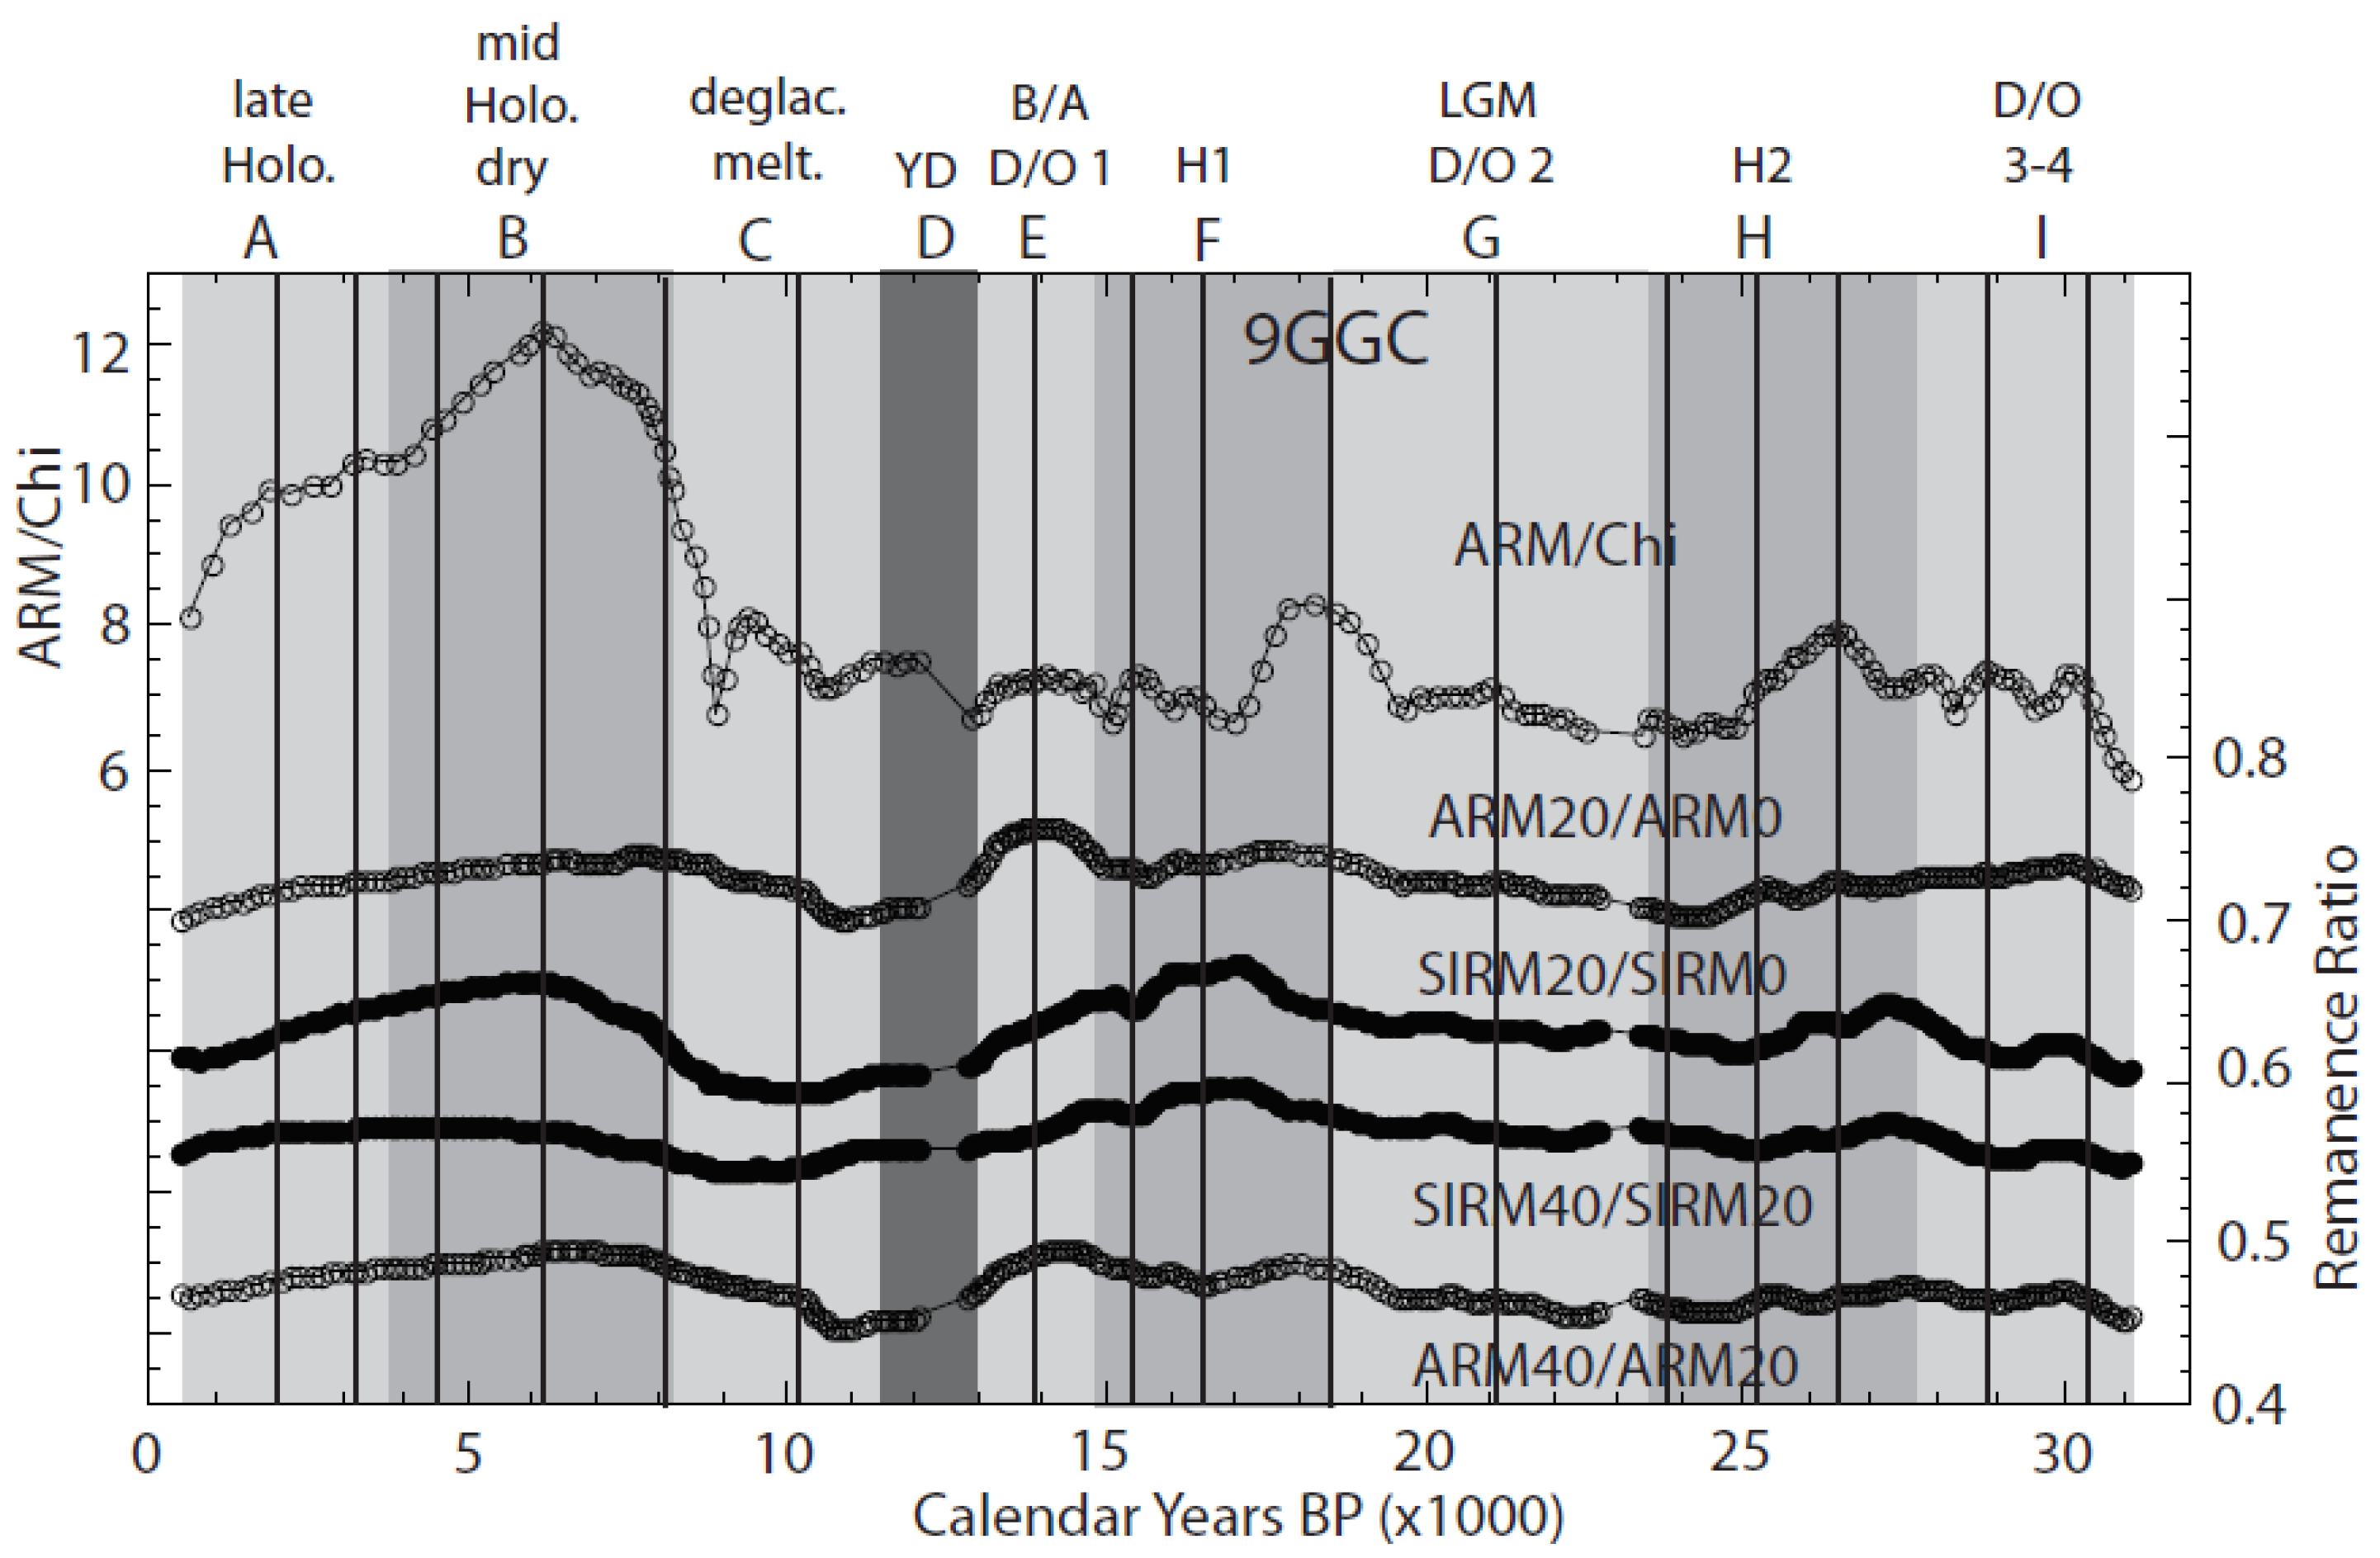
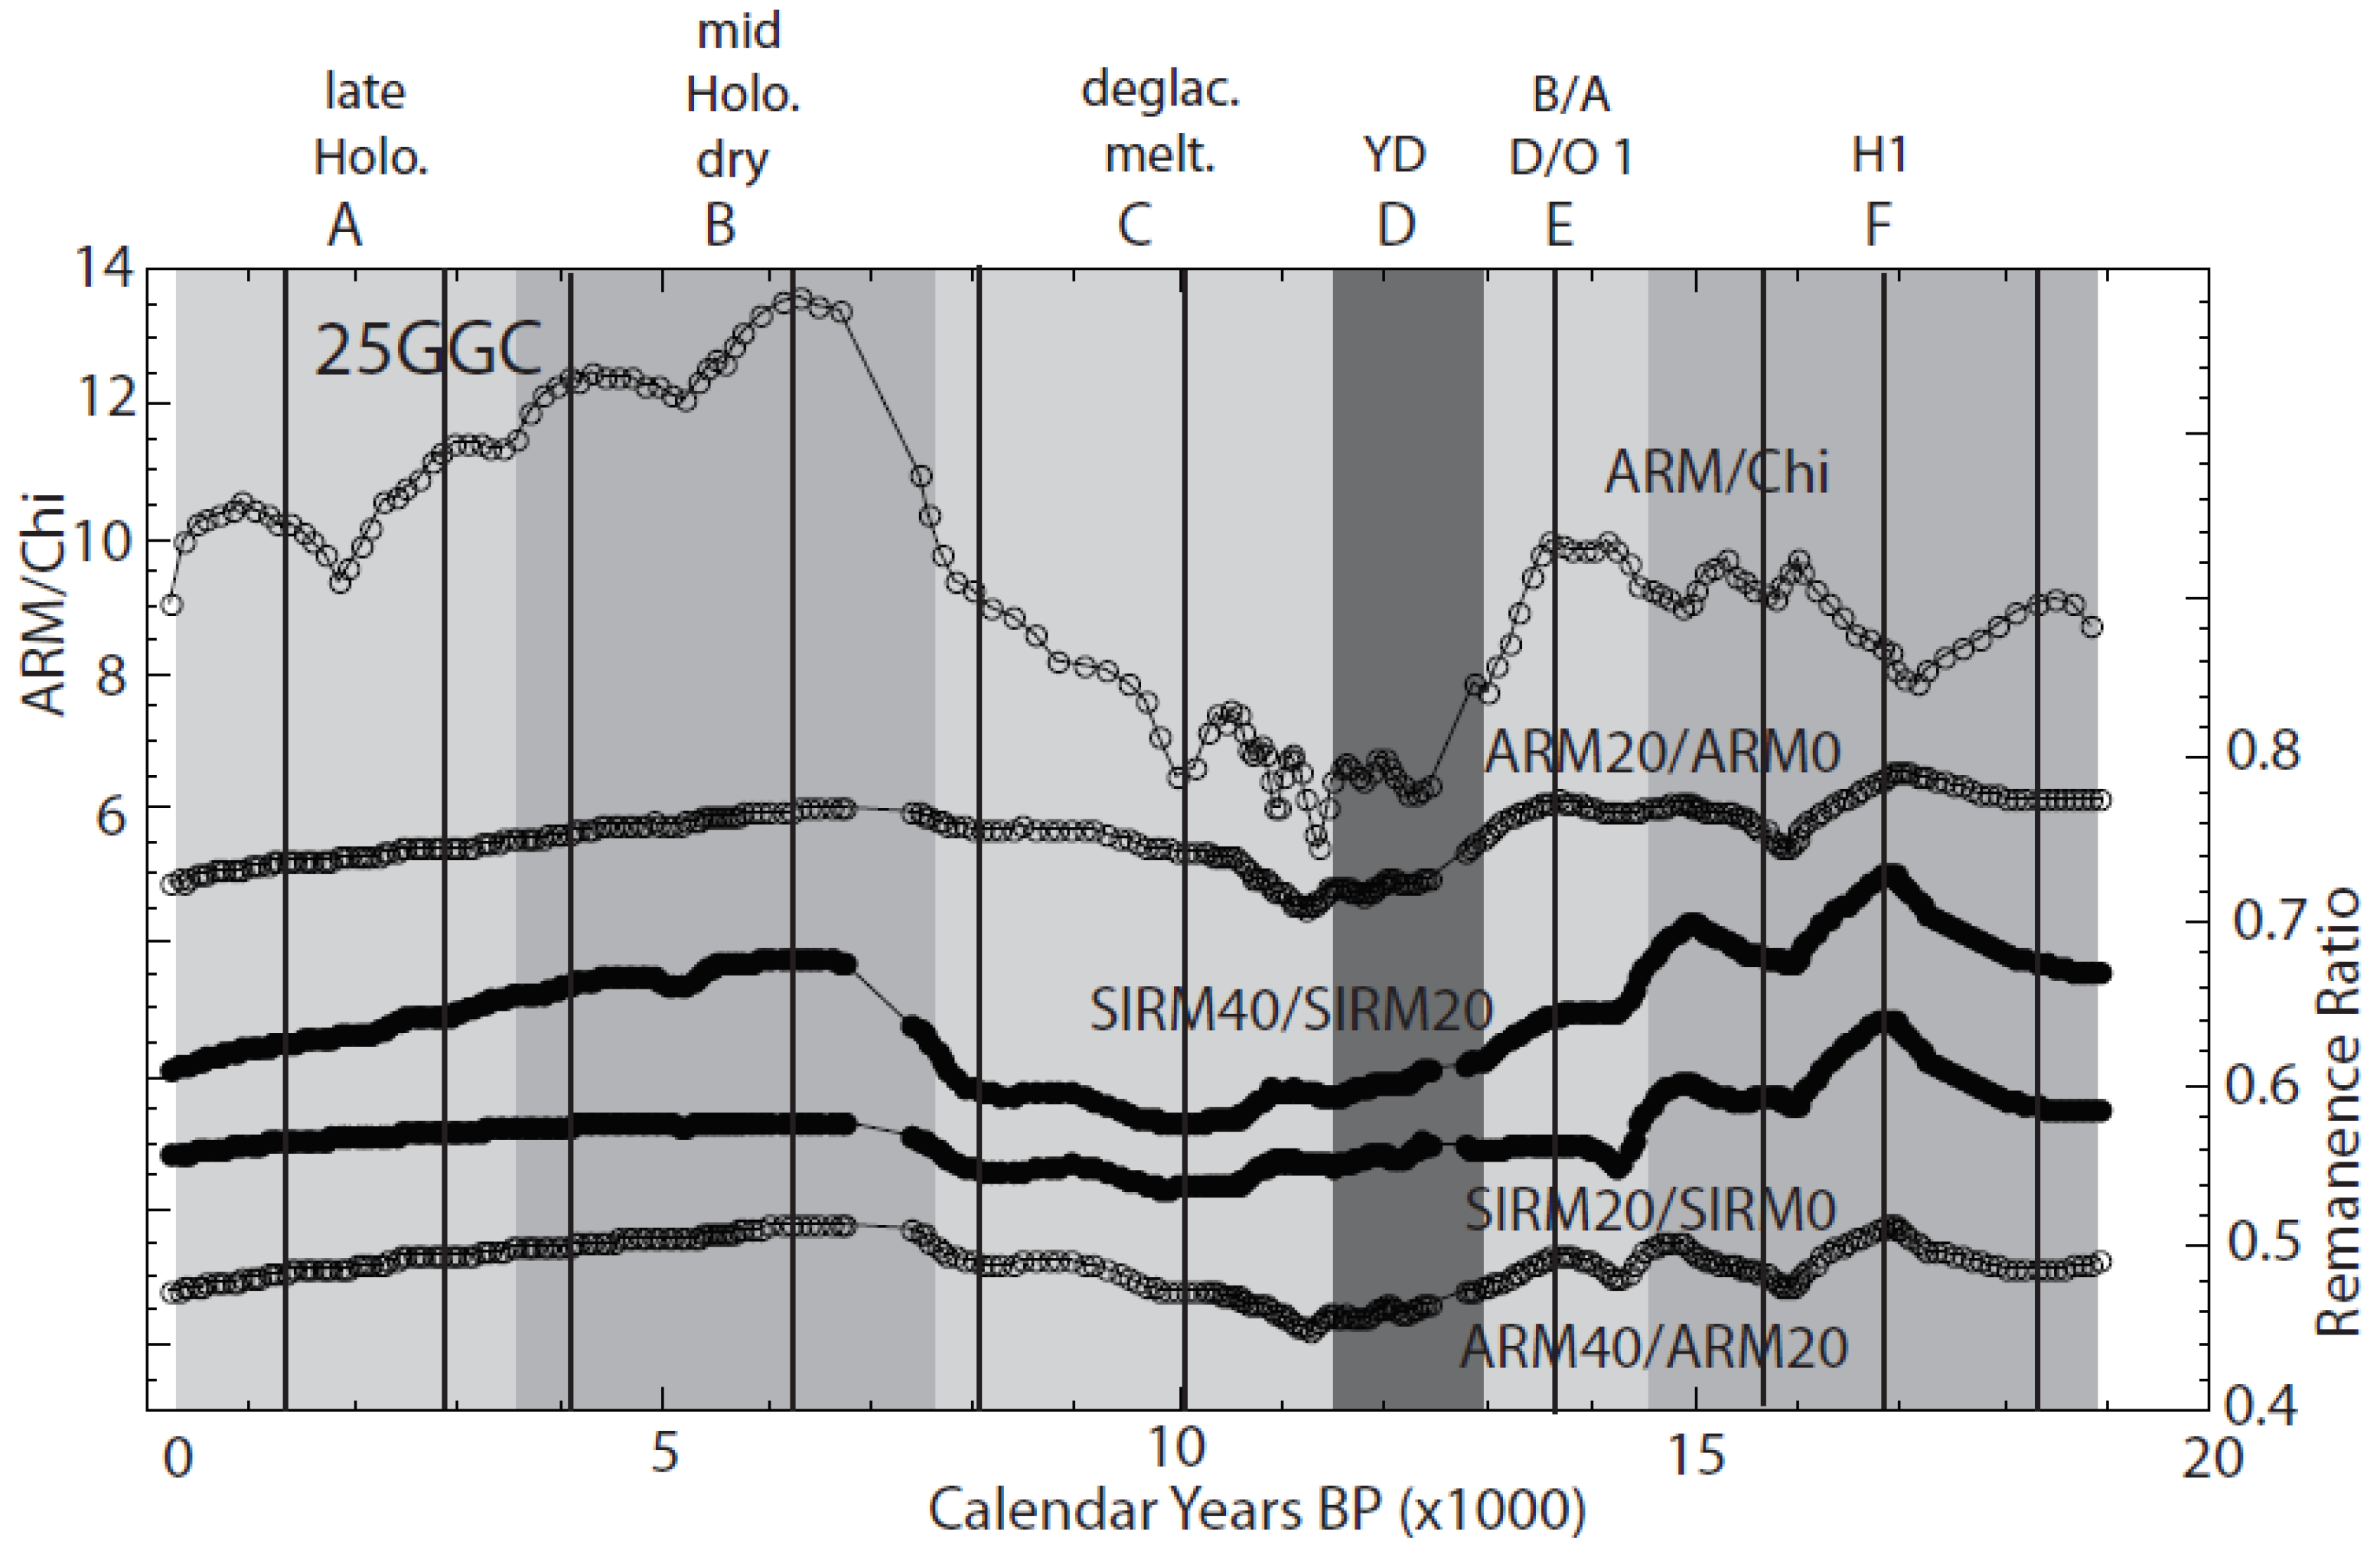
Figure 8 (9GGC) and Figure 9 (25GGC) display the pattern of magnetic coercivity variations over the last 30 ka. The coercivity varies between high (finer-grained clastics) and low (coarser-grained clastics) values and is the same pattern in both cores. The timing of coercivity variations is also consistent with the pattern of intensity variations. High intensities generally go with lower coercivities. This relationship between intensity and coercivity strongly suggests that clastic flux variations in amount and grain size are the primary cause of the observed multi-millennial-scale variability. Higher rates of clastic flux probably indicate stronger outflow from the Amazon delta; this should also yield overall coarser clastic flux. This pattern is consistent with the sedimentation rate variations noted in Figure 5. High intensity–coarser clastic flux intervals that suggest stronger Amazon outflow are also intervals of higher than average sedimentation rate. Additionally, the lower intensity–finer clastic intervals that suggest lower Amazon outflow are also intervals of lower than average sedimentation rate.
Several other deep-sea sediment studies discussed below use Ti/Ca or Fe/Ca from XRF studies to assess clastic flux variability. Delia Oppo (unpublished) [38] supplied us with an XRF and magnetic susceptibility record for core 46CDH (Figure 1, Table 1). The results are plotted in Figure 10. We correlated our multi-millennial-scale variability (intervals A–I) to the Ti/Ca results using the magnetic susceptibility records. The high (low) Ti/Ca intervals (relatively high clastic flux) are consistent with our high-intensity–coarser (low intensity–finer) rock magnetic intervals.
Intervals A–I can be easily associated with known regional to global climate variations over the last 30 ka. Intervals A–C can be associated with Late Holocene (A) and Middle Holocene drought (B) in the Amazon Basin (Maslin and Burns, 2000; Lund et al., 2018) [10,23] and final deglaciation (C) with high Amazon outflow (Maslin et al., 2000; Maslin and Burns, 2000) [9,10]. These three intervals represent Holocene variations in clastic flux, most likely due to variations in multi-millennial-scale rainfall or glacial melting. The low intensity (and modestly higher coercivity, finer-grained) of intervals D, F, and H can be associated with cold intervals (stadials) of the Younger Dryas (YD) and Heinrich events 1 (F) and 2 (H). This observation is consistent with the results of Maslin et al. (2011) [39] for the YD and Heinrich event 1. These cold intervals can also be interpreted as relatively dry intervals. The intervening higher flux (coarser -rained) intervals are associated with the warmer (interstadial) Bolling–Allerod (D/O) cycle 1 (E), D/O cycle 2 (G), and D/O cycles 3–4 (I). These intervals probably represent less cold and wetter intervals within the Amazon Basin. These are all labeled on Figure 6, Figure 7, Figure 8 and Figure 9. There is one complication to this analysis. It is likely that the colder Pleistocene intervals (YD, Heinrich events) are slower North Brazil Current intervals. This change in flow speed might have contributed to the variations in sedimentation rate. However, a number of published studies (discussed below) that show this same multi-millennial-scale pattern of sediment variability all associate the variation predominantly with variable rainfall or runoff from the Amazon Basin to the NE South American margin.
There is also a higher-frequency scale of variability in these records that is more subdued. This pattern is indicated by the solid lines in Figure 6, Figure 7, Figure 8 and Figure 9. The lines indicate local intensity peaks. The relationship with coercivity is more complicated and subdued at best or perhaps there is no relationship at all. These cycles occur in all of the longer-duration intervals noted above. They suggest a higher-frequency oscillation in Amazon outflow, with the black lines indicating times of higher flow (higher clastic flux). These more subtle oscillations in intensity are consistent between cores 9GGC and 25GGC. However, the lack of any notable coercivity variability makes their interpretation more questionable. Table 2 presents the intensity peak ages and the durations between successive peaks. The average duration is ~1750 ± 450 years.
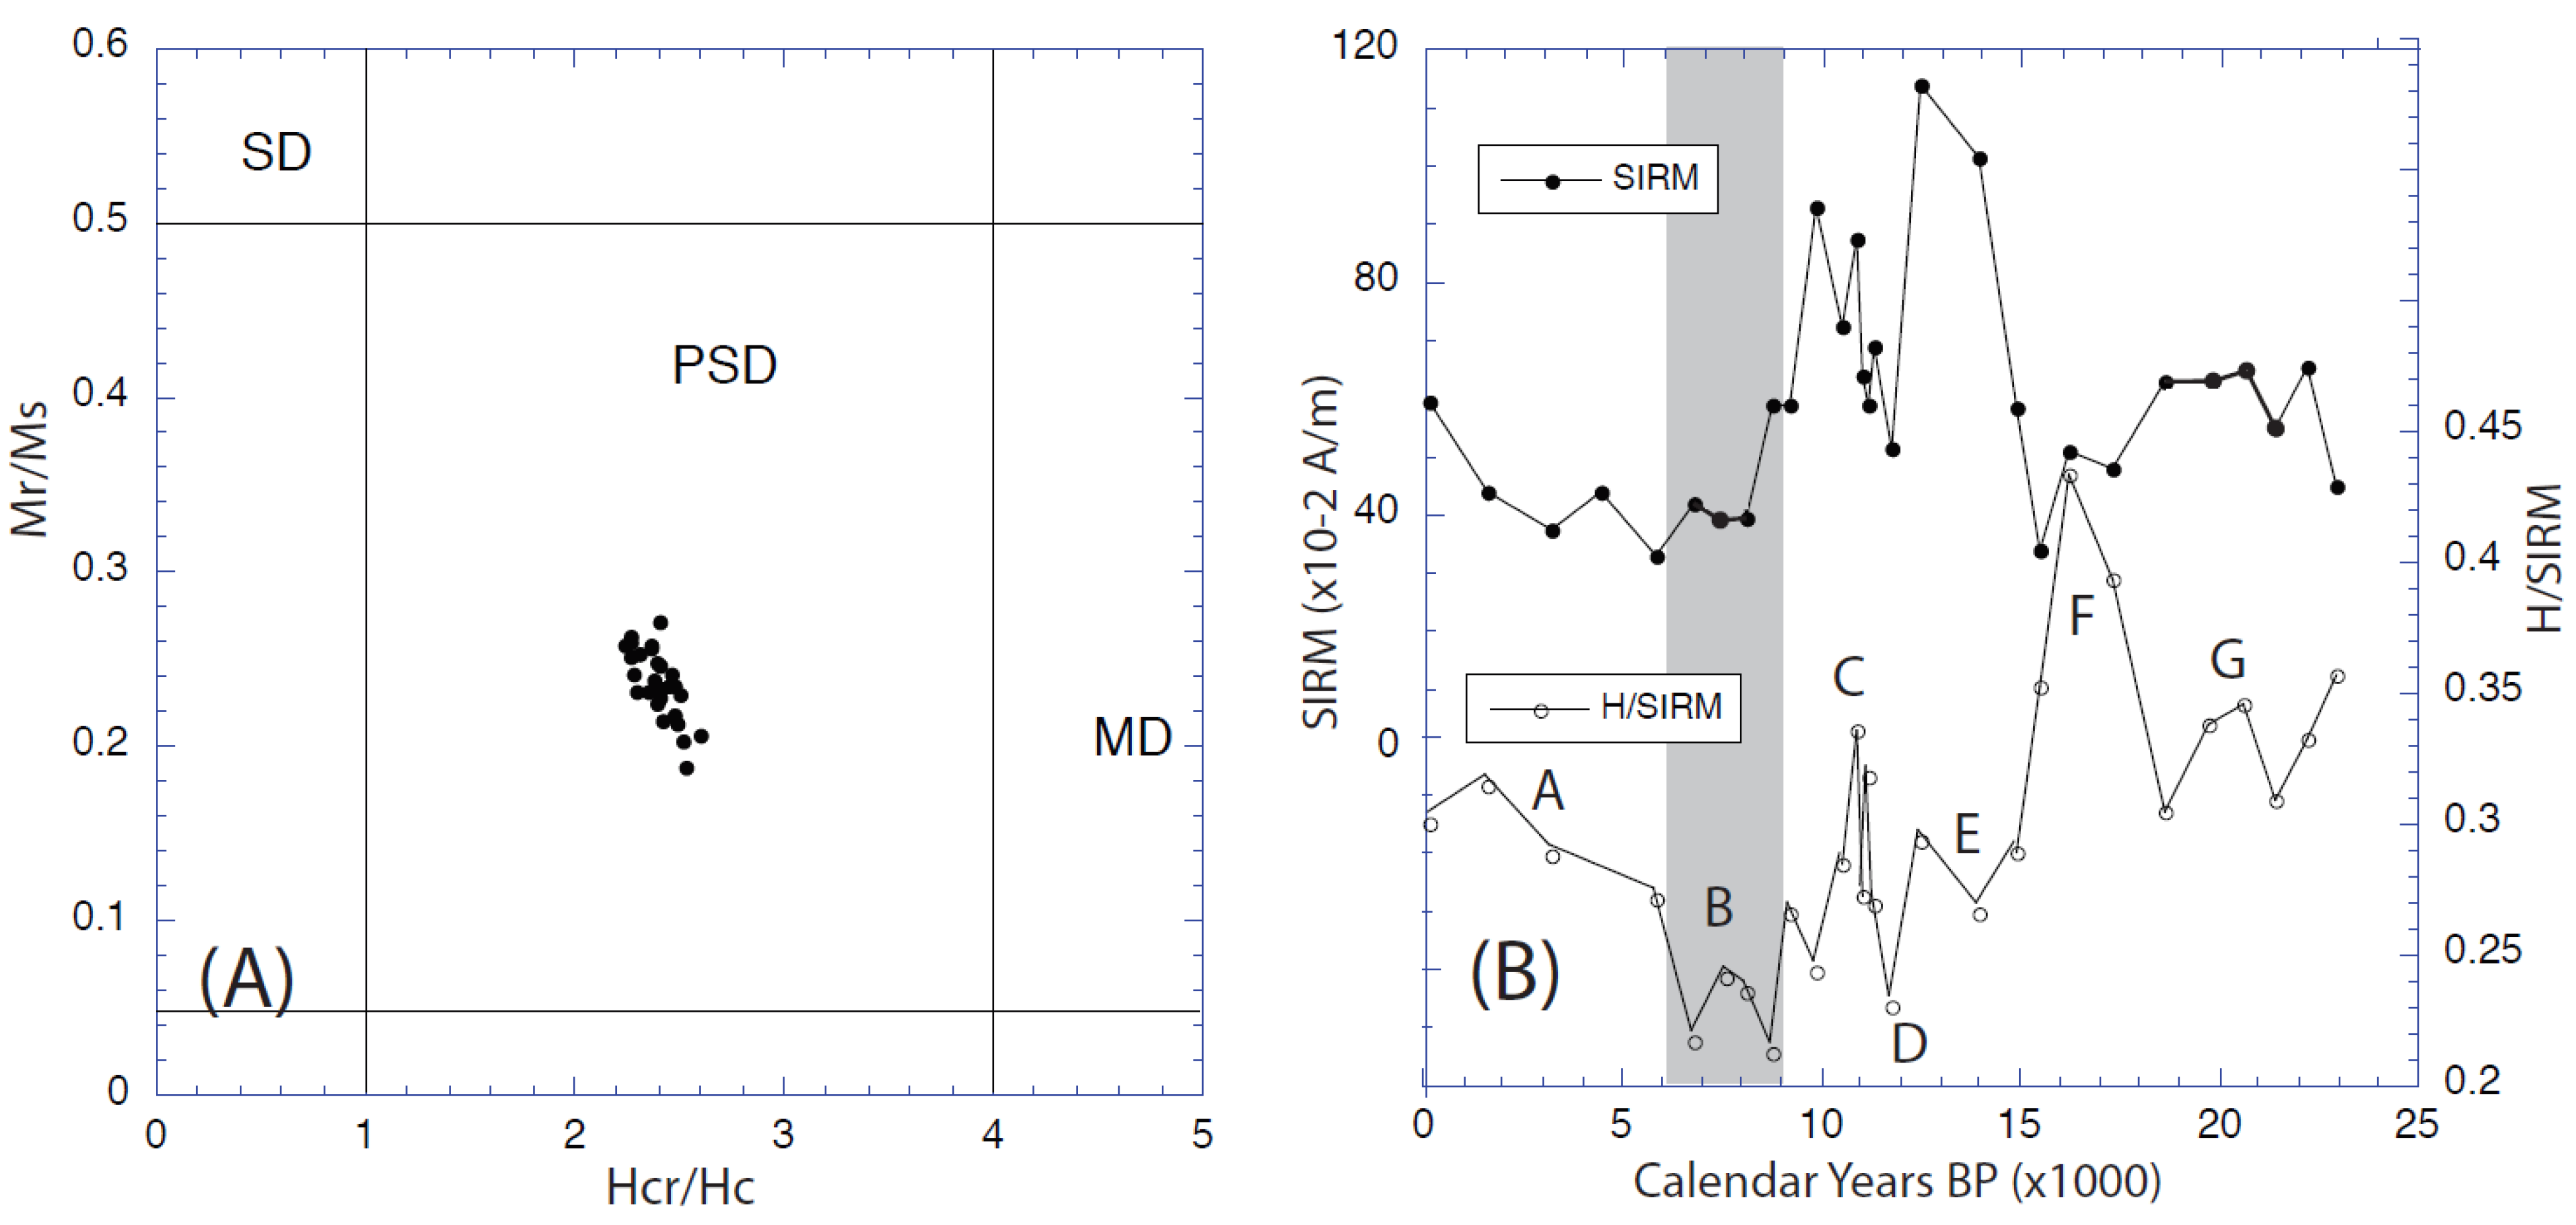
We finally assess the evidence for variations in ferric (primarily hematite)/ferrous (magnetite and titanomagnetite) ratios in the clastic sediments. These ratios indicate the relative importance of ferrous versus ferric components to the overall sediment magnetization. Hysteresis measurements of selected samples from 9GGC are shown in Figure 11. The rock magnetic data suggest that the magnetization is primarily magnetite–titanomagnetite in the size range of ~5–15 microns. This distribution could have varying percentages of coarser (MD) or finer (SD) grains and could still be within the pseudo-single domain (PSD) range for magnetite (Figure 11A). The hysteresis data let us estimate the amount of magnetization that is acquired with increasing magnetic fields; magnetic contributions between 0.3 and 1.0 T are usually referred to as hard components (H), which is associated with ferric minerals (primarily hematite). The ratio of total magnetic remanence to H (H/SIRM; Figure 11B) estimates the relative portion of ferric magnetization in any sediment sample. The time interval 6–9 ka has the lowest ratio of the last 25 ka. Bendle et al. (2010) [35] and Lund et al. (2018) [23] have both documented low H/SIRM ratios in the Early–Middle Holocene (6–9 ka) of deep-sea sediments from the Demerara Abyssal Plain; our results corroborate this. They all indicate that the Amazon Basin itself was relatively dry during the Early–Middle Holocene, with lower than average erosion of Amazon Basin soils (relative to contributions from the Andes).
8. Comparison with Other Records
The first evidence for millennial-scale variability in the tropical Atlantic region was noted by Grimm et al. (1993) [40] in Lake Tulane (27.6° N) in Florida and Curry and Oppo (1997) [41] in the Ceara Rise (5° N), also on the NE South American continental margin. The Lake Tulane study documented enhanced rainfall during Pleistocene North Atlantic cold (Heinrich) events. The Ceara Rise study linked coherent multi-millennial-scale tropical sea-surface temperature and high-latitude North Atlantic temperature variations. Locally, we can compare our deep-sea sediment records with others from the NE margin of South America. Lund et al. (2018) [23] studied rock magnetic variability of Holocene deep-sea sediments from the Amazon Fan–Demerara Abyssal Plain. Our results from this study are the same. Our Pleistocene results (~7° N) can be compared with three other studies along the NE South American margin: the Cariaco Basin (~10° N), Demerara Rise–Amazon Fan (~4° N–7° N), and outboard of the NE Brazilian margin (~1° N–3° S). All of these studies show strong evidence of multi-millennial-scale variability from 12–30 ka, dominated by colder phases associated with the Younger Dryas and Heinrich events 1 and 2 versus warmer phases associated with the Bolling–Allerod and DO cycles 1, 2, and 3.
Our results are consistent with results from the Cariaco Basin (Haug et al. 2001; Deplazes et al., 2013) [27,42] showing lower sedimentation rates and clastic flux during the Younger Dryas, H1, and H2 associated with dryer conditions along NE South America, while the intervening intervals have higher clastic flux associated with heavier rainfall and runoff. These variations are associated with shifts in the long-term position of the Intertropical Convergence Zone (ITCZ).
Haggi et al. (2017) [43] studied the isotopic composition of plant waxes in a deep-sea sediment core from the same region (7° N) as our cores. They suggested that the Amazon rainforest was affected by intrusions of savannah or open framework vegetation types during H1 and H2 associated with drier conditions. The intervening intervals indicated higher Amazon rainfall. This pattern is completely consistent with our Pleistocene multi-millennial-scale variability. They attributed these long-term variations to changes in atmospheric circulation.
Crivellari et al. (2018) [44] studied the H1 interval in more detail in the same deep-sea core as Haggi et al. (2017) [43]. They identified an early part of the H1 interval (HS1a: 17–18 ka) that had higher influx of sediment to the site, however the core of HS1 (HS1b: 15–17 ka) showed a decrease in terrestrial flux. Our results do not show evidence of this two-part structure, however our study and the study by Haggi et al. (2017) [43] do show a broadly drier response to H1.
A group of four deep-sea sediment studies further to the south (1° N–4° S) along the NE Brazilian margin also show the same pattern of multi-millennial-scale environmental variability but with mostly an opposite phasing: colder intervals had higher clastic flux and warmer intervals had lower clastic flux. However, there is some disagreement among these four studies that could be due to chronology issues. Arz et al. (1998) [45] used Ti/Ca XRF ratios to document multi-millennial-scale pulses of significant clastic sedimentation into the Atlantic slope along the NE corner of Brazil (3.5° S). One pulse correlates to H1, but two pulses correlate to warm Bolling–Allerod and DO interstadial 2 phases; the intervening Younger Dryas and H2 cold intervals had low clastic flux. Nace et al. (2014) [46] studied a marine core along the NE Brazilian margin at 0.3° N. They also identified multi-millennial-scale pulses of high clastic flux associated with Ti/Ca XRF data, which they associated with increased precipitation or weathering on the adjacent continent. They correlated these events to multiple (cold) Heinrich events. However, their data actually showed high clastic pulses associated with H1 (~16 ka) and (warm) D/O cycles 2–3 (~30 ka) and low clastic flux at ~26 ka (cold H2). This pattern is consistent with the data from the study by Arz et al. (1998) [45]. Zhang et al. (2015) [47] studied Fe/Ca XRF data from a deep-sea core at 1.6° S and noted higher clastic flux during all three late Pleistocene cold intervals, namely the Younger Dryas, H1, and H2 events. Mulitza et al. (2017) [48] studied a deep-sea sediment core (2° S) in the same region and concluded that both the Younger Dryas and H1 cold intervals were intervals of increased rainfall and higher clastic flux based on Fe/Ca XRF data. These results are opposite to the Younger Dryas and H2 results of Arz et al. (1998) [45] from the same region. Overall, these records do generally support an opposite phase of high clastic flux in cold intervals than we noted for the Demerara Rise.
Speleothem records from the Amazon Basin display similar complexity in Late Pleistocene rainfall variability. Cheng et al. (2013) [49] suggested that broadly the eastern Amazon region had lower rainfall during the late Pleistocene versus the western Amazon region. This might support our observation that NW marine records (Cariaco Basin, Demerara Rise) had an out-of-phase relationship for rainfall and runoff with SE marine records (NE Brazilian margin). Cheng et al (2013) [49] also noted that both regions had multi-millennial-scale variability on top of longer-duration orbital-scale variability with wetter intervals in NE Brazil (Rio Grande do Norte record) during the H1 and H2 stadials. This is consistent with the NE Brazilian margin marine records noted above. Wang et al. (2017) [50] also noted a similar pattern of multi-millenial-scale rainfall variability in their Paraiso speleothem record (~3° S) of NE Brazil.
9. Discussion
Cores 9GGC and 25GGC are dominated by millennial- to multi-millennial-scale variability throughout their entire extent. It is worthwhile noting that the timescales of variability do not significantly change between the Holocene and the Pleistocene. The dominant variability seems to follow a simple oscillatory multi-millennial pattern of wet versus dry conditions in the Amazon Basin (stronger and faster Amazon outflow with coarser clastic grains during wetter conditions versus lower and weaker Amazon outflow with finer clastic grains during drier conditions) in NE South America. Intervals A, C, E, G, and I are associated with relatively wet conditions (and strong Amazon flow), while intervals B, D, F, and H are associated with relatively dry conditions (and weaker Amazon flow). The sediments reach the Demerara Rise from the Amazon outflow under control of the North Brazil Current after passing the local shelf. Coarser (finer) clastic grains are more (or less) likely to reach the North Brazil current under conditions of higher (or lower) Amazon flow. The deep-sea sediment records south of the Amazon Fan (NE Brazilian margin, 1° N–4° S) suggest an out-of-phase relationship with our Demerara Rise results and suggest that NE Brazil to the east of the Amazon River delta receives most rainfall and runoff when the Demerara Rise and Cariaco Basin are drier. This also suggests that when we consider Amazon River outflow versus NE Brazil outflow, we are talking about western versus eastern Amazon Basin patterns as a whole.
Multi-millennial-scale intervals A–C are of the Holocene–Glacial transition in age. This interval seems to associate low rainfall and Amazon flow to warmer conditions (Middle Holocene warmth—B) and higher rainfall and Amazon flow to cooler conditions (Late Holocene—A; glacial transition—C). On the other hand, the Pleistocene intervals (e.g., Stuiver and Grootes, 2000 [51]; Cronin, 2009 [52]) D–I have an opposite relationship between Amazon flow and rainfall and temperature. Intervals D (Younger Dryas), F (H1), and H (H2) are all times of low rainfall and Amazon flow with colder conditions, while intervals E (Bolling–Allerod), G (D/O interstadial 2), and I (D/O interstadials 3–4) are times of strong rainfall and Amazon flow and warmer conditions. On this basis, we argue that multi-millennial-scale cyclicity in the Holocene is out of phase with multi-millennial-scale variability in the Pleistocene.
The higher-frequency magnetic intensity variability indicated by vertical black lines in Figure 6, Figure 7, Figure 8 and Figure 9 suggests another level of wet–dry oscillation associated with Amazon Basin hydrology and Amazon outflow. However, the data do not show a consistent associated variation in coercivity, and so the interpretation of this more subtle higher-frequency variability is more questionable. Even so, there is a great deal of evidence for millennial-scale environmental variability (e.g., Bond et al., 1997 [53]), most dominantly with ~1500 year cyclicity. The average duration of our successive millennial-scale high intensity peaks is 1794 ± 482 years (Table 2). All of our cycles that are common to both 9GGC and 25GGC have an average of ~1600 years. The pre 20 ka interval in 9GGC alone shows three intervals with ~2600 year cyclicity (underlined in Table 2). As noted previously, our millennial-scale intensity cycles are not as notable as our longer-term cycles. If we are simply missing three cycles in the pre 20ka interval of 9GGC then it seems that our millennial-scale intensity variability is consistent with previous estimates of ~1500 year cyclicity.
Several of the published studies discussed above have commented on possible mechanisms for tropical environmental variability. One process that fits the overall data is multi-millennial-sale variation in the placement of the Intertropical Convergence Zone (ITCZ). More southerly average placement will enhance NE South America and Amazon Basin rainfall. More northerly placement will lead to drier conditions. Haug et al. (2001) [27] suggested this mechanism caused a wet early Holocene wet interval in the Cariaco Basin (10.5° N) further to the northwest along the NE South American margin. This occurred at the same time as our interval B (early Holocene dry conditions), which was also noted in other nearby cores of the Demerara Rise by Lund et al. (2018) [23]. This pattern is also consistent with Lake Tulane wet intervals during Pleistocene Heinrich (cold) events versus our dry events in cold intervals D, F, and H.
The dominance of millennial- to multi-millennial-scale environmental variability in the tropical North Atlantic Ocean is also interesting to note given the recent study by Obrochta et al. (2012) [54] on variability of a similar scale in the high-latitude North Atlantic Ocean (ODP Site 609). They focused on the Late Quaternary ice-rafting evidence for a “1500-year cycle” in climate variability over the last glacial cycle. They suggested that much of that cyclicity might be better interpreted as an admixture of ~1000 and ~2000 year cycles (Obrochta et al., 2012) [54]. It seems clear that the entire Atlantic region has been subject to continuing millennial- to multi-millennial-scale variability over the Late Quaternary, however the cause(s) of that regional climate pattern and the relationship between tropical and high-latitude North Atlantic variability are still not certain.
10. Conclusions
We have carried out a rock magnetic study of two deep-sea gravity cores (9GGC and 25GGC) from the Demerara Rise, NE South America. Previous studies (Huang et al., 2014 [12]; Lund et al., 2017 [11]) provided radiocarbon and paleomagnetic chronologies for these cores. In this study, we performed detailed rock magnetic measurements on these cores to characterize the rock magnetic mineralogy, magnetic concentration, and magnetic grain size as an indicator of the overall clastic fraction of the cores. We measured the magnetic susceptibility (chi), anhysteretic remanence (ARM), and isothermal remanence (SIRM) and demagnetized the remanences at several levels of af demagnetization. The magnetic intensities estimate the proportion of magnetic material (and indirectly overall clastic fraction) in the cores. The ratios of rock magnetic parameters (ARM/chi, ARM10/ARM0, SIRM10/SIRM0) indicate the relative grain size of the magnetic material (and indirectly the overall clastic grain size). Selected hysteresis measurements also gave us a sense of the variation in ferric (goethite, hematite)/ferrous (magnetite, titanomagnetite) ratios for the magnetic minerals.
The rock magnetic intensity parameters (chi, ARM, SIRM) and the rock magnetic ratios (ARM/chi, ARM10/ARM0, SIRM10/SIRM0) both vary systematically and synchronously over the last 30,000 years in both cores. There is clear evidence of a multi-millennial-scale pattern of cyclicity, with intervals of high magnetic intensity (high magnetic and clastic content) and low magnetic ratios (coarser magnetic and clastic grain size) alternating in sequence. There is also evidence of finer millennial-scale variability in intensity superposed on the multi-millennial-scale variability, with an average cycle duration of ~1800 ± 500 years. There are nine (A–I) multi-millennial-scale intervals in the cores. Intervals A, C, E, G, and I have high magnetic and clastic content with coarser overall magnetic and clastic grain size and are likely intervals of enhanced rainfall and runoff from the NE South American margin to the coastal ocean. Alternatively, intervals B, D, F, and H represent periods of lower clastic flux with finer overall grain size, probably indicating lower rainfall and runoff from the continental margin. During the Holocene, high rainfall and runoff intervals can be related to cooler times and low rainfall and runoff to warmer times. The opposite pattern is true during the Pleistocene, with higher rainfall and runoff occurring during interstadial conditions and lower rainfall and runoff occurring during stadial conditions. The highest ferric/ferrous ratios occur during Holocene interval B (low rainfall and runoff) during the Early Holocene warm interval ~5–9 ka. We associated that interval with drought conditions in the Amazon region, consistent with previous estimates of Amazon flow in this interval (Maslin and Burns, 2000 [10]; Bendle et al., 2010 [35]; Lund et al., 2018 [23]).
We noted a similar pattern of Pleistocene multi-millennial-scale variability in published marine deep-sea core studies from Cariaco Basin (~10° N) to the NE Brazilian margin (~1° N–4° S). These studies documented clastic flux variability using XRF measurements of Ti and Fe. However, it seems likely that the NW part of this transect (Cariaco Basin, Demerara Rise, Amazon fan) has out-of-phase warm–cold wet–dry relationships that support the notion of the eastern Amazon Basin and western Amazon being alternately wetter or drier. One possible cause of the high–low rainfall–runoff patterns might be oscillation of the Intertropical Convergence Zone (ITCZ), with higher rainfall and runoff associated with a more southerly average position of the ITCZ and lower rainfall–runoff associated with a more northerly average position of the ITCZ.
Supplementary Materials
Supplementary materials can be found at https://0-www-mdpi-com.brum.beds.ac.uk/2673-1924/2/1/15/s1, Supplementary Table S1: Correlations for revised chronostratigraphy.
Author Contributions
Writing—S.L., Data acquisition—S.L. and E.P., data analysis—S.L. and E.P. All authors have read and agreed to the published version of the manuscript.
Funding
NSF grant EAR1547605.
Conflicts of Interest
The authors declare no conflict of interest.
References
- Kuehl, S.A.; DeMaster, D.J.; Nittroucr, C.A. Nature of sediment accumulation on the Amazon continental shelf. Cont. Shelf Res. 1986, 6, 209–225. [Google Scholar] [CrossRef]
- Franzinelli, E.; Potter, P. Petrology, chemistry and texture of Amazon River sands, Amazon River system. J. Geol. 1983, 91, 23–39. [Google Scholar] [CrossRef]
- Milliman, J.; Meade, R. World-wide delivery of river sediments to the oceans. J. Geol. 1983, 91, 1–21. [Google Scholar] [CrossRef]
- Meade, R. Suspended sediment of the modern Amazon and Orinoco Rivers. Quat. Int. 1994, 21, 29–39. [Google Scholar] [CrossRef]
- Damuth, J.E.; Fairbridge, R.W. Equatorial Atlantic deep-sea arkosic sands and ice-age aridity in tropical South America. Geol. Soc. Am. Bull. 1970, 81, 189–206. [Google Scholar] [CrossRef]
- Damuth, J.; Kumar, N. Amazon cone, morphology, sediments, age, and growth pattern. Geol. Soc. Am. Bull. 1975, 86, 863–878. [Google Scholar] [CrossRef]
- Damuth, J.E.; Flood, R.D. Amazon Fan, Atlantic Ocean. In Submarine Fans and Related Turbidite Systems; Bouma, A.H., Barnes, N.E., Nomwk, W.R., Eds.; Springer: New York, NY, USA, 1985; pp. 91–106. [Google Scholar]
- Flood, R.D.; Piper, D.J.W. Shipboard Scientific Party. In Proceedings of the Ocean Drilling Program, Initial Reports 155; Texas A&M University Digital Library: Killeen, TX, USA, 1995. [Google Scholar] [CrossRef]
- Maslin, M.; Durham, E.; Burns, S.; Platzman, E.; Grootes, P.; Greig, S.; Nadau, M.; Schleicher, M.; Pflauman, U.; Lomax, B.; et al. Paleoreconstruction of the Amazon River freshwater and sediment discharge using sediments recovered from Site 942 on the Amazon Fan. J. Quat. Sci. 2000, 15, 419–434. [Google Scholar] [CrossRef]
- Maslin, M.; Burns, S. Reconstruction of the Amazon Basin effective moisture availability over the past 14,000 years. Science 2000, 290, 2285–2289. [Google Scholar]
- Lund, S.; Oppo, D.; Curry, W. Late quaternary paleomagnetic secular variation recorded in deep-sea sediments from the Demerara Rise, Equatorial west Atlantic Ocean. Phys. Earth Planet. Int. 2017, 272, 17–26. [Google Scholar] [CrossRef]
- Huang, K.; Oppo, D.; Curry, W. Decreased influence of Antarctic Intermediate Water in the tropical Atlantic during North atlantic cold events. Earth Planet. Sci. Lett. 2014, 389, 200–208. [Google Scholar] [CrossRef] [Green Version]
- Berger, W.H.; Wefer, G. Central themes of South Atlantic circulation. In The South Atlantic: Present and Past Circulation; Wefer, G., Berger, W.H., Siedler, G., Webb, D.J., Eds.; Springer: Heidelberg, Germany, 1996; pp. 1–11. [Google Scholar]
- Schmitz, W.; McCartney, W. On the North Alatntic circulation. Rev. Geophys. 1993, 31, 29–49. [Google Scholar] [CrossRef]
- Metcalf, W.G.; Stalcup, M.C. Origin of the Atlantic Equatorial Undercurrent. J. Geophys. Res. 1967, 72, 4959–4975. [Google Scholar] [CrossRef]
- Kirchner, K.; Rhein, M.; Huttl-Kabus, S.; Boning, C. On the spreading of South Atlantic water into the Northern Hemisphere. J. Geophys. Res. 2009, 114, C05019. [Google Scholar] [CrossRef] [Green Version]
- Stramma, L.; Fischer, J.; Reppin, J. The North Brazil Undercurrent. Deep Sea Res. Part I 1995, 4, 773–795. [Google Scholar] [CrossRef] [Green Version]
- Ruhlemann, C.; Diekmann, B.; Mulitza, S.; Frank, M. Late Quaternary changes of western equatorial Atlantic surface circulation and Amazon lowland climate recorded in Ceara Rise deep-sea sediments. Paleoceanography 2001, 6, 293–305. [Google Scholar] [CrossRef] [Green Version]
- Figueiredo, A.; Nittrouer, C. New insights to high-resolution stratigraphy on the Amazon continental shelf. Mar. Geol. 1995, 125, 393–399. [Google Scholar] [CrossRef]
- Nittrouer, C.; Kuehl, S.; Sternberg, R.; Figuerido, A.; Faria, L. An introduction to the geological significance of sediment transport and accumulation on the Amazon continental shelf. Mar. Geol. 1995, 125, 177–192. [Google Scholar] [CrossRef]
- Smith, W.O.; Demaster, D.J. Phytoplankton biomass and productivity in the Amazon River plume: Correlation with seasonal river discharge. Cont. Shelf Res. 1996, 16, 291–319. [Google Scholar] [CrossRef]
- Nittrouer, C.A.; DeMaster, D.J. Sedimentary processes on the Amazon continental shelf: Past, present and future research. Cont. Shelf Res. 1986, 6, 5–30. [Google Scholar] [CrossRef]
- Lund, S.; Mortazavi, E.; Chong, L.; Platzman, E.; Berelson, W. Holocene sedimentation on the distal Amazon Fan/Demerara Abyssal Plain. Mar. Geol. 2018, 404, 147–157. [Google Scholar] [CrossRef]
- Damuth, J. Late Quaternary sedimentation in the western equatorial Atlantic. Geol. Soc. Am. Bull. 1977, 88, 695–710. [Google Scholar] [CrossRef]
- Meinert, J.; Bloemedal, J. A comparison of acoustic and rock-magnetic properties of equatorial Atalantic deep-sea sediments: Paleooceanographic implications. Earth Planet. Sci. Lett. 1989, 94, 291–300. [Google Scholar] [CrossRef]
- Wainer, I.; Soares, J. Northeast Brazil and its decadal-scale relationship to wind stress and sea surface temperature. Geophys. Res. Lett. 1997, 24, 277–280. [Google Scholar] [CrossRef]
- Haug, G.; Hughen, K.; Sigman, D.; Peterson, L.; Rohl, L. Southward migration of the intertropical convergence zone through the Holocene. Science 2001, 293, 1304–1308. [Google Scholar] [CrossRef] [PubMed]
- Mayle, F.; Beerling, D.; Gosling, W.; Bush, M. Response of Amazonian ecosystems to climatic and atmosphereic carbon dioxide change since the last glacial maximum. Philos. Trans. R. Soc. Lond. Ser. B Biol. Sci. 2004, 359, 499–514. [Google Scholar] [CrossRef] [PubMed] [Green Version]
- Mayle, F.; Power, M. Impact of a drier Early-Mid Holocene climate upon Amazonian forests. Philos. Trans. R. Soc. Lond. Ser. B Biol. Sci. 2008, 363, 1829–1838. [Google Scholar] [CrossRef] [PubMed] [Green Version]
- Thompson, L.G.; Davis, M.E.; Mosley-Thompson, E.; Sowers, T.A.; Henderson, K.A.; Zagorodnov, V.S.; Lin, P.-N.; Mikhalenko, V.N.; Campen, R.K.; Bolzan, J.F.; et al. A 25,000-year tropical climate history from Bolivian ice cores. Science 1998, 282, 1858–1864. [Google Scholar] [CrossRef]
- Seltzer, G.; Rodbell, D.; Burns, S. Isotopic evidence for late Quaternary climatic change in tropical South America. Geology 2000, 28, 35–38. [Google Scholar] [CrossRef]
- Abbott, M.B.; Wolfe, B.B.; Wolfe, A.P.; Seltzer, G.O.; Aravena, R.; Mark, B.G.; Polissar, P.J.; Rodbell, D.T.; Rowe, H.D.; Vuille, M. Holocene paleohydrology and glacial history of the central Andes using multiproxy lake sediment studies. Palaeogeogr. Palaeoclim. Palaeoecol. 2003, 194, 123–138. [Google Scholar] [CrossRef]
- Bush, M.B.; Hansen, B.C.S.; Rodbell, D.T.; Seltzer, G.O.; Young, K.R.; Leon, B.; Abbott, M.B.; Silman, M.R.; Gosling, W.D. A 17,000-year history of Andean climate and vegetation change from Laguna de Chochos, Peru. J. Quat. Sci. 2005, 20, 703–714. [Google Scholar] [CrossRef]
- Franke, C.; von Dobeneck, T.; Drury, M.; Meeldjik, J.; Dekkers, M. Magnetic petrology of equatorial Atlntic sediments: Electron microscopy results and their implications for environmental magnetic interpretation. Paleoceanography 2007, 22. [Google Scholar] [CrossRef]
- Bendle, J.A.; Weijers, J.W.H.; Maslin, M.A.; Sinninghe Damsté, J.S.; Schouten, S.; Hopmans, E.C.; Boot, C.S.; Pancost, R.D. Major changes in glacial and Holocene terrestrial temperatures and sources of organic carbon recorded in the Amazon fan by tetraether lipids. Geochem. Geophys. Geosyst. 2010, 11, 21–31. [Google Scholar] [CrossRef] [Green Version]
- Stacey, F.D.; Banerjee, S.K. The Physical Principles of Rock Magnetism; Elsevier: Amsterdam, The Netherlands, 1974. [Google Scholar]
- Bloemendal, J.; Lamb, B.; King, J. Paleoenvironmental implications of rock-magnetic properties of late Quaternary sediment cores from the eastern equatorial Atlantic. Paleoceanography 1988, 3, 61–87. [Google Scholar] [CrossRef]
- Oppo, D. Xray Fluorescence Studies of CDH 46. Unpublished work. 2021. [Google Scholar]
- Maslin, M.; Ettwein, V.; Wilson, K.; Guilderson, T.; Burns, S.; Leng, M. Dynamic boundary-monsoon intensity hypothesis: Evidence from the deglacial Amazon River discharge record. Quat. Sci. Rev. 2011, 30, 3823–3833. [Google Scholar] [CrossRef]
- Grimm, E.; Jacobson, G.; Watts, W.; Nansen, B.; Maasch, K. A 50,000 year record of climate oscillations from Florida and its temporal correlation with the Heinrich Events. Science 1993, 261, 198–200. [Google Scholar] [CrossRef] [PubMed]
- Curry, W.; Oppo, D. Synchronous high-frequency oscillations I ntropical sea surface temperatures and North Atlantic deep water production during the last glacial cycle. Paleoceanography 1997, 12, 1–14. [Google Scholar] [CrossRef]
- Deplazes, G.; Lukge, A.; Peterson, L.; Timmerman, A.; Hamann, Y.; Hughen, K.; Rohl, U.; Laj, C.; Cane, M.; Sigman, D. Links between tropical rainfall and North Atlantic climate during the last glacial period. Nat. Geosci. 2013, 6, 213–217. [Google Scholar] [CrossRef]
- Haggi, C.; Chiessi, C.; Merkel, U.; Mulitza, S.; Prange, M.; Schultz, M.; Schfus, E. Reponse of the Amazon rainforest to late Pleistocene climate variability. Earth Planet. Sci. Lett. 2017, 479, 50–59. [Google Scholar] [CrossRef]
- Crivellari, S.; Chiessi, C.M.; Kuhnert, H.; Häggi, C.; Portilho-Ramos, R.D.C.; Zeng, J.-Y.; Zhang, Y.; Schefuß, E.; Mollenhauer, G.; Hefter, J.; et al. Increased Amazon freshwater discharge during late Heinrich Stadial 1. Quat. Sci. Rev. 2018, 181, 144–155. [Google Scholar] [CrossRef]
- Arz, H.W.; Patzold, J.; Wefer, G. Correlated millennial-scale changes in surface hydrography and terrigenous sediment yields inferred from last-glacial marine deposits off northeastern Brazil. Quat. Res. 1998, 50, 157–166. [Google Scholar] [CrossRef]
- Nace, T.E.; Baker, P.A.; Dwyer, G.S.; Silva, C.G.; Rigsby, C.A.; Burns, S.J.; Giosan, L.; Otto-Bliesner, B.; Liu, Z.; Zhu, J. The role of North Brazil current in the paleoclimate of the Brazilian NE margin and paleoceanography of the west tropical Atlantic during the late Quaternary. Palaeogeogr. Palaeoclim. Palaeoecol. 2014, 415, 3–13. [Google Scholar] [CrossRef]
- Zhang, Y.; Chiessi, C.; Mulitza, S.; Zabel, M.; Trindade, R.; Hollanda, M.; Dantas, E.; Govin, A.; Tiedemann, R.; Wefer, G. Origin of increased terrestrial supply to the NE South American contintal margin during HS1 and the Younger Dryas. Earth Planet. Sci. Lett. 2015, 432, 493–500. [Google Scholar] [CrossRef]
- Mulitza, S.; Chiessi, C.M.; Schefus, E.; Lippold, J.; Wichmann, D.; Antz, B.; Mackenson, A.; Paul, A.; Prange, M.; Rehfeld, K.; et al. Synchronous and proportional deglacia lchanges in Atlantic meridional overturning and NE Brazilian precipitation. Paleoceanography 2017, 32, 622–633. [Google Scholar] [CrossRef] [Green Version]
- Cheng, H.; Sinha, A.; Cruz, F.; Wang, X.; Edwards, L.; D’Horta, F.; Ribas, C.; Vuille, M.; Stott, L.; Auler, A. Climate change patterns in Amazonia and biodiversity. Nat. Commun. 2013, 4, 1411. [Google Scholar] [CrossRef]
- Wang, X.; Edwards, L.; Auler, A.; Chang, H.; Kong, X.; Wang, Y.; Cruz, F.; Dorale, J.; Chiang, H. Hydroclimate changes across the Amazon lowlands over the last 45,000 years. Nature 2017, 541, 204–207. [Google Scholar] [CrossRef] [PubMed]
- Stuiver, M.; Grootes, P. GISP2 oxygen isotope ratios. Quat. Res. 2000, 53, 277–284. [Google Scholar] [CrossRef]
- Cronin, T. Paleoclimates: Understanding Climate Change Past and Present; Columbia University Press: New York, NY, USA, 2009. [Google Scholar]
- Bond, G.; Showers, W.; Cheseby, M.; Lotti, R.; Almasi, P.; deMenocal, P.; Priore, P.; Cullen, H.; Hajdas, I.; Bonani, G. A pervasive millenial-scale cycle in North Atlantic Holocene and glacial climates. Science 1997, 278, 1257–1266. [Google Scholar] [CrossRef]
- Obrochta, S.; Miyahara, H.; Yokoyama, Y.; Crowley, T. A re-examination of evidence for the North Atlantic 1500-year cycle at Site 609. Quat. Sci. Rev. 2012, 55, 23–33. [Google Scholar] [CrossRef]
Figure 1.
(A) Map of the northeastern continental margin of South America showing the Demerara Rise and general flow of the surface North Brazil Current. (B) Demerara Rise bathymetry and locations of our studied cores (stars).
Figure 1.
(A) Map of the northeastern continental margin of South America showing the Demerara Rise and general flow of the surface North Brazil Current. (B) Demerara Rise bathymetry and locations of our studied cores (stars).

Figure 2.
Rock magnetic intensity variability of gravity core 9GGC. Individual rock magnetic intensities are shown as Chi, anhysteretic remanence (ARM), and saturation isothermal remanence (SIRM) values. See text for further discussion.
Figure 2.
Rock magnetic intensity variability of gravity core 9GGC. Individual rock magnetic intensities are shown as Chi, anhysteretic remanence (ARM), and saturation isothermal remanence (SIRM) values. See text for further discussion.

Figure 3.
Rock magnetic intensity variability of gravity core 25GGC. Individual rock magnetic intensities are shown as Chi, anhysteretic remanence (ARM), and saturation isothermal remanence (SIRM) values. See text for further discussion.
Figure 3.
Rock magnetic intensity variability of gravity core 25GGC. Individual rock magnetic intensities are shown as Chi, anhysteretic remanence (ARM), and saturation isothermal remanence (SIRM) values. See text for further discussion.

Figure 4.
Time–depth plots for cores 9GGC and 25GGC. The open circles are calibrated radiocarbon dates used by Lund et al. (2017) [11] with linear interpolation to dates the cores. We built a revised chronology, as summarized in Supplementary Table S1, to create the more detailed chronologies shown here (dark lines).

Figure 5.
Sedimentation rates for GGC9 and GGC25. There is a multi-millennial-scale alternation in sedimentation rates (faster–slower) that is indicated by grey versus white zones labeled A–I. These correspond to labeled zones in Figure 6, Figure 7, Figure 8 and Figure 9.

Figure 6.
Rock magnetic intensity variability for core 9GGC versus time. Alternating light and dark grey zones are multi-millennial-scale oscillations in magnetic intensity (light = higher intensity, dark = lower intensity) labeled A-I. Vertical lines estimate finer-scale millennial intensity peaks that are superposed on the longer-term variability.

Figure 7.
Rock magnetic intensity variability for core 25GGC versus time. Alternating light and dark grey zones are multi-millennial-scale oscillations in magnetic intensity (light = higher intensity; dark = lower intensity) labeled A–I. Vertical lines estimate finer-scale millennial intensity peaks that are superposed on the longer-term variability.

Figure 8.
Rock magnetic coercivity variability for core 9GGC versus time. Alternating light and dark grey zones are multi-millennial-scale oscillations in magnetic coercivity (light = lower coercivity or coarser-grained; dark = higher coercivity or finer-grained) labeled A–I. Vertical lines indicate finer-scale millennial intensity peaks noted in Figure 6 and Figure 7. There is no significant evidence for coercivity variations associated with those intensity variations.

Figure 9.
Rock magnetic coercivity variability for core 25GGC versus time. Alternating light and dark grey zones are multi-millennial-scale oscillations in magnetic coercivity (light = lower coercivity or coarser-grained; dark = higher coercivity or finer-grained) labeled A–I. Vertical lines indicate finer-scale millennial intensity peaks in Figure 6 and Figure 7. There is no significant evidence for coercivity variations associated with those intensity variations.

Figure 10.
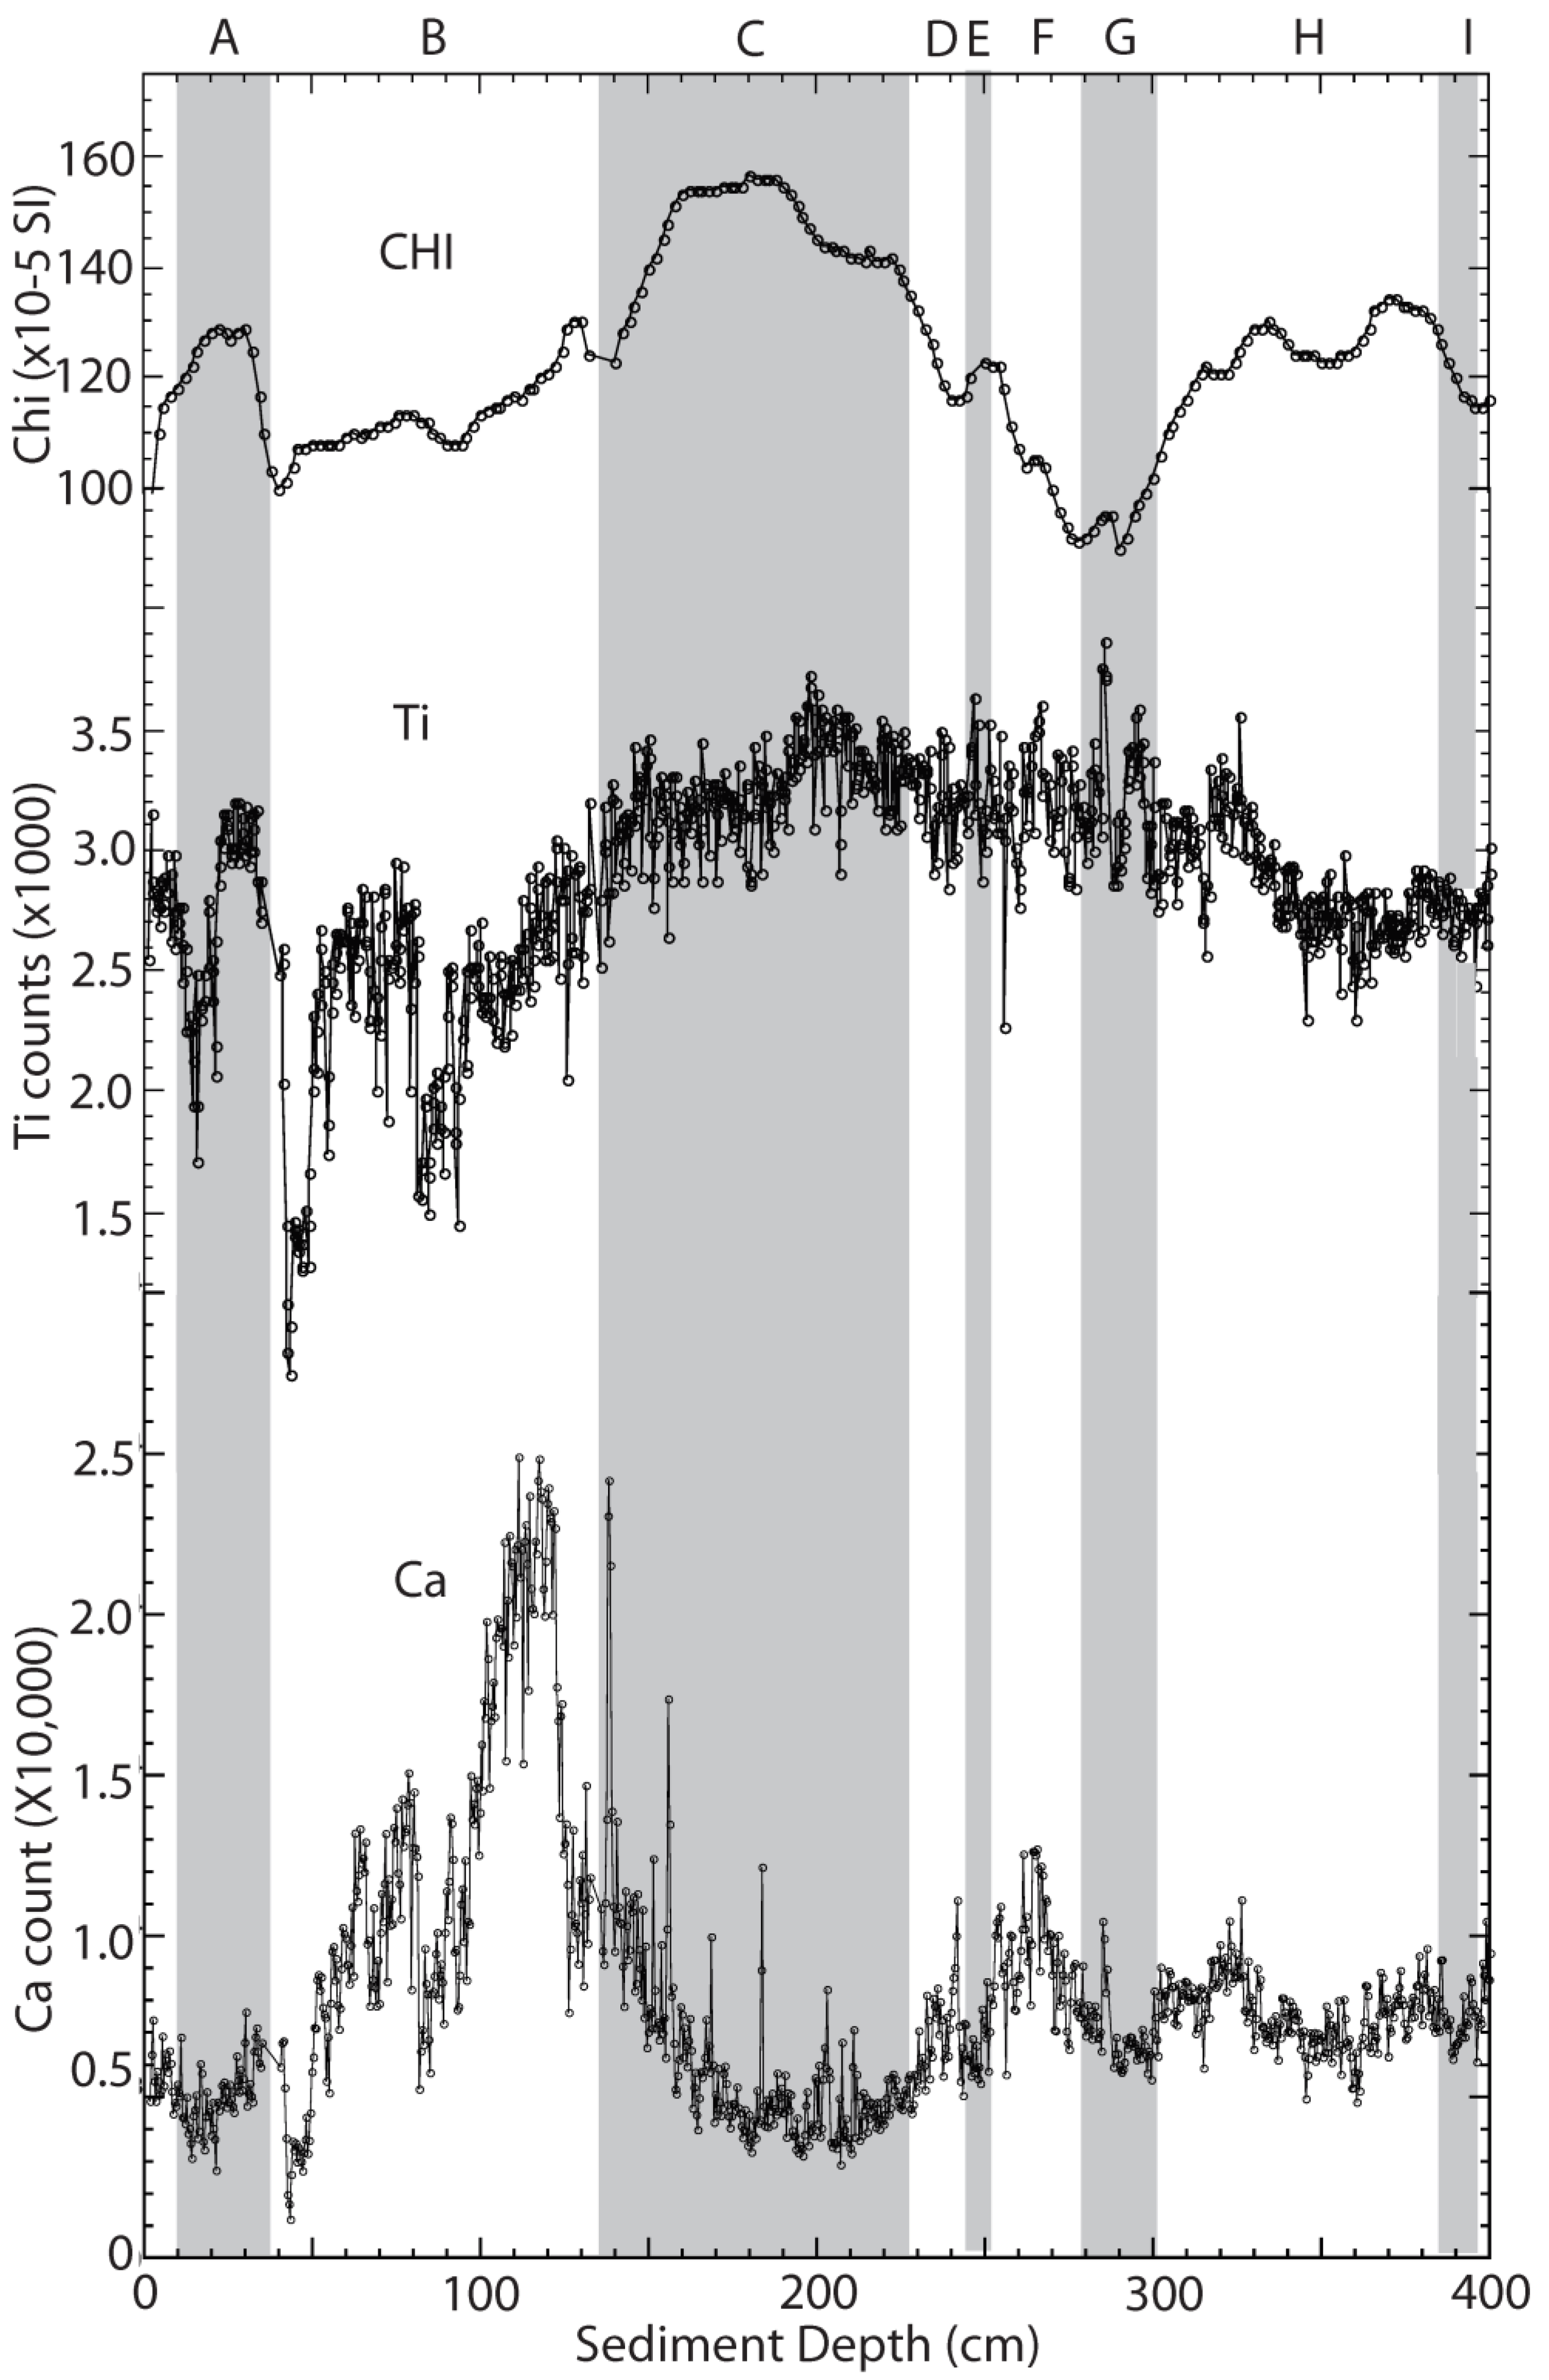
Proxy data for core 46CDH (Figure 1, Table 1), situated directly between gravity cores 9GGC and 25GGC. Top—magnetic susceptibility record; the variability can be directly correlated to data from 9GGC (Figure 2) and 25GGC (Figure 3). Below are Ti and Ca counts from unpublished XRF data on 46CDH (Delia Oppo, personal communication). The rock magnetic intensity zonation is consistent with the XRF data. High chi goes with high Ti (a clastic indicator; low chi goes with high Ca (a biologic indicator).
Figure 10.
Proxy data for core 46CDH (Figure 1, Table 1), situated directly between gravity cores 9GGC and 25GGC. Top—magnetic susceptibility record; the variability can be directly correlated to data from 9GGC (Figure 2) and 25GGC (Figure 3). Below are Ti and Ca counts from unpublished XRF data on 46CDH (Delia Oppo, personal communication). The rock magnetic intensity zonation is consistent with the XRF data. High chi goes with high Ti (a clastic indicator; low chi goes with high Ca (a biologic indicator).

Figure 11.
Magnetic hysteresis measurements of selected sediment horizons in core 25GGC. (A) Plot of remanent magnetization (Mr)/saturation magnetization (Ms) versus coercivity of remanence (Hcr)/coercivity (Hc). All samples fall within the pseudo-single domain (PSD) range. (B) Saturation isothermal remanence (SIRM) and field (H)/SIRM plotted versus time in 25GGC. See text for further discussion.


Table 1.
Site locations and descriptions of Demerara Rise cores discussed in this paper.
| Core | Latitude | Longitude | Water Depth (m) | Length (cm) | C14 Dates |
|---|---|---|---|---|---|
| 10CMC | 7.93° N | 306.11° E | 1100 | 31 | 0 |
| 9GGC | 7.93° N | 306.11° E | 1100 | 405 | 6 |
| 26DMC | 7.70° N | 306.21° E | 671 | 32 | 0 |
| 25GGC | 7.70° N | 306.21° E | 671 | 352 | 8 |
| 46CDH | 7.84° N | 306.34° E | 947 | 3150 | 13 |
Table 2.
Timing of millennial-scale intensity peaks and durations between successive intensity peaks.
Table 2.
Timing of millennial-scale intensity peaks and durations between successive intensity peaks.
| 9GGC | Duration | 25GGC | Duration | Average | Duration |
|---|---|---|---|---|---|
| YBP | YRS | YBP | YRS | YBP | YRS |
| 1900 | 1500 | 1700 | |||
| 3200 | 1300 | 2700 | 1200 | 2950 | 1250 |
| 4600 | 1400 | 4200 | 1500 | 4400 | 1450 |
| 6100 | 1500 | 6300 | 2100 | 6200 | 1800 |
| 8000 | 1900 | 8100 | 1800 | 8050 | 1850 |
| 10,200 | 2200 | 10,000 | 1900 | 10,100 | 2050 |
| 11,800 | 1600 | 11,800 | 1800 | 11,800 | 1700 |
| 13,900 | 2100 | 13,700 | 1900 | 13,800 | 2000 |
| 15,400 | 1500 | 15,800 | 2100 | 15,600 | 1800 |
| 16,500 | 1100 | 16,900 | 1100 | 16,700 | 1100 |
| 18,400 | 1900 | 18,500 | 1600 | 18,450 | 1750 |
| 21,200 | 2800 | 21,200 | 2750 | ||
| 23,800 | 2600 | 23,800 | 2600 | ||
| 25,200 | 1400 | 25,200 | 1400 | ||
| 26,400 | 1200 | 26,400 | 1200 | ||
| 28,800 | 2400 | 28,800 | 2400 | ||
| 30,400 | 1600 | 30,400 | 1600 | ||
| Ave Dur. | 1781 | 1700 | 1794 | ||
| SD | 513 | 346 | 482 |
Publisher’s Note: MDPI stays neutral with regard to jurisdictional claims in published maps and institutional affiliations. |
© 2021 by the authors. Licensee MDPI, Basel, Switzerland. This article is an open access article distributed under the terms and conditions of the Creative Commons Attribution (CC BY) license (http://creativecommons.org/licenses/by/4.0/).
Share and Cite
MDPI and ACS Style
Lund, S.; Platzman, E. Millennial-Scale Environmental Variability in Late Quaternary Deep-Sea Sediments from the Demerara Rise, NE Coast of South America. Oceans 2021, 2, 246-265. https://0-doi-org.brum.beds.ac.uk/10.3390/oceans2010015
AMA Style
Lund S, Platzman E. Millennial-Scale Environmental Variability in Late Quaternary Deep-Sea Sediments from the Demerara Rise, NE Coast of South America. Oceans. 2021; 2(1):246-265. https://0-doi-org.brum.beds.ac.uk/10.3390/oceans2010015
Chicago/Turabian StyleLund, Steve, and Ellen Platzman. 2021. "Millennial-Scale Environmental Variability in Late Quaternary Deep-Sea Sediments from the Demerara Rise, NE Coast of South America" Oceans 2, no. 1: 246-265. https://0-doi-org.brum.beds.ac.uk/10.3390/oceans2010015