
A Compact Muon Tracker for Dynamic Tomography of Density Based on a Thin Time Projection Chamber with Micromegas Readout


Low Background Noise Underground Research Laboratory, CNRS, Avignon University, 84400 Rustrel, France
Particles 2021, 4(3), 333-342; https://0-doi-org.brum.beds.ac.uk/10.3390/particles4030028
Submission received: 26 May 2021
/
Revised: 21 June 2021
/
Accepted: 24 June 2021
/
Published: 1 July 2021
(This article belongs to the Special Issue Selected Papers from "New Horizons in Time Projection Chambers")
Abstract
:Tomography based on cosmic muon absorption is a rising technique because of its versatility and its consolidation as a geophysics tool over the past decade. It allows us to address major societal issues such as long-term stability of natural and man-made large infrastructures or sustainable underwater management. Traditionally, muon trackers consist of hodoscopes or multilayer detectors. For applications with challenging available volumes or the wide field of view required, a thin time projection chamber (TPC) associated with a Micromegas readout plane can provide a good tradeoff between compactness and performance. This paper details the design of such a TPC aiming at maximizing primary signal and minimizing track reconstruction artifacts. The results of the measurements performed during a case study addressing the aforementioned applications are discussed. The current works lines and perspectives of the project are also presented.
1. Introduction
Climate change, agricultural yield limitations and rising demographic pressure are amongst the most important challenges that society faces today on the path toward sustainability [1]. These factors increase the stress on water resources and cause an intensification of underground water exploitation. Karst reservoirs play a major role as they contain one fourth of the world’s water resources in over 50 countries and as much as 20–25% of the world’s population relies to some extent on water supplies coming from these carbonate formations [2]. Furthermore, geohazards triggered by the inadequate management of groundwater include subsidence, sinkholes, landslides, flooding, aquifer contamination or even collapse of infrastructures [3,4,5].
Men has largely built water storage infrastructures, particularly dams, to regulate river flow worldwide and to recharge underground aquifers. Their design has evolved to fit specific context factors such as: geology, storage capacity, intended function, availability of materials and funds. These infrastructures have an average life expectancy of 50 years, and its wear should be accounted for. Dam aging signs include reservoir sedimentation, loss of functionality, increasing costs of repair and maintenance and, eventually, lead to dam failure. 85% of worldwide large dams reached the end of their life expectancy in 2020. Dam aging is becoming a development issue faced by many countries, and yet it has not been addressed globally or considered in future water storage infrastructure planning [6].
In this context, besides traditional geophysical imaging techniques, transdisciplinary research contributes to address these societal challenges and improve hazard identification and risk assessment. The objective of the Temporal Tomography of Density by Muon Measurement (T2DM2) project, carried out by the Low Background Noise Underground Research Laboratory of Rustrel (LSBB) since 2008, is to characterize the dynamics of water transfer processes in the critical zone [7], and in particular that of the Fontaine-de-Vaucluse (world’s fifth largest karst aquifer). Muon tomography (or muography) refers to a set of imaging methods to visualize the internal structure and physical properties of man-made objects and geological edifices based on the measurement of absorption or scattering of natural-occurring cosmic ray muons. This non-destructive, passive technique provides original information that can be used for diverse imaging purposes [8]. Two main methods are used depending on the prevalent interaction of the muon with the matter: scattering and transmission [9]. Scattering consists of muon trackers located upstream/downstream the target volume to measure the muon trajectory before and after crossing it. This allows for determination of the diffusion angle and to calculate the position of the collisions. The analysis of the spatial distribution and magnitude of these collisions provides information about the internal composition of structures. Scattering is particularly useful to discriminate between materials of high, medium and low atomic number in objects with a typical size up to a few tens of meters, yet the refinement of this technique in recent years might enlarge its scope of application [10].
On the other hand, transmission muography is suitable for both close and remote targets of a size up to hundreds of meters. This technique is based on the attenuation of the cosmic-muon flux due to the opacity of the material they traverse, similar to how X-ray radiography of human body is obtained. Transmission muography has undergone proof-of-concept tests for monitoring water variations of targets with scales ranging from a water tower to a hill [11,12]. The independent information brought by this technique helps understanding the hydrodynamic behavior of very heterogeneous water systems such as karst, that are hard to model. Spatial mapping of water pockets, their interactions and exchanges, as well as water table monitoring can be undertaken in many cases using transmission muography. The promising results have motivated joint projects with other well-established geophysical methods, such as gravimetry or electrical resistivity [13].
Muon trackers are required for both scattering and transmission muography. When the properties of the object change over time, a recorded timestamp of each event is essential to study the temporal dynamics of the system. In addition, underground measurements present supplementary deployment constraints in terms of volume, weight and gas management, among others. The T2DM2 project has developed a muon tracker [14] to work under these conditions and with a performance analogue to classic geophysics methods.
2. Materials and Methods
2.1. Working Principle
The MUon Survey Tomography based on Micromegas detectors for Unreachable Sites Technology (MUST2), consists of a thin TPC (5 cm height) with a Micromegas [15] readout plane, allowing a wide angular acceptance of the detector (detection field of view) with light weight and reduced volume. Figure 1 shows a schematic cross-section of the detector, its elements and the signal generation and detection principle.
When charged particles (e.g., muons) cross through the volume of the TPC and their energy exceeds the ionization potential of the gas contained in it, they might stochastically create clusters of electron-ion pairs along its path. These so-called primary electrons, containing the information about the muon trajectory, are projected orthogonally by means of an electric field () to a 2D position-sensitive structure—the Micromegas readout plane. When the primary electrons enter the Micromegas amplification gap, where the electric field is several orders of magnitude higher (), they trigger cascades of secondary electrons and amplify the signal strength. This movement of charges (evacuated by the resistive layer and the micromesh) induce a measurable output by the readout chain.
Theoretically, all electrons created during the primary ionization () should contribute to the signal strength (). However, certain unwanted processes, as seen in Equation (1), contribute to a loss of information:
where is the detector gain related to . represents the recombination of electron-ion pairs after primary ionization and is related to . stands for the losses due to attachment to gas constituents during scattering and increases in the presence of gas contaminants. , called mesh transparency, characterizes the percentage of primary electrons succeeding to enter the amplification gap since a fraction of electrons may be neutralized in this boundary zone. Transparency depends mostly on the mesh geometry and the ratio.
The choice of the gas is a key factor for the signal formation and its measurement. The ideal candidate has to maximize , to allow an electron drift speed compatible with the data acquisition time window, to minimize the fluorescence (quenching properties) and to achieve a high ion mobility to rapidly flush out the ions and minimize the deformation of the electric field and discharge probability. Alas, these are conflicting features for a simple gas; therefore, mixtures are frequently used. The gas blend chosen for the MUST2 muon tracker is Ar:CF4:iC4H10 (88:10:2). Additionally, a gas conditioning auxiliary device has been developed to recycle the gas, reducing its consumption and enabling underground operation [16].
2.2. Signal Measurement
Despite the near-light speed of muons traversing the TPC, the much slower mean drift speed of primary electrons inside the gas blend (0.107 mm/ns for 600 V/cm) allows the front-end electronics of the detector to identify separately the arrivals of the primary electrons. These relative delays of a few tens of ns are proportional to the distance between the readout plane and the origin of the ionization caused by the muon. The correct interpretation of these time differences and the two-dimensional position retrieved by the micromegas detector allows the full three-dimensional reconstruction of the muon trajectory in time. The performance of the data acquisition depends strongly on the measurement of the whole signal generated by the muons. The detector has been designed to operate with the APV25 hybrid cards from the Scalable Readout System (SRS) developed by CERN’s RD51 [17]. This device is capable of recording single events during 675 ns. Experimental measurements show that the signal duration is 428 ± 78.22 ns, which is both well suited for TPC mode with the selected electronics and in good agreement with the value predicted by the simulation. Moreover, a reliable trigger signal associated with the passage of a muon through the detector is required. The versatility of the MUST2 detector allows for three different kinds of triggers: (i) from the signal collected at the micromesh, (ii) an external trigger created by auxiliary and/or complementary detectors and (iii) internal trigger of the electronics [16]. Feature (ii) is required for scattering or cluster measurements, whilst feature (iii) is possible thanks to the upgrade to VMM3 hybrids [18] in the present generation of MUST2 detectors. Their nanosecond time resolution and adjustable gain result into an improvement of the accuracy of the muon trajectory reconstruction without increasing the granularity of the detector, which would result in an increase of instrumented channels or the use of multiplexing [19].
2.3. Time Projection Chamber Design
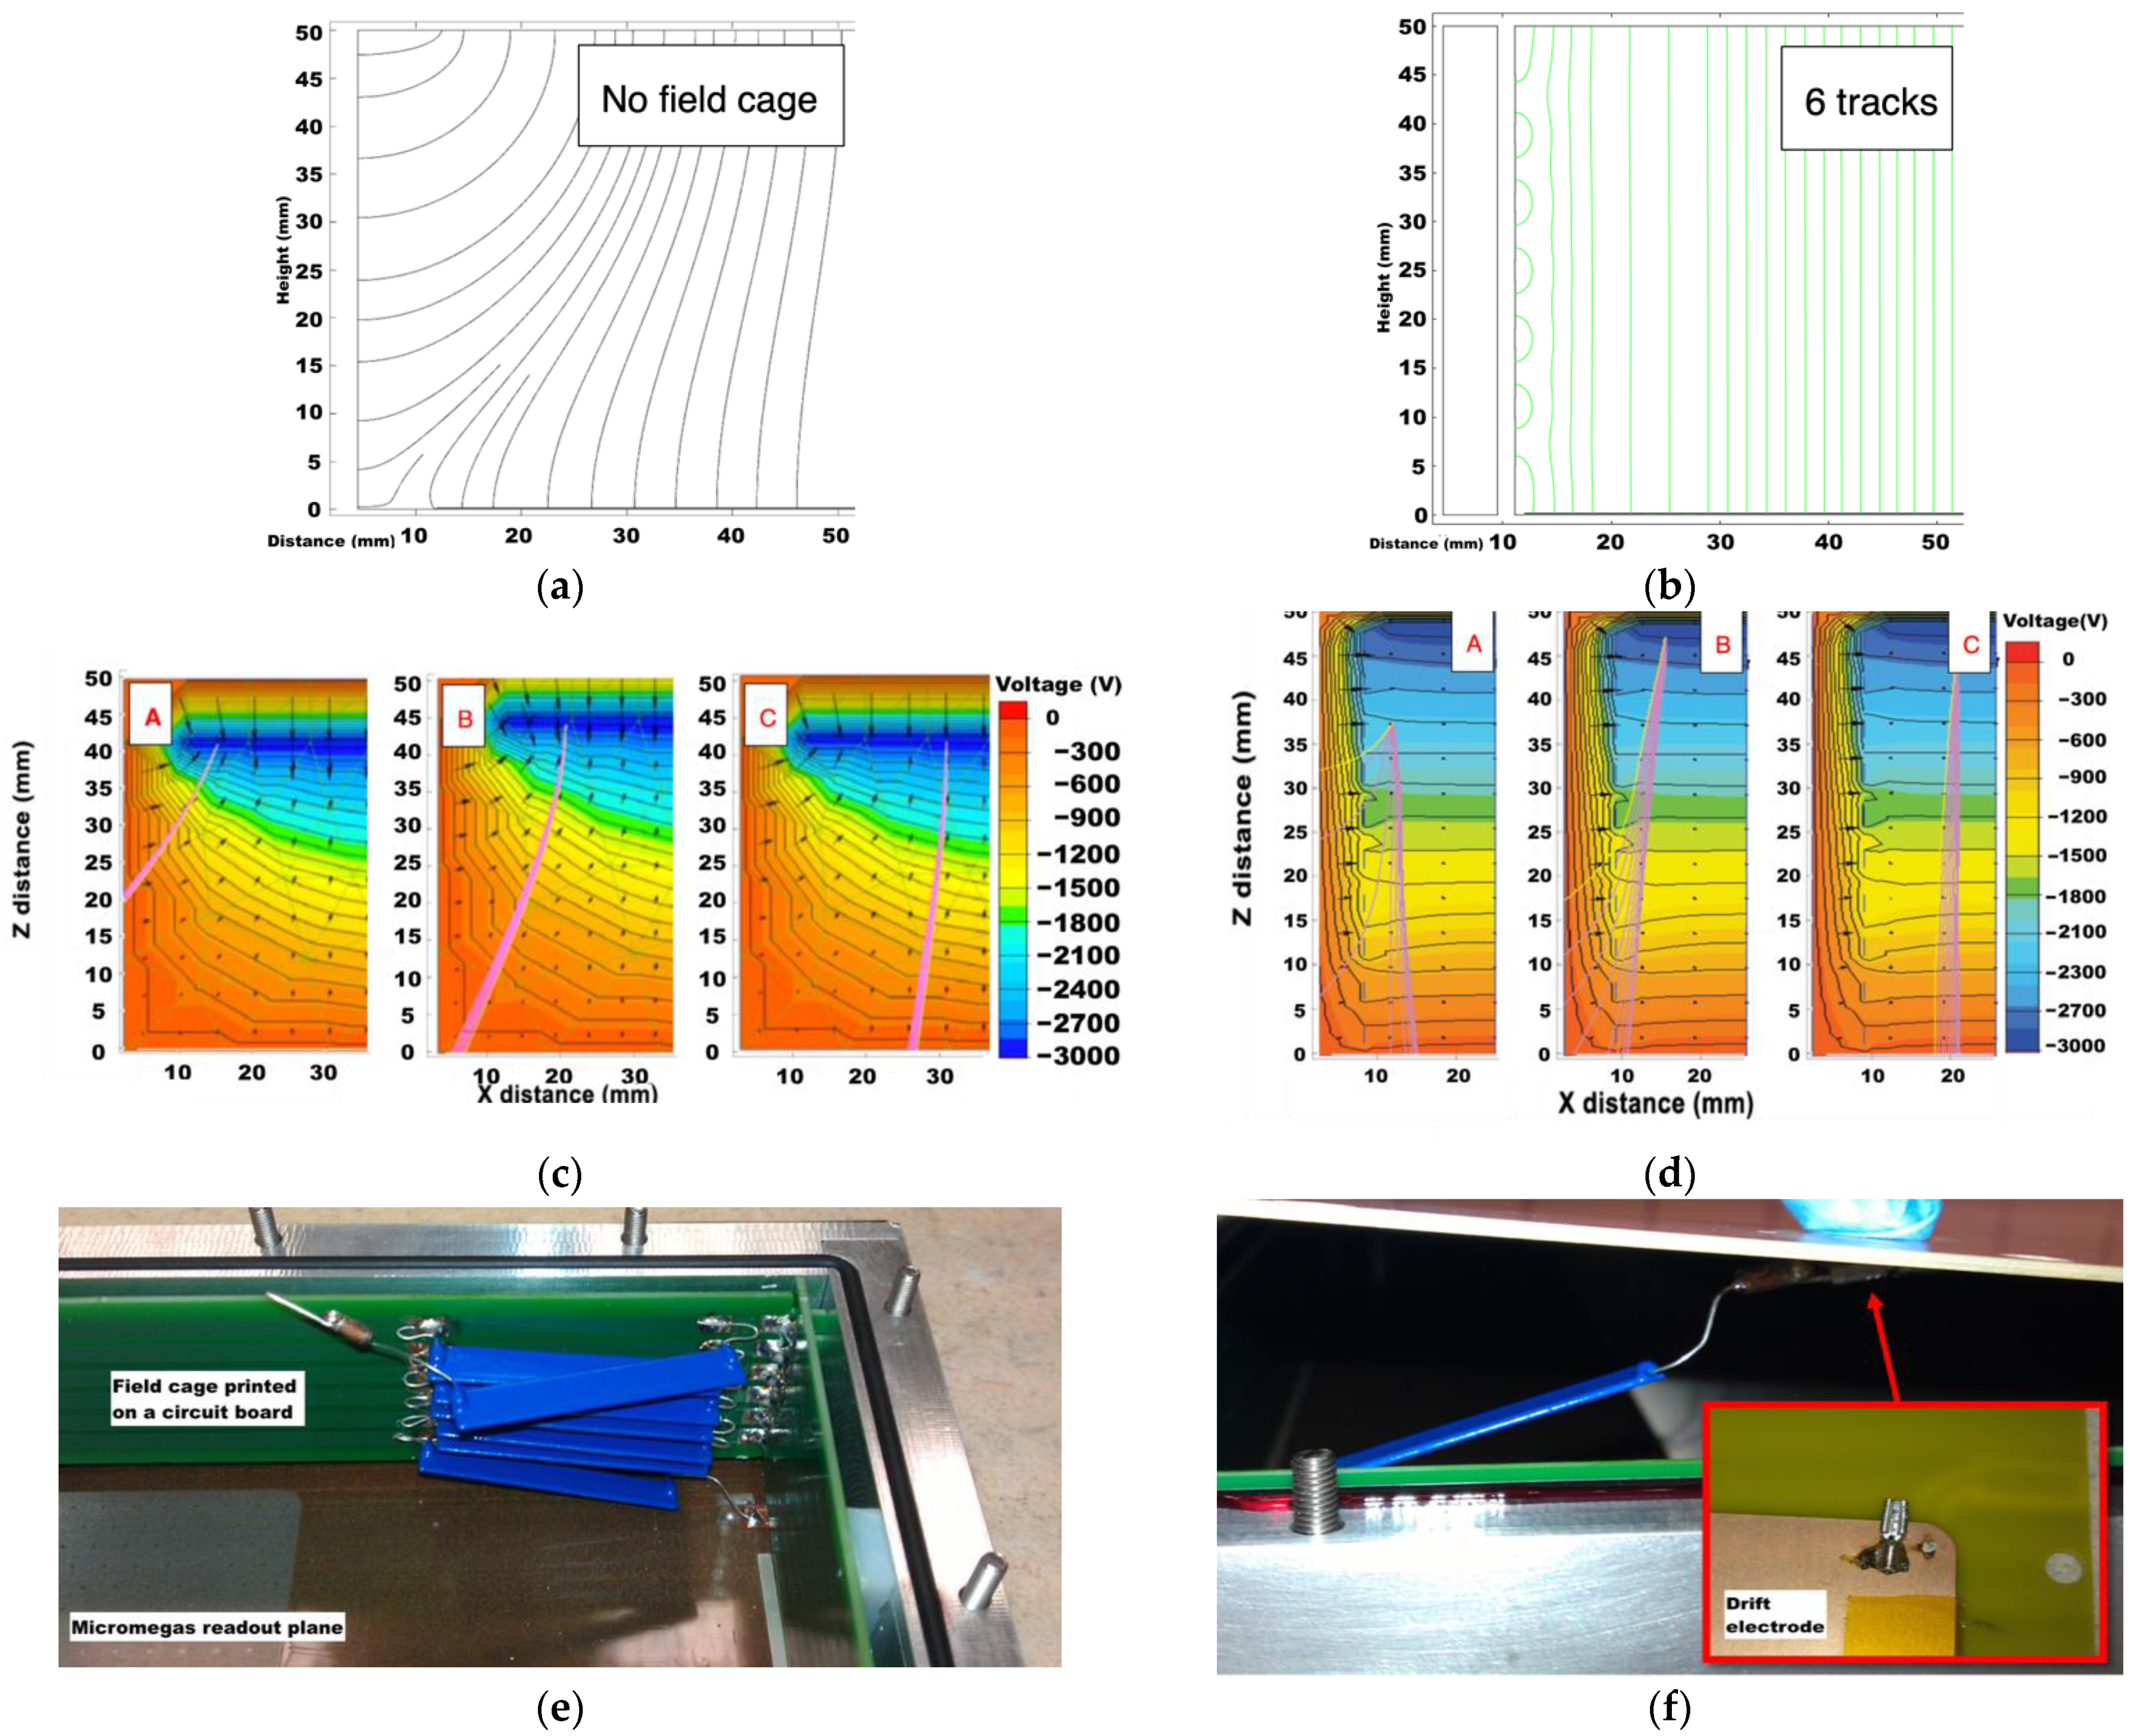
The homogeneity of is essential for obtaining a straight projection of the muon’s path and to minimize artifacts, especially near the perimeter of the TPC. The shape of the electric field inside the TPC has been calculated for different field cage candidates with two different software packages: QuickField for electrostatic and COMSOL Multiphysics® for electron transport, both yielding comparable results (see Figure 2a–d).
The initial conditions, seen in Figure 2a, consider a 5 cm height TPC without electric field homogenizers, a drift cathode polarized at −3.000 V, a grounded Micromesh and a resistive layer polarized at +440 V. The field lines allow visualization of the most probable path of the electrons generated inside the drift volume. Figure 2b shows the retained field cage, composed of 6 polarized copper bands printed over a circuit board and connected from the drift electrode to the ground trough resistors (see Figure 2e,f). The uniformity of the electric field inside the drift region, particularly in the first 5 cm from the frame, was greatly improved. Figure 2c,d show the different drift behavior of simulated electrons created in three different positions A, B and C near the boundary zones of the TPC. Figure 2d, unlike Figure 2c, includes the field cage that improves the efficiency and accuracy of muon track reconstruction by reducing the horizontal drift of the projection and minimizing the loss of information due to the deflection of the primary electrons outside of the Micromegas detection plane.
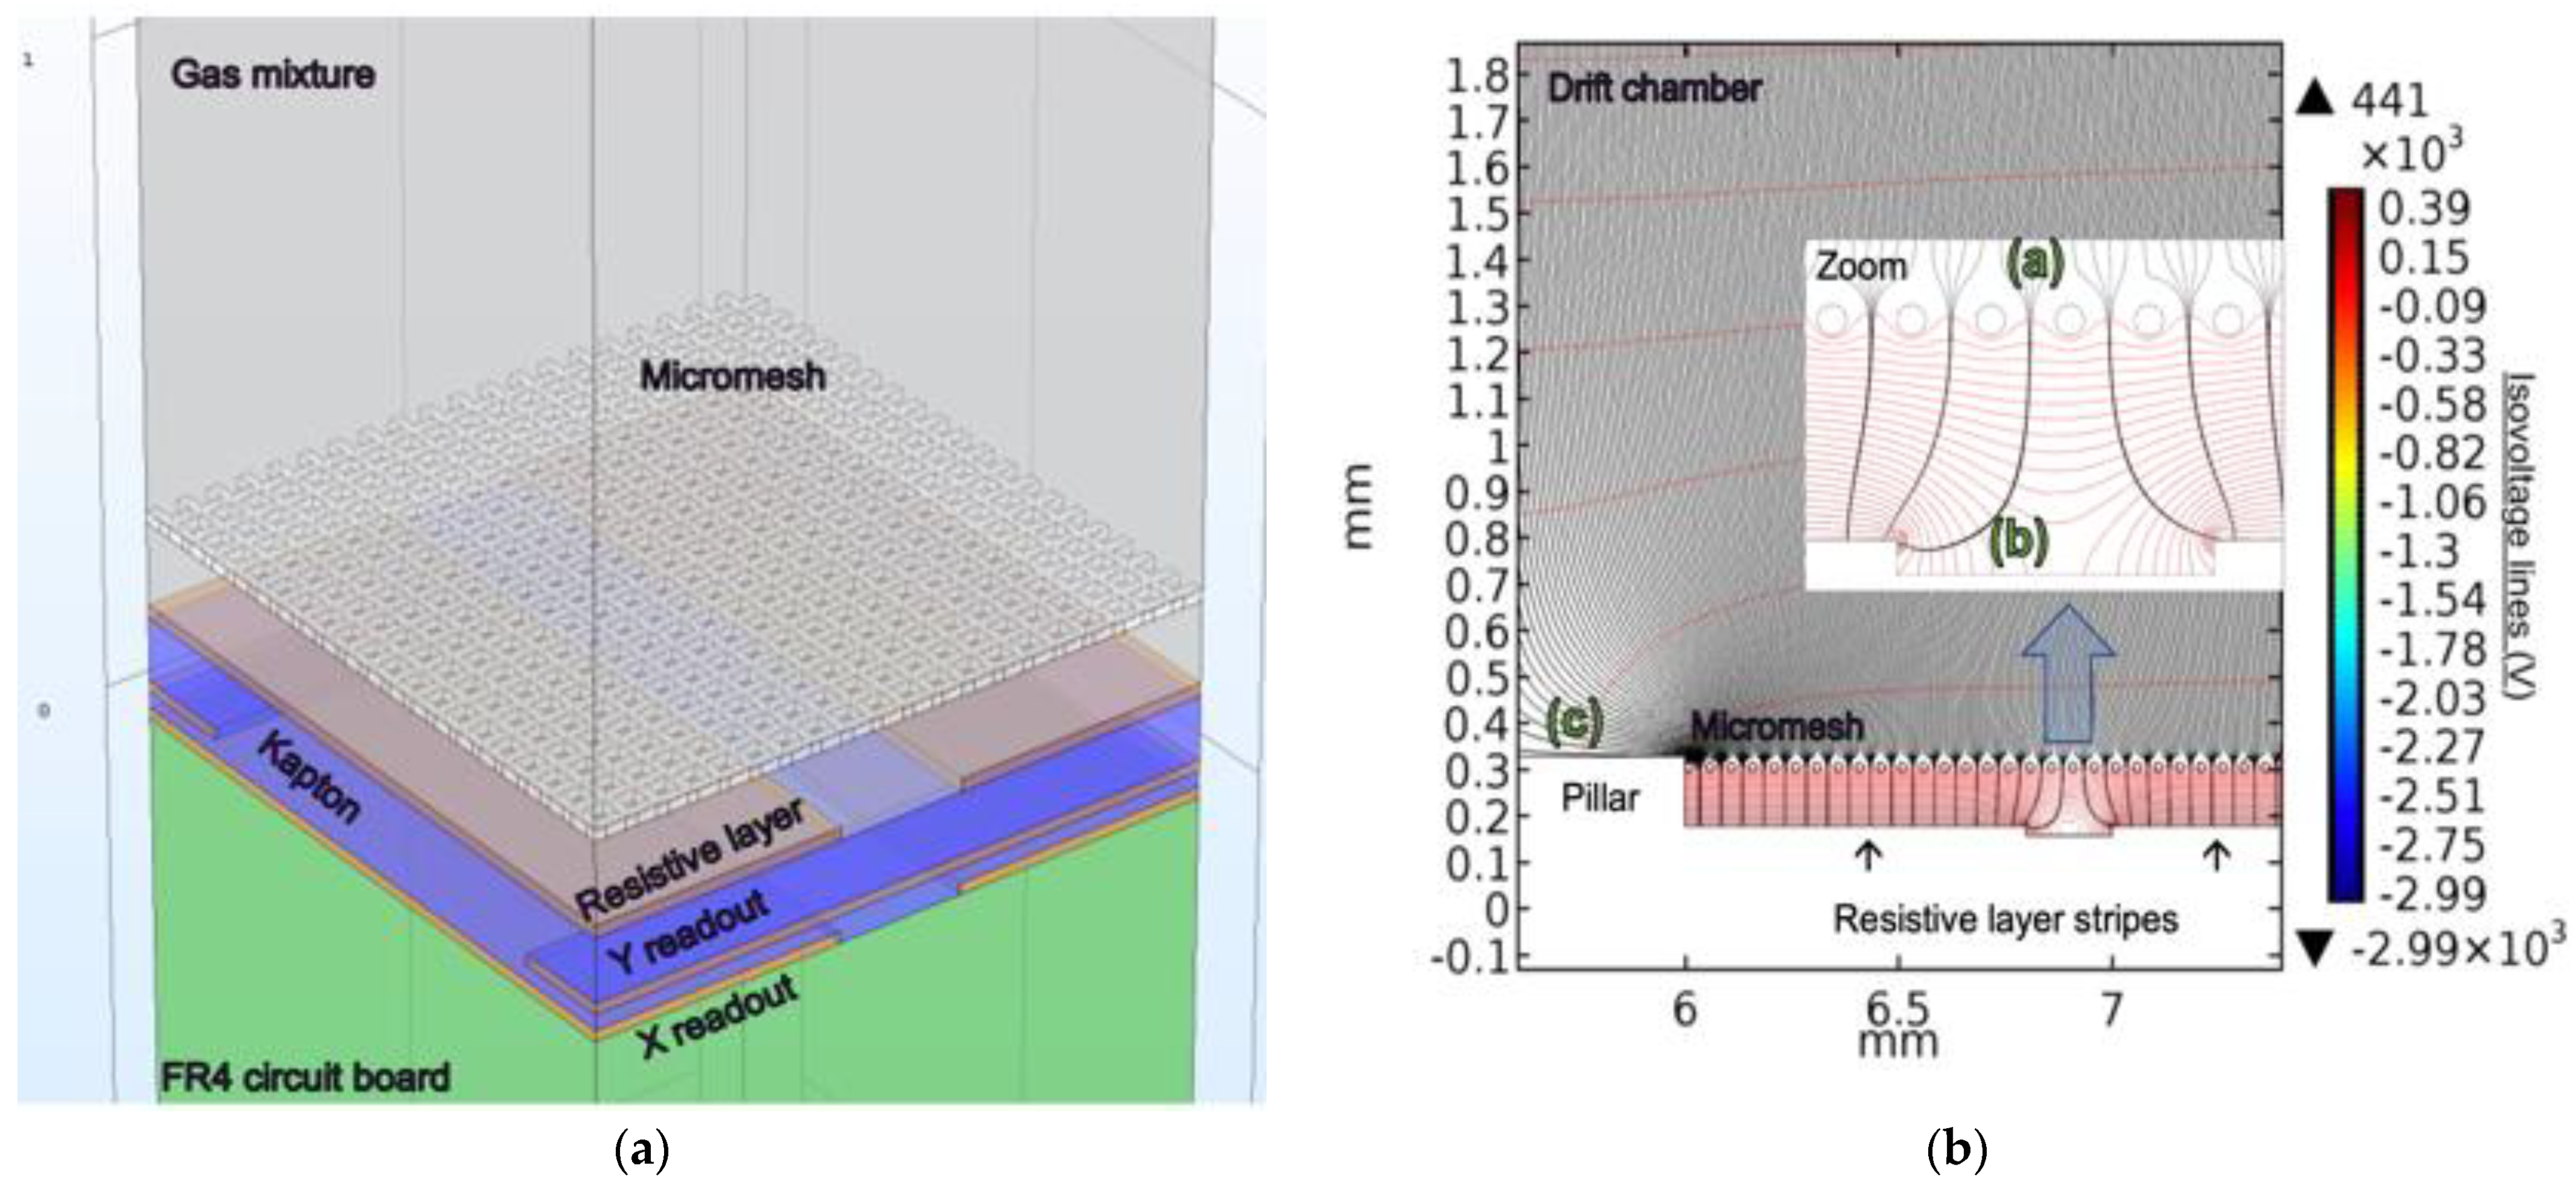
The mesh transparency to primary electrons and their drift near passive elements, such as pillars, has been assessed with COMSOL Multiphysics [20]. Figure 3a represents the simulated geometry of the detector with its characteristic elements. Figure 3b shows the is voltage and field lines in operational conditions near the Micromegas plane with the presence of a pillar from the bulk Micromegas (c). The figure includes a zoom of the amplification zone between the micromesh (a) and the resistive layer (b). Transparency is calculated as the ratio between the number of primary electrons leaving the drift volume compared to the number of electrons entering the amplification zone as a function of the fraction. The simulated transparency for the optimal operational range of the detector is ~0.935.
3. Experimental Results
3.1. Surveillance of Man-Made Large Infrastructures
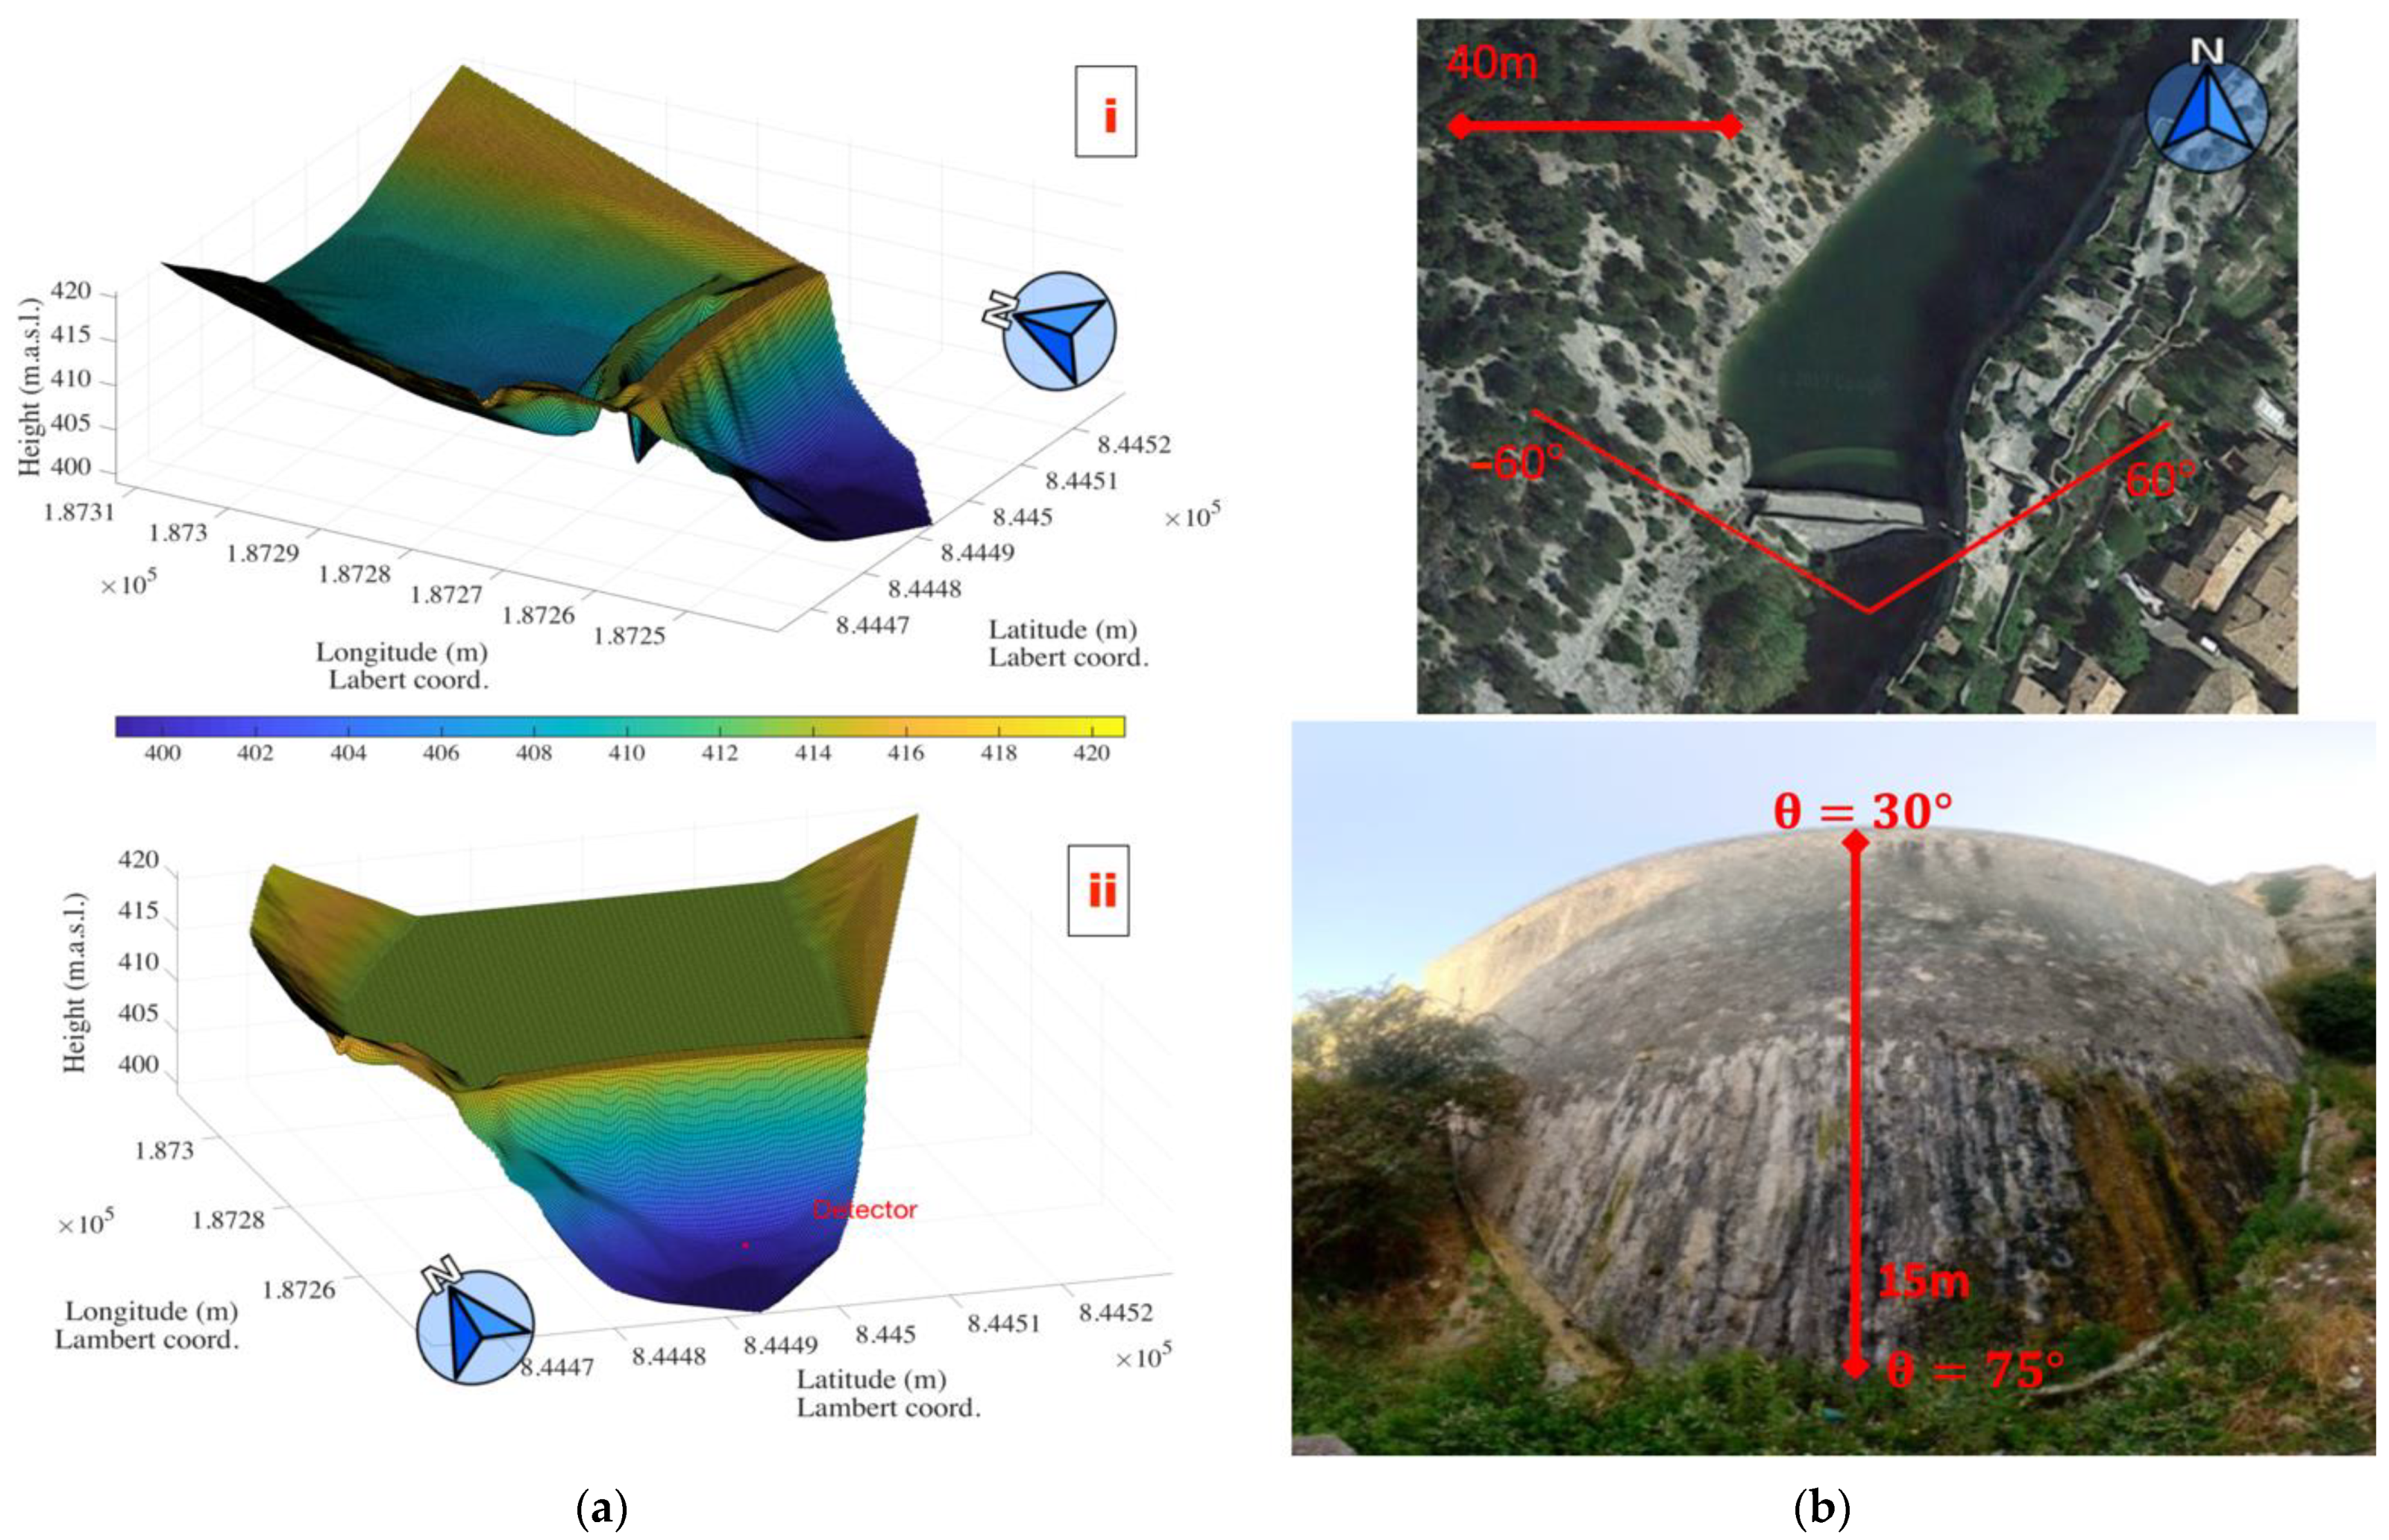
This study case, under real field conditions, aims at imaging a water reservoir in the village of Saint-Saturnin-les-Apt (Southeast of France) [21]. The dam structure is located at the lower point of a narrow valley overlooking the village (see Figure 4b). The terrain has been characterized with two different superimposed models corresponding to: (Figure 4a(i)) the limestone of the valley and concrete/rock structure of the dam (p = 2.400 kg/m3 for all materials), and (Figure 4a(ii)) the water contained in the reservoir, whose height is set to the water level at the moment of the beginning of the acquisition (414 m above sea level).
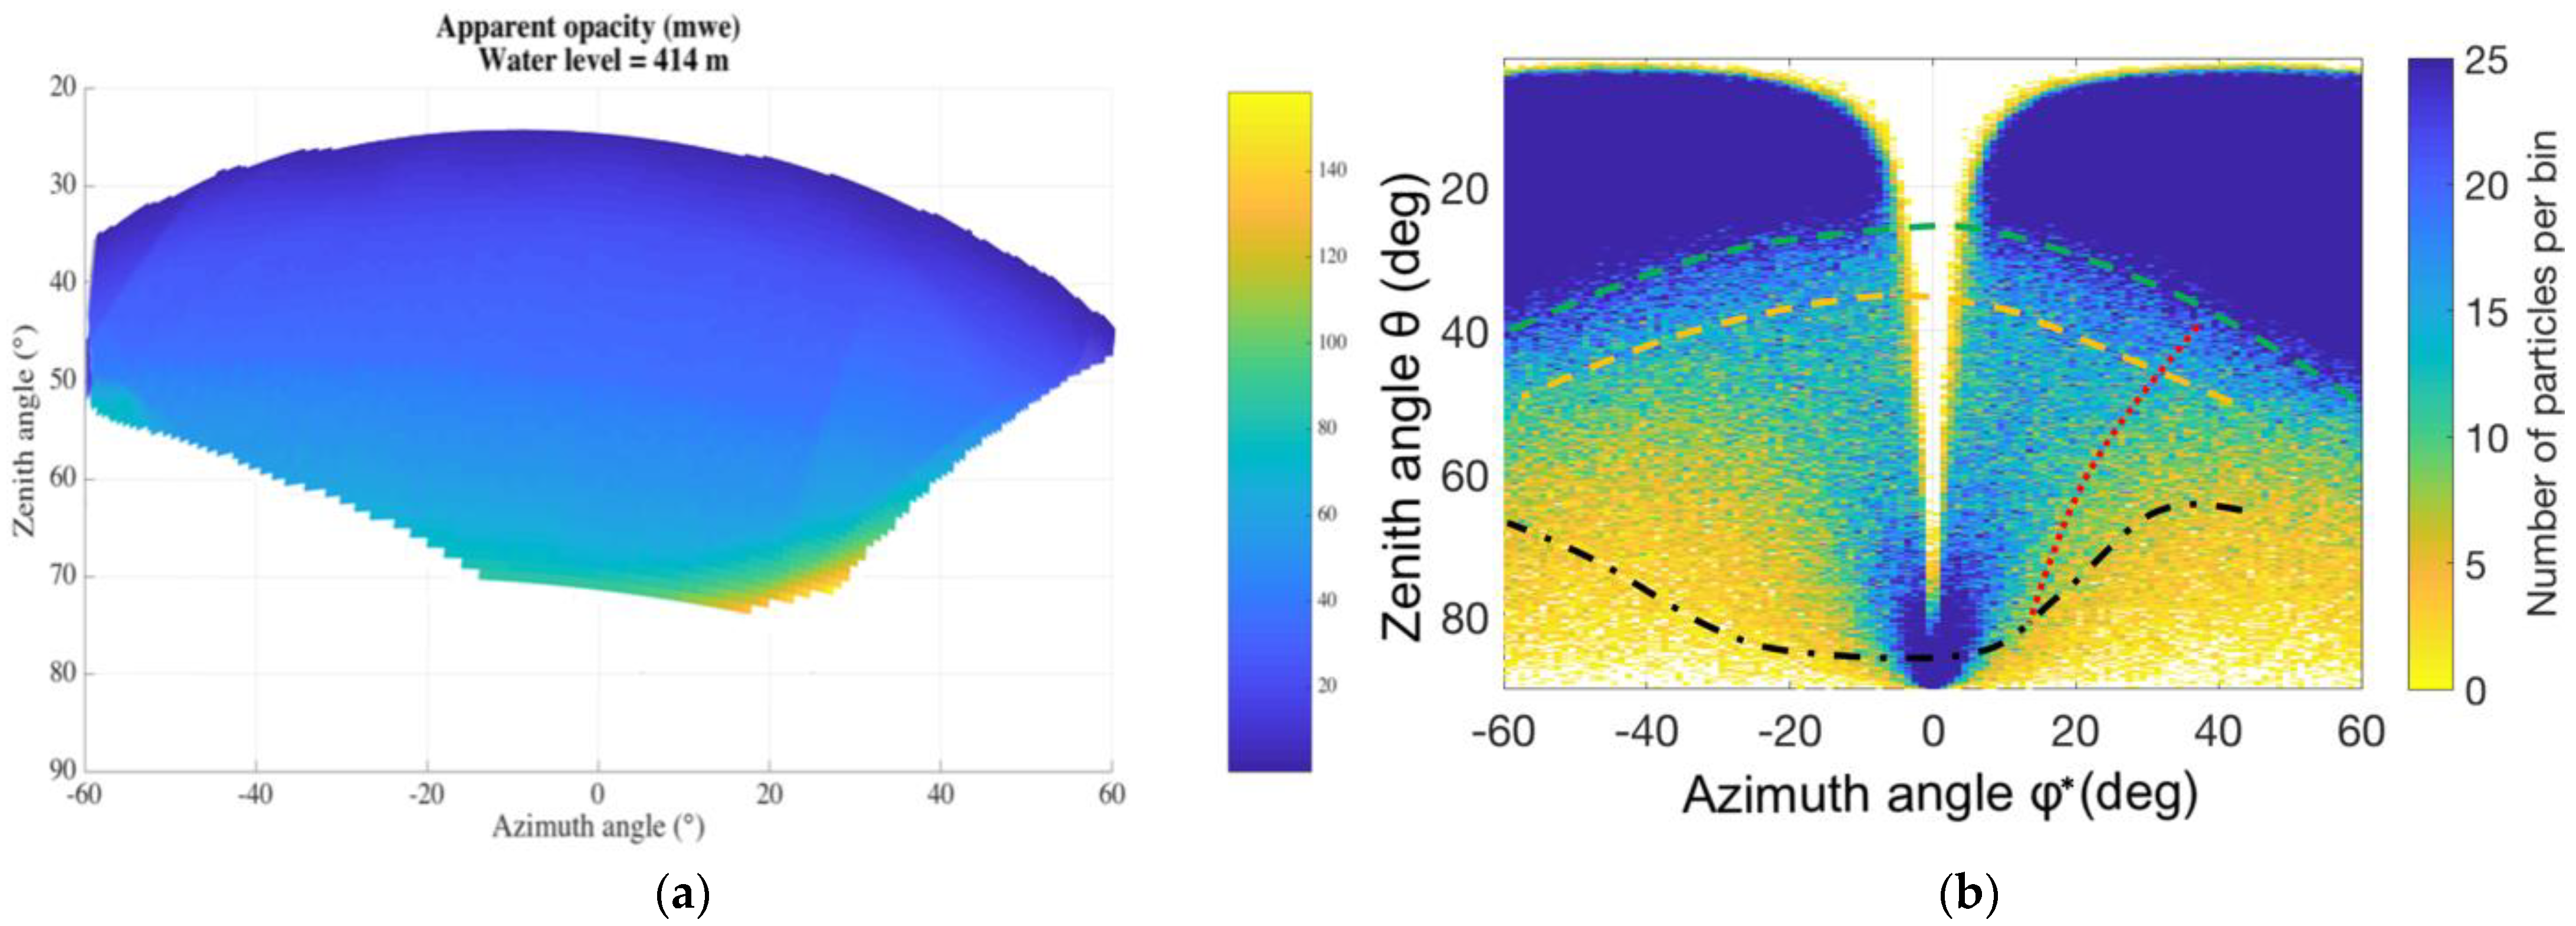
These models allow to calculate the chart of opacity from the point of view of the detector (Figure 5a). Opacity is defined as the product of the distance travelled thought each material times its density, measured in meter water equivalent (mwe). Values of opacity over 150 mwe, and near the horizontal (), are not represented as muons coming from those regions are not statistically significative for the analysis of the targeted volume.
Figure 5b shows the experimental measurement of muon flux integrated over ~90 h. Relevant structural elements have been superimposed to the image for reference:
- Black dot-dashed line: bed of limestone beneath the reservoir
- Red dotted line: near-vertical rock cliff in the castle’s hill.
- Green long dashed line: summit of the main dam.
- Orange dashed line: summit of the ancient dam.
The void near , and the artefact near (,) are due to the trajectory reconstruction algorithm constraints with muons arriving parallel to the Micromegas readout tracks. This limitation can be overcome with an additional acquisition from a different point of view. A good correlation between the location of the structural elements at the image of measured muon flux and the apparent opacity simulation of the target volume due to the structures behind the dam is observed.
3.2. Sustainable Underwater Management
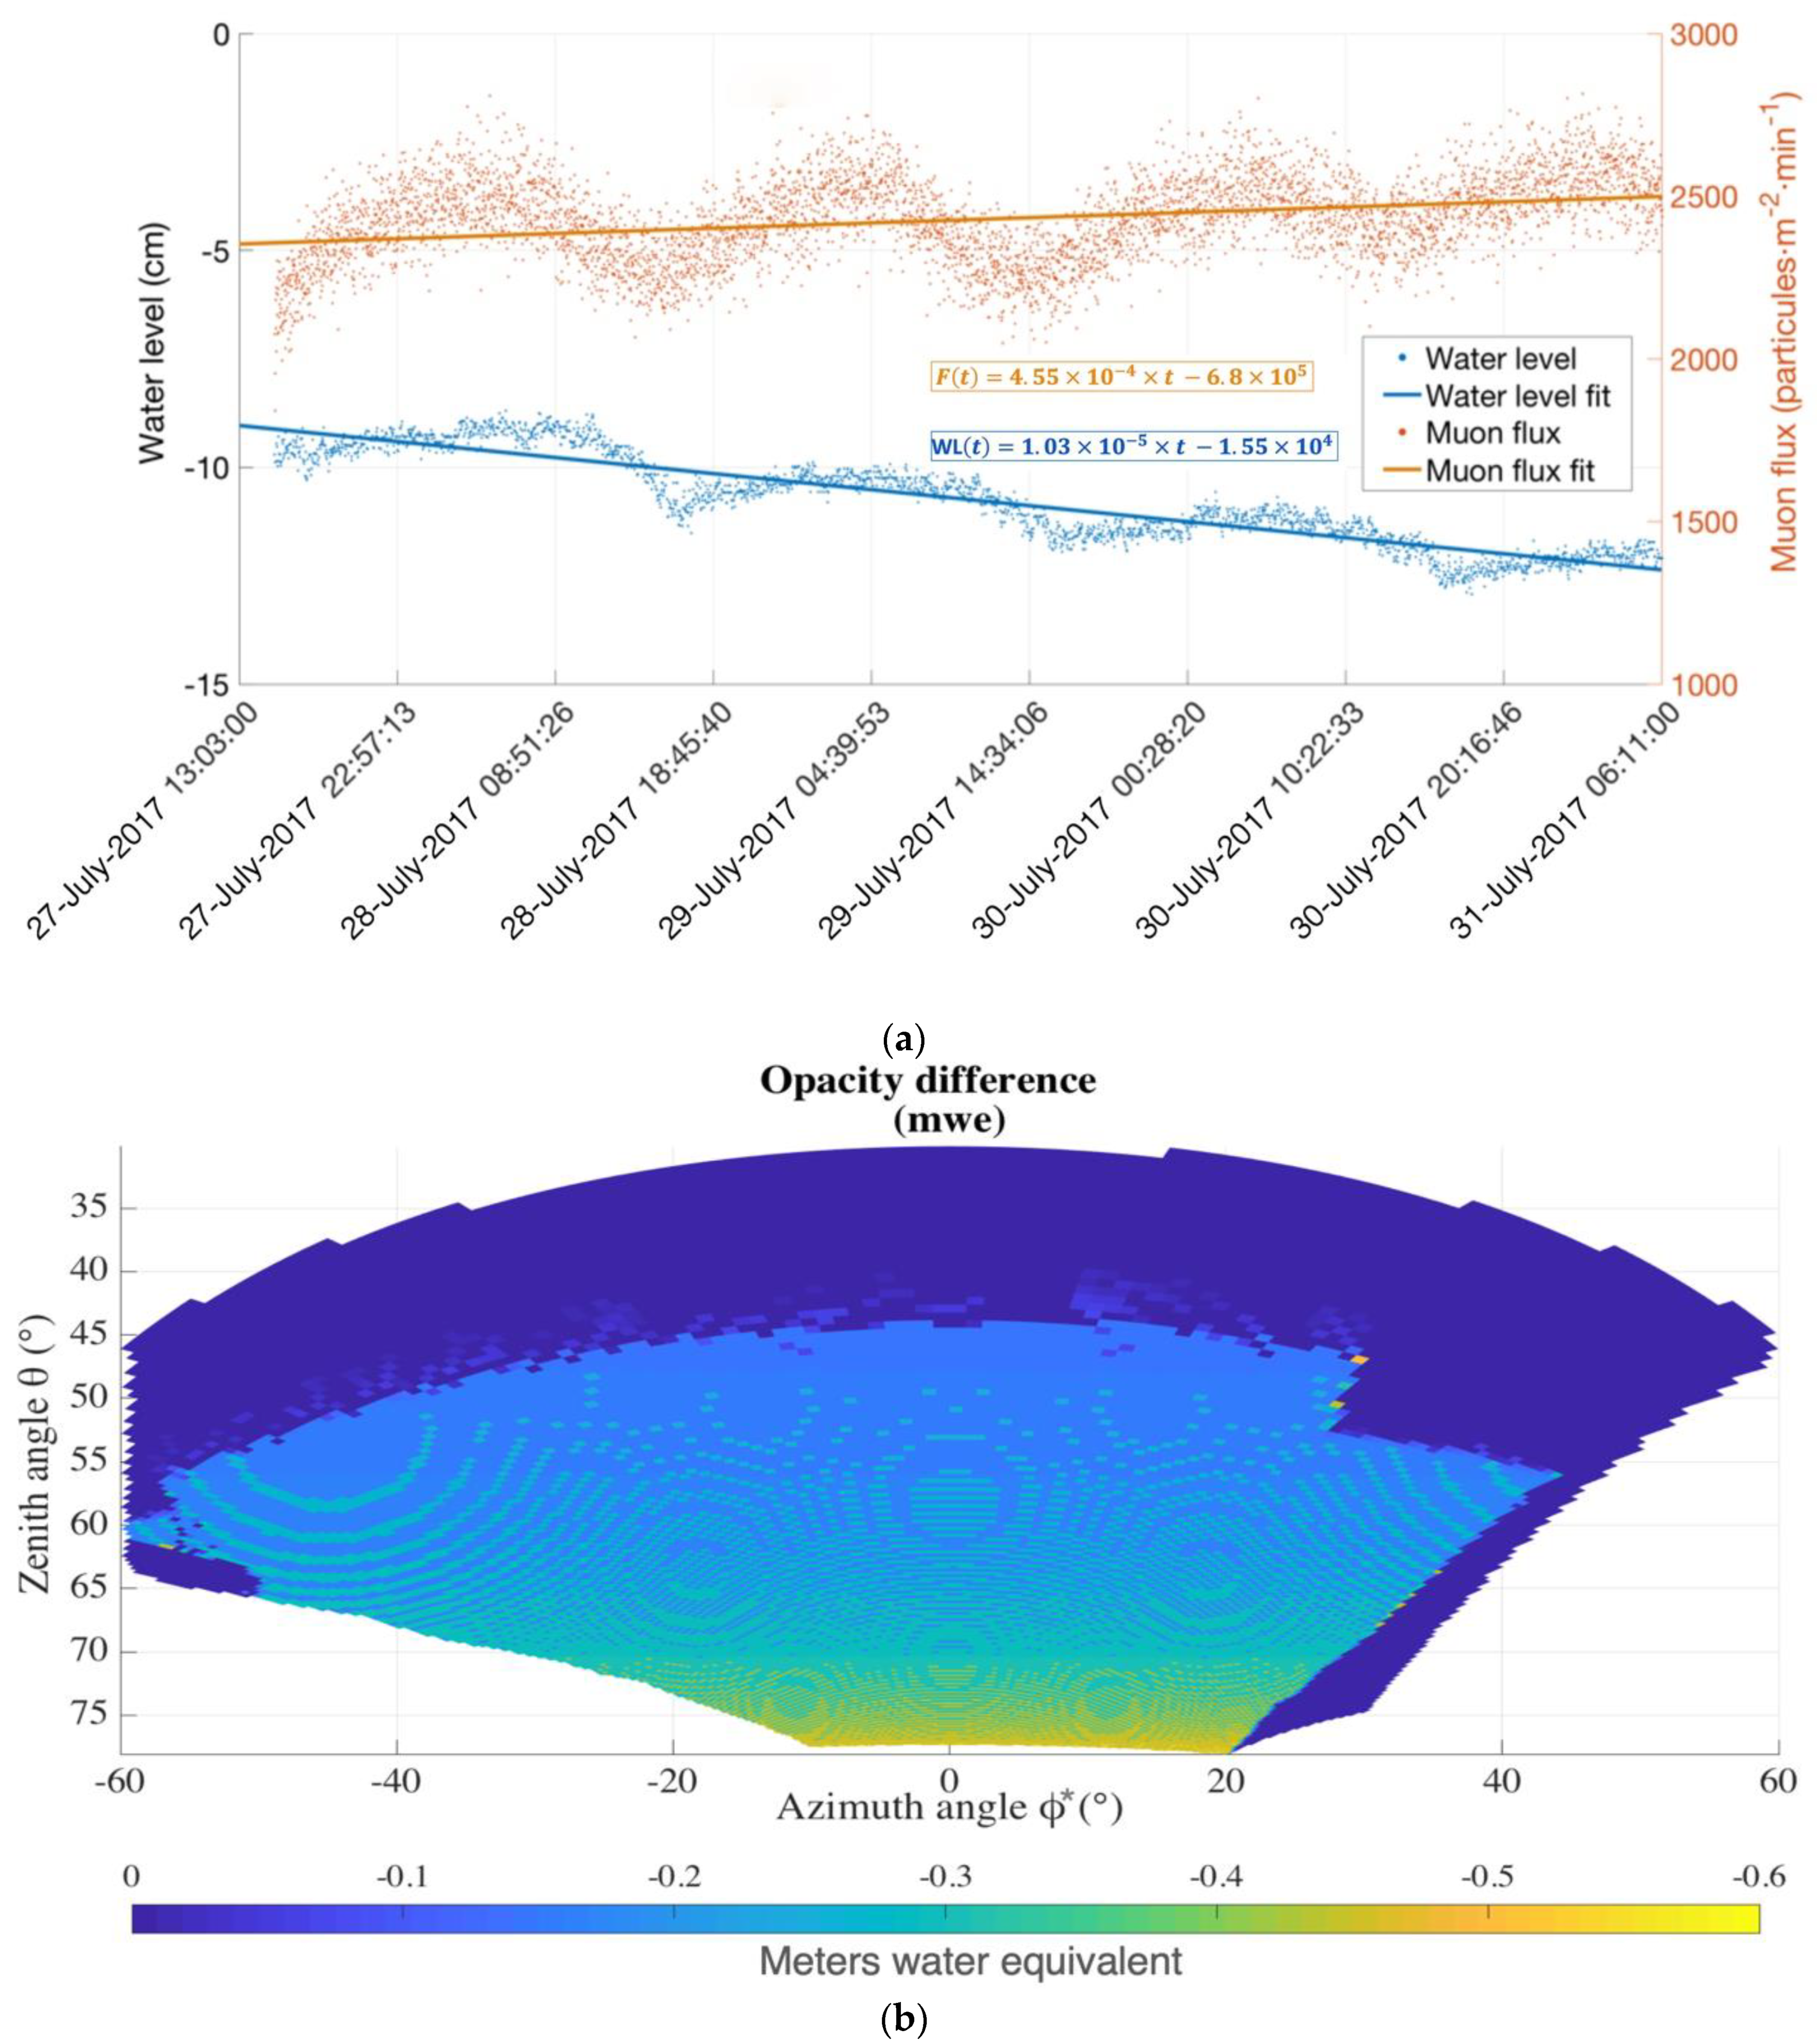
A new analysis of the temporal information from the former study case can be used to assess the water monitoring capabilities. Figure 6a shows the evolution of the water of the dam and the measured muon flux.
In Figure 6a, the reference value of water height stands for the level at the beginning of the deployment, 16 days before the data acquisition. On the other hand, the muon flux presented corresponds to the number of detected events per minute and per square meter of active surface. Periodical fluctuations are due to temperature dependence [20]. When preforming a linear regression, it is possible to appreciate that the emptying trend of the dam is translated into an augmentation of the muon flux [21]. Additionally, KPSS (p-value 0.01) and ADF (p-value 0.0859) tests shows that the data is non-stationary based upon the significance level of 0.05.
Figure 6b shows the result of a simulation to quantify the loss of opacity of the target due to the lower water level, −0.94% compared to the initial conditions shown in Figure 5a. The muon flux increased by 1.88 ± 0.2% at the considered region, as one could expect given the loss of opacity of the target volume. Nevertheless, to validate the actual sensitivity of this technique to the water content of the ground further data analysis must be done by considering a corrected muon flux to remove the meteorological effects [22].
4. Discussion: Application and Perspectives
The aforementioned field campaign allowed for validating both technology and methodology under diverse challenging conditions. Currently, the LSBB is deploying a network of 20 new generation standalone MUST2 muon trackers equipped with new acquisition electronics. This is a major update offering features such as zero-suppression, custom internal triggering and adjustable gain. Other noteworthy improvements are automatic, continuous gain control based on ambient temperature and a new Micromegas layout to minimize signal heterogeneities related to the detector geometry. This network of autonomous detectors allows versatile deployment configurations: (i) simultaneous acquisition of several points of view for 4D tomography, (ii) clustering mode to increase the active surface of detection (faster acquisitions), (iii) scattering tomography mode and (iv) possibility to align several detectors for multilayer configuration mode to enhance angular resolution. Once concluded, this will be the largest network of muon trackers in the world towards tomographic exploration of the critical zone up to 500 m deep.
The main output, the dynamic mapping of density of large volumes, is a valuable input for several applied scenarios:
- Density imaging of the underground and large natural or man-made buildings (e.g., presence of cavities, denser areas and density discontinuities). This could help identifying deposits, faults or pre-fracture stress zones, among others.
- Density evolution monitoring for the characterization of dynamic or non-modelizable systems (e.g., events with periodic fluctuation behaviors such as day/night, summer/winter, tides or one-shot events like construction works, floods, eruptions, etc.)
Current parallel work lines are focused on risk analysis and safety management. The project works along with local actors in Provence, such as the Bruoux mines (former ocher quarry converted into an underground industrial museum welcoming more than thirty thousand visitors per year), by monitoring the structural integrity of its underground structures. We also attended the request from the municipality of Rustrel to monitor the evolution of active landslides threatening homes and the rapid erosion of the site known as Le Colorado Provençal linked to the touristic pressure.
The evolution of this technology in the lasts years has led to a strong industrial interest due its promising contribution to several key sectors (e.g., civil engineering, underground resources, safety or energy production) and its valorization is currently under development.
5. Patents
The device presented in this article for determining the density of volumes of material to be imaged and the method to calculate the path of each ionizing particle passing through the time projection chamber, comprising the computing means for converting these calculations into information on the volume density, is currently under patent protection [14].
Funding
This work was financially supported by the Low Background Noise Laboratory (LSBB) and the European Fund for Regional Development (FEDER) trough FEDER HORIZON2020 funds. Part of this research was performed within the framework of a CIFRE grant attributed to IRIS Instruments (ANRT contract #2015/0325).
Institutional Review Board Statement
Not applicable.
Informed Consent Statement
Not applicable.
Acknowledgments
The author would like to thank the invaluable support of the CERN’s RD51 community for the development of micro-pattern gas detectors technologies, and for all the assistance provided. I would like to acknowledge the mairie of Saint-Saturnin-les-Apt for giving access to the dam site and the city archives.
Conflicts of Interest
The author declares no conflict of interest other than the ones associated with sources of funding.
References
- Misra, A.K. Climate change and challenges of water and food security. Int. J. Sustain. Built Environ. 2014, 3, 153–165. [Google Scholar] [CrossRef] [Green Version]
- Ford, D.; Williams, P. Karst Hydrogeology and Geomorphology; John Wiley & Sons Ltd.: Chichester, UK, 2007; pp. 1–5. [Google Scholar]
- Shen, S.L.; Xu, Y.S. Numerical evaluation of land subsidence induced by groundwater pumping in Shanghai. Can. Geotech. J. 2011, 48, 1378–1392. [Google Scholar] [CrossRef]
- Zhao, Y.; Li, Y.; Zhang, L.; Wang, Q. Groundwater level prediction of landslide based on classification and regression tree. Geod. Geodyn. 2016, 7, 348–355. [Google Scholar] [CrossRef] [Green Version]
- Duffaut, P. The traps behind the failure of Malpasset arch dam, France, in 1959. J. Rock Mech. Geotech. Eng. 2013, 5, 335–341. [Google Scholar] [CrossRef] [Green Version]
- Perera, D.; Smakhtin, V.; Williams, S.; North, T.; Curry, A. Ageing Water Storage Infrastructure: An Emerging Global Risk. In UNU-INWEH Report Series; United Nations University Institute for Water, Environment and Health (UNU-INWEH): Hamilton, ON, Canada, 2021; ISBN 978-92-808-6105-1. [Google Scholar]
- Hivert, F.; Lázaro Roche, I.; Decitre, J.B.; Brunner, J.; Busto, J.; Gaffet, S. Muography sensitivity to hydrogeological rock density perturbation: Roles of the absorption and scattering on the muon flux measurement reliability. Near Surf. Geophys. 2017, 15, 121–129. [Google Scholar] [CrossRef]
- Bonomi, G.; Checchia, P.; D’Errico, M.; Pagano, D.; Saracino, G. Applications of cosmic-ray muons. Prog. Part. Nucl. Phys. 2020, 112, 103768. [Google Scholar] [CrossRef]
- Procureur, S. Muon imaging: Principles, technologies and applications. Nucl. Instr. Methods Phys. Res. A 2018, 878, 169–179. [Google Scholar] [CrossRef]
- Gnanvo, K.; Grasso, L.V.; Hohlmann, M.; Locke, J.; Quintero, A.; Mitra, D. Imaging of high-Z material for nuclear contraband detection with a minimal prototype of a muon tomography station based on GEM detectors. Nucl. Instr. Methods Phys. Res. A 2011, 652, 16–20. [Google Scholar] [CrossRef] [Green Version]
- Jourde, K.; Gibert, D.; Marteau, J.; Bremond d’Ars, J.; Gardien, S.; Girerd, C.; Ianigro, J.C. Monitoring temporal opacity fluctuations of large structures with muon radiography: A calibration experiment using a water tower. Sci. Rep. 2016, 6, 23054. [Google Scholar] [CrossRef] [PubMed] [Green Version]
- Tanaka, H.K.M.; Sannomiya, A. Development and operation of a muon detection system under extremely high humidity environment for monitoring underground water table. Geosci. Instrum. Methods Data Syst. 2013, 2, 29–34. [Google Scholar] [CrossRef] [Green Version]
- Lázaro Roche, I.; Pasquet, S.; Chalikakis, K.; Mazzilli, N.; Rosas-Carbajal, M.; Decitre, J.B.; Serene, L.; Batiot-Guilhe, C.; Emblanch, C.; Marteau, J.; et al. Water resource management: The multi-technique approach of the Low Background Noise Underground Research Laboratory of Rustrel, France, and its muon detection projects. In Muography: Exploring Earth’s Subsurface with Elementary Particles; Geophysical Monograph Series; Oláh, L., Tanaka, H., Varga, D., Eds.; American Geophysical Union: Washington, DC, USA, 2021; (accepted). [Google Scholar]
- Lázaro Roche, I.; Salin, P.; Gaffet, S.; Serre, T.; Decitre, J.B.; Hivert, F. Method and Device for Determining the Density of Rocky Volumes or Artificial Buildings. WO/2017/194647. Also published as FR3051258, EP3455649, US20190112237 and JP2019522803. Available online: https://patentscope2.wipo.int/search/en/detail.jsf?docId=US248169051&tab=NATIONALBIBLIO (accessed on 30 June 2021).
- Giomataris, I.; de Oliveira, R.; Andriamonje, S.; Aune, S.; Charpak, G.; Colas, P.; Giganon, A.; Rebourgeard, P.; Salin, P. Micromegas in a bulk. Nucl. Instrum. Methods A 2006, 560, 405–408. [Google Scholar] [CrossRef] [Green Version]
- Lázaro Roche, I.; Decitre, J.B.; Gaffet, S. Muon Survey Tomography based on Micromegas detectors for Unreachable Sites Technology (MUST2): Overview and outlook. J. Phys. Conf. Ser. 2020, 1498, 012048. [Google Scholar] [CrossRef]
- Martoiu, S.; Muller, H.; Tarazona, A.; Todelo, J. Development of the scalable readout system for micro-pattern gas detectors and other applications. JINST 2013, 8, C03015. [Google Scholar] [CrossRef] [Green Version]
- Iakovidis, G. VMM3, an ASIC for Micropattern Detectors. PoS 2018, 322. [Google Scholar] [CrossRef]
- Bouteille, S.; Attié, D.; Baron, P.; Magnier, P.; Mandjavidze, I.; Procureur, S.; Riallot, M. Large resistive 2D Micromegas with genetic multiplexing and some imaging applications. Nucl. Instr. Methods Phys. Res. A 2016, 843, 187–191. [Google Scholar] [CrossRef]
- Lázaro Roche, I. Design, Construction and In Situ Testing of a Muon Camera for Earth Science and Civil Engineering Applications. Ph.D. Thesis, Université Côte d’Azur, Nice, France, 2018. [Google Scholar]
- Lázaro Roche, I.; Bitri, A.; Bouteille, S.; Decitre, J.B.; Jourde, K.; Gance, J.; Truffert, C.; Gaffet, S. Design, construction and in situ testing of a muon camera for Earth science and civil engineering applications. E3S Web Conf. 2019, 88, 01003. [Google Scholar] [CrossRef]
- Dorman, L.I. Cosmic Rays in the Earth’s Atmosphere and Underground; Springer Science+Business Media: Berlin, Germany, 2004; p. 303. [Google Scholar]
- Lesparre, N.; Gibert, D.; Marteau, J.; Komorowski, J.C.; Nicollin, F.; Coutant, O. DensityMuon Radiography of La Soufrière of Guadeloupe Volcano: Comparison with Geological, ElectricalResistivity and Gravity data. Geophys. J. Int. 2012, 190, 1008–1019. [Google Scholar] [CrossRef]
Figure 1.
Schematic cross-section of the MUST2 detector to illustrate its working principle. Figure from [16].
Figure 1.
Schematic cross-section of the MUST2 detector to illustrate its working principle. Figure from [16].

Figure 2.
Representation of the field lines within the drift volume without (a) and with (b) the field cage. Simulation of the electron drift path (pink lines) inside the TPC without (c) and with (d) field cage. (e) Inner view of the TPC and (f) connection to the drift electrode.
Figure 2.
Representation of the field lines within the drift volume without (a) and with (b) the field cage. Simulation of the electron drift path (pink lines) inside the TPC without (c) and with (d) field cage. (e) Inner view of the TPC and (f) connection to the drift electrode.

Figure 3.
(a) Schematic representation of the unit cell of the MUST2 detector for transparence simulations. (b) Electrostatic simulation near the micromesh.
Figure 3.
(a) Schematic representation of the unit cell of the MUST2 detector for transparence simulations. (b) Electrostatic simulation near the micromesh.

Figure 4.
(a). (i) Digital model of the empty water reservoir and (a). (ii) filled with water at 414 m.a.s.l. (b) Approximation of the target volume as seen from the detector location.
Figure 4.
(a). (i) Digital model of the empty water reservoir and (a). (ii) filled with water at 414 m.a.s.l. (b) Approximation of the target volume as seen from the detector location.

Figure 5.
(a) Apparent opacity of the targeted volume with a water level of 414 m.a.s.l., the detector tilt was corrected. (b) Muons measured coming from the direction of the target volume.
Figure 5.
(a) Apparent opacity of the targeted volume with a water level of 414 m.a.s.l., the detector tilt was corrected. (b) Muons measured coming from the direction of the target volume.

Figure 6.
(a) Temporal evolution of (blue) water level of the dam and (orange) recorded muon flux and (b) change of apparent opacity of the medium due to the water transfer between the beginning and the end of the data acquisition.
Figure 6.
(a) Temporal evolution of (blue) water level of the dam and (orange) recorded muon flux and (b) change of apparent opacity of the medium due to the water transfer between the beginning and the end of the data acquisition.

Publisher’s Note: MDPI stays neutral with regard to jurisdictional claims in published maps and institutional affiliations. |
© 2021 by the author. Licensee MDPI, Basel, Switzerland. This article is an open access article distributed under the terms and conditions of the Creative Commons Attribution (CC BY) license (https://creativecommons.org/licenses/by/4.0/).
Share and Cite
MDPI and ACS Style
Lázaro Roche, I. A Compact Muon Tracker for Dynamic Tomography of Density Based on a Thin Time Projection Chamber with Micromegas Readout. Particles 2021, 4, 333-342. https://0-doi-org.brum.beds.ac.uk/10.3390/particles4030028
AMA Style
Lázaro Roche I. A Compact Muon Tracker for Dynamic Tomography of Density Based on a Thin Time Projection Chamber with Micromegas Readout. Particles. 2021; 4(3):333-342. https://0-doi-org.brum.beds.ac.uk/10.3390/particles4030028
Chicago/Turabian StyleLázaro Roche, Ignacio. 2021. "A Compact Muon Tracker for Dynamic Tomography of Density Based on a Thin Time Projection Chamber with Micromegas Readout" Particles 4, no. 3: 333-342. https://0-doi-org.brum.beds.ac.uk/10.3390/particles4030028