Combining Computed Tomography and Histology Leads to an Evolutionary Concept of Hepatic Alveolar Echinococcosis

 , and
, and
Abstract
:1. Introduction
2. Materials and Methods
2.1. Study Design
2.2. Staining
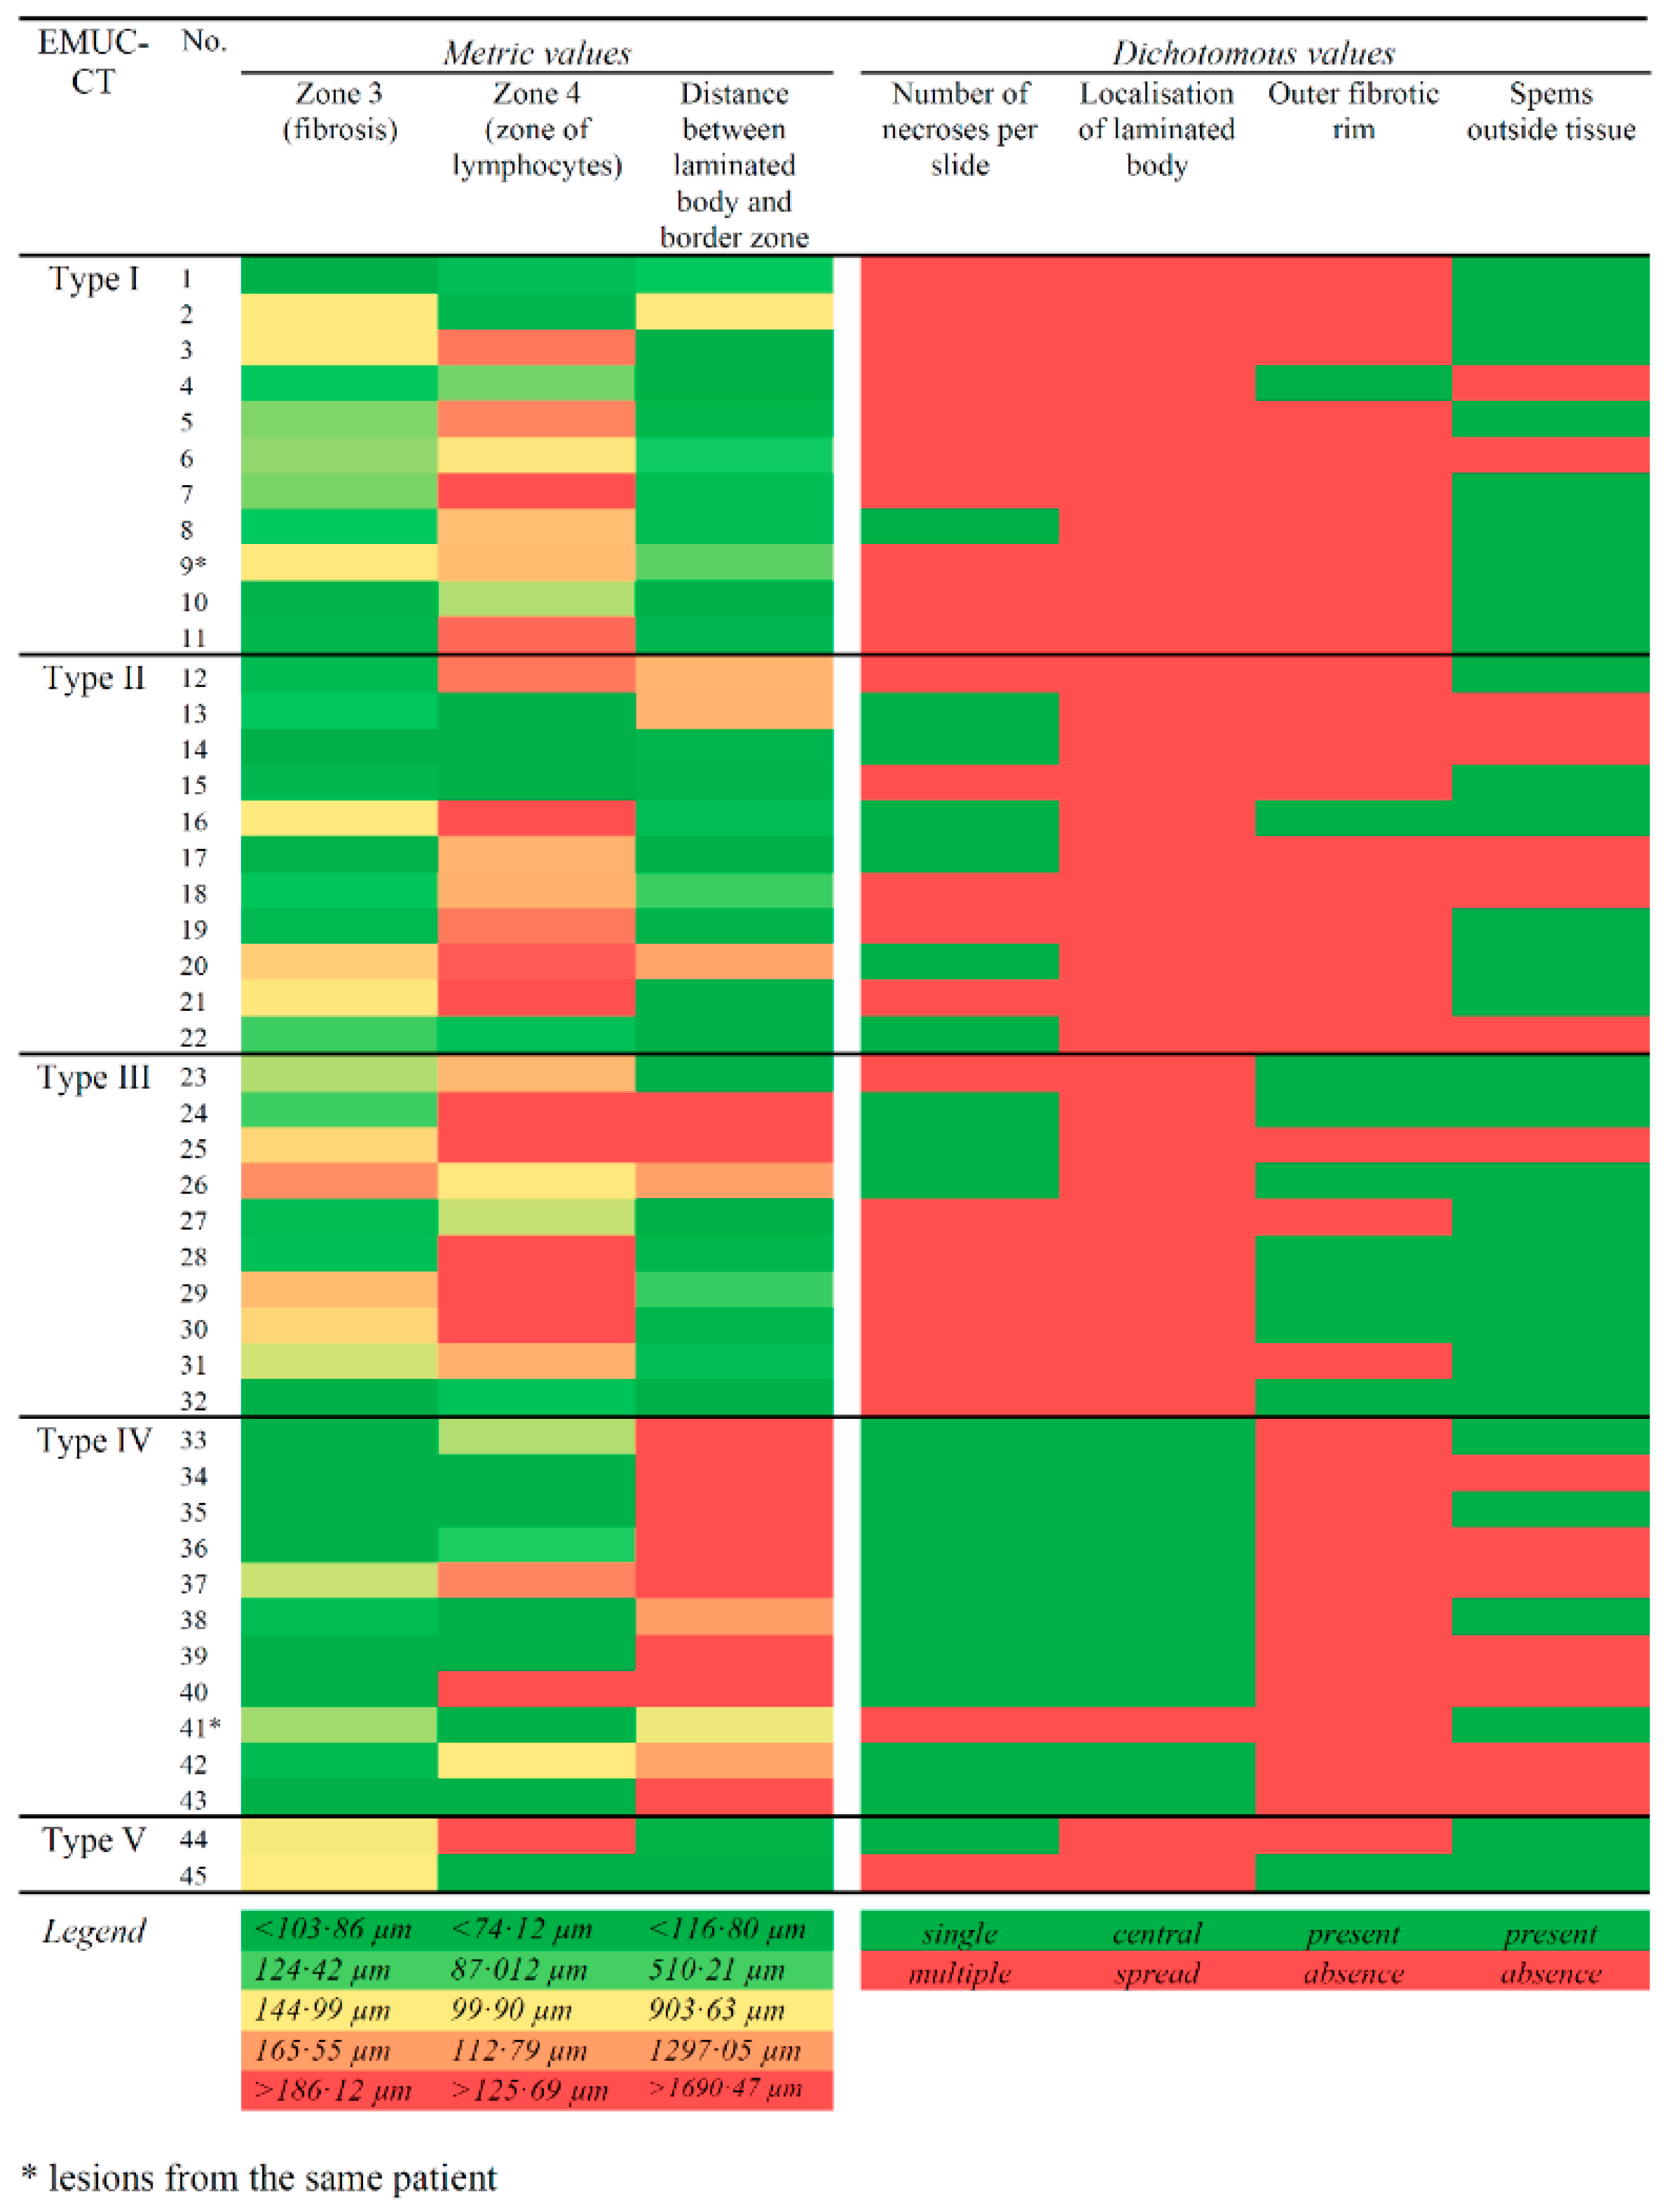
2.3. Histological Parameters
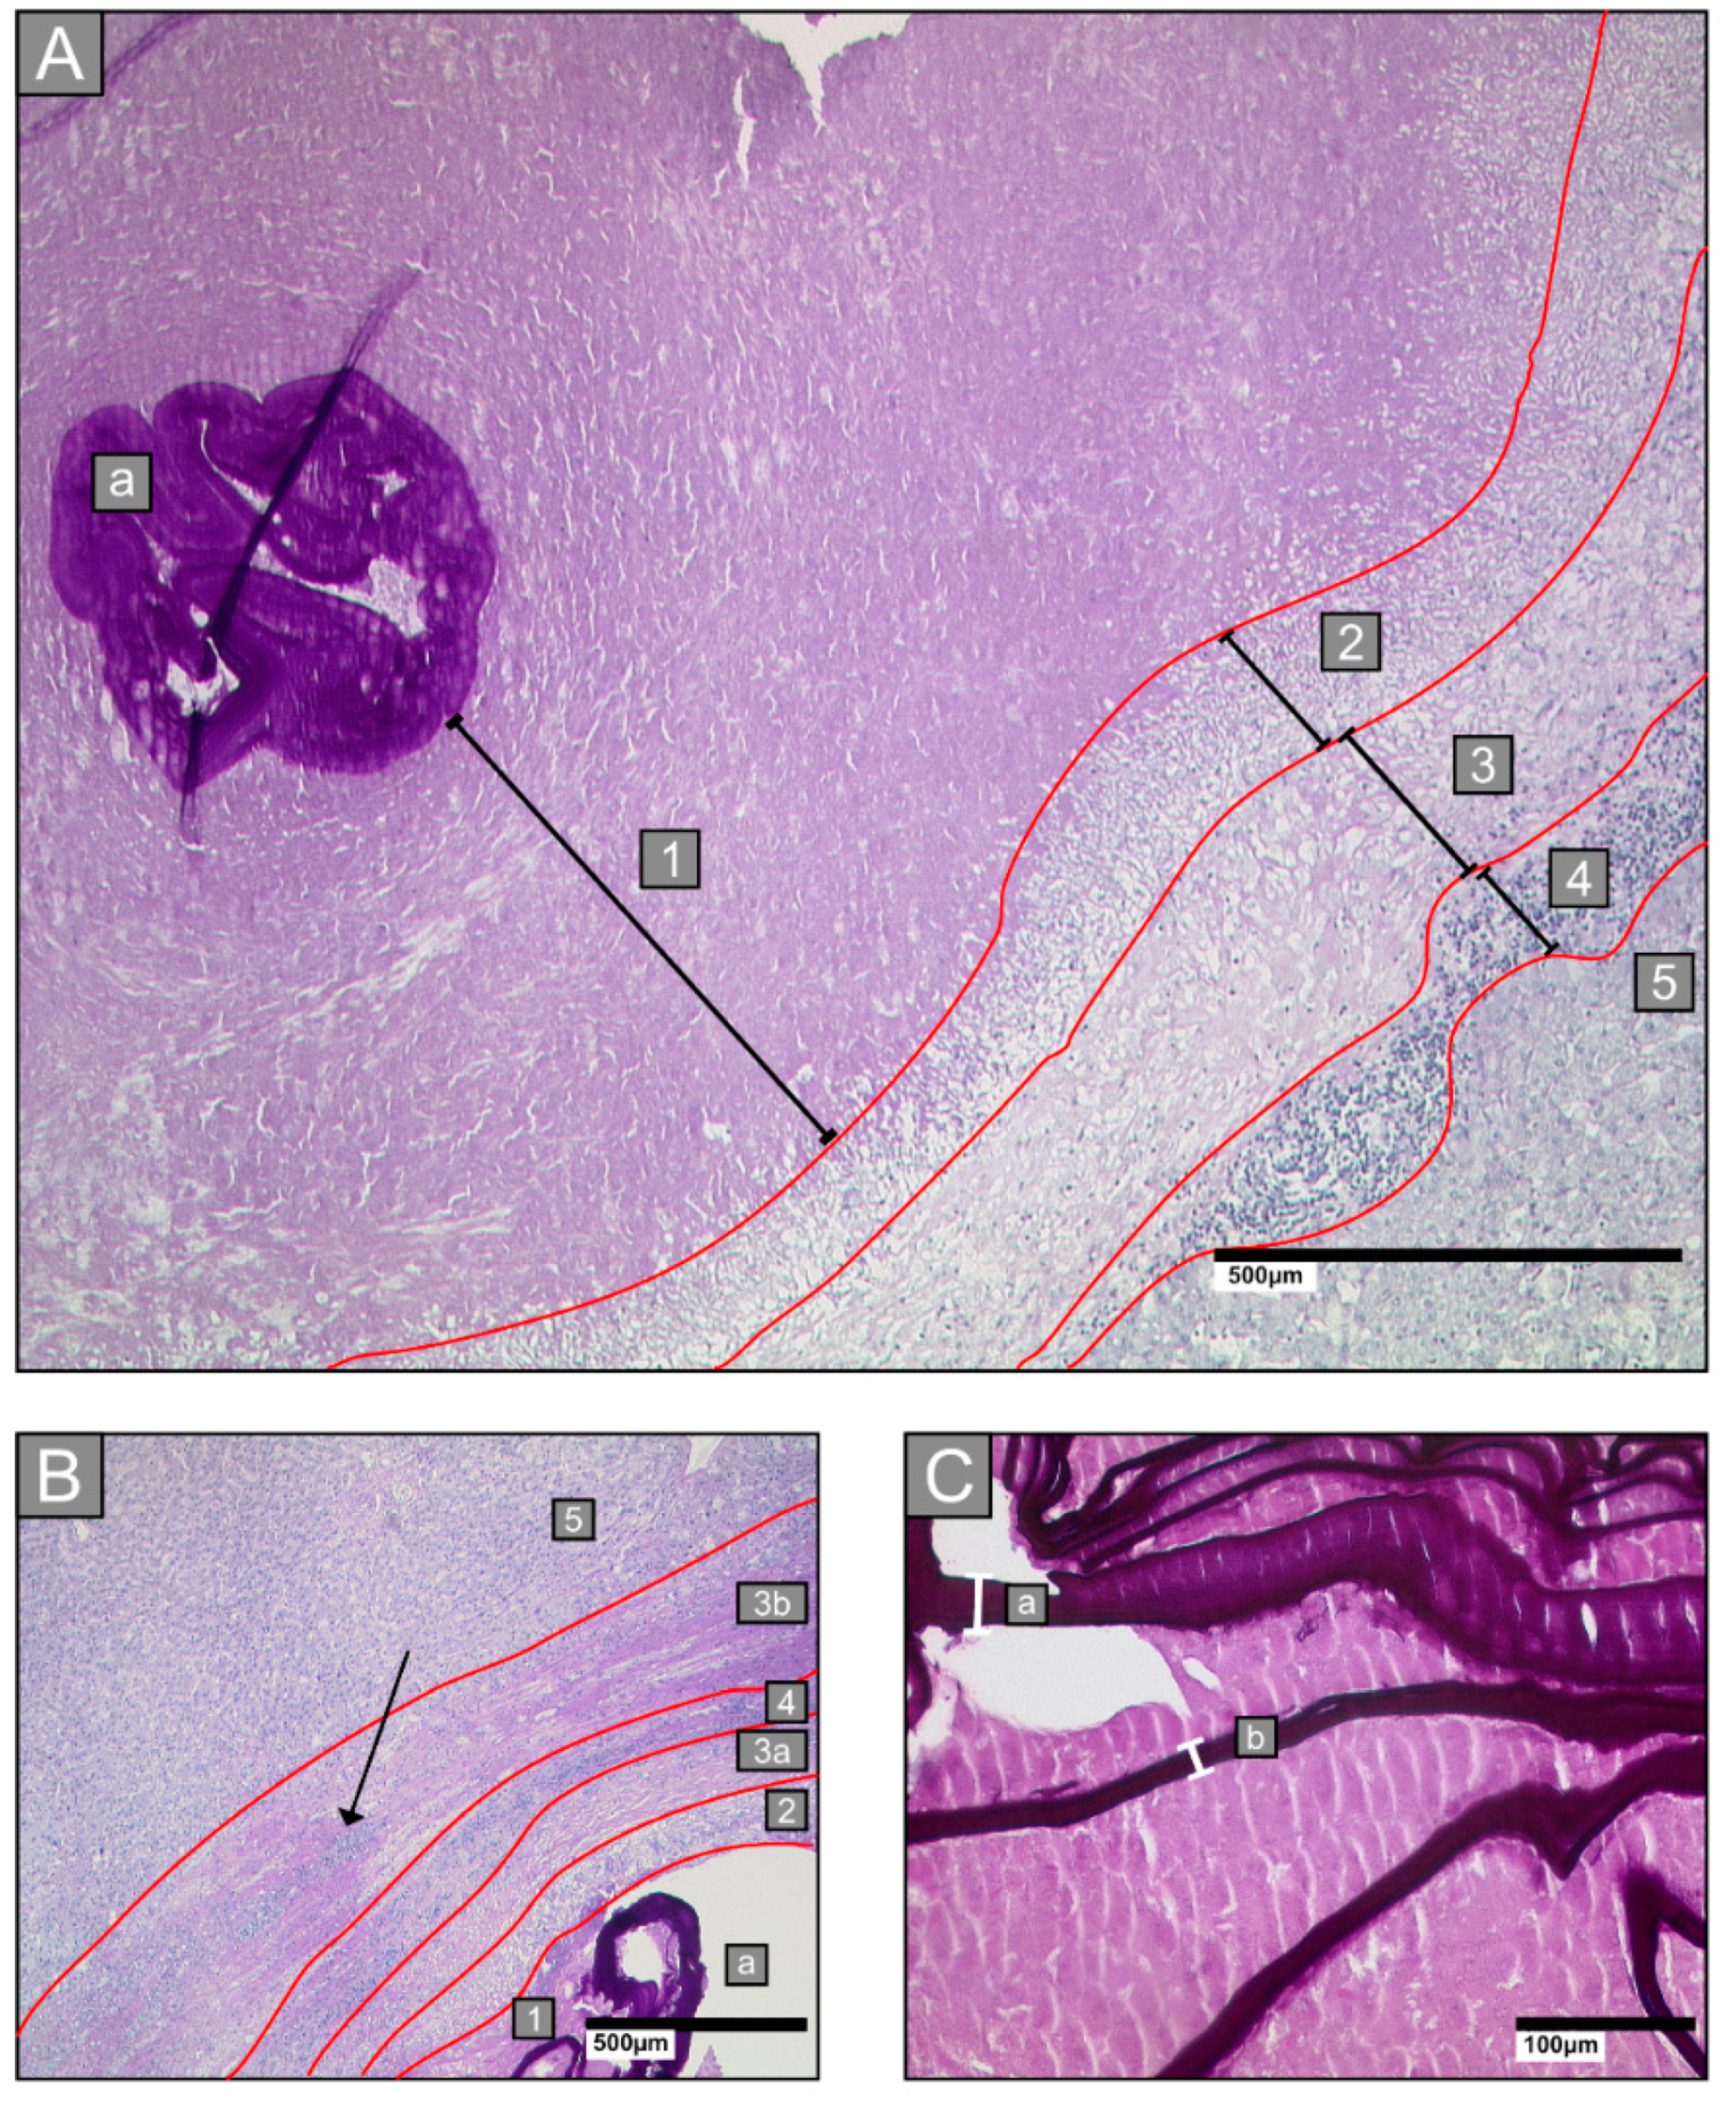
- Zone 1: all lesions had a central necrotic area of various diameters, intermingled with laminated layer fragments of various sizes
- Zone 2: an inner ring next to the necrotic zone, characterised by epithelioid cells and neutrophilic granulocytes
- Zone 3: a fibrotic ring of varying widths
- Zone 4: an outer ring that contains lymphocytes
- Zone 5: surrounding hepatic tissue
2.3.1. Laminated Layer
2.3.2. Border Zone
2.3.3. Necrosis
2.3.4. Small Particles of Echinococcus Multilocularis (Spems)
2.4. Statistical Analysis
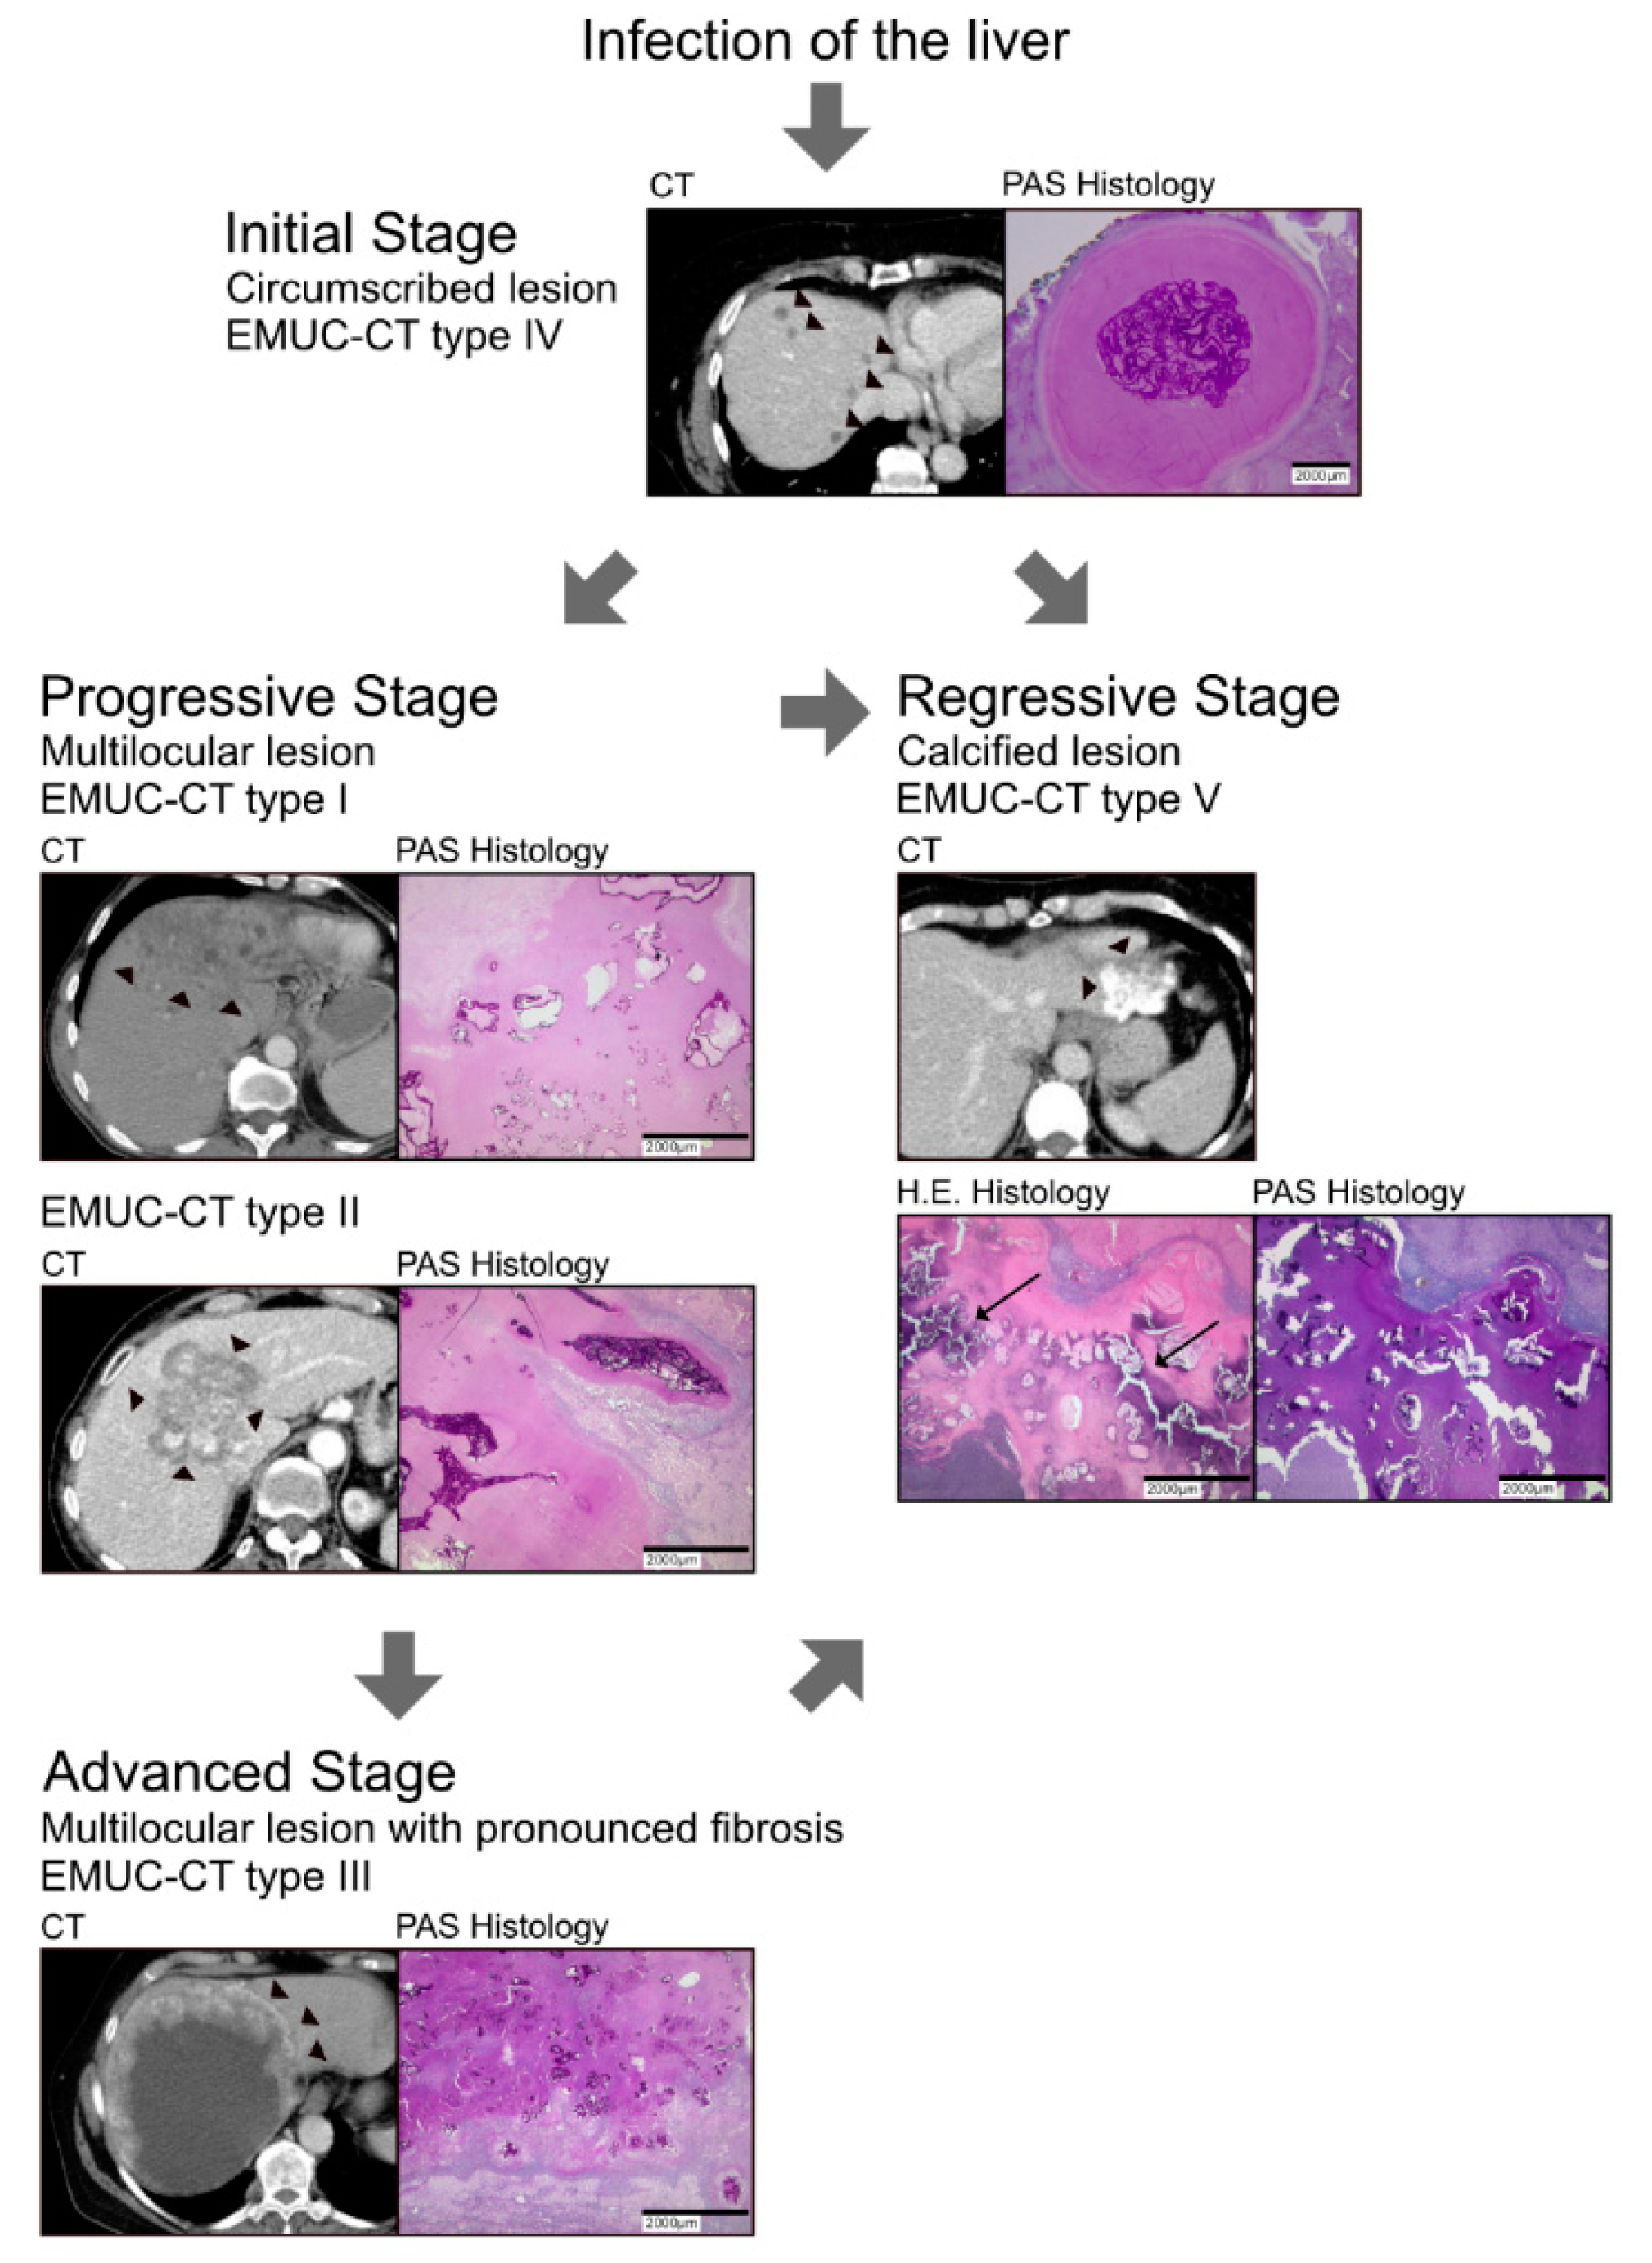
3. Results
3.1. Patient Cohort
3.2. Laminated Layer
3.3. Border Zone
3.4. Necrosis
3.5. Analysis of Small Particles of Echinococcus Multilocularis (Spems)
3.6. Type V
4. Discussion
Supplementary Materials
Author Contributions
Funding
Acknowledgments
Conflicts of Interest
References
- WHO/OIE Manual on Echinococcosis in Humans and Animals: A Public Health Problem of Global Concern; Eckert, J.; Gemmell, M.A.; Meslin, F.; Pawlowski, Z.S. (Eds.) WHO: Geneva, Switzerland; OIE: Paris, France, 2001. [Google Scholar]
- Kern, P.; Menezes da Silva, A.; Akhan, O.; Mullhaupt, B.; Vizcaychipi, K.A.; Budke, C.; Vuitton, D.A. The Echinococcoses: Diagnosis, Clinical Management and Burden of Disease. Adv. Parasitol. 2017, 96, 259–369. [Google Scholar] [CrossRef] [PubMed]
- Baumann, S.; Shi, R.; Liu, W.; Bao, H.; Schmidberger, J.; Kratzer, W.; Li, W.; Interdisciplinary Echinococcosis Working Group Ulm. Worldwide literature on epidemiology of human alveolar echinococcosis: A systematic review of research published in the twenty-first century. Infection 2019, 47, 703–727. [Google Scholar] [CrossRef] [PubMed] [Green Version]
- Romig, T.; Deplazes, P.; Jenkins, D.; Giraudoux, P.; Massolo, A.; Craig, P.S.; Wassermann, M.; Takahashi, K.; de la Rue, M. Ecology and Life Cycle Patterns of Echinococcus Species. Adv. Parasitol. 2017, 95, 213–314. [Google Scholar] [CrossRef] [PubMed]
- Brunetti, E.; Kern, P.; Vuitton, D.A. Writing Panel for the WHO-IWGE. Expert consensus for the diagnosis and treatment of cystic and alveolar echinococcosis in humans. Acta Trop. 2010, 114, 1–16. [Google Scholar] [CrossRef]
- Kern, P.; Wen, H.; Sato, N.; Vuitton, D.A.; Gruener, B.; Shao, Y.; Delabrousse, E.; Kratzer, W.; Bresson-Hadni, S. WHO classification of alveolar echinococcosis: Principles and application. Parasitol. Int. 2006, 55, S283–S287. [Google Scholar] [CrossRef]
- Kratzer, W.; Gruener, B.; Kaltenbach, T.E.; Ansari-Bitzenberger, S.; Kern, P.; Fuchs, M.; Mason, R.A.; Barth, T.F.; Haenle, M.M.; Hillenbrand, A.; et al. Proposal of an ultrasonographic classification for hepatic alveolar echinococcosis: Echinococcosis multilocularis Ulm classification-ultrasound. World J. Gastroenterol. 2015, 21, 12392–12402. [Google Scholar] [CrossRef]
- Graeter, T.; Kratzer, W.; Oeztuerk, S.; Haenle, M.M.; Mason, R.A.; Hillenbrand, A.; Kull, T.; Barth, T.F.; Kern, P.; Gruener, B. Proposal of a computed tomography classification for hepatic alveolar echinococcosis. World J. Gastroenterol. 2016, 22, 3621–3631. [Google Scholar] [CrossRef]
- Kodama, Y.; Fujita, N.; Shimizu, T.; Endo, H.; Nambu, T.; Sato, N.; Todo, S.; Miyasaka, K. Alveolar echinococcosis: MR findings in the liver. Radiology 2003, 228, 172–177. [Google Scholar] [CrossRef]
- Reinehr, M.; Micheloud, C.; Grimm, F.; Kronenberg, P.A.; Grimm, J.; Beck, A.; Nell, J.; Meyer Zu Schwabedissen, C.; Furrer, E.; Müllhaupt, B.; et al. Pathology of Echinococcosis: A Morphologic and Immunohistochemical Study on 138 Specimens With Focus on the Differential Diagnosis Between Cystic and Alveolar Echinococcosis. Am. J. Surg. Pathol. 2019. [Google Scholar] [CrossRef]
- Barth, T.F.; Herrmann, T.S.; Tappe, D.; Stark, L.; Grüner, B.; Buttenschoen, K.; Hillenbrand, A.; Juchems, M.; Henne-Bruns, D.; Kern, P.; et al. Sensitive and specific immunohistochemical diagnosis of human alveolar echinococcosis with the monoclonal antibody Em2G11. PLoS Negl. Trop. Dis. 2012, 6, e1877. [Google Scholar] [CrossRef]
- Deplazes, P.; Gottstein, B. A monoclonal antibody against Echinococcus multilocularis Em2 antigen. Parasitology 1991, 103, 41–49. [Google Scholar] [CrossRef] [PubMed] [Green Version]
- Diaz, A.; Fernandez, C.; Pittini, A.; Seoane, P.I.; Allen, J.E.; Casaravilla, C. The laminated layer: Recent advances and insights into Echinococcus biology and evolution. Exp. Parasitol. 2015, 158, 23–30. [Google Scholar] [CrossRef] [PubMed]
- Buttenschoen, K.; Kern, P.; Reuter, S.; Barth, T.F. Hepatic infestation of Echinococcus multilocularis with extension to regional lymph nodes. Langenbecks Arch. Surg. 2009, 394, 699–704. [Google Scholar] [CrossRef] [PubMed]
- McManus, J.F. Histological and histochemical uses of periodic acid. Stain Technol. 1948, 23, 99–108. [Google Scholar] [CrossRef] [PubMed]
- Koneff, A.A. Adaptation of the Mallory-Azan Staining Method to the Anterior Pituitary of the Rat. Biotech. Histochem. 1938, 13, 49–52. [Google Scholar] [CrossRef]
- Lamprecht, M.R.; Sabatini, D.M.; Carpenter, A.E. CellProfiler™: Free, versatile software for automated biological image analysis. BioTechniques 2007, 42, 71–75. [Google Scholar] [CrossRef] [Green Version]
- Rausch, R. Studies on the helminth fauna of Alaska. XX. The histogenesis of the alveolar larva of Echinococcus species. J. Infect. Dis. 1954, 94, 178–186. [Google Scholar] [CrossRef]
- Sakamoto, T.; Sugimura, M. Studies on echinococcosis. 23. Electron microscopical observations on histogenesis of larval Echinococcus multilocularis. Jpn. J. Vet. Res. 1970, 18, 131–144. [Google Scholar]
- Thompson, R.C. Biology and Systematics of Echinococcus. Adv. Parasitol. 2017, 95, 65–109. [Google Scholar] [CrossRef] [Green Version]
- Díaz, A.; Casaravilla, C.; Irigoín, F.; Lin, G.; Previato, J.O.; Ferreira, F. Understanding the laminated layer of larval Echinococcus I: Structure. Trends Parasitol. 2011, 27, 204–213. [Google Scholar] [CrossRef]
- Diaz, A.; Casaravilla, C.; Allen, J.E.; Sim, R.B.; Ferreira, A.M. Understanding the laminated layer of larval Echinococcus II: Immunology. Trends Parasitol. 2011, 27, 264–273. [Google Scholar] [CrossRef] [PubMed]
- Vuitton, D.A.; Gottstein, B. Echinococcus multilocularis and its intermediate host: A model of parasite-host interplay. J. Biomed. Biotechnol. 2010, 2010, 923193. [Google Scholar] [CrossRef] [PubMed] [Green Version]
- Ricken, F.J.; Nell, J.; Grüner, B.; Schmidberger, J.; Kaltenbach, T.; Kratzer, W.; Hillenbrand, A.; Henne-Bruns, D.; Deplazes, P.; Moller, P.; et al. Albendazole increases the inflammatory response and the amount of Em2-positive small particles of Echinococcus multilocularis (spems) in human hepatic alveolar echinococcosis lesions. PLoS Negl. Trop. Dis. 2017, 11, e0005636. [Google Scholar] [CrossRef] [PubMed]
- Vuitton, D.A.; Guerret-Stocker, S.; Carbillet, J.P.; Mantion, G.; Miguet, J.P.; Grimaud, J.A. Collagen immunotyping of the hepatic fibrosis in human alveolar echinococcosis. Zeitschrift für Parasitenkunde 1986, 72, 97–104. [Google Scholar] [CrossRef]
- Pinzani, M.; Romanelli, R.G.; Magli, S. Progression of fibrosis in chronic liver diseases: Time to tally the score. J. Hepatol. 2001, 34, 764–767. [Google Scholar] [CrossRef]
- Sturm, D.; Menzel, J.; Gottstein, B.; Kern, P. Interleukin-5 is the predominant cytokine produced by peripheral blood mononuclear cells in alveolar echinococcosis. Infect. Immun. 1995, 63, 1688–1697. [Google Scholar] [CrossRef] [Green Version]
- Tappe, D.; Zidowitz, S.; Demmer, P.; Kern, P.; Barth, T.F.; Frosch, M. Three-dimensional reconstruction of Echinococcus multilocularis larval growth in human hepatic tissue reveals complex growth patterns. Am. J. Trop. Med. Hyg. 2010, 82, 126–127. [Google Scholar] [CrossRef] [Green Version]
- Casaravilla, C.; Pittini, A.; Rueckerl, D.; Seoane, P.I.; Jenkins, S.J.; MacDonald, A.S.; Ferreira, A.M.; Allen, J.E.; Díaz, A. Unconventional maturation of dendritic cells induced by particles from the laminated layer of larval Echinococcus granulosus. Infect. Immun. 2014, 82, 3164–3176. [Google Scholar] [CrossRef] [Green Version]
- Dai, W.J.; Hemphill, A.; Waldvogel, A.; Ingold, K.; Deplazes, P.; Mossmann, H.; Gottstein, B. Major carbohydrate antigen of Echinococcus multilocularis induces an immunoglobulin G response independent of alphabeta+ CD4+ T cells. Infect. Immun. 2001, 69, 6074–6083. [Google Scholar] [CrossRef] [Green Version]
- Graeter, T.; Bao, H.; Delabrousse, E.; Brumpt, E.; Shi, R.; Li, W.; Jiang, Y.; Schmidberger, J.; Kratzer, W.; Liu, W.; et al. Hepatic alveolar echinococcosis: Comparative computed tomography study between two Chinese and two European centres. Food Waterborne Parasitol. 2020, 19, e00082. [Google Scholar] [CrossRef]
- Engler, A.; Shi, R.; Beer, M.; Schmidberger, J.; Kratzer, W.; Barth, T.F.E.; Grimm, J.; Hillenbrand, A.; Henne-Bruns, D.; Gruener, B.; et al. Simple liver cysts and cystoid lesions in hepatic alveolar echinococcosis: A retrospective cohort study with Hounsfield analysis. Parasite 2019, 26, 54. [Google Scholar] [CrossRef] [PubMed] [Green Version]
- Graeter, T.; Eberhardt, N.; Shi, R.; Schmidberger, J.; Beer, A.J.; Beer, M.; Henne-Bruns, D.; Hillenbrand, A.; Barth, T.F.E.; Grimm, J.; et al. Hepatic alveolar echinococcosis: Correlation between computed tomography morphology and inflammatory activity in positron emission tomography. Sci. Rep. 2020, 10, 11808–11809. [Google Scholar] [CrossRef] [PubMed]


| Histological Parameter | Lesion Measurements; Mean ± SD Median (Min–Max) | p-Value b | ||||
|---|---|---|---|---|---|---|
| Type I | Type II | Type III | Type IV | Type V a | ||
| Width of border zone (µm) | 377.80 ± 64.53 375.99 302.87–487.18 | 391.83 ± 109.36 361.37 271.41–584.91 | 454.07 ± 127.49 416.34 286.74–672.44 | 334.27 ± 103.34 291.47 224.80–573.34 | 388.54 | 0.0621 |
| Zone of epithelioid cells (µm) | 120.84 ± 26.24 128.02 70.01-165.28 | 127.76 ± 32.73 116.51 79.74-188.09 | 115.37 ± 21.98 110.23 90.67-154.85 | 147.88 ± 77.78 126.20 47.22–340.68 | 106.33 | 0.5965 |
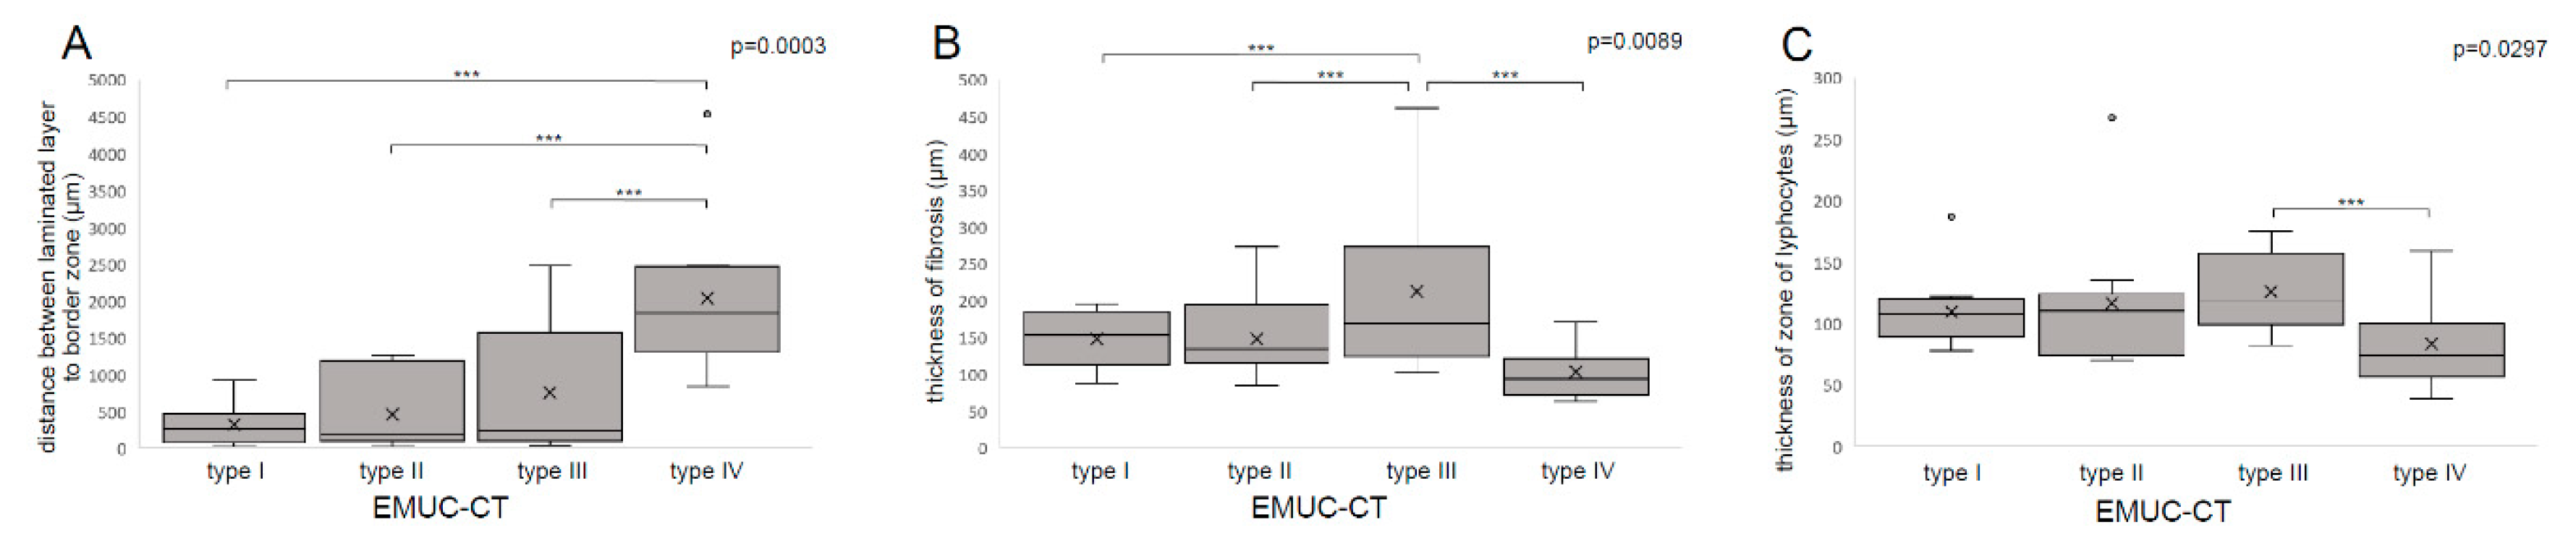
| Zone of fibrosis (µm) | 147.61 ± 35.27 153.27 87.71–195.12 | 147.52 ± 54.46 133.59 84.35–272.71 | 212.92 ± 113.66 169.03 101.90–461.28 | 102.74 ± 37.06 94.14 62.97–171.22 | 184.09 | 0.0089 ** |
| Zone of lymphocytes (µm) | 109.36 ± 29.91 107.62 77.37–186.93 | 116.55 ± 55.23 109.73 69.88–267.44 | 125.78 ± 32.36 117.76 82.10–174.93 | 83.65 ± 33.71 74.12 38.96–159.10 | 98.13 | 0.0297 * |
| Thickness of laminated layer fragments (µm) | 24.67 ± 7.36 23.89 12.64–37.41 | 22.85 ± 9.36 24.07 8.86–41.86 | 46.68 ± 57.17 22.64 15.68–193.32 | 27.14 ± 12.06 27.95 11.83-46.95 | 22.72 | 0.9000 |
| Distance between laminated layer and border zone (µm) | 318.16 ± 266.48 264.80 28.00–926.92 | 464.26 ± 502.04 180.30 30.10–1266.50 | 756.60 ± 969.42 238.04 38.40–2479.60 | 2037.75 ± 968.43 1842.40 842.80–4533.80 | 120.62 | 0.0003 *** |
| Spems in necrotic area (relative area covered by mAbEm2G11-positive stained spems in a single observation field; magnification 100×) | 0.51 ± 0.19 0.54 0.17–0.81 | 0.34 ± 0.24 0.23 0.07–0.68 | 0.38 ± 0.25 0.43 0.04–0.80 | 0.32 ± 0.20 0.31 0.01–0.66 | - | 0.2621 |
| Histological Parameter | Number of Lesions (Percent for Each Type) | p-Value b | |||||
|---|---|---|---|---|---|---|---|
| Type I | Type II | Type III | Type IV | Type V a | |||
| Localisation of laminated layer fragments | Distributed throughout the necrotic area | 11 (100.00) | 11 (100.00) | 10 (100.00) | 1 (9.09) | 2 (100.00) | <0.0001 *** |
| Centralised alveolae | 0 (0.00) | 0 (0.00) | 0 (0.00) | 10 (90.01) | 0 (0.00) | ||
| Number of necrotic areas per section | Multiple necrotic areas | 10 (90.91) | 5 (45.45) | 7 (70.00) | 1 (9.09) | 1 (50.00) | 0.0010 ** |
| Single necrotic area | 1 (9.09) | 6 (54.55) | 3 (30.00) | 10 (90.91) | 1 (50.00) | ||
| Outer fibrotic rim (Zone 3b) | No fibrosis | 10 (90.91) | 10 (90.91) | 3 (30.00) | 11 (100.00) | 1 (50.00) | 0.0002 *** |
| Fibrosis | 1 (9.09) | 1 (9.09) | 7 (70.00) | 0 (0.00) | 1 (50.00) | ||
| Spems in necrotic area (scored 1–3) | 1 (spems only attached to the laminated layer) | 0 (0.00) | 0 (0.00) | 2 (20.00) | 2 (18.18) | 0 (0.00) | no p-value calculated |
| 2 (spems in entire necrotic area, but less abundant near the border) | 6 (54.55) | 7 (63.64) | 3 (30.00) | 6 (54.55) | 0 (0.00) | ||
| 3 (spems in entire necrotic area) | 5 (45.45) | 4 (36.36) | 5 (50.00) | 3 (27.27) | 2 (100.00) | ||
| Spems in non-necrotic liver tissue | No spems | 2 (18.18) | 5 (45.45) | 1 (10.00) | 7 (63.64) | 0 (0.00) | 0.0348 * |
| Spems | 9 (81.82) | 6 (54.55) | 9 (90.00) | 4 (36.36) | 2 (100.00) | ||
© 2020 by the authors. Licensee MDPI, Basel, Switzerland. This article is an open access article distributed under the terms and conditions of the Creative Commons Attribution (CC BY) license (http://creativecommons.org/licenses/by/4.0/).
Share and Cite
Grimm, J.; Beck, A.; Nell, J.; Schmidberger, J.; Hillenbrand, A.; Beer, A.J.; Dezsényi, B.; Shi, R.; Beer, M.; Kern, P.; et al. Combining Computed Tomography and Histology Leads to an Evolutionary Concept of Hepatic Alveolar Echinococcosis. Pathogens 2020, 9, 634. https://0-doi-org.brum.beds.ac.uk/10.3390/pathogens9080634
Grimm J, Beck A, Nell J, Schmidberger J, Hillenbrand A, Beer AJ, Dezsényi B, Shi R, Beer M, Kern P, et al. Combining Computed Tomography and Histology Leads to an Evolutionary Concept of Hepatic Alveolar Echinococcosis. Pathogens. 2020; 9(8):634. https://0-doi-org.brum.beds.ac.uk/10.3390/pathogens9080634
Chicago/Turabian StyleGrimm, Johannes, Annika Beck, Juliane Nell, Julian Schmidberger, Andreas Hillenbrand, Ambros J. Beer, Balázs Dezsényi, Rong Shi, Meinrad Beer, Peter Kern, and et al. 2020. "Combining Computed Tomography and Histology Leads to an Evolutionary Concept of Hepatic Alveolar Echinococcosis" Pathogens 9, no. 8: 634. https://0-doi-org.brum.beds.ac.uk/10.3390/pathogens9080634