Application of High-Performance Liquid Chromatography for Simultaneous Determination of Tenofovir and Creatinine in Human Urine and Plasma Samples

 , ,
, ,
Abstract
:1. Introduction
2. Results
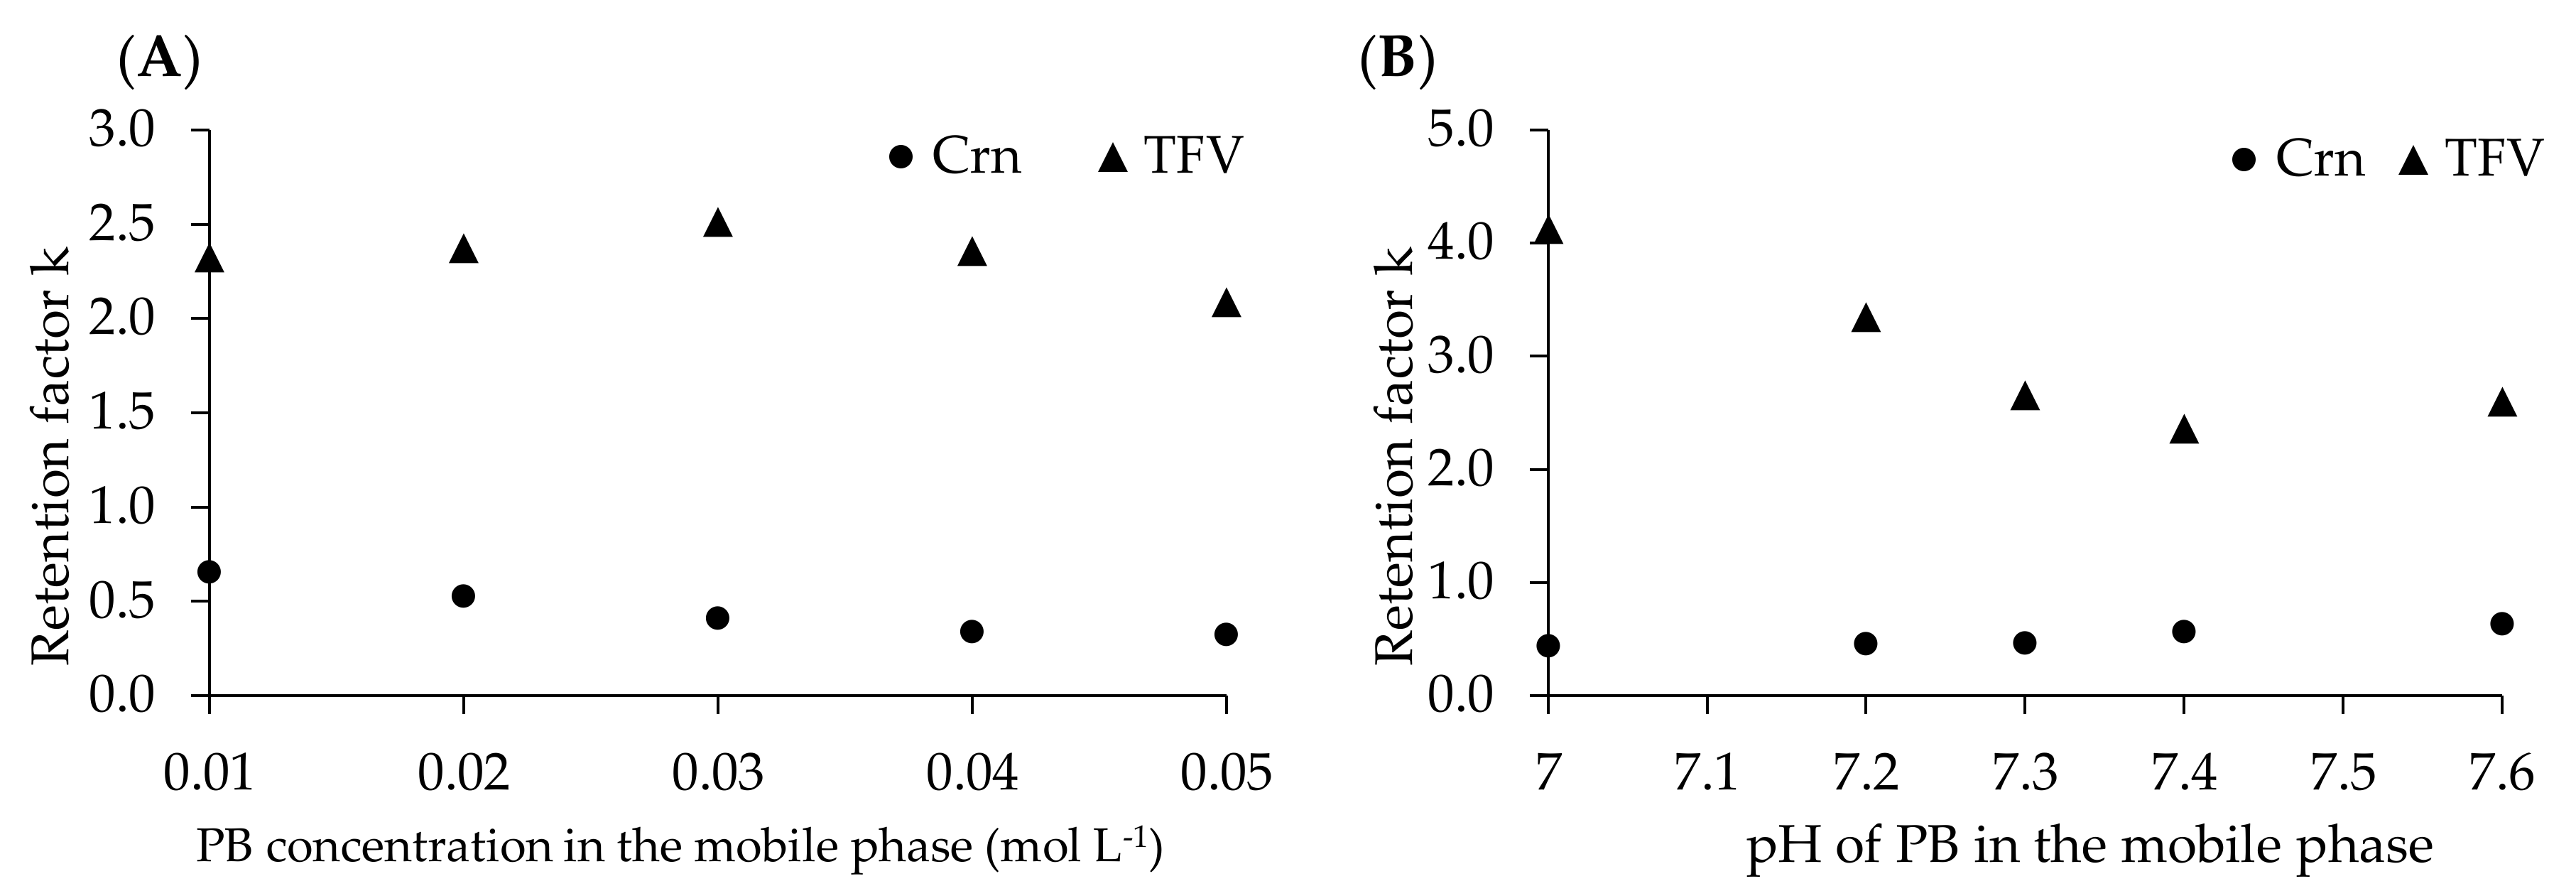
2.1. Chromatpgraphy
2.2. Method Validation
2.2.1. Method Calibration
2.2.2. LOD and LOQ
2.2.3. Precision and Accuracy
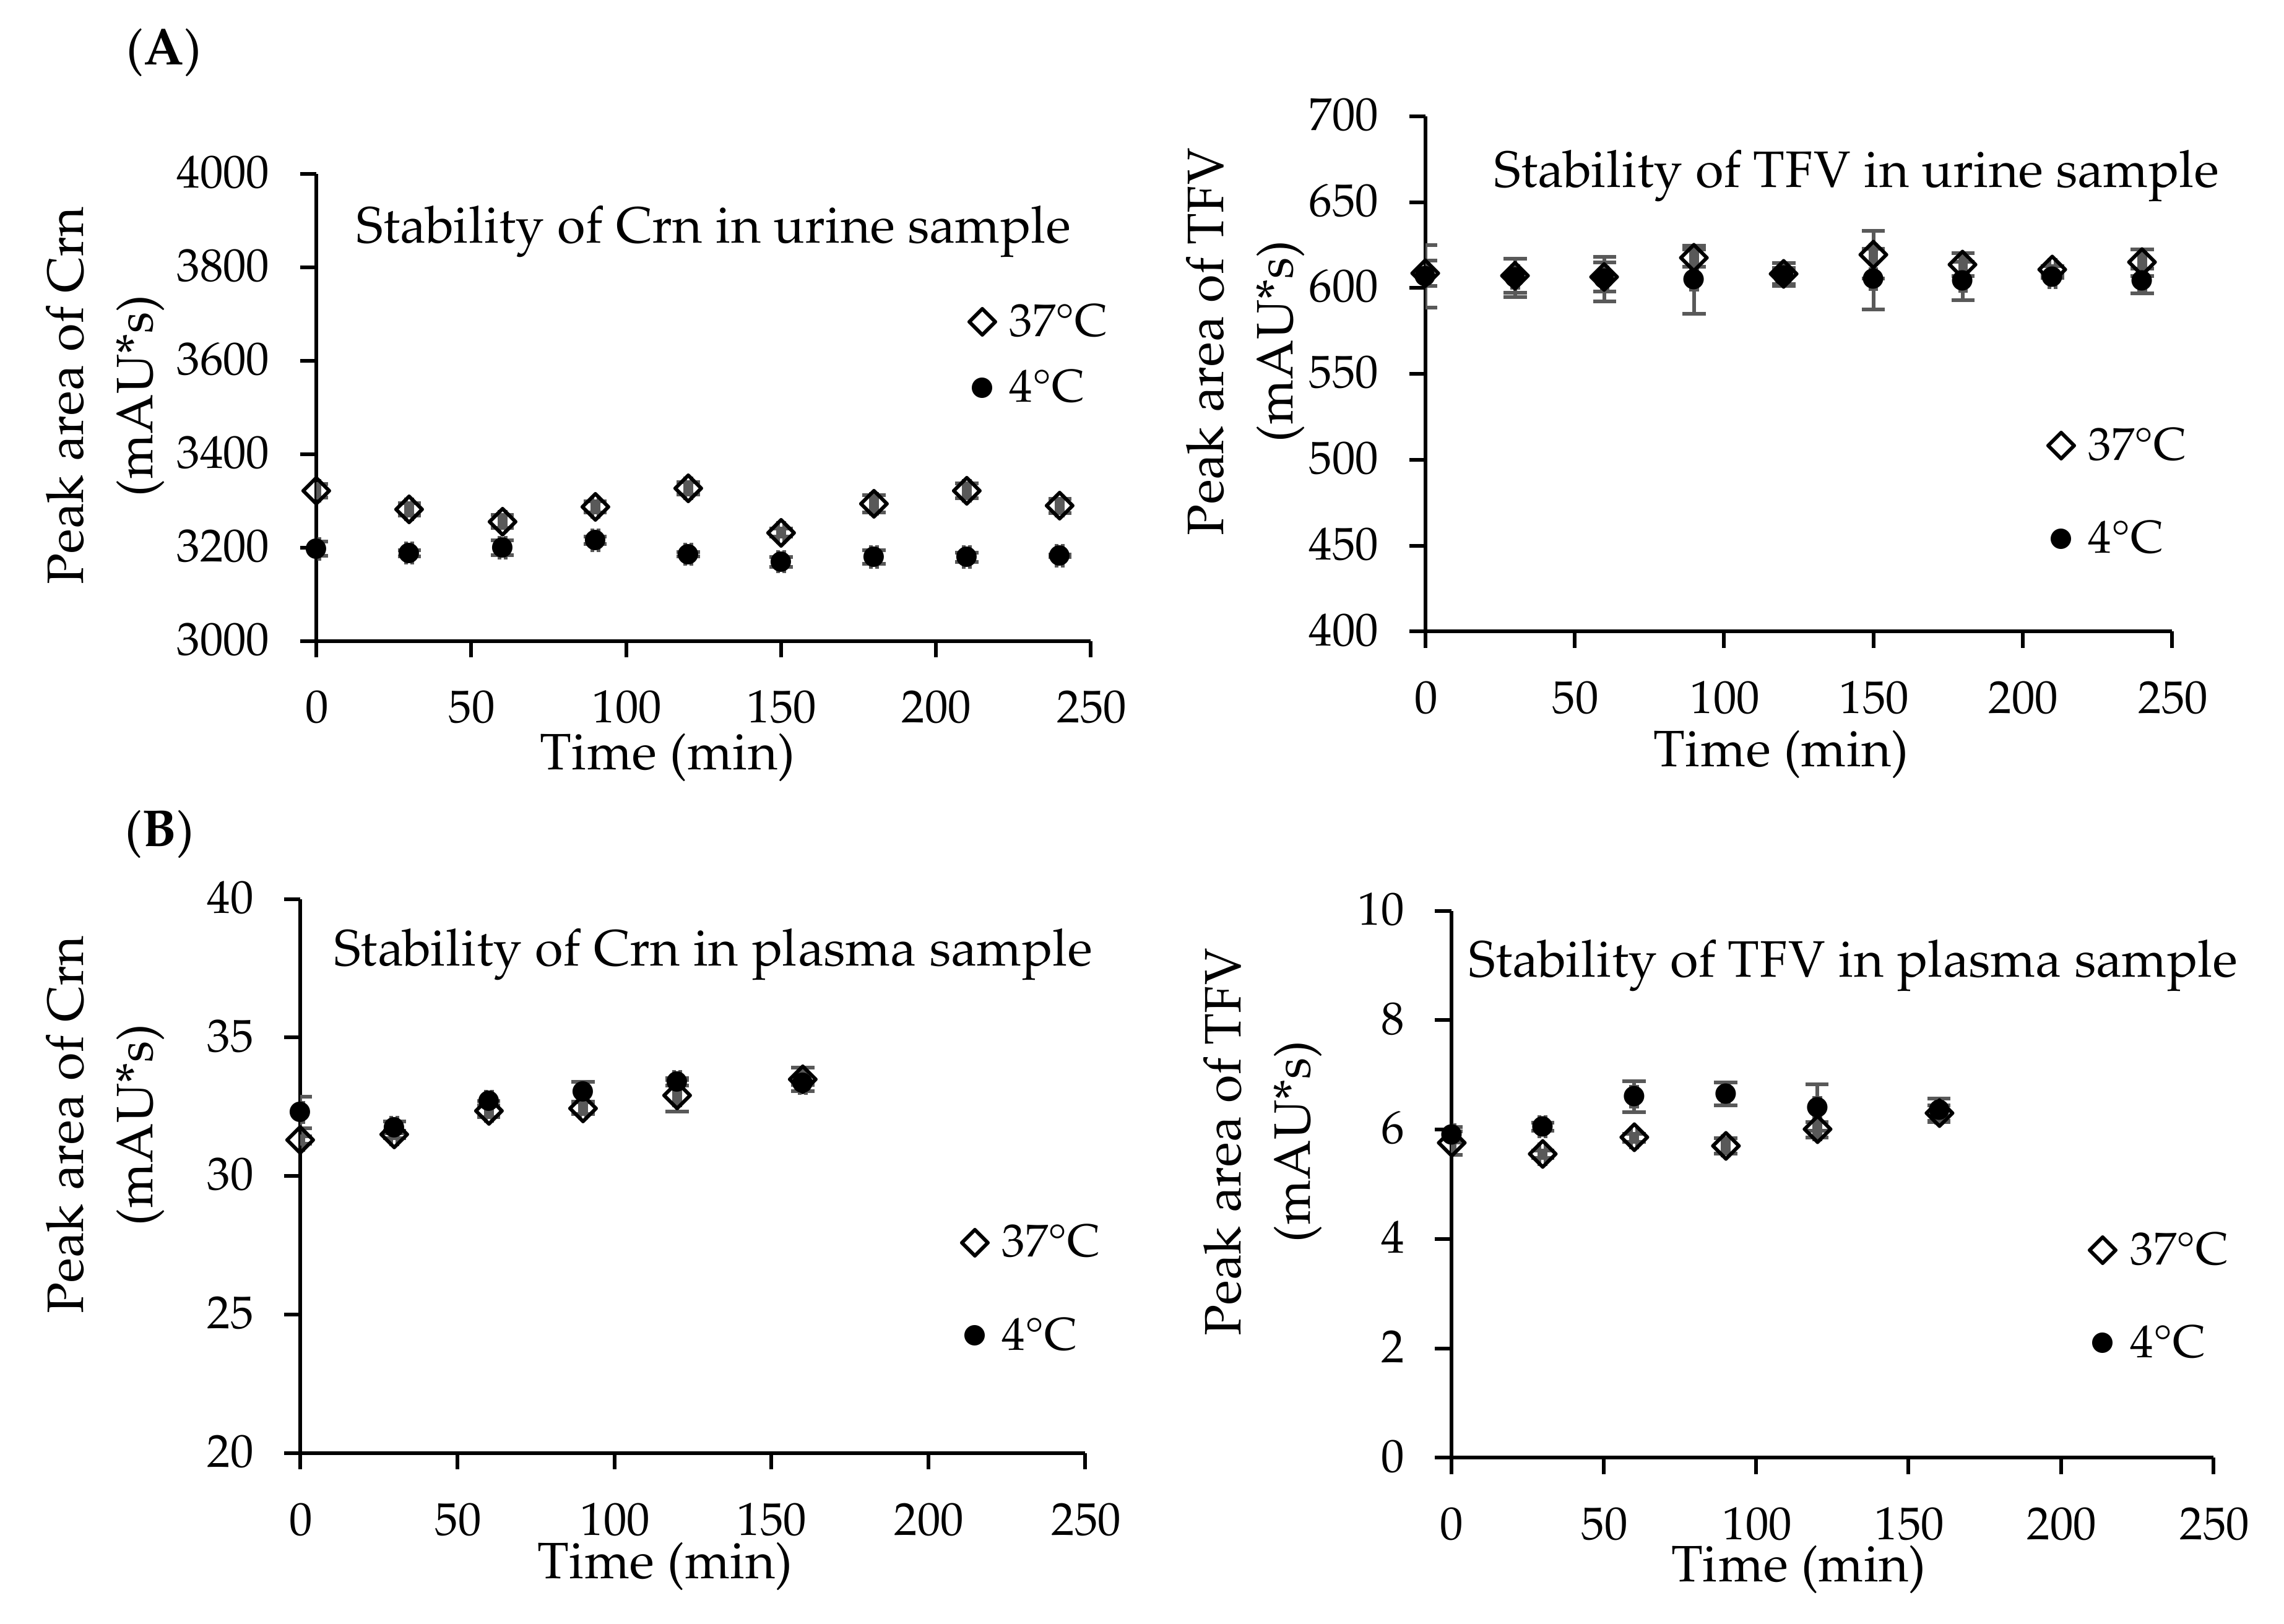
2.3. Stability Study
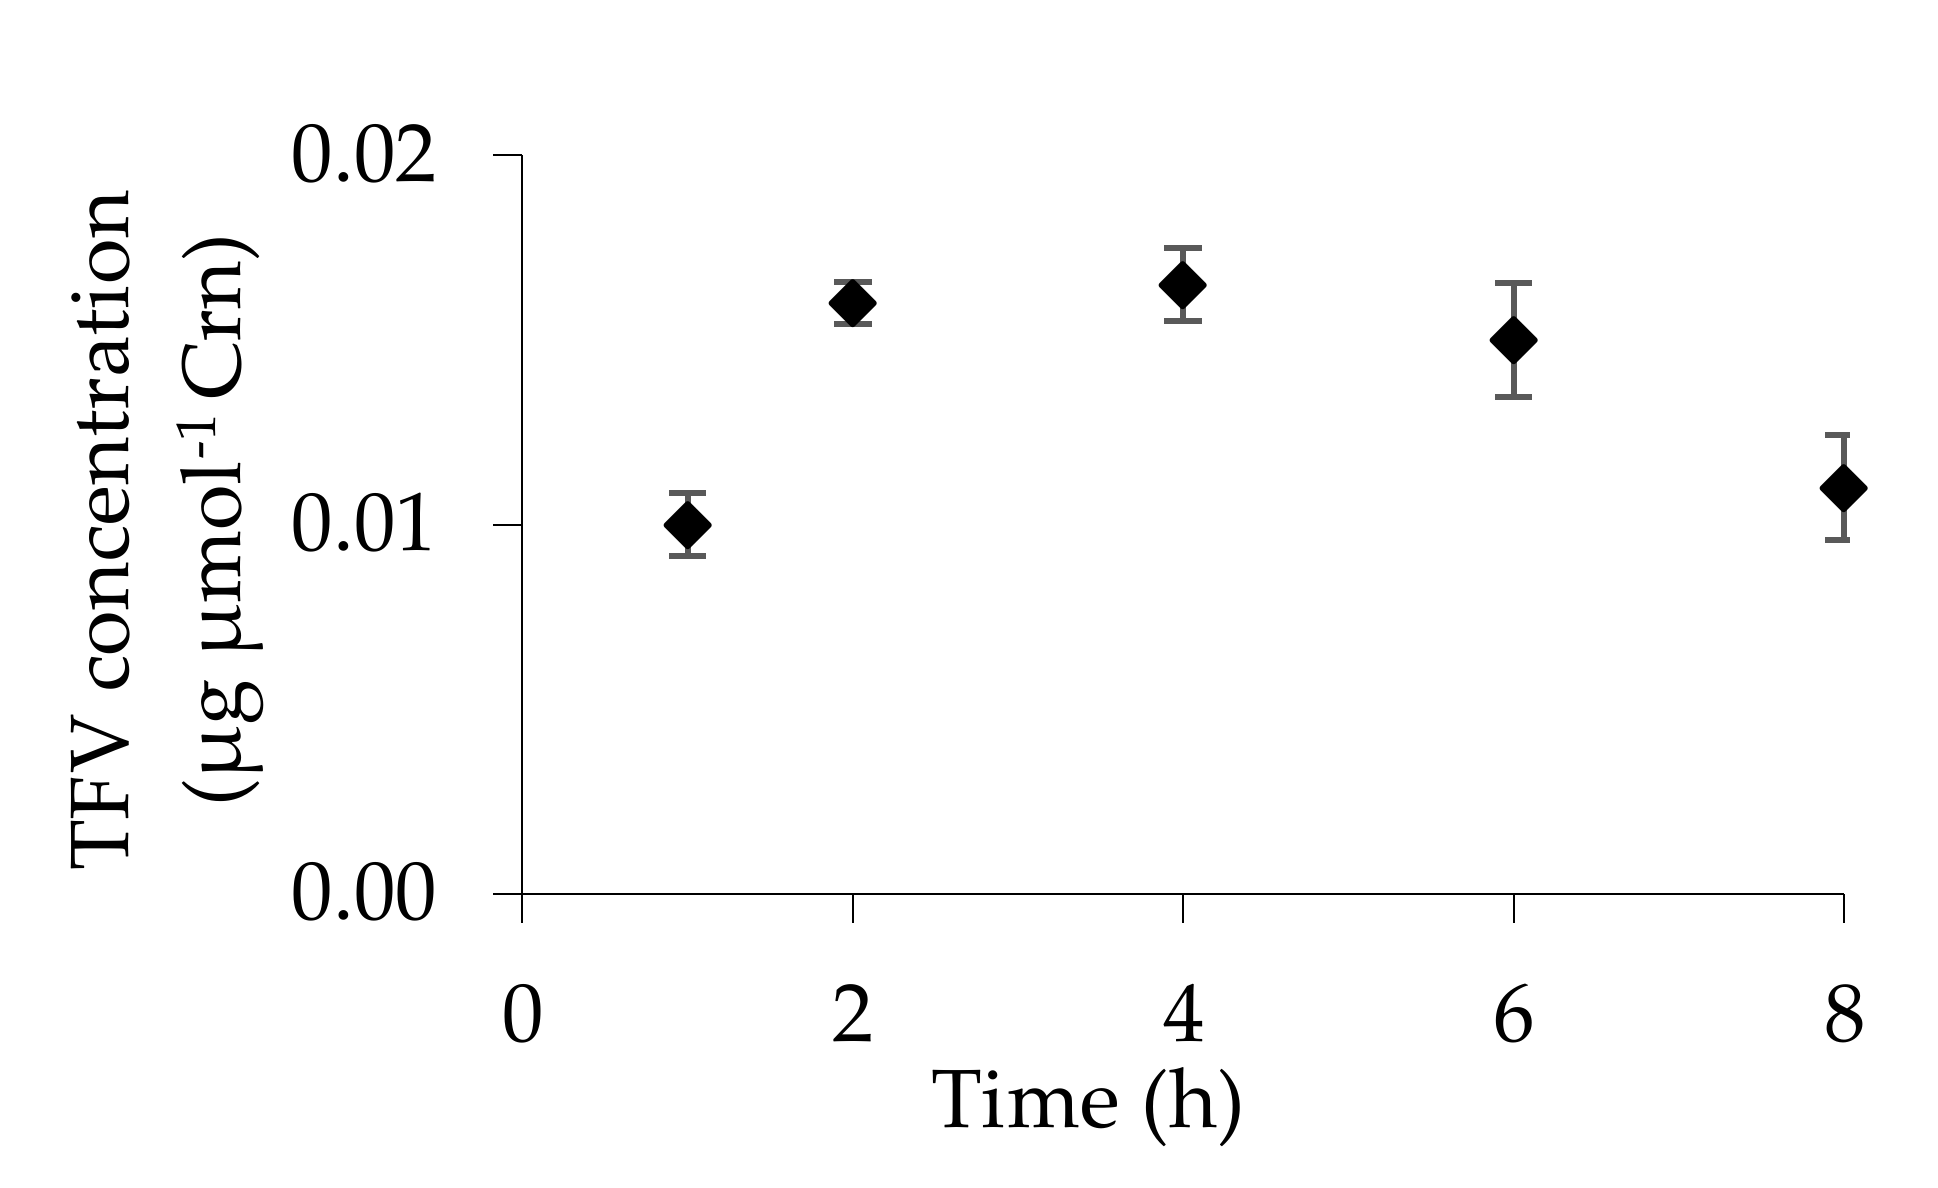
2.4. Urinary Excretion of TFV
2.5. Carry-Over Assay
3. Discussion
4. Materials and Methods
4.1. Chemicals
4.2. Instrumentation
4.3. Stock Solutions
4.4. Biological Matrices
4.4.1. Urine Sample Preparation
4.4.2. Plasma Sample Preparation
4.5. HPLC Conditions for the Determination of TFV and Crn
4.5.1. Urine Analysis
4.5.2. Plasma Analysis
5. Conclusions
Author Contributions
Funding
Acknowledgments
Conflicts of Interest
References
- Joint United Nations Programme on HIV/AIDS; UNAIDS: Geneva, Switzerland, 2018; Available online: https://www.unaids.org/sites/default/files/media_asset/unaids-data-2018_en.pdf (accessed on 8 July 2020).
- World Health Organization. Global Hepatitis Report; WHO: Geneva, Switzerland, 2017. Available online: https://apps.who.int/iris/bitstream/handle/10665/255016/9789241565455-eng.pdf;jsessionid=8A50620A8C4FF608C64807B9DC760DB6?sequence=1 (accessed on 8 July 2020).
- World Health Organization. Guidelines for the Prevention, Care and Treatment of Persons with Chronic Hepatitis B Infection; WHO: Geneva, Switzerland, 2015; ISBN 978-92-4-154905-9. Available online: https://www.who.int/hiv/pub/hepatitis/hepatitis-b-guidelines/en/ (accessed on 18 September 2020).
- World Health Organization. Scaling up Antiretroviral Therapy in Resource, Guidelines for a Public Health Approach; WHO: Geneva, Switzerland, 2002; ISBN 92-4-154570-4. Available online: https://www.who.int/hiv/pub/guidelines/pub18/en/ (accessed on 20 September 2020).
- World Health Organization. Guideline on when to Start Antiretroviral Therapy and on Pre-Exposure Prophylaxis for HIV; WHO: Geneva, Switzerland, 2015; ISBN 978-92-4-150956-5. Available online: https://www.who.int/hiv/pub/guidelines/earlyrelease-arv/en/ (accessed on 9 September 2020).
- Gallant, J.E.; Deresinski, S. Tenofovir disoproxil fumarate. Clin. Infect. Dis. 2003, 37, 944–950. [Google Scholar] [CrossRef]
- Kearney, B.P.; Flaherty, J.F.; Shah, J. Tenofovir disoproxil fumarate: Clinical pharmacology and pharmacokinetics. Clin. Pharmacokinet. 2004, 43, 595–612. [Google Scholar] [CrossRef]
- Yuen, M.F.; Lai, C.L. Treatment of chronic hepatitis B: Evolution over two decades. J. Gastroenterol. Hepatol. 2011, 26, 138–143. [Google Scholar] [CrossRef] [PubMed]
- Woodward, C.L.; Hall, A.M.; Williams, L.G.; Madge, S.; Copas, A.; Nair, D.; Edwards, S.G.; Johnson, M.A.; Connolly, J.O. Tenofovir-associated renal and bone toxicity. HIV Med. 2009, 10, 482–487. [Google Scholar] [CrossRef] [PubMed]
- Casado, J.L.; Del Rey, J.M.; Bañón, S.; Santiuste, C.; Rodriguez, M.; Moreno, A.; Perez-Elías, M.J.; Liaño, F.; Moreno, S. Changes in kidney function and in the rate of tubular dysfunction after tenofovir withdrawal or continuation in HIV-infected patients. JAIDS 2016, 72, 416–422. [Google Scholar] [CrossRef] [PubMed]
- Scherzer, R.; Estrella, M.; Li, Y.; Deeks, S.G.; Grunfeld, C.; Shlipak, M.G. Association of tenofovir exposure with kidney disease risk in HIV infection. AIDS 2012, 26, 867–875. [Google Scholar] [CrossRef] [PubMed] [Green Version]
- Ryom, L.; Mocroft, A.; Kirk, O.; Worm, S.W.; Kamara, D.A.; Reiss, P.; Ross, M.; Fux, C.A.; Morlat, P.; Moranne, O.; et al. Association Between Antiretroviral Exposure and Renal Impairment Among HIV-Positive Persons With Normal Baseline Renal Function: The D:A:D Study. J. Infect. Dis. 2013, 207, 1359–1369. [Google Scholar] [CrossRef] [PubMed]
- Labarga, P.; Barreiro, P.; Martin-Carbonero, L.; Rodriguez-Novoa, S.; Solera, C.; Medrano, J.; Rivas, P.; Albalater, M.; Blanco, F.; Moren, V. Kidney tubular abnormalities in the absence of impaired glomerular function in HIV patients treated with tenofovir. AIDS 2009, 23, 689–696. [Google Scholar] [CrossRef] [PubMed]
- Dauchy, F.A.; Lawson-Ayayi, S.; De La Faille, R.; Bonnet, F.; Rigothier, C.; Mehsen, N.; Miremont-Salam, G.; Cazanave, C.; Greib, C.; Dabis, F.; et al. Increased risk of abnormal proximal renal tubular function with HIV infection and antiretroviral therapy. Kidney Int. 2011, 80, 302–309. [Google Scholar] [CrossRef] [Green Version]
- Verhelst, D.; Monge, M.; Meynard, J.L.; Fouqueray, B.; Mougenot, B.; Girard, P.M. Fanconi syndrome and renal failure induced by tenofovir: A first case report. Am. J. Kidney Dis. 2002, 40, 1331–1333. [Google Scholar] [CrossRef]
- Hall, A.M.; Hendry, B.M.; Nitsch, D.; Connolly, J.O. Tenofovir-associated kidney toxicity in HIV-infected patients: A review of the evidence. Am. J. Kidney Dis. 2011, 57, 773–780. [Google Scholar] [CrossRef]
- Fontana, R.J. Side effects of long-term oral antiviral therapy for hepatitis B. Hepatology 2009, 49, 185–195. [Google Scholar] [CrossRef] [PubMed]
- Gracey, D.M.; Snelling, P.; McKenzie, P.; Strasser, S.I. Tenofovir-associated Fanconi syndrome in patients with chronic hepatitis B monoinfection. Antivir. Ther. 2013, 18, 945–948. [Google Scholar] [CrossRef] [PubMed] [Green Version]
- Viganò, M.; Brocchieri, A.; Spinetti, A.; Zaltron, S.; Mangia, G.; Facchetti, F.; Fugazza, A.; Castelli, F.; Colombo, M.; Lampertico, P. Tenofovir-induced Fanconi syndrome in chronic hepatitis B monoinfected patients that reverted after tenofovir withdrawal. J. Clin. Virol. 2014, 61, 600–603. [Google Scholar] [CrossRef] [PubMed]
- Cho, H.; Cho, Y.; Cho, E.J.; Lee, J.H.; Yu, S.J.; Oh, K.H.; Lee, K.; Mustika, S.; Yoon, J.H.; Kim, Y.J. Tenofovir-associated nephrotoxicity in patients with chronic hepatitis B: Two cases. Clin. Mol. Hepatol. 2016, 22, 286–291. [Google Scholar] [CrossRef] [PubMed]
- European Association For The Study Of The Liver EASL clinical practice guidelines: Management of chronic hepatitis B virus infection. J. Hepatol. 2012, 57, 167–185. [CrossRef] [Green Version]
- Perrone, R.D.; Madias, N.E.; Levey, A.S. Serum creatinine as an index of renal function: New insights into old concepts. Clin. Chem. 1992, 38, 1933–1953. [Google Scholar] [CrossRef]
- European Medicines Agency. Committee for Medicinal Products for Human Use, Guideline on Bioanalytical Method Validation. Available online: https://www.ema.europa.eu (accessed on 1 June 2020).
- FDA Guidance for Industry Bioanalytical Method Validation. Available online: https://www.fda.gov (accessed on 19 June 2020).
- Djerada, Z.; Feliu, C.; Tournois, C.; Vautier, D.; Binet, L.; Robinet, A.; Marty, H.; Gozalo, C.; Lamiable, D.; Millart, H. Validation of a fast method for quantitative analysis of elvitegravir, raltegravir, maraviroc, etravirine, tenofovir, boceprevir and 10 other antiretroviral agents in human plasma samples with a new UPLC-MS/MS technology. J. Pharmaceut. Biomed. 2013, 86, 100–111. [Google Scholar] [CrossRef] [PubMed]
- Delahunty, T.; Bushman, L.; Fletcher, C.V. Sensitive assay for determining plasma tenofovir concentrations by LC/MS/MS. J. Chromatogr. B 2006, 830, 6–12. [Google Scholar] [CrossRef]
- Jansen, R.S.; Rosing, H.; Kromdijk, W.; Heine, R.T.; Schellens, J.H.M.; Beijnen, J.H. Simultaneous quantification of emtricitabine and tenofovir nucleotides in peripheral blood mononuclear cells using weak anion-exchange liquid chromatography coupled with tandem mass spectroscopy. J. Chromatogr. B 2010, 878, 621–627. [Google Scholar] [CrossRef]
- Simiele, M.; Carcieri, C.; De Nicolò, A.; Ariaudo, A.; Sciandra, M.; Calcagno, A.; Bonora, S.; Perri, G.D.; D’Avolio, A. A LC-MS method to quantify tenofovir urinary concentrations in treated patients. J. Pharmaceut. Biomed. 2015, 114, 8–11. [Google Scholar] [CrossRef]
- De Nicolò, A.; Simiele, M.; Pensi, D.; Boglione, L.; Allegra, S.; Perri, G.D.; D’Avolio, A. UPLC-MS/MS method for the simultaneous quantification of anti-HBV nucleos(t)ides analogs: Entecavir, lamivudine, telbivudine and tenofovir in plasma of HBV infected patients. J. Pharmaceut. Biomed. 2015, 114, 127–132. [Google Scholar] [CrossRef]
- Gumustas, M.; Caglayan, M.G.; Onur, F.; Ozkan, S.A. Simultaneous determination and validation of emtricitabine, rilpivirine and tenofovir from biological samples using LC and CE methods. Biomed. Chromatogr. 2018, 32, e4158. [Google Scholar] [CrossRef]
- Shah, S.A.B.; Mullin, R.; Jones, G.; Shah, I.; Baker, J.; Petroczi, A.; Naughton, D.P. Simultaneous analysis of antiretroviral drugs abacavir and tenofovir in human hair by liquid chromatography-tandem mass spectrometry. J. Pharmaceut. Biomed. 2013, 74, 308–313. [Google Scholar] [CrossRef]
- Wu, Y.; Yang, J.; Duan, C.; Chu, L.; Chen, S.; Qiao, S.; Li, X.; Deng, H. Simultaneous determination of antiretroviral drugs in human hair with liquid chromatography-electrospray ionization-tandem mass spectrometry. J. Chromatogr. B 2018, 1083, 209–221. [Google Scholar] [CrossRef] [PubMed]
- Jullien, V.; Tréluyer, J.M.; Pons, G.; Rey, E. Determination of tenofovir in human plasma by high-performance liquid chromatography with spectrofluorimetric detection. J. Chromatogr. B 2003, 785, 377–381. [Google Scholar] [CrossRef]
- Sparidans, R.W.; Crommentruyn, K.M.L.; Schellens, J.H.M.; Beijnen, J.H. Liquid chromatographic assay for the antiviral nucleotide analogue tenofovir in plasma using derivatization with chloroacetaldehyde. J. Chromatogr. B 2003, 791, 227–233. [Google Scholar] [CrossRef]
- Rezk, N.L.; Crutchley, R.D.; Kashuba, A.D.M. Simultaneous quantification of emtricitabine and tenofovir in human plasma using high-performance liquid chromatography after solid phase extraction. J. Chromatogr. B 2005, 822, 201–208. [Google Scholar] [CrossRef]
- El Barkil, M.; Gagnieu, M.C.; Guitton, J. Relevance of a combined UV and single mass spectrometry detection for the determination of tenofovir in human plasma by HPLC in therapeutic drug monitoring. J. Chromatogr. B 2007, 854, 192–197. [Google Scholar] [CrossRef]
- Podany, A.T.; Sheldon, C.; Grafelman, D.; Ohnmacht, C.M. Assay development for determination of tenofovir in human plasma by solid phase analytical derivatization and LC–MS/MS. Bioanalysis 2015, 7, 3085–3095. [Google Scholar] [CrossRef]
- Yamada, E.; Takagi, R.; Sudo, K.; Kato, S. Determination of abacavir, tenofovir, darunavir, and raltegravir in human plasma and saliva using liquid chromatography coupled with tandem mass spectrometry. J. Pharmaceut. Biomed. 2015, 114, 390–397. [Google Scholar] [CrossRef]
- Ocque, A.J.; Hagler, C.E.; Morse, G.D.; Letendre, S.L.; Ma, Q. Development and validation of an LC–MS/MS assay for tenofovir and tenofovir alafenamide in human plasma and cerebrospinal fluid. J. Pharm. Biomed. Anal. 2018, 156, 163–169. [Google Scholar] [CrossRef]
- Wiriyakosol, N.; Puangpetch, A.; Manosuthi, W.; Tomongkon, S.; Sukasem, C.; Pinthong, D. A LC/MS/MS method for determination of tenofovir in human plasma and its application to toxicity monitoring. J Chromatogr. B 2018, 1085, 89–95. [Google Scholar] [CrossRef]
- Nóvoa, R.; Labarga, S.; D’Avolio, P.; Barreiro, A.; Albalate, P.; Vispo, M.; Solera, E.; Siccardi, C.; Bonora, M.; Di Perri, S.; et al. Impairment in kidney tubular function in patients receiving tenofovir is associated with higher tenofovir plasma concentrations. AIDS 2010, 24, 1064–1066. [Google Scholar] [CrossRef]
- Calcagno, A.; De Requena, G.; Simiele, M.; Avolio, A.D.; Nielson, M.; Tettoni, M.; Salassa, B.; Bramato, G. Tenofovir plasma concentration according to companion drugs: A cross-sectional study of HIV-positive patients with normal renal function. Antimicrob. Agents Chemother. 2013, 57, 1840–1843. [Google Scholar] [CrossRef] [Green Version]
- Phipps, K. LC-MS/MS Method for the Determination of Tenofovir from Plasma; Application Note No. 20687; Thermo Scientific: Waltham, MA, USA, 2013. [Google Scholar]
- Borowczyk, K.; Wyszczelska-Rokiel, M.; Kubalczyk, P.; Głowacki, R. Simultaneous determination of albumin and low-molecular-massthiols in plasma by HPLC with UV detection. J. Chromatogr. B 2015, 981–982, 57–64. [Google Scholar] [CrossRef]
- Alpert, A.J. Hydrophilic-interaction chromatography for the separation of peptides, nucleic acids and other polar compounds. J. Chromatogr. A 1990, 499, 177–196. [Google Scholar] [CrossRef]
- Hemström, P.; Irgum, K. Hydrophilic interaction chromatography. J. Sep. Sci. 2006, 29, 1784–1821. [Google Scholar] [CrossRef]
- Buszewski, B.; Noga, S. Hydrophilic interaction liquid chromatography (HILIC)—A powerful separation technique. Anal. Bioanal. Chem. 2012, 402, 231–247. [Google Scholar] [CrossRef] [Green Version]


| Analyte (n = 3) | Linear Ranges | Regression Equation | R2 | RSD (%) | Recovery (%) | ||
|---|---|---|---|---|---|---|---|
| Min | Max | Min | Max | ||||
| TFV (µg mL−1 urine) | 10.0–300.0 | y = 2.02x + 0.47 | 0.999 | 1.1 | 6.1 | 96.0 | 108.0 |
| TFV (µg mL−1 plasma) | 0.5–5.0 | y = 4.12x − 0.06 | 0.999 | 2.1 | 8.4 | 99.0 | 100.3 |
| Crn (µmol mL−1 urine) | 0.1–30.0 | y = 415.88x + 514.96 | 1.000 | 0.4 | 3.1 | 99.3 | 111.1 |
| Crn (µmol mL−1 plasma) | 0.001–0.04 | y = 1086.71x + 24.19 | 0.999 | 0.3 | 4.9 | 93.6 | 107.4 |
| Analyte | Concentrations | Precision (%) | Accuracy (%) | ||
|---|---|---|---|---|---|
| Intra-Day | Inter-Day | Intra-Day | Inter-Day | ||
| TFV (µg mL−1 urine) | 10 40 300 | 2.3 4.1 1.9 | 5.8 8.1 4.3 | 95.9 97.5 100.3 | 105.7 113.4 96.1 |
| TFV (µg mL−1 plasma) | 0.5 2 5 | 4.7 4.1 3.7 | 5.6 3.6 4.5 | 91.1 91.5 93.3 | 93.8 93.5 97.2 |
| Crn (µmol mL−1 urine) | 0.1 2.5 30 | 4.2 1.7 3.7 | 6.8 5.4 6.1 | 111.4 100.6 99.3 | 120.1 104.4 108.9 |
| Crn (µmol mL−1 plasma) | 0.001 0.01 0.04 | 1.9 0.6 0.5 | 4.0 5.1 1.4 | 91.3 100.9 100.7 | 102.8 99.6 99.3 |
| Parameters | LC-DAD * [30] | LC-MS * [28] | Proposed Method |
|---|---|---|---|
| Sample volume (mL) | 0.5 | 1.0 | 0.05 |
| Linear range (µg mL−1) | 1–100 | - | 10–300 |
| R2 | 0.999 | 0.999 | 0.999 |
| LOD (µg mL−1) | 0.14 | 0.19 | 4.0 |
| LOQ (µg mL−1) | 0.42 | 0.39 | 8.0 |
| Intra-day (RSD%) | 0.54 | 6.69 | 2.8 |
| Inter-day (RSD%) | 0.89 | 9.38 | 6.1 |
| Parameters | LC-DAD * [35] | LC-UV * [36] | Proposed Method |
|---|---|---|---|
| Sample volume (mL) | 0.1 | 1.00 | 0.05 |
| Linear range (µg mL−1) | 0.02–10.0 | 0.01–4.0 | 0.5–5 |
| R2 | 0.999 | - | 0.999 |
| LOD (µg mL−1) | 0.02 | 0.003 | 0.15 |
| LOQ (µg mL−1) | 0.06 | 0.01 | 0.5 |
| Intra-day (RSD%) | 3.8 | 5.9 | 3.7 |
| Inter-day (RSD%) | 4.6 | 8.6 | 5.6 |
Publisher’s Note: MDPI stays neutral with regard to jurisdictional claims in published maps and institutional affiliations. |
© 2020 by the authors. Licensee MDPI, Basel, Switzerland. This article is an open access article distributed under the terms and conditions of the Creative Commons Attribution (CC BY) license (http://creativecommons.org/licenses/by/4.0/).
Share and Cite
Olejarz, P.; Chwatko, G.; Kubalczyk, P.; Purgat, K.; Głowacki, R.; Borowczyk, K. Application of High-Performance Liquid Chromatography for Simultaneous Determination of Tenofovir and Creatinine in Human Urine and Plasma Samples. Pharmaceuticals 2020, 13, 367. https://0-doi-org.brum.beds.ac.uk/10.3390/ph13110367
Olejarz P, Chwatko G, Kubalczyk P, Purgat K, Głowacki R, Borowczyk K. Application of High-Performance Liquid Chromatography for Simultaneous Determination of Tenofovir and Creatinine in Human Urine and Plasma Samples. Pharmaceuticals. 2020; 13(11):367. https://0-doi-org.brum.beds.ac.uk/10.3390/ph13110367
Chicago/Turabian StyleOlejarz, Patrycja, Grażyna Chwatko, Paweł Kubalczyk, Krystian Purgat, Rafał Głowacki, and Kamila Borowczyk. 2020. "Application of High-Performance Liquid Chromatography for Simultaneous Determination of Tenofovir and Creatinine in Human Urine and Plasma Samples" Pharmaceuticals 13, no. 11: 367. https://0-doi-org.brum.beds.ac.uk/10.3390/ph13110367